RESULTS OF STEREO AND PROSPECT, AND STATUS OF STERILE NEUTRINO SEARCHES
Abstract
Reactor neutrinos have been an intense field of investigation for the last decade. Two anomalies are discussed in this document. First, a status of the sterile neutrino searches by Stereo, PROSPECT and DANSS is presented. The best-fit parameters of active-to-sterile oscillations from the Reactor Antineutrino Anomaly are strongly rejected by these experiments. Second, the analyses of the shape anomaly (”5 MeV bump”) by Stereo and PROSPECT, both using a virtually pure 235U neutrino flux, are detailed. Results show a significant excess of events at 5-6 MeV and indicate that the bump observed at commercial reactors is not specific to a particular isotope but rather shared among U and Pu.
1 Introduction
The Reactor Antineutrino Anomaly (RAA) [1] appeared in 2011, following a revision of the predicted neutrino fluxes for the main isotopes in nuclear fuel (235U, 238U, 239Pu, 241Pu) [2, 3]. The upward reevaluation of predicted fluxes resulted in a data-to-prediction deficit of about 5%. One hypothesis to explain this deficit consists in oscillations to a sterile neutrino state, since sterile neutrinos are not observable in detectors. The survival probability writes for km:
| (1) |
with the neutrino energy, the distance from source to detector, and the mixing angle and mass splitting in the 3-neutrino paradigm, and the parameters ruling the oscillation to the sterile state. Based on data available at the time, the RAA best-fit parameters are of the order of and . Notably, this mass splitting translates into an oscillation length from 2 to 10 meters (depending on the neutrino energy), which is the typical length on which oscillations would develop. Therefore, a new generation of neutrino detectors were designed to study such oscillations, combining two key requirements: (i) a distance from detector to reactor core of about 10 m, to be able to probe the RAA hypothesis; (ii) a segmented detector covering several baselines over m, so that oscillations could develop inside the detector and be seen by comparing spectra from the detector’s subparts. Experiments operating such detectors are, for instance, Stereo, PROSPECT and DANSS.
Another intriguing aspect of the reactor antineutrino spectrum is the excess of events observed by experiments running at commercial reactors (Daya Bay [4], RENO [5], Double Chooz [6]) around 5 MeV, so-called ”5 MeV bump”. In order to disentangle the contribution from the several isotopes present in low-enriched nuclear fuel, pure 235U measurements from research reactors are helpful. Stereo and PROSPECT have thus performed analyses of the spectrum shape, and have formed a joint collaboration to increase the sensitivity of their respective analyses.
2 Experimental context
2.1 Stereo, PROSPECT and DANSS experiments
Three experiments will be presented in this document: i) Stereo [7], operated near the High Flux Reactor at Institut Laue-Langevin in Grenoble, France; ii) PROSPECT [8], operated near the High Flux Isotope Reactor at the Oak Ridge National Laboratory, USA; iii) DANSS [9], operated below a commercial reactor core at the Kalininskaya nuclear power plant in Russia. Tab. 1 compares some important instrumental characteristics of these three experiments.
| Stereo | PROSPECT | DANSS | |
| Reactor power | 58 MWth | 85 MWth | 3 GWth |
| 235U enrichement | 93 % (HEU) | 93 % (HEU) | Low (LEU) |
| spectrum | from 235U | from 235U | Mixed isotopes |
| Core size | cm, cm | cm, cm | m, m |
| Detector structure | Segmented (6 cells) | Segmented | On a movable platform |
| Baselines | 9.4 to 11.2 m | 6.7 to 9.3 m | 10.9, 11.9 and 12.9 m |
| Detection principle | Gd-doped liq. scint. | 6Li-doped liq. scint. | Gd-coated plastic scint. |
| rate | 360 / day | 500 / day | 5 000 / day |
| S/B |
2.2 Analysis key points: Stereo as an illustration
Let us now illustrate some key aspects of the analysis using Stereo as an example. Reactor antineutrinos are detected through the inverse beta decay (IBD) reaction: . This produces two coincident signals in the detector: i) a prompt signal from the kinetic energy and annihilation, and ii) a delayed signal from the neutron capture on a Gd nucleus.
The prompt signal is related to the neutrino energy as MeV. An accurate energy reconstruction is crucial for the oscillation analysis since they develop as a function of , and for the spectral analysis as well. Most importantly the reconstructed energy has to be well reproduced in simulation: the quantity of interest is the energy scale, namely the data/MC ratio of reconstructed energies . The control of the energy scale is done in 3 steps. First, a set of calibration sources are deployed in each cell, at 5 different heights, and cover energies from 0.5 MeV to 8 MeV. Second, the -decay of cosmic-muon-induced 12B provides a continuous spectrum up to MeV. Finally, a joint fit of the data/MC residuals from sources and boron constrains the ratio to be in agreement with 1 within accuracy across all energies.
The delayed signal originates from the de-excitation cascade of the excited Gd nucleus after capture. The computation of the capture efficiency is of prime importance for the absolute measurement of the IBD rate which provides a measurement of the deficit with respect to the reference Huber-Mueller (HM) model [3, 2]. It is done with an AmBe source circulated in and around the detector, systematic uncertainties being evaluated with data/MC comparison. For this, the FIFRELIN software provides improved modelling of the de-excitation cascades [10], the result of which is made available to the community. In addition, correction factors acount for spatial data/MC discrepancies that could be related to neutron physics at the edges of the detector, or Gd non-uniformity. This careful evaluation allows Stereo to measure the rate deficit of the 235U spectrum as
| (2) |
which is the most accurate result for HEU experiments [11].
A final key point in the analysis comes from the reactor’s alternation of reactor-on and reactor-off periods. Cosmogenic background is measured in reactor-off periods and used as a model for such a background in the reactor-on collected data. Pulse Shape Discrimination then allows to keep a signal-to-background ratio of order 1, leading to the sterile neutrino search and the spectral analysis presented in Section 3 and 4. Note that the following results use only the first 2 phases of Stereo’s collected data, with a doubling of statistics yet to come.
3 Sterile neutrino searches
Stereo, PROSPECT and DANSS use different analysis methods, but all rely on the same principle: looking for oscillations by comparing spectra at different baselines (and not comparing the data to a model). Analyses can then be model-independent and provide more reliable results.
In order to do so, Stereo introduces free parameters in its minimization [12]:
| (3) |
with the measured neutrino rate in cell and energy bin , and the predicted rate as a function of the active-to-sterile oscillation parameters from Eq. 1 and nuisance parameters . Any bias in the initial model in energy bin would be absorbed by the in this bin: then, only cell-to-cell differences in the oscillated prediction remain relevant.
A similar method is pursued by PROSPECT [13]. Specifically, the are not free parameters anymore but are set to
| (4) |
using the ratio of the baseline-summed measured and predicted spectra.
Finally, the analysis of the DANSS collaboration uses the ratio of spectra between bottom ( m) and top ( m) positions [15]. The then writes
| (5) |
with and the observed and predicted ratios, and a normalization parameter to consider only differences in positron energy shapes.
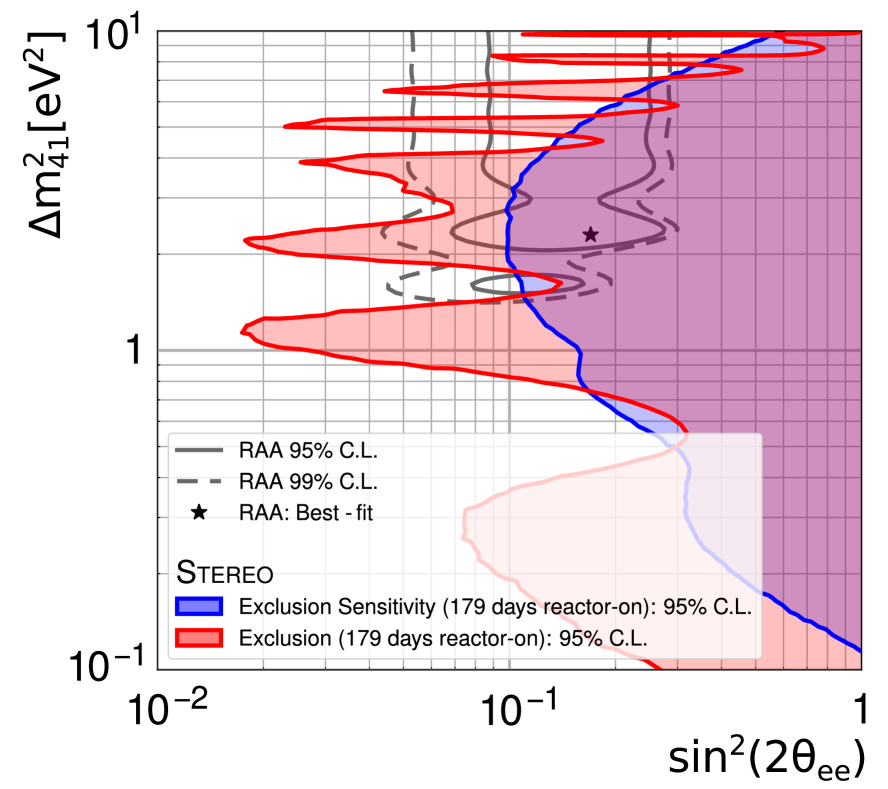
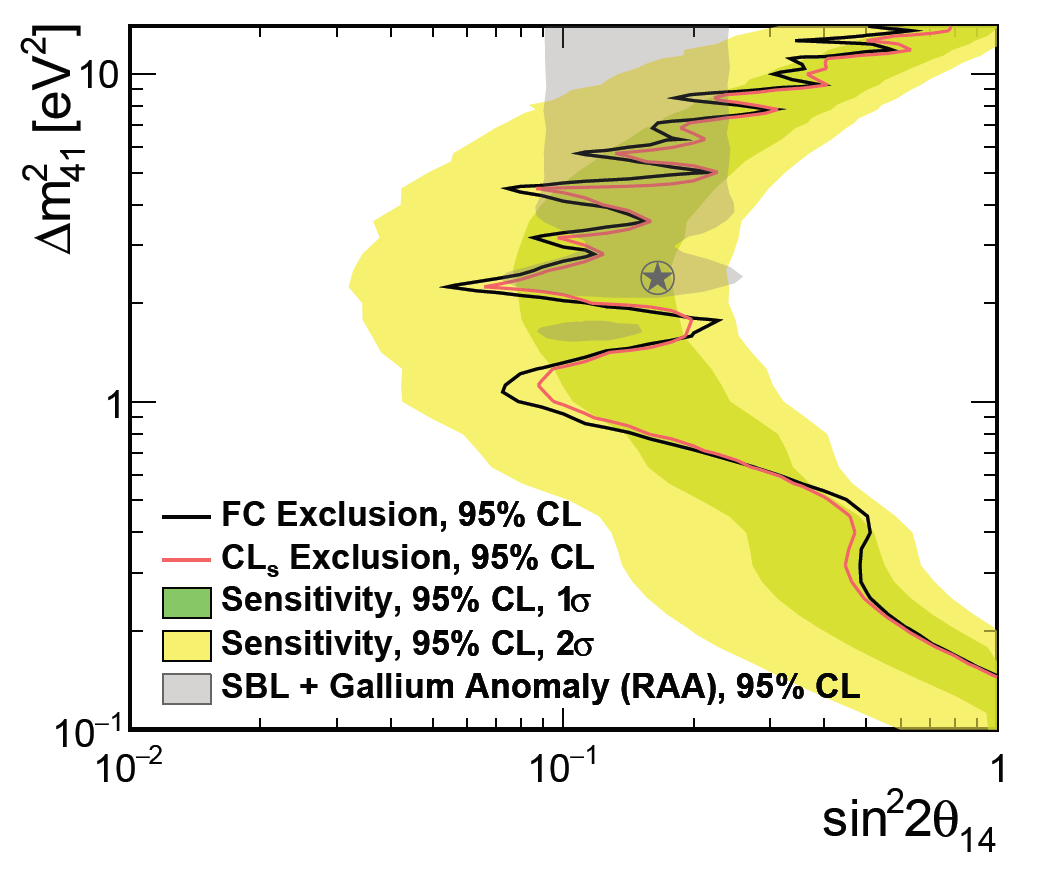
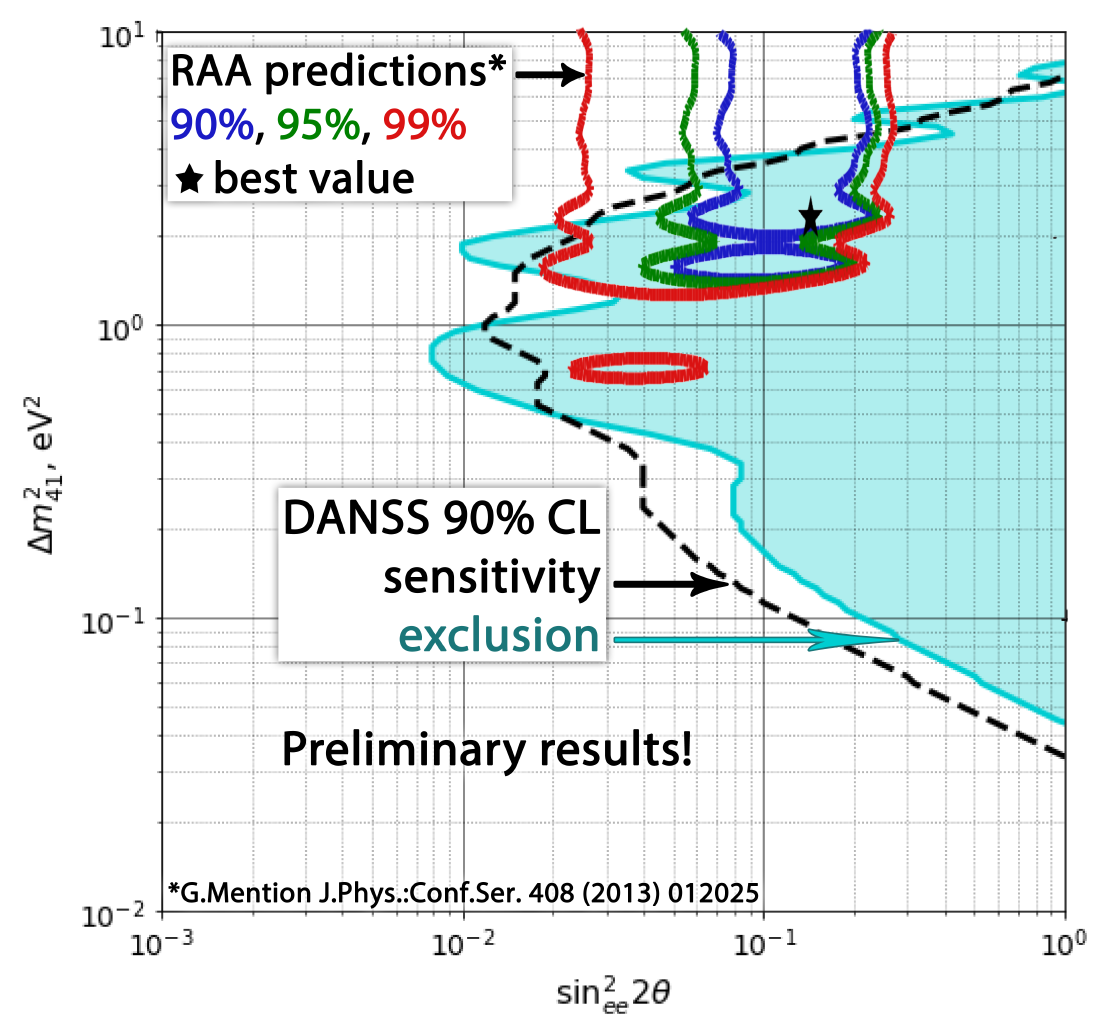
The exclusion contours from the 3 experiments are gathered in Figure 1, using either the CLs (PROSPECT, DANSS) or the usual method (Stereo, PROSPECT). Importantly for the latter, since does not follow a standard law with 2 d.o.f., the Feldman-Cousins procedure (buiding p.d.f.s via MC toys) is used. The best-fit point of the RAA is strongly excluded: at C.L. by Stereo, at C.L. by PROSPECT, and at by DANSS. A large portion of the RAA 95% C.L. region is excluded as well. The only remaining region of the parameter space still unrejected corresponds to where experiments at have little sensitivity.
In this region of high-frequency oscillations, only an averaged effect could be observable in detectors, and no cell-to-cell distortions are to be expected. Oscillations to a sterile state would only appear as a deficit to a certain model, and are thus beyond the model-independent searches discussed here. One would need, for instance, to add a model-dependent constraint on the normalization.
4 Spectral analysis
For the experiments at HEU reactors, the spectral analysis has been developped for two main purposes: i) to investigate the 235U contribution to the event excess around 5 MeV, and ii) to provide an experimental reference to the community, since the current prediction fails to reproduce the experimental data in this specific region. Therefore, the measured energy spectra have been unfolded and expressed as a function of the antineutrino energy.
4.1 Analysis of Stereo data
The unknown unfolded spectrum is parametrized by a set of parameters (one per bin ) and is folded into measured-energy space through the experimental response matrix . There, it is fitted against the measured spectrum , using one of the following two methods:
| (6) |
or
| (7) |
The first method uses the total covariance matrix in the computation, while systematic uncertainties are implemented using nuisance parameters in the second. As statistical noise is enhanced by unfolding processes, both uses a Tikhonov-like regularization term
| (8) |
to smooth the first derivative of the deviation between the unfolded spectrum and a prior shape (set to the shape of the HM model [3, 2]). The strength of this smoothing can be varied through the tunable parameter . In the first method, is set following the General Cross-Validation prescription [16]; in the second method, is empirically chosen to ensure that the choice of the prior shape has negligible impact on the unfolded spectrum [17]. The compatibility between the two methods has been validated on a pseudo-data set, and excellent agreement was found. Finally, biases have been studied on various toy models (including models with a bump) and show that the unfolding is well controlled, as biases remain across all the energy range.
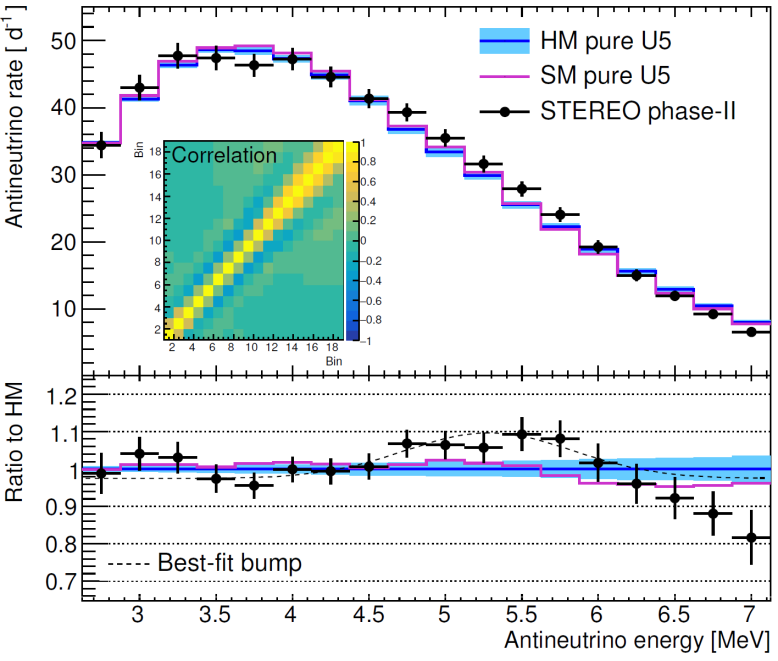
The unfolded spectrum is shown in Fig. 2. The agreement with the area-normalized HM model is (p-value: 0.084). When fitted by a gaussian, the excess of events around 5-5.5 MeV gives an amplitude of . The significance of the bump observation in a 235U spectrum by Stereo reaches thus 3.5. However, no preference can be inferred about the isotopic origin of the bump observed by Daya Bay [4] with commercial reactors. A bump shared among isotopes (resp. a pure-235U bump) would correspond to an amplitude of (resp. ) in Stereo data.
4.2 Analysis of PROSPECT data
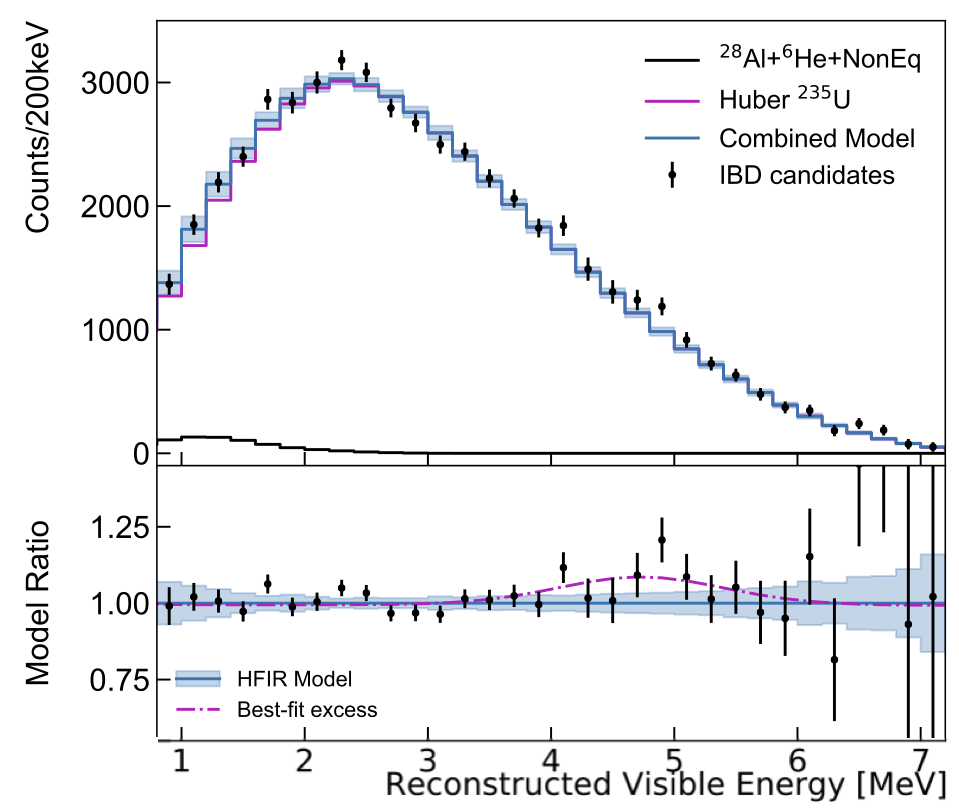
The investigation for the bump is done on the measured-energy spectrum by PROSPECT. The analysis focuses on the isotopic origin of the bump observed by Daya Bay [4]. A gaussian with mean 5.678 MeV and width 0.562 MeV (corresponding to Daya Bay’s observation) is folded through the response matrix, and its amplitude is fitted againt PROSPECT data [13].
PROSPECT spectrum and the best-fit excess are displayed on Fig. 3. The scale factor, ratio of PROSPECT’s to Daya Bay’s amplitudes, has a best-fit value of . It is consistent with 1, indicating that 235U does not play a specific role on the bump origin with respect to the other isotopes present in LEU neutrino spectra. The no-235U bump and all-235U bump hypotheses, corresponding to scale factors of 0 and 1.78 respectively, are both disfavoured at more than .
4.3 Joint analysis by Stereo and PROSPECT
As both Stereo and PROSPECT spectral analyses are statistically limited, both collaborations have worked together on a joint analysis to increase the physics reach of the experiments. Stereo’s unfolding methods have been extended to perform the joint unfolding of the data sets; for instance, the first method now writes
| (9) |
where PR and ST are used to refer to each experiment, and is a free-floating scaling parameter accounting for the different normalizations of the experiments.
Another unfolding framework has been developped within the PROSPECT collaboration, based on the Wiener-SVD method [19]. The unfolding is done by using the Singular Value Decomposition to invert the response matrix. A filter, optimized according to the signal-to-background ratio, is applied in this inversion process to mitigate the noise amplification due to small diagonal elements in the SVD decomposition.
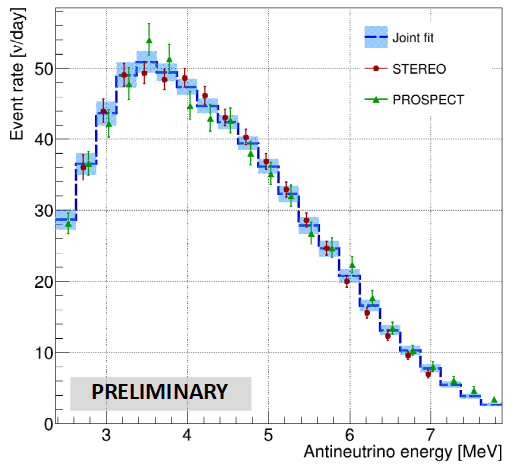
Stereo’s and PROSPECT’s unfolding methods have been compared on the single unfolding of Stereo or PROSPECT data, and show excellent agreement. Moreover, a test between the spectra from the two experiments (unfolded with the method of Eqn. 9) gives (p-value: 0.17). Since the two experiments are statistically compatible, it is fully relevant to attempt a joint fit combining both of them. A preliminary spectrum from the joint unfolding of Stereo and PROSPECT data is shown in Fig. 4. As suggested in Ref. [19], a filter matrix encoding all unfolding biases will be provided with the unfolded spectrum in the forthcoming publication.
This 235U spectrum extracted by Stereo and PROSPECT, from HEU reactor cores, is complementary to results from LEU experiments. While commercial reactors provide more intense neutrino fluxes, our analysis is completely independent on flux models related to other main fuel isotopes. In the near future, one could even imagine to use this 235U spectrum as an external constraint in analyses aiming to separate U and Pu contributions in LEU spectra [20].
5 Summary
Since the emergence of the RAA, an intense experimental effort has developped around very-short-baseline reactor neutrino detectors, in order to search for active-to-sterile oscillations. A decade later, the best-fit parameters and a large portion of the allowed region in parameter space are ruled out by Stereo, PROSPECT or DANSS. With these segmented detectors, model-independent analyses have been performed by comparing the antineutrino spectra from several baselines, and no sign of oscillations have been found.
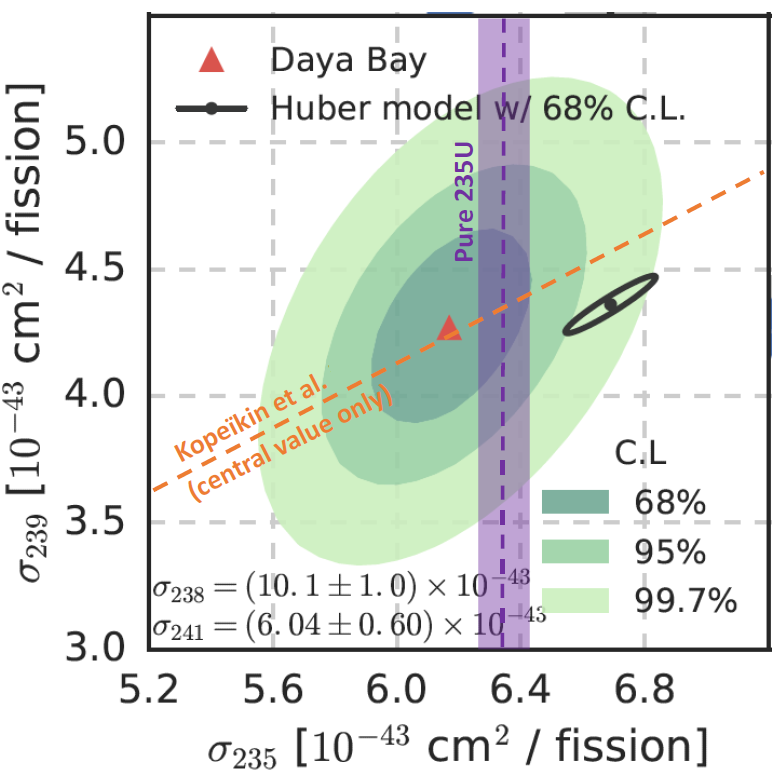
Another explanation is then required to understand the data-to-prediction deficit of about 5%, which first suggested the hypothesis of a sterile neutrino. The contributions of 235U and 239Pu to this deficit have been separated by the Daya Bay collaboration [21] and favor that the deficit is mostly carried by 235U. The 235U deficit is measured at . The measurement by Stereo on a pure 235U flux yields a compatible deficit of , with a pure-235U world-average now at [11]. Finally, a recent repetition by Kopeikin et al. of the measurement of 235U and 239Pu spectra, used as inputs for the Huber-Mueller model, indicates that the ratio of 235U/239Pu fluxes may have been overestimated by 5.4% [22]. The global picture is illustrated in Fig. 5: it suggests that the 239Pu normalization may be correct, and the 235U normalization overestimated in the HM model by 5-6%.
Concerning the shape anomaly, the complementarity of HEU and LEU experiments is once again an asset for the community. First revealed by reactor neutrinos experiments at commercial reactors, the ”5 MeV bump” has been studied by Stereo and PROSPECT on pure-235U fluxes. Combining all analyses, there is a small preference for a bump equally shared by 235U and 239Pu. As the modelling of these neutrino fluxes has proven to be a difficult task, Stereo and PROSPECT provide a experimental reference for the 235U spectrum. Thanks to well controlled unfolding methods, it is expressed in antineutrino energy.
Finally, let us note that the accuracy on all these observables will increase as more data is currently taken and/or analyzed by Stereo, PROSPECT and DANSS.
References
References
- [1] G. Mention et al, Phys. Rev. D 83, 073006 (2011).
- [2] Th.A. Mueller et al, Phys. Rev. C 83, 054615 (2011).
- [3] P. Huber, Phys. Rev. C 84, 024617 (2011).
- [4] F.P. An et al, Chin. Phys. C 41, 013002 (2017).
- [5] Z. Atif et al, arXiv:2010.14989 (2020).
- [6] H. de Kerret et al, Nature Physics 16, 558-564 (2020).
- [7] N. Allemandou et al, JINST 13, P07009 (2018).
- [8] J. Ashenfelter et al, Nucl. Instrum. Methods A 922, 287-309 (2019).
- [9] I. Alekseev et al, JINST 11, P11011 (2016).
- [10] H. Almazán et al, Eur. Phys. J. A 55, 183 (2019).
- [11] H. Almazán et al, Phys. Rev. Lett. 125, 201801 (2020).
- [12] H. Almazán et al, Phys. Rev. D 102, 052002 (2020).
- [13] M. Andriamirado et al, Phys. Rev. D 103, 032001 (2021).
- [14] M. Danilov, arXiv : 2012.10255 (2020).
- [15] N. Skrobova, J. Phys. Conf. Ser. 1390, 012072 (2019).
- [16] G.H. Golub, M. Heath and G Wahba, Technometrics 21:2, 215-223 (1979).
- [17] H. Almazán et al, J. Phys. G: Nucl. Part. Phys. 48, 075107 (2021).
- [18] M. Estienne et al, Phys. Rev. Lett. 123, 022502 (2019).
- [19] W. Tang et al, JINST 12, P10002 (2017).
- [20] F.P. An et al, arXiv : 2102.04614 (2021).
- [21] F.P. An et al, Phys. Rev. Lett. 118, 251801 (2017).
- [22] V. Kopeikin, M. Skorokhvatov and O. Titov, arXiv : 2103.01684 (2021).