-wave Superconductivity in the Dirac Line-nodal Material CaSb2
Abstract
We performed 121/123Sb-nuclear quadrupole resonance (NQR) measurements on the superconducting (SC) line-nodal material CaSb2 in order to investigate electronic properties in the normal and SC states from a microscopic point of view. In the normal state, the nuclear spin-lattice relaxation rate for the Sb(1) site, which is responsible for the line-nodal parts, is approximately proportional to temperature, indicating the conventional Fermi liquid state. From comparison with band structure calculations, it is considered that the NQR properties related to the line-nodal character are hidden because the conventional behavior originating from Fermi-surface parts away from the nodes is dominant. In the SC state, a clear coherence peak just below the transition temperature and an exponential decrease at lower temperatures were observed in . These results strongly suggest that conventional -wave superconductivity with a full gap is realized in CaSb2.
Topology is one of the key concepts in recent condensed matter physics. Stimulated by the discovery of topological insulators,[1, 2] a large number of studies on topological quantum phenomena have been carried out due to fundamental research interest as well as to explore their applications. The concept of topology has also been introduced to superconductivity.[3]-[5] The Majorana zero mode is considered to be important for applications in error-free quantum computing.[6]
Topological semimetals are distinct types of topological materials. Dirac and Weyl semimetals are characterized by point nodes in bulk electronic bands.[7] Weyl semimetals are realized in systems without spatial-inversion or time-reversal symmetry. Fascinating phenomena such as ultra-high mobility, surface Fermi arc,[8] and chiral magnetic effect[9] are expected to occur in these materials.
Recently, a new type of topological semimetal, namely, line-nodal semimetals, has been discovered.[10] In these materials, increase in the nodal dimension leads to notably rich phenomena. For example, long-range Coulomb interaction,[11] a large surface-polarization charge,[12] quasitopological electromagnetic responses,[13] and drumhead surface states[14] are predicted. Regarding superconductivity, topological crystalline superconductivity and second-order topological superconductivity are expected in nodal-loop materials.[15] Many materials are predicted to be line-nodal semimetals without spin-orbit coupling (SOC).[16, 17] However, their nodes usually become gapped under SOC, resulting in topological insulators or point-nodal semimetals. To preserve line nodes, an additional symmetry, such as non-symmorphic symmetries is required.[18, 19] Therefore, line-nodal materials with non-symmorphic symmetry provide ideal platforms for studying novel topological phenomena and unconventional superconductivity.[20]
Here, we introduce CaSb2, crystallizing in the monoclinic structure with a non-symmorphic space group (, No.11, ) as shown in Fig. 1(a). From a band structure calculation,[22] it is predicted that CaSb2 has Dirac line-nodes in its bulk bands protected by the combination of screw and mirror symmetries, even with SOC. A large magnetoresistance was reported,[22] which may be the signature of topological materials.[23] In addition, some of the present authors discovered superconductivity in this compound, which has the transition temperature of K.[24] There are several line-nodal materials which exhibit superconductivity,[25] but little information on superconducting (SC) symmetry is available. Therefore, electronic properties of this compound in the SC as well as normal states deserves further investigation.
Nuclear magnetic resonance (NMR) and nuclear quadrupole resonance (NQR) are microscopic measurements used to probe the electronic state at the nuclear site through the hyperfine coupling between the nuclear spin and the surrounding electrons. In the case of conventional metals or semimetals, the nuclear spin-lattice relaxation rate 1/ is related to the quasi particle density of states (DOS) near the Fermi energy , and thus, its temperature dependence can reflect the nodal structure near . Moreover, anomalous orbital contributions to the hyperfine coupling modified by the linear band dispersion were predicted for Dirac and Weyl fermions.[26, 27] In particular, NQR is suitable for investigating superconductors because it can be performed without an external magnetic field. For these reasons, NQR has been playing an important role in the study of topological materials and superconductors.
In this paper, we report the results of 121/123Sb-NQR measurements that reveal properties of the normal and SC states of CaSb2. This compound has two distinct Sb sites, both forming zigzag chains along the -axis. We succeeded in observing the NQR signals of the Sb(1) site, whose electrons mainly form the two-dimensional topological Fermi surfaces involving the Dirac line nodes. In the normal state, 1/ is almost -independent. This indicates that CaSb2 behaves as a conventional metal above . In the SC state, 1/ shows a clear coherence peak just below and an exponential decrease at lower temperatures. These results strongly suggest -wave superconductivity with a full gap.
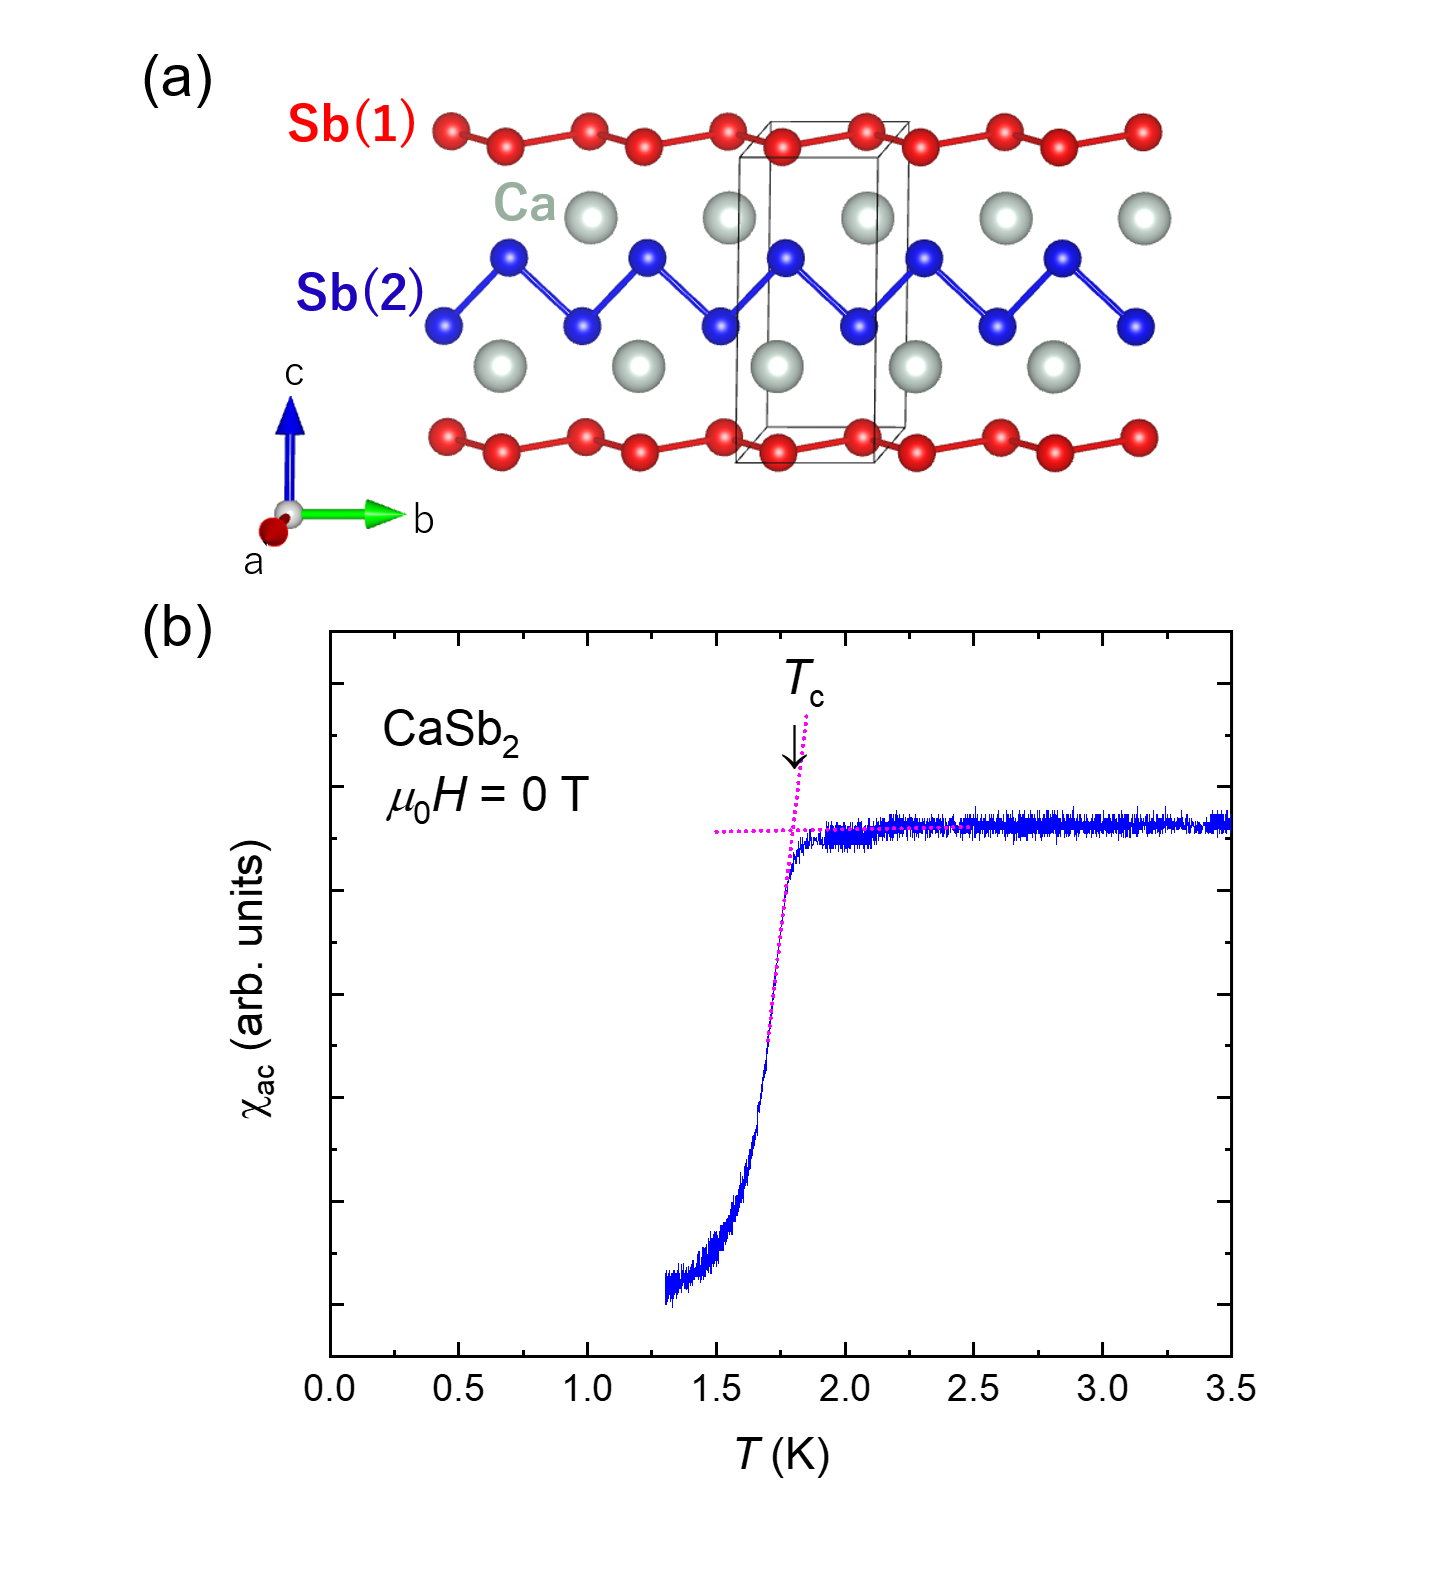
We used polycrystalline samples synthesized by a solid-state reaction reported previously.[24] The samples were powdered, packed in a plastic straw, and losely capped with epoxy. This is to make the sufficiently large surface area to enhance the intensity of NQR signals as well as to avoid excessive Joule-heating by radio frequency pulses. Based on an AC susceptibility measurement using the NQR tank circuit, the onset was evaluated to be 1.8 K, as shown in Fig. 1(b), which is consistent with the previous report.[24] CaSb2 contains NQR-active elements 121Sb and 123Sb; Table I lists the values of their nuclear spin , nuclear gyromagnetic ratio , nuclear quadrupole moment divided by elementary charge , and natural abundance (N. A.). A standard spin-echo technique was used for the NQR measurements. The value of was obtained by measuring the time dependence of the spin-echo intensity after saturation of the nuclear magnetization. A 3He-4He dilution refrigerator was used for the measurement down to 0.3 K.
We calculated the electronic band structure and NQR parameters of CaSb2 using the full-potential linearized augmented plane wave plus local orbitals method implemented in the WIEN2k package.[28, 29]. We adopted the Perdew-Burke-Ernzerhof generalized gradient approximation[30] as the exchange-correlation functional. We also included the effect of SOC. The calculation was performed based on an experimental crystal structure[31] and with a -mesh of .
| (MHz/T) | ( m2) | N. A. () | ||
|---|---|---|---|---|
| 121Sb | 5/2 | 10.189 | 57.3 | |
| 123Sb | 7/2 | 5.5175 | 42.7 |
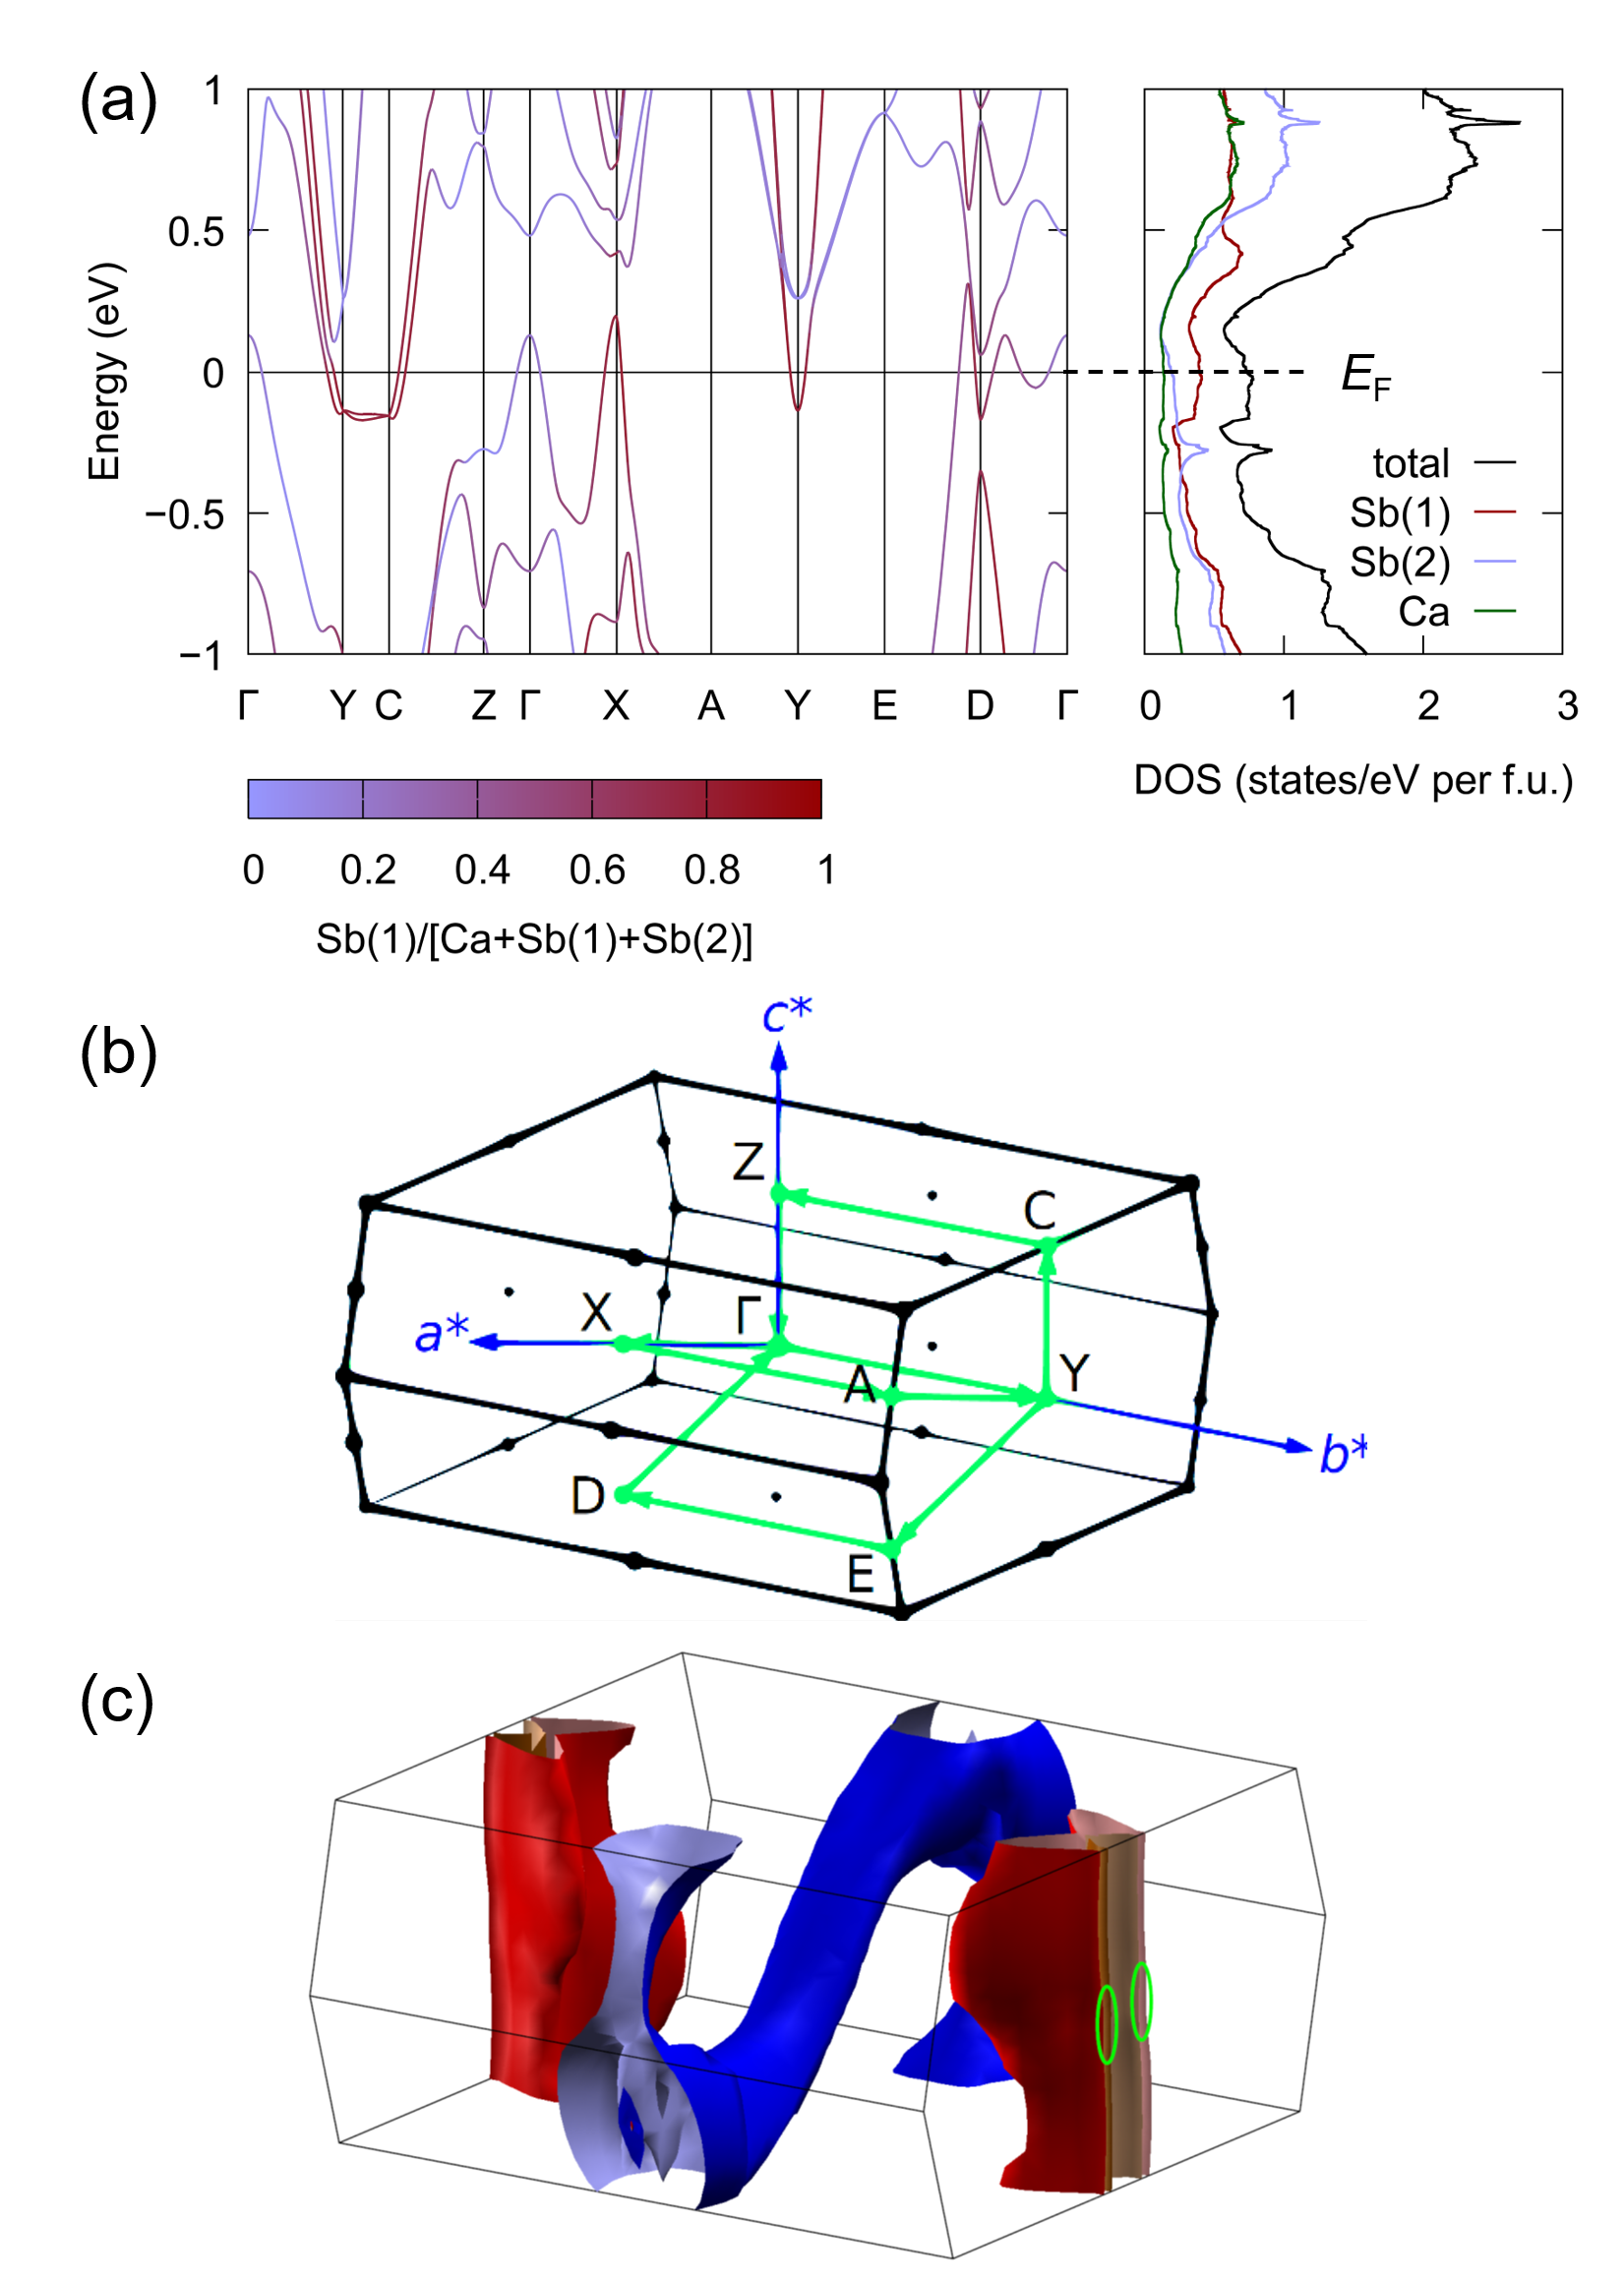
We show the electronic band structure and DOS in Fig. 2(a). The color in the band structure indicates the extent of the contribution from each Sb site. As we explained earlier, the band calculation with SOC suggested that CaSb2 has Dirac line nodes on the surfaces (at ) of the Brillouin zone (BZ), which is shown in Fig. 2(b). Here, we took the axis as the axis, which is different from the notation used in Ref. 22 (the axis is along the axis). Along the YC line, there are two bands below in Fig. 2(a), but along the YA and YE lines we can see only one line. This means that two bands are almost degenerate along these lines in the momentum space due to the line nodes located very close to these lines. Importantly, these nodal lines cross . The corresponding Fermi surfaces which mainly originate from the Sb(1) site are shown in red in Fig. 2(c). They are coaxial, two deformed cylinders and touch each other at points in the region indicated by the green ovals in Fig. 2(c). The topological line nodes cross at these points. The precise locations of those line nodes are given in Ref. 22. It should be noted that another Fermi surface not related to the line nodes also exists (blue).
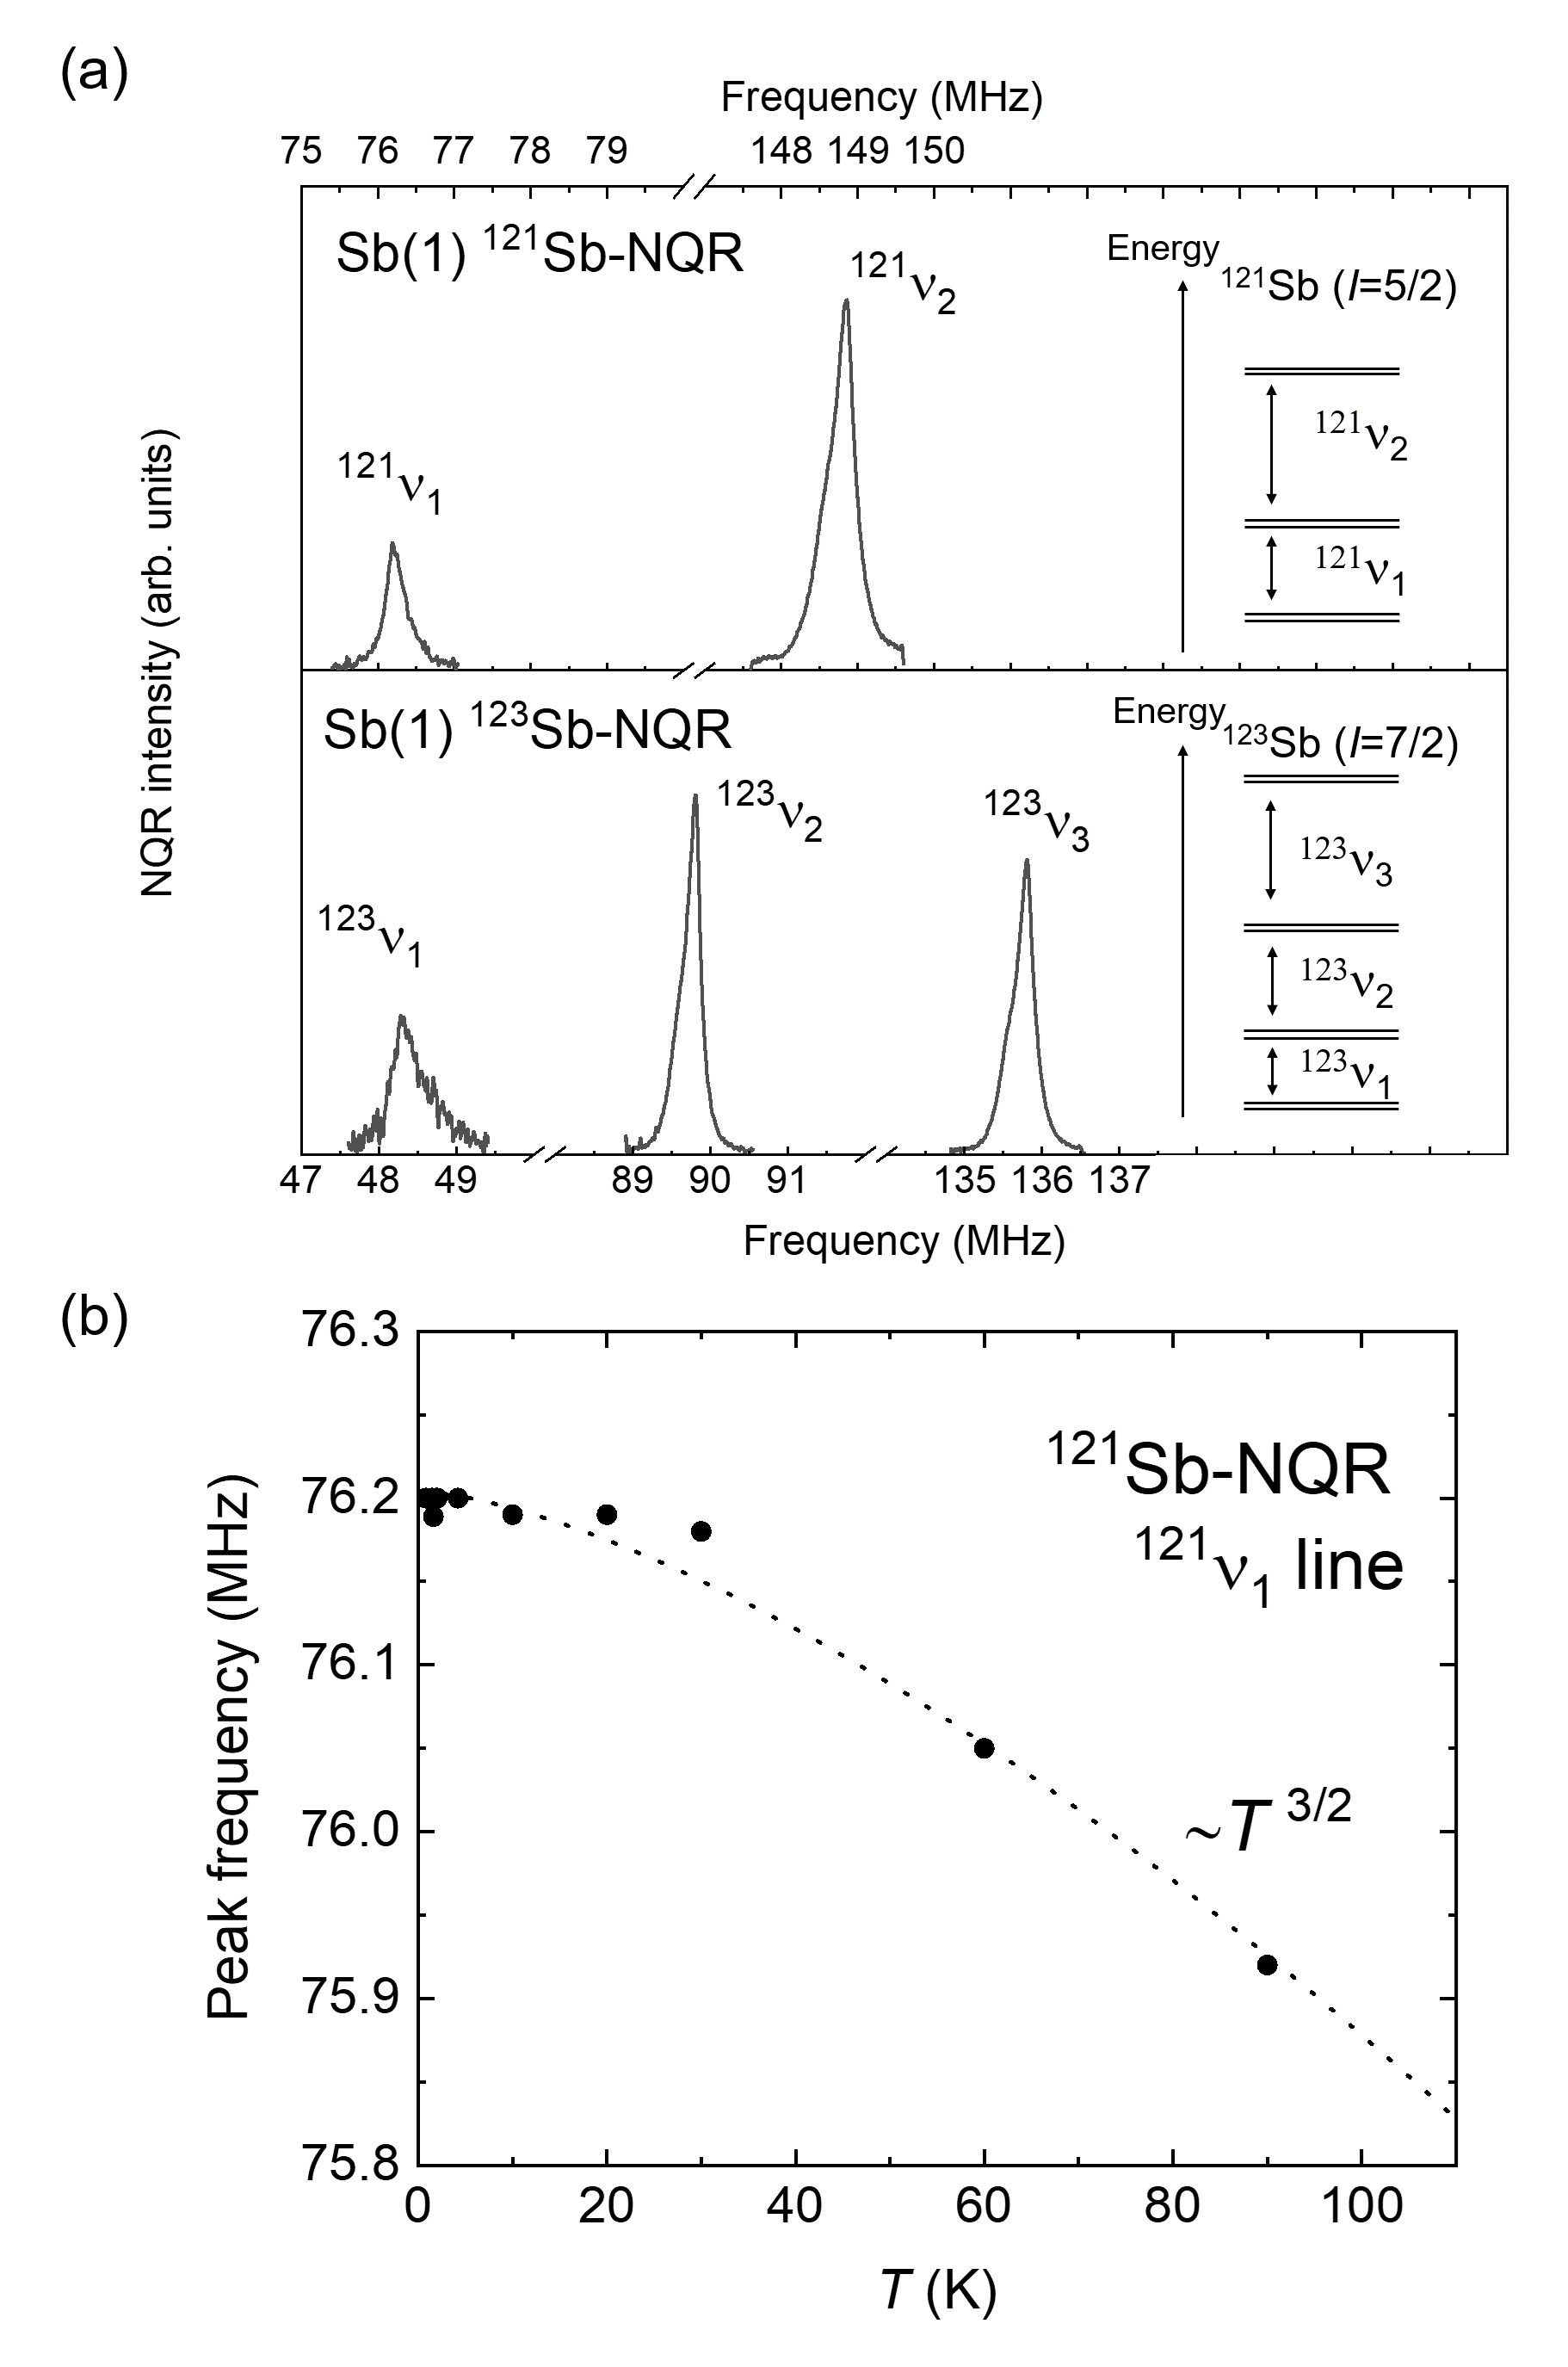
Figure 3(a) shows the 121/123Sb-NQR spectra at the Sb(1) site in the normal state. The spectrum of 123Sb line corresponding to the transition was measured at 3 K and the other spectra were measured at 4.2 K. The nuclear quadrupolar Hamiltonian is described as
| (1) |
where is Plank’s constant, is the NQR coupling constant, is the asymmetric parameter, and is the electric field gradient (EFG) along the -axis (. The axis is defined as the principal axis of the EFG tensor with the largest eigenvalue. As shown in the inset of Fig. 3(a), the nuclear spin levels split into three and four levels by for the and nuclei, respectively. From the observed peaks, and values are evaluated to be 74.7 MHz and 0.135 for 121Sb and 45.35 MHz and 0.135 for 123Sb, respectively. These values are consistent with the band structure calculations performed using WIEN2k, which generate the values of and for 121Sb(1) as 80.03 MHz and 0.131, and those for 123Sb(1) as 48.57 MHz and 0.131. Note that the calculated values of and for 121Sb(2) are 103.31 MHz and 0.210, and those for 123Sb(2) are 62.70 MHz and 0.210, which indicates that the signals of the Sb(2) site are well separated from those of the Sb(1) site. We tried to observe the Sb(2) NQR spectra by frequency sweeping over several tens MHz centered at the calculated frequencies, but could not observe them. This seems due to the broadening of the NQR spectrum ascribed to the larger value of . In fact, the observed NMR peak positions under the magnetic fields are consistent with the WIN2K calculations; the peaks for Sb(2) are much broader than those for Sb(1). Each peak of the Sb(1) NQR spectrum has an asymmetric shape, which can be attributed to the distribution of . This is because the shoulder in the line is located on the right of the main peak while those in and are on the left. If had a distribution, each spectrum would have a similar shape with the shoulder always on the same side, and this is not the case. We actually confirmed that the observed NQR spectra were reproduced from by assuming a distribution in of approximately 10.
Figure 3(b) shows the dependence of the peak frequency of the 121Sb line. It roughly follows a behavior, which is a typical behavior in metallic compounds and mainly arises from the dependence of the lattice constants or lattice vibration.[32]
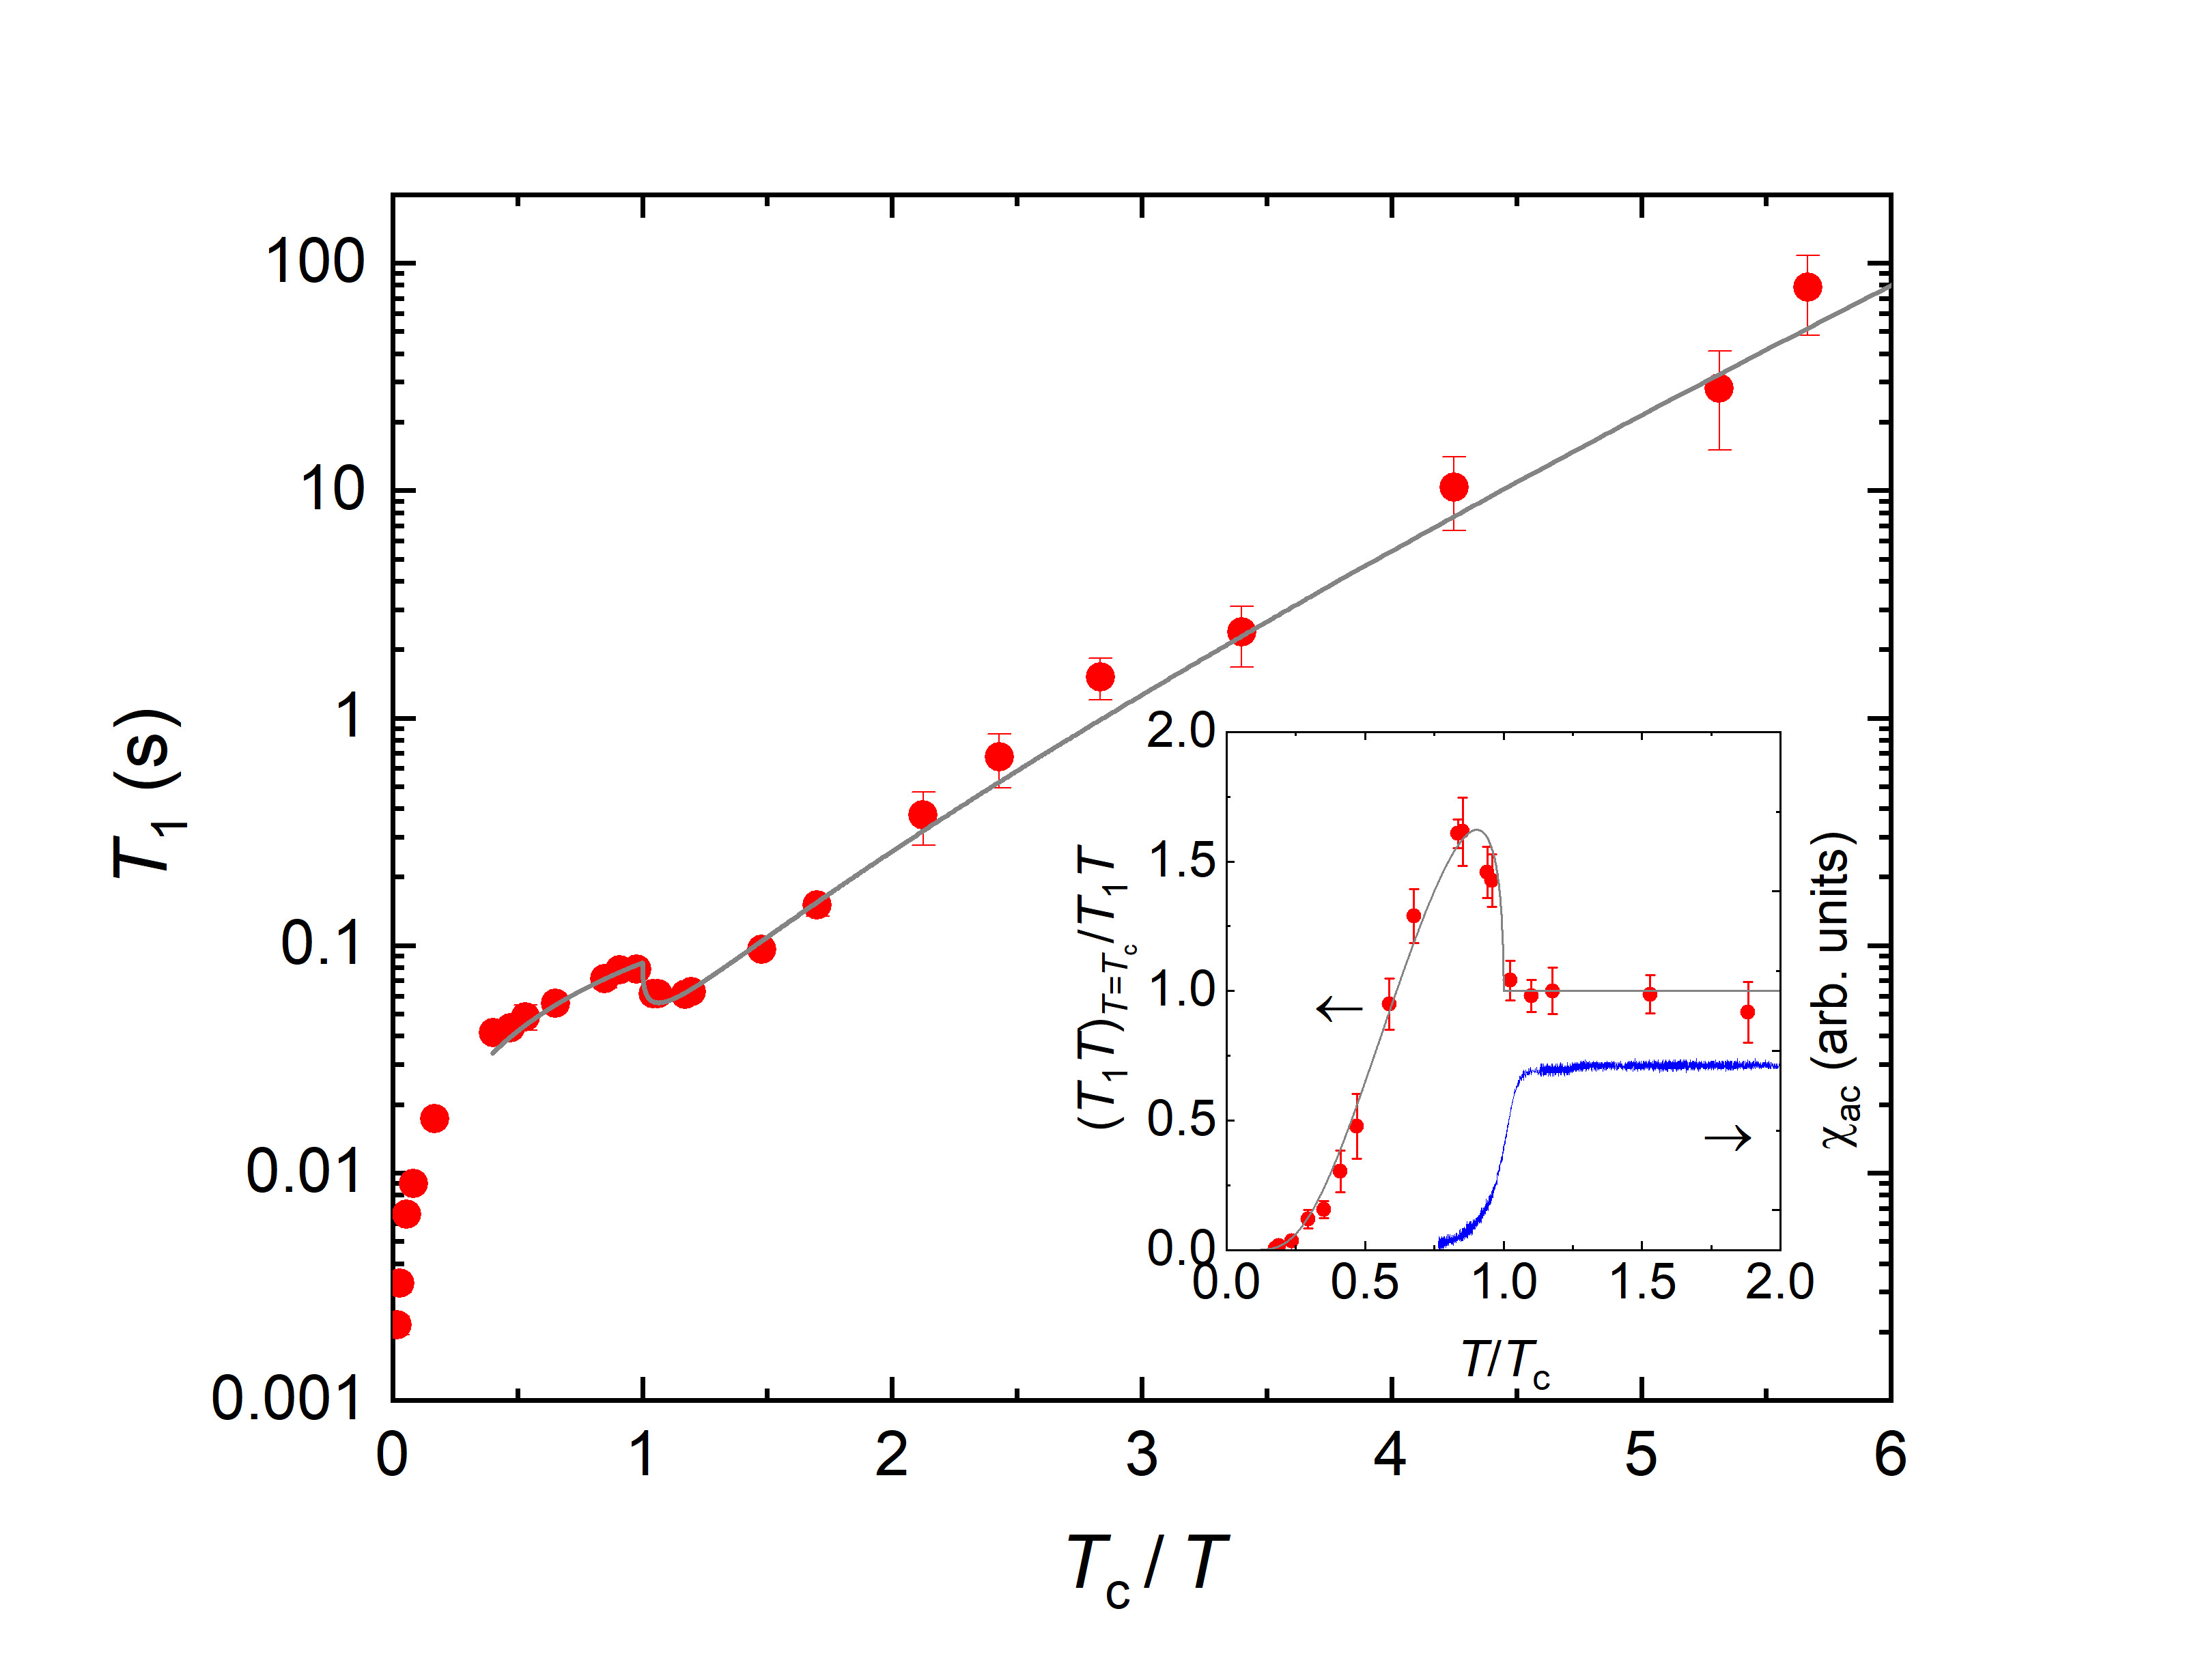
To investigate low-energy spin excitation in the normal and SC states, we measured . Figure 4 shows the dependence of 1/ measured at the peak frequencies of the 121Sb and spectra. We also measured of 123Sb at 4.2 K to determine the relaxation process. The obtained value of is 3.15, which is close to the square of the gyromagnetic ratio of the two isotopes . On the other hand, it is far from ,[33] which is the value expected when the electronic quadrupole relaxation process is dominant. This result indicates that is governed by the magnetic interaction through hyperfine coupling. Above , roughly follows the Korringa law (proportional to ), which is a typical behavior of a conventional normal metal. Note that gradually increases below 100 K as shown in the inset of Fig. 4. This would be due to the weak correlation among the electrons. Since it has been reported that the nodal-line properties appear in the form of power law dependence on with a logarithmic factor of ,[34] the Korringa-like behavior indicates that the nodal-line properties expected from the degeneracy of two bands are masked by the contribution from Fermi-surface portions away from nodes. In fact, the value of is approximately 6 (sK)-1, which is several orders of magnitude larger than those of the systems in which nodal properties are observed by NMR/NQR measurements.[35, 36] The large value of reflects the contribution from ordinary electrons, which is consistent with the band structure calculation presented in Fig. 2.
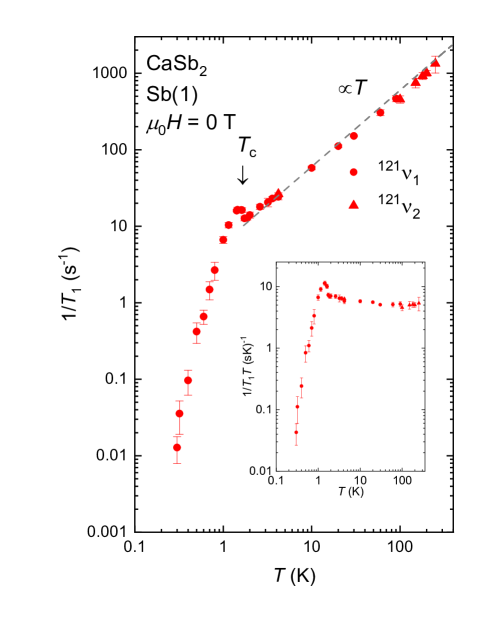
In the SC state, 1/ shows a clear coherence peak just below K. The maximum value of is 1.6 times as large as just above . Such a large coherence peak cannot be explained unless conventional -wave pairing with a full gap is realized.[37] Correspondingly, decreases exponentially at lower temperatures. This exponential behavior can be directly shown in the Arrhenius plot of against in Fig. 5.
To evaluate the magnitude of the SC gap from the dependence of , a numerical calculation based on the BCS theory was performed. 1/ in the SC state (1/) normalized by that in the normal state (1/) is expressed as
| (2) |
where is the quasi particle DOS in the SC state, is the dependent energy gap, and is the Fermi distribution function. The factor is related to the coherence effect in the SC state. Following a previous study,[38] we considered the energy broadening in by taking the convolution of with a rectangular broadening function whose width and height are and , respectively.[38] Using and , the experimental data were well reproduced as shown in the main panel and the inset of Fig. 5. The value used in the calculation is close to the value expected from the weak-coupling -wave BCS theory (1.76). This agreement, as well as the clear coherence peak and the exponential decrease, strongly indicate that conventional full-gap superconductivity is realized in CaSb2.
We here compare our results with other experiments. As previously reported,[24] the specific heat shows a broad peak, which indicates the distribution of within the sample. On the other hand, our coherence peak is sharp and the SC behavior of can be fitted without assuming the distribution of . This is because NQR is a microscopic measurement which is able to extract the electronic state in a certain environment with high selectivity. The difference in the NQR frequency originates from the difference in the local environment surrounding the nucleus. Therefore, measured at a fixed frequency is determined by the electronic state with a single .
The first-principles calculation result indicates that CaSb2 has a pair of cylindrical Fermi surfaces along the zone boundary with a symmetry-protected nodal line, and they offer the possibility of topological superconductivity.[24] However, based on our experimental results, it is concluded that the normal state behaves as a conventional metal and the superconductivity is topologically trivial. Other physical probes sensitive to the Dirac nodes, such as transport and angle-resolved photoemission spectroscopy measurements, may reveal unconventional normal-state behavior. Furthermore, topological non-trivial character of nodal lines may be enhanced by pressure or chemical substitutions, providing a possibility of topological superconductivity.
In conclusion, we performed 121/123Sb-NQR measurements on the non-symmorphic line-nodal material CaSb2 using a powder sample. The temperature dependence of approximately exhibits Korringa behavior above , and shows a clear coherence peak just below and an exponential decrease sufficiently below . The first feature indicates that conventional metallic behavior is dominant in the normal state above , and the latter two provide strong evidence for an -wave superconductivity. The gap size was evaluated to be . By clarifying its SC symmetry, this work will substantially contributes to the understanding of the properties of CaSb2 and those of line-nodal materials.
We thank T. Hashimoto, A. Yamakage, M. Sato, and T. Oguchi for valuable discussions. We acknowledge the Research Center for Low Temperature and Materials Sciences, Kyoto University for the stable supply of liquid helium. This work was partially supported by Grant-in-Aid for Scientific Research on Innovative Areas from the Ministry of Education, Culture, Sports, Science, and Technology (MEXT) of Japan, and JSPS Core-to-core program (JPJSCCA20170002). We are also supported by: JSPS KAKENHI Nos. JP15H05852, JP15K21717, JP17H06136, JP20H00130, JP15K21732, JP15H05745, JP20KK0061, JP19H04696, JP19K14657, and JP20H05158. H. Takahashi was supported by Iwadare Scholarship Foundation.
References
- [1] C. L. Kane and E. J. Mele, Phys. Rev. Lett. , 146802 (2005).
- [2] M. König, S. Wiedmann, C. Brüne, A. Roth, H. Buhmann, L. W. Molenkamp, X.-L. Qi, and S.-C. Zhang, Science , 766 (2007).
- [3] Y. Tanaka, M. Sato, and N. Nagaosa, J. Phys. Soc. Jpn. , 011013 (2012).
- [4] M. Sato and S. Fujimoto, J. Phys. Soc. Jpn. , 072001 (2016).
- [5] M. Sato and Y. Ando, Rep. Prog. Phys. , 076501 (2017).
- [6] A. Y. Kitaev, Phys. Usp. , 131 (2001).
- [7] N. P. Armitage, E. J. Mele, and A. Vishwanath, Rev. Mod. Phys. , 015001 (2018).
- [8] B. Q. Lv, H. M. Weng, B. B. Fu, X. P. Wang, H. Miao, J. Ma, P. Richard, X. C. Huang, L. X. Zhao, G. F. Chen, Z. Fang, X. Dai, T. Qian, and H. Ding, Phys. Rev. X , 031013 (2015).
- [9] H. B. Nielsen and M. Ninomiya, Phys. Lett. , 6 (1983).
- [10] C. Fang, H. Weng, X. Dai, and Z. Fang, Chinese Phys. B , 117106 (2016).
- [11] Y. Huh, E.-G. Moon, and Y. B. Kim, Phys. Rev. B , 035138 (2016).
- [12] M. Hirayama, R. Okugawa, T. Miyake, and S. Murakami, Nat. Commun. , 14022 (2017).
- [13] S. T. Ramamurthy and T. L. Hughes, Phys. Rev. B , 075138 (2017).
- [14] Y. Kim, B. J. Wieder, C. L. Kane, and A. M. Rappe, Phys. Rev. Lett. , 036806 (2015).
- [15] H. Shapourian, Y. Wang, and S. Ryu, Phys. Rev. B , 094508 (2018).
- [16] R. Yu, H. Weng, Z. Fang, X. Dai, and X. Fu, Phys. Rev. Lett. , 036807 (2015).
- [17] A. Yamakage, Y. Yamakawa, Y. Tanaka, and Y. Okamoto, J. Phys. Soc. Jpn. , 012708 (2016).
- [18] C. Ciu and A. P. Schnyder, Phys. Rev. B , 205136 (2014).
- [19] C. Fang, Y. Chen, H.-Y. Kee, and L. Fu, Phys. Rev. B , 081201(R) (2015).
- [20] S. Kobayashi, Y. Yanase, and M. Sato, Phys. Rev. B , 134512 (2016).
- [21] K. Momma and F. Izumi, J. Appl. Crystallogr. , 1272 (2011).
- [22] K. Funada, A. Yamakage, N. Yamashina, and H. Kageyama, J. Phys. Soc. Jpn. , 044711 (2019).
- [23] Y. Li, L. Li, T. Wang, X. Xu, C. Ci, C. Cao, and J. Dai, Phys. Rev. B , 121115(R) (2016).
- [24] A. Ikeda, M. Kawaguchi, S. Koibuchi, T. Hashimoto, T. Kawakami, S. Yonezawa, M. Sato, and Y. Maeno, Phys. Rev. Materials , 041801(R) (2020).
- [25] J. J. Neumeier and M. G. Smith, Physica C , 1 (2017).
- [26] B. Dóra and F. Simon, Phys. Rev. Lett. , 197602 (2009).
- [27] Z. Okvátovity, F. Simon, and B. Dóra, Phys. Rev. B , 245141 (2016).
- [28] P. Blaha, K. Schwarz, G. K. H. Madsen, D. Kvasnicka, J. Luitz, R. Laskowski, F. Tran and L. D. Marks, , An Augmented Plane Wave + Local Orbitals Program for Calculating Crystal Properties (Karlheinz Schwarz, Techn. Universität Wien, Austria), 2018. ISBN 3-9501031-1-2.
- [29] P. Blaha, K. Schwarz, F. Tran, R. Laskowski, G. K. H. Madsen and L. D. Marks, J. Chem. Phys. , 074101 (2020).
- [30] J. P. Perdew, K. Burke, and M. Ernzerhof, Phys. Rev. Lett. , 3865 (1996).
- [31] K. Deller and B. Eisenmann, Z. anorg. allg. Chem. , 104 (1976).
- [32] J. Christiansen, P. Heubes, R. Keitel, W. Klinger, W. Loeffler, W. Sandner, and W. Witthuhn, Z. Phys. B , 177 (1976).
- [33] Y. Obata, J. Phys. Soc. Jpn. , 2348 (1964).
- [34] H. Maebashi, T. Hirosawa, M. Ogata, and H. Fukuyama, J. Phys. Chem. Solids ,138 (2019).
- [35] H. Yasuoka, T. Kubo, Y. Kishimoto, D. Kasinathan, M. Schmidt, B. Yan, Y. Zhang, H. Tou, C. Felser, A. P. Mackenzie, and M. Baenitz, Phys. Rev. Lett. , 236403 (2017).
- [36] S. Kitagawa, K. Ishida, M. Oudah, J. N. Hausmann, A. Ikeda, S. Yonezawa, and Y. Maeno, Phys. Rev. B , 100503(R) (2018).
- [37] Y. Hasegawa and H. Fukuyama, J. Phys. Soc. Jpn. , 2619 (1987).
- [38] L. C. Hebel, Phys. Rev. , 79 (1959).