Polarization-dependent excitons and plasmon activity in nodal-line semimetal ZrSiS
Abstract
The optical properties of bulk ZrSiS nodal-line semimetal are theoretically studied within a many-body formalism. The bands are similar to those calculated within the density functional theory, except near the -point; in particular, no significant differences are found around the Fermi energy. On the other hand, the solution of the Bethe-Salpeter equations reveals a significant excitonic activity, mostly as “dark” excitons which appear in a wide energy range. “Bright” excitons, on the contrary, are less numerous, but their location and intensity depend greatly on the polarization of the incident electric field, as the absorption coefficient itself does. The binding energy of these excitons correlate well with their spatial distribution functions. In any case, a good agreement with available experimental data for absorption/reflection is achieved. Finally, the possible activation of plasma oscillations at low energies is discarded, because these are damped by producing electron-hole pairs, more importantly for along the path.
pacs:
Due to its nontrivial topological behavior, ZrSiS-based materials have received considerable attention during the last decade as archetypes of nodal-line semimetals Neupane et al. (2016). These are particular forms of Dirac or Weyl semimetals in which bands cross along given directions of the first Brillouin zone (BZ) Burkov et al. (2011). Strictly, nodal lines of ZrSiS appear at about 0.50.7 eV below the Fermi energy, where Dirac points protected by the non-symmorphic symmetries exist. A second set of (quasi) nodal-lines, slightly above the Fermi energy, is actually gapped because of the spin-orbit coupling (SOC), although the gap is small, of the order of tens of meV Schoop et al. (2016). ZrSiS displays a set of exceptional physical properties, including high mobility of the charge carriers Matusiak et al. (2017), intense Zeeman effect Hu et al. (2017) or large magnetoresistance Singha et al. (2017). From the viewpoint of the present work, it is remarkable that ZrSiS features a “flat” optical absorption coefficient below 1 eV Schilling et al. (2017).
The optical properties of ZrSiS seem to be affected by many-body correlation effects. In particular, it has been theorized that the ground state of a nodal-line semimetal with congruent electron and hole Fermi surfaces becomes unstable in presence of electron-hole interactions Rudenko et al. (2018); Scherer et al. (2018). The electron-hole pairing provides a physical explanation to the observed mass enhancement of charge carriers Pezzini et al. (2018), and the question arises as to whether the optical properties of ZrSiS may be influenced by electron-hole interactions as well. Surprisingly, the theoretical studies about optical properties of ZrSiS are scarce, to our knowledge, and use either tight-binding models Rudenko et al. (2018) or an independent-particle (IP) approach based on the density functional theory (DFT) Zhou et al. (2020). In this paper, we have computed the dielectric function of ZrSiS by solving the Bethe-Salpeter equation (BSE) for electron-hole pairs. Our results compare fairly well with experimental data available, and provide a theoretical description for the behavior of charge carriers of ZrSiS from a sound many-body formalism.
The electronic structure of ZrSiS was first calculated from standard DFT+SOC within the generalized-gradient approximation for the exchange-correlation functional. The kinetic energy cutoff was set to 900 eV, and the BZ was sampled with a 21217 mesh centered at . The starting structure, with the experimental lattice parameters 3.5450(5) Å and 8.0578(16) Å Schoop et al. (2016), was relaxed until the Hellmann-Feynman forces decreased below eV/Å; the relaxed lattice parameters where 3.52 Å and 8.01 Å, which compare fairly well with the starting ones. DFT calculations were performed with Quantum Espresso Giannozzi et al. (2009).
The many-body corrections were accounted for within the approximation Hedin (1965). The dielectric function was computed within the plasmon-pole approximation Larson et al. (2013), and the energies were subsequently used to build the BSE kernel, whose diagonalization provides the excitonic energies and eigenstates . From these parameters, the dielectric function is computed for a generic scattering vector as
| (1) |
where and run over the number of valence and conduction bands which define the energy range of interest, and are the DFT -vectors and the sum in spans all the exciton states. Optical properties were calculated from (1) in the limit , with parallel to the incident electric field. The contribution of intraband transitions to the static screening was modeled by a Drude-like term with a polarization-dependent Drude plasmon, namely eV and eV for the and polarizations, respectively, which were reported to describe accurately the optical behavior at the IP level Zhou et al. (2020). The imaginary part of the Drude plasmon was set to 0.005 eV. The and BSE calculations were performed with the Yambo code Marini et al. (2009); Sangalli et al. (2019).
Figure 1 displays the band structure of ZrSiS calculated at the DFT and levels. The DFT band structure exhibits the interesting features pointed out by Schoop et al. Schoop et al. (2016): lifting of degeneracy of the expected Dirac points, along , and , existence of Dirac-like crossings points around 0.7 eV below the Fermi energy at and 0.5 eV at , and linearity of the bands below and above the gap. The node along lies on the Fermi energy, and SOC slightly gaps it by 39 meV; gaps with similar amplitudes appear along (43 meV) and along (41 meV). As a consequence, the electron (and hole) effective masses are different from, but close to, zero at these points, as shown in the Supplement, Table S1. The symmetric topology of the bands near the gap causes electrons and holes to have similar masses, except in the transversal direction; this effect is due to the inherent anisotropy of the ZrSiS crystal structure. Note that electrons and holes are heavier along the transversal directions, significantly for points 1 and 3. Nearly zero effective masses are common to other topological insulators Narayanan et al. (2015); besides, significant effective mass anisotropy has been identified around the nodal line of ZrSiS Pezzini et al. (2018). In any case, comparison with experimental data for effective masses is not straightforward, since these are usually indirectly estimated. Hu et al. Hu et al. (2017) estimate as 0.025 to for ZrSiS from de Haas-van Alphen oscillations for a range of temperatures and magnetic fields. Pezzini et al. estimate to be larger than , with values increasing with the magnetic field strength, along given orbits within the nodal line of ZrSiS Pezzini et al. (2018). These citations cannot be regarded as strong evidences supporting our results, but just as signs that the effective masses of ZrSiS near the gap may be small, as also very anisotropic.
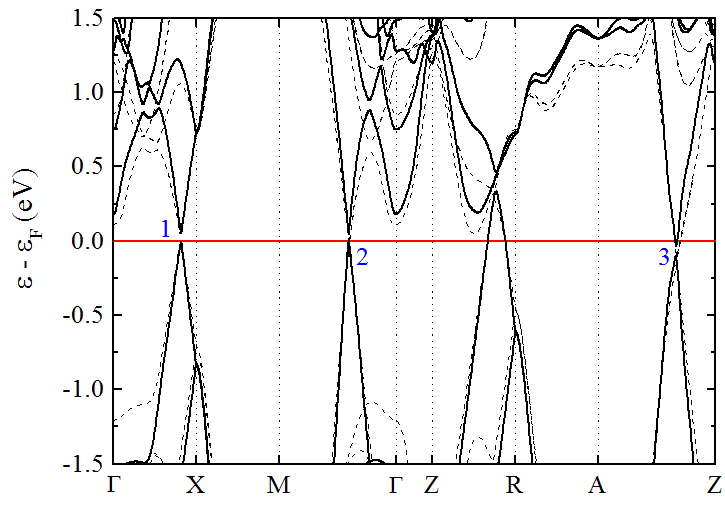
The corrections to the DFT bands preserve the overall band topology. In particular, the Dirac-like nodes are conserved within the accuracy of our procedure ( 10 meV), while the gaps along , and are slightly opened to 60 meV, 70 meV and 60 meV, respectively. Also the Dirac points below the Fermi energy are preserved, though slightly shifted downwards. The most remarkable changes of the band structure appear at , where the VB maximum shifts about 1.5 eV below the Fermi level, as well as around the symmetry point of the BZ.
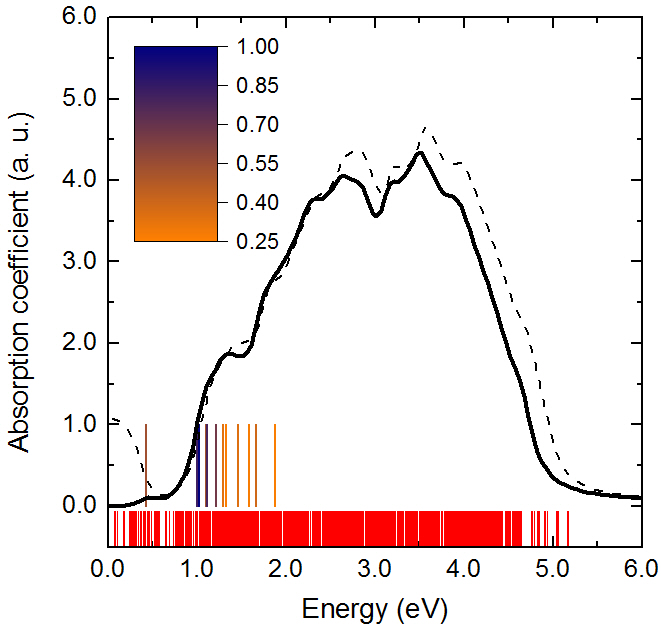
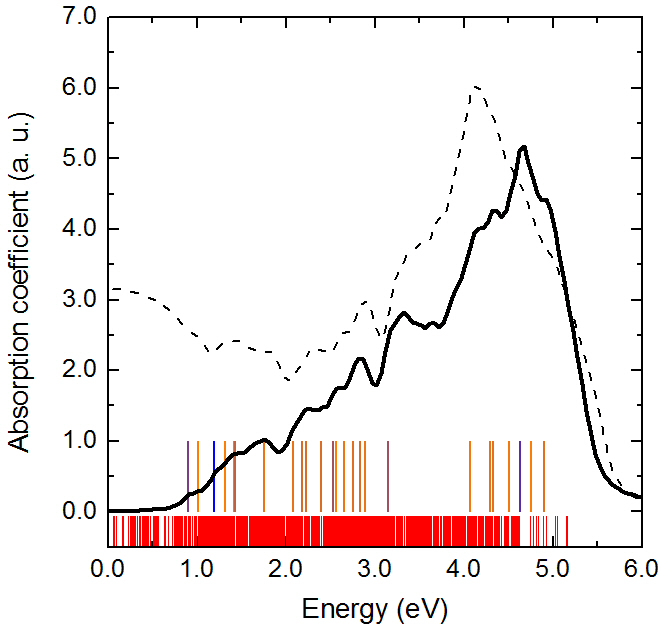
Figs. 2 plot the calculated absorption coefficient of ZrSiS vs. energy for the incident field polarized along the (2(a)) and (2(b)) axes. The dashed and solid lines correspond, respectively, to the results obtained within the IP approximation and by solving the BSE. This figure indicates that the optical response depends on the polarization of the incident field, as well as that a significant excitonic activity takes place. The maximum absorption is achieved between 2.0 and 4.0 eV for , that is, within the solar range, and at around 5.0 eV for . Note that BSE yields a red shift of the absorption spectrum with respect to the IP results for polarization, but a blue shift for .
The electron-hole interactions result in the formation of a myriad of excitons for both orientations of the field, shown as vertical lines in Figs. 2. Most of these are “dark”, that is, with virtually zero (here, below 10-4) strengths, shown as short red vertical lines in Figs. 2. For both orientations, the first dark exciton forms at point 2 of Fig. 1 between the topmost valence band and the bottommost conduction band (besides the corresponding degenerate states), and it is unbound. Dark excitons are responsible for the marked differences between the IP and BSE spectra below 1.0 and 2.0 eV for the and orientations, respectively. Indeed, the IP formalism predicts a finite absorption at Zhou et al. (2020), which is in contradiction to the experimental evidence of high (virtually total) reflectivity, which is followed by an abrupt decrease at around 1 eV Schilling et al. (2017). On the contrary, the BSE treatment yields a low absorption (and therefore a high reflectivity, see Supplement, Fig. S1) below 1 eV, in good agreement with experiments.
The positions of the “bright” excitons (observed in the absorption spectrum) are shown as vertical long lines in Figs. 2; the color code indicates the relative intensity of each exciton. The number and spectral range of bright excitons depend on the polarization of the incident light. For the orientation, they shave energies below 2.0 eV, whereas they extend up to about 5.0 eV for the orientation; note also that the main effect of the electron-hole interactions appears for the latter. The first bright excitons appear virtually at the same energy for both field orientations (0.43 eV and 0.41 eV, for the and orientations, respectively), but their binding energies, respectively 380 meV and 90 meV, depend on the field direction. These excitons appear at different points between the topmost valence band and the second-lowest conduction band. For the polarization it is , whereas for the polarization the main contribution arises from the state with , with contributing by around 0.5 the intensity at . The dissimilarity of the binding energies for the first bright exciton could be explained then by the different effective masses of electrons and holes at the respective points. The effect of anisotropy on the effective mass of charge carrier has been modeled elsewhere Schindlmayr (1997). The application of this model to our data indicates that the binding energies for the first excitons for the and polarization should differ by a factor , which compares reasonably well with the calculated results, given the simplicity of the model. Details of the calculation are given in the Supplement. The most intense excitons, on the other hand, appear at 1.03 eV and 1.20 eV, respectively, for and polarizations, with binding energies 110 meV and 510 meV.
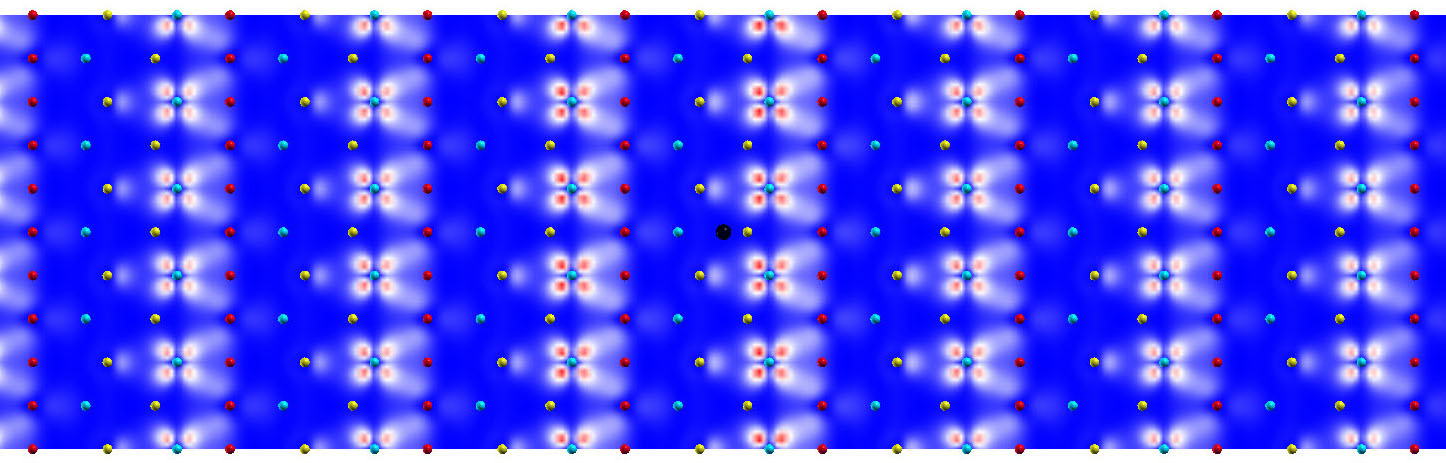
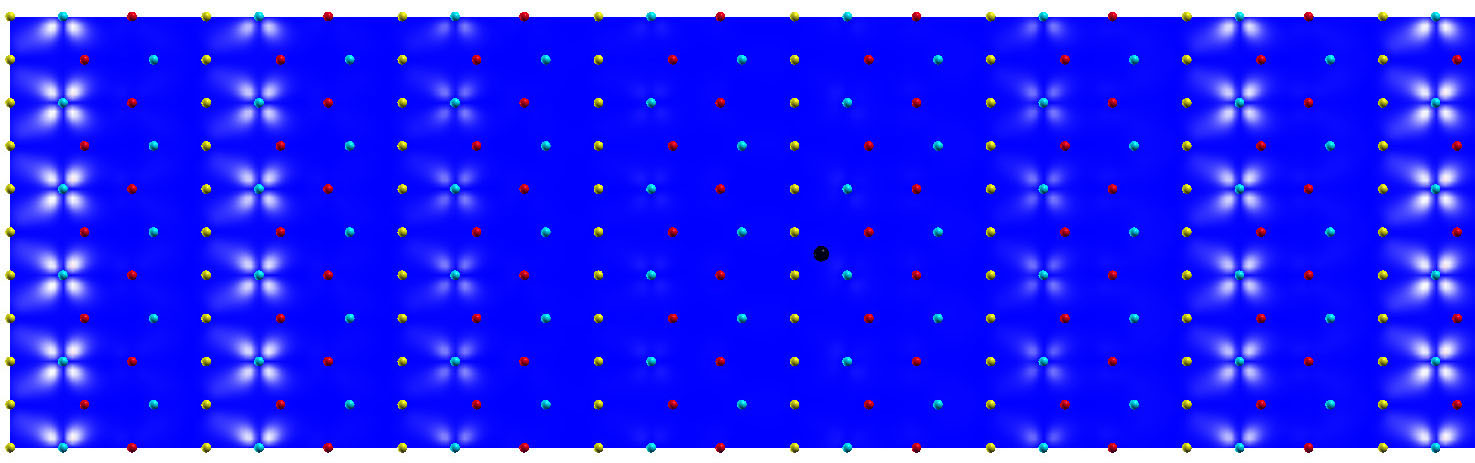
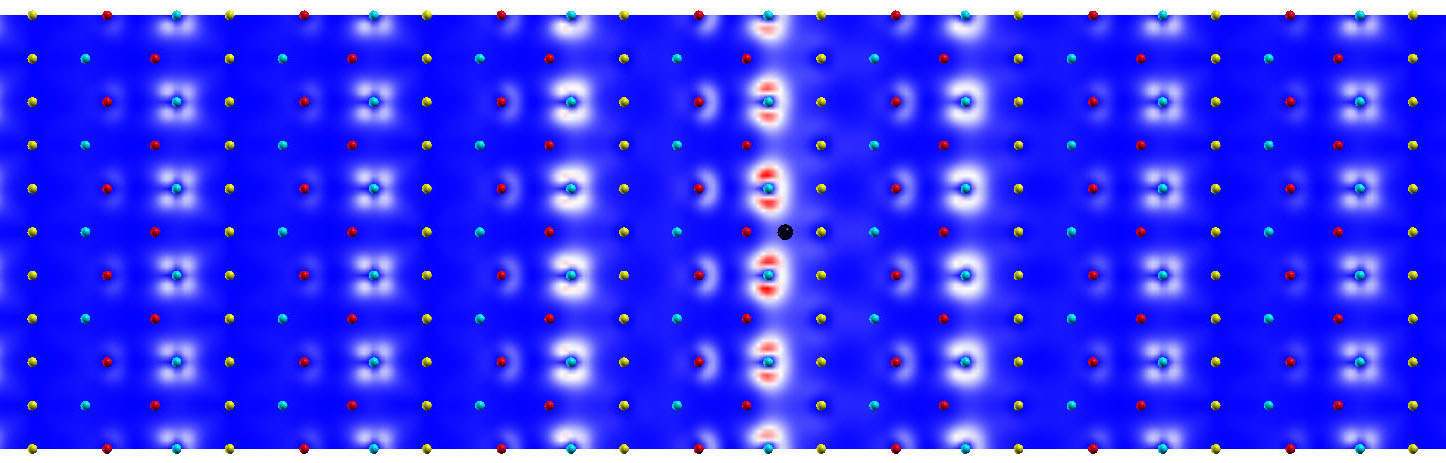
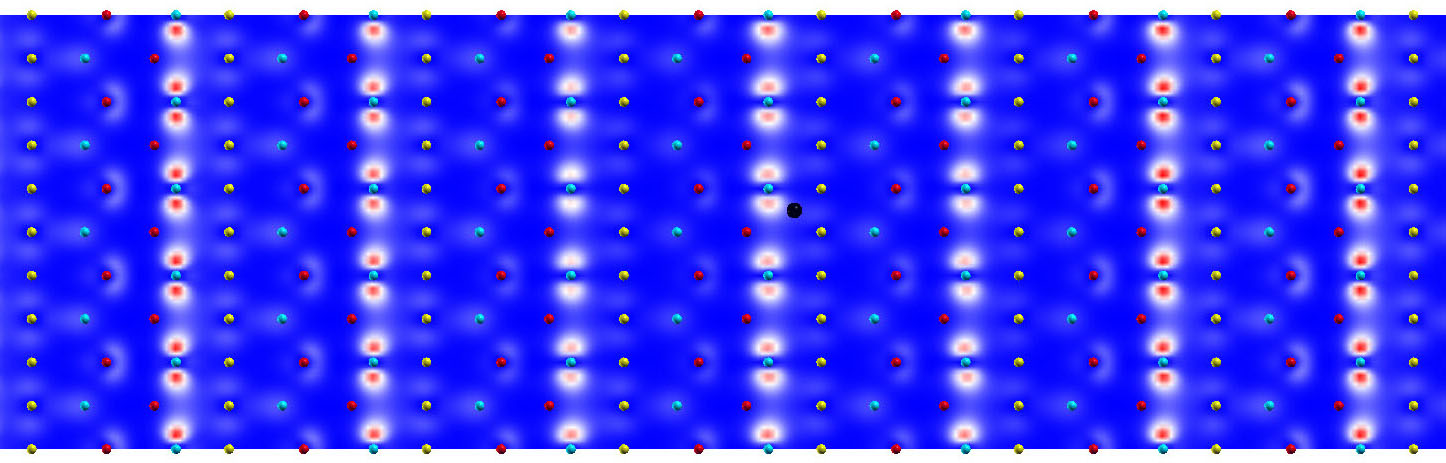
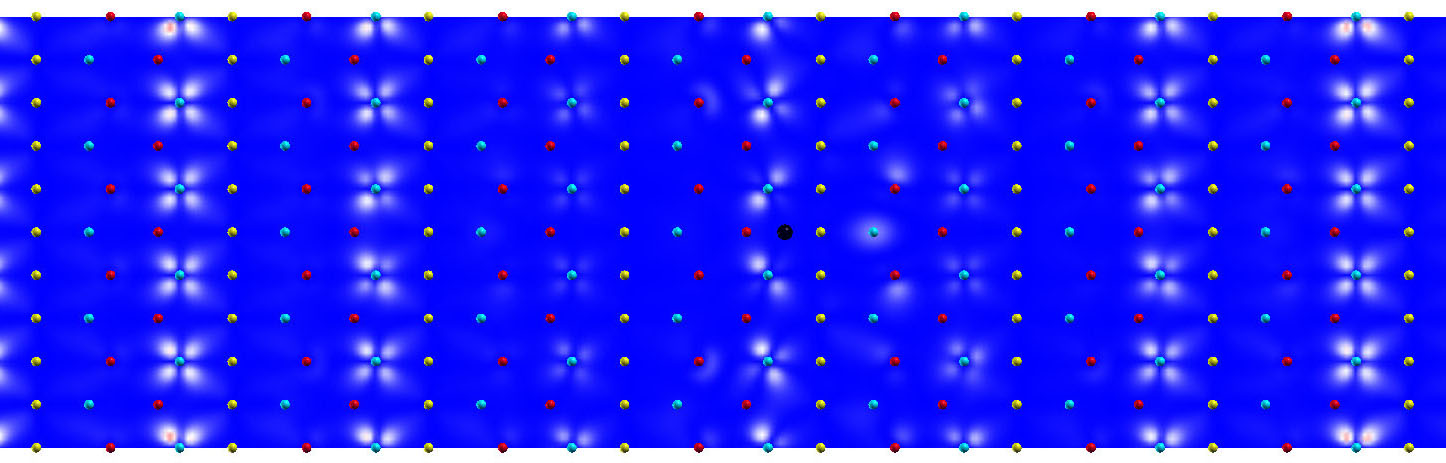
Figs. 3 plot the spatial distribution (i.e., the probability of electron location for a given position of the hole) for the first dark (a), first bright (b) and most intense (c) excitons for the electric field parallel to . Analogously, Figs. 4 plot the first bright (a) and most intense (b) excitons for . In all cases, the hole was placed at a maximum of the charge density. The formation of the first dark exciton for polarization involves a negligible distortion of the electronic density near the hole because unbound excitons have wide spatial extensions. Bright excitons give rise to more important charge redistributions, in particular for by virtue of its larger binding energy. In this case, the excitons extends about three unit cells, with the electronic charge redistributing roughly as for the dark exciton. For , the spatial extension of the exciton is quite modest. In opposition to the previous case, the electronic charge now arranges mostly at orbitals.
An interesting issue which remains to be clarified is the possible existence of plasma excitations, which was studied by Zhou et al. from the IP approach Zhou et al. (2020). Plasma excitations may propagate at frequency ranges for which the real part of the dielectric function becomes negative; therefore, the frequency ranges of interest are defined by the condition . Zhou et al. identified two regions of possible plasma oscillations, namely 57 eV, which are damped and therefore hardly detectable, and 1920 eV, which could be experimentally observed. Figs. 5 plot the Re function computed within the BSE formalism for several vectors for within the low-energy regime of Zhou et al. Our solutions of the BSE indicate that the frequency ranges for possible plasmons depend on the vector. For , the upper limit for the plasmon energy is around 6 eV, the lower one increasing from 0.7 eV to 1.9 eV as increases; in-plane vectors were taken along for symmetry. For , two plasmon regimes appear, between 0.30.9 eV and 4.76 eV and 0.50.8 eV and 5.26.0 eV for Å-1 and Å-1, respectively. No plasmons appear for Å-1 and beyond.
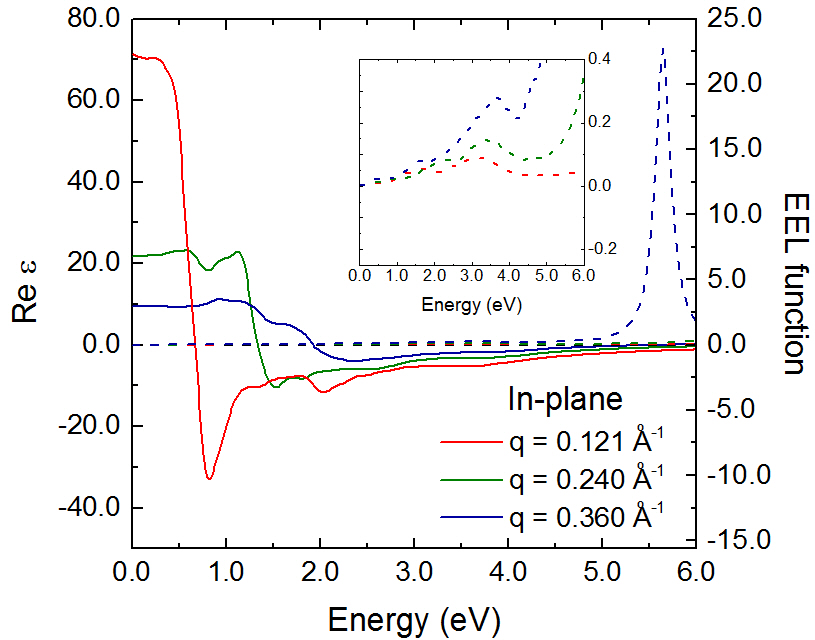
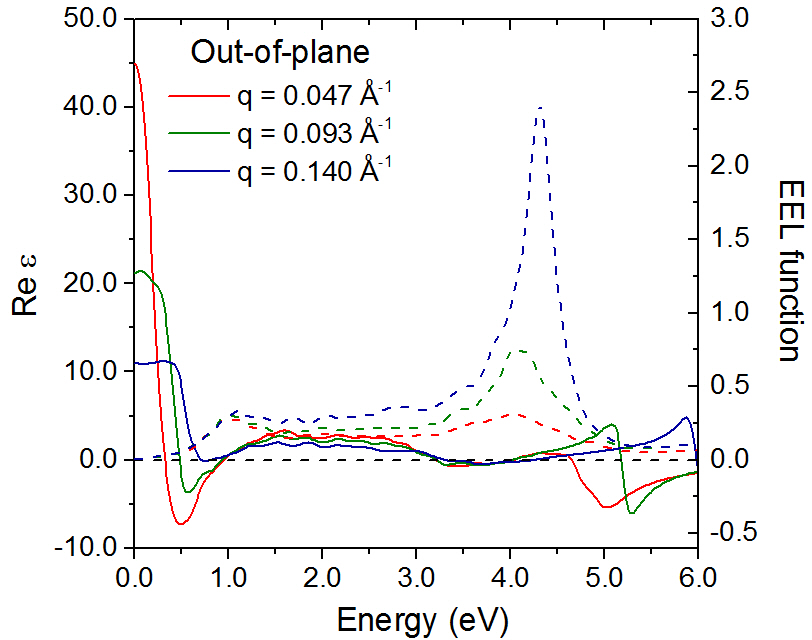
The nature and characteristics of the plasmons may be investigated from the electron energy loss function, defined as , as well as from the finite-momentum joint density of states (fm-jDOS), , defined as the number of states per unit energy separated by momentum and energy . High values indicate that energy is being lost at , as a consequence of any inelastic mechanism. On the other hand, the fm-jDOS is directly related to the decay rate for a plasmon in the state to electron-hole pairs satisfying energy and momentum conservation Mahan (2000) and, therefore, high fm-jDOS values denote high generation rates for electron-hole pairs; additional details are given in the Supplement.
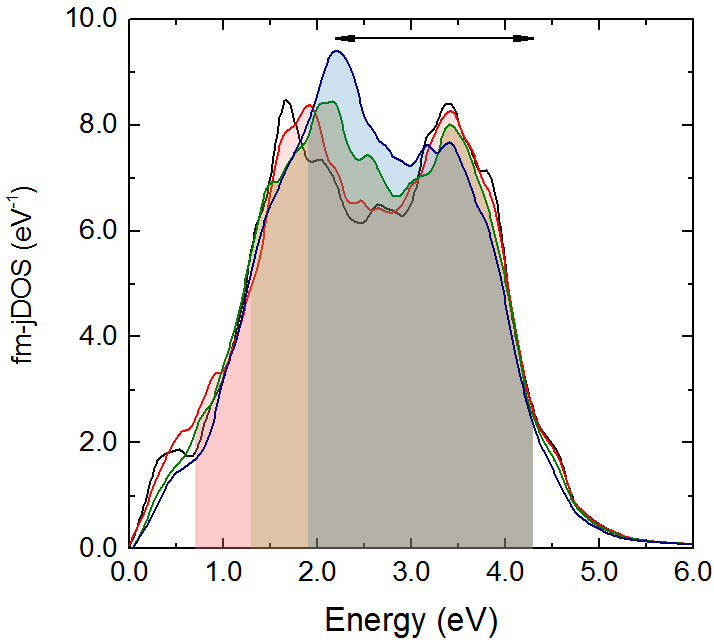
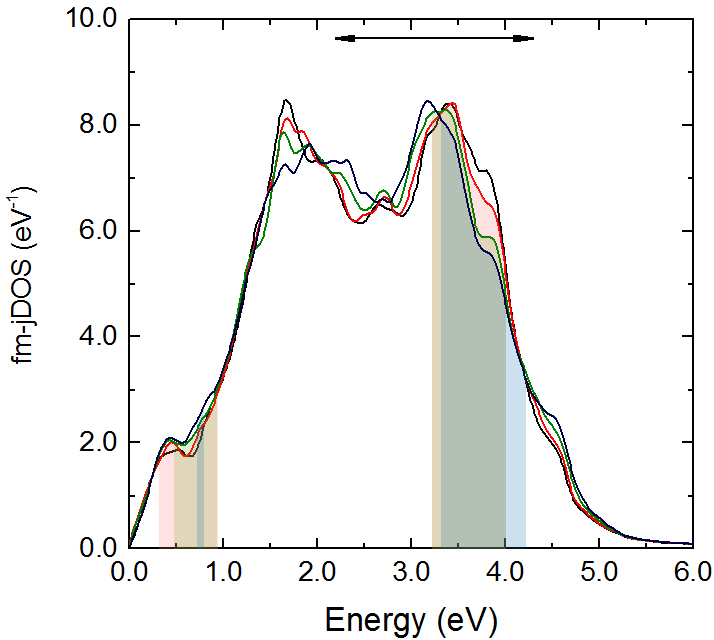
The right axes of Figs. 5 plot the functions for the in-plane (a) and out-of-plane (b) geometries. These plots evidence that takes on negligible values within the energy ranges where plasmons propagate, which indicates that these are actually damped. Thus, the BSE formalism confirms the previous IP predictions that no plasmons propagate at energies below 6 eV in bulk ZrSiS. In fact, these plasmons decay into electron-hole pairs. Figs. 6 show the fm-jDOS for for (a) and ; the shaded regions indicate the energy range of plasmons for each condition. These figures show that the generation of electron-hole pairs is important for . These pairs differ by vectors of the form , and the decay rate becomes higher, but within a narrower energy range, as increases. Identifying these pairs on the band structure of Fig. 1 is virtually impossible due to the high number of possible transitions involved, but we notice that one of the possible pairs satisfying the conservation laws is that linking point 1 at the VB to the Dirac point at at the CB. By contrast, pair generation is modest for due to that the energy range for plasmons is narrower.
Two concluding comments are relevant. First is that BSE calculations yield no significant differences for the two orientations of the incident electric field regarding plasmon activity; this also agrees with the IP prediction that plasmonic behavior is independent of the polarization of light. Besides, it is remarkable that BSE confirms the existence of hyperbolic plasmons Shekhar et al. (2014); Gomez-Diaz et al. (2015). These are defined by the condition , which is fulfilled in our case for 5 eV (just like at IP level) but also between 2 and 4 eV, approximately. This effect is shown in the Supplement, Fig. S2.
Acknowledgements.
Financial support by Grants FIS2016-76359-P (Ministry of Economy and Competitiveness of Spain), RTI2018-093711-B-I00 (Ministry of Science of Spain), IB16013 (Junta de Extremadura, Spain) and Prometeo GVA2020-16 (Generalitat Valenciana, Spain) are greatly acknowledged. Thanks are also given to the Spanish Supercomputing Network for the use of the supercomputer Tirant and to the Center for Nanoscale Materials (Advance Photon Source, Argonne National Lab.) for the approval of proposal #69398.References
- Neupane et al. (2016) M. Neupane et al., Phys. Rev. B 93, 201104 (2016).
- Burkov et al. (2011) A. A. Burkov, M. D. Hook, and L. Balents, Phys. Rev. B 84, 235126 (2011).
- Schoop et al. (2016) L. M. Schoop, M. N. Ali, C. Strasser, A. Topp, A. Varykhalov, D. Marchenko, V. Duppel, S. S. P. Parkin, B. V. Lotsch, and C. R. Ast, Nat. Commun. 7, 11696 (2016).
- Matusiak et al. (2017) M. Matusiak, J. R. Cooper, and D. Kaczorowski, Nat. Commun. 8, 15219 (2017).
- Hu et al. (2017) J. Hu, Z. Tang, J. Liu, Y. Zhu, J. Wei, and Z. Mao, Phys. Rev. B 96, 045127 (2017).
- Singha et al. (2017) R. Singha, A. K. Pariari, B. Satpati, and P. Mandal, Proc. Natl. Acad. Sci. U.S.A. 114, 2468 (2017).
- Schilling et al. (2017) M. B. Schilling, L. M. Schoop, B. V. Lotsch, M. Dressel, and A. V. Pronin, Phys. Rev. Lett. 119, 187401 (2017).
- Rudenko et al. (2018) A. N. Rudenko, E. A. Stepanov, A. I. Lichtenstein, and M. I. Katsnelson, Phys. Rev. Lett. 120, 216401 (2018).
- Scherer et al. (2018) M. M. Scherer, C. Honerkamp, A. N. Rudenko, E. A. Stepanov, A. I. Lichtenstein, and M. I. Katsnelson, Phys. Rev. B 98, 241112(R) (2018).
- Pezzini et al. (2018) S. Pezzini, M. R. van Delft, L. M. Schoop, B. V. Lotsch, A. Carrington, M. I. Katsnelson, N. E. Hussey, and S. Wiedmann, Nat. Phys. 14, 178 (2018).
- Zhou et al. (2020) W. Zhou, A. N. Rudenko, and S. Yuan, Adv. Electron. Mater. 6, 1900860 (2020).
- Giannozzi et al. (2009) P. Giannozzi et al., J. Phys.: Condens. Matter 21, 395502 (2009).
- Hedin (1965) L. Hedin, Phys. Rev. 139, A796 (1965).
- Larson et al. (2013) P. Larson, M. Dvorak, and Z. Wu, Phys. Rev. B 88, 125205 (2013).
- Marini et al. (2009) A. Marini, C. Hogan, M. Grüning, and D. Varsano, Comp. Phys. Comm. 180, 1392 (2009).
- Sangalli et al. (2019) D. Sangalli et al., J. Phys.: Condens. Matter. 31, 325902 (2019).
- Narayanan et al. (2015) A. Narayanan, M. D. Watson, S. F. Blake, N. Bruyant, L. Drigo, Y. L. Chen, D. Prabhakaran, B. Yan, C. Felser, T. Kong, P. C. Canfield, and A. I. Coldea, Phys. Rev. Lett. 114, 117201 (2015).
- Schindlmayr (1997) A. Schindlmayr, Eur. J. Phys. 18, 374 (1997).
- Mahan (2000) G. D. Mahan, Many-Particle Physics (Springer, 2000).
- Shekhar et al. (2014) P. Shekhar, J. Atkinson, and Z. Jacob, Nano Converg. 1, 14 (2014).
- Gomez-Diaz et al. (2015) J. S. Gomez-Diaz, M. Tymchenko, and A. Alù, Phys. Rev. Lett. 114, 233901 (2015).