TESS Cycle 1 observations of roAp stars with 2-min cadence data
Abstract
We present the results of a systematic search for new rapidly oscillating Ap (roAp) stars using the 2-min cadence data collected by the Transiting Exoplanet Survey Satellite (TESS) during its Cycle 1 observations. We identify 12 new roAp stars. Amongst these stars we discover the roAp star with the longest pulsation period, another with the shortest rotation period, and six with multiperiodic variability. In addition to these new roAp stars, we present an analysis of 44 known roAp stars observed by TESS during Cycle 1, providing the first high-precision and homogeneous sample of a significant fraction of the known roAp stars. The TESS observations have shown that almost 60 per cent (33) of our sample of stars are multiperiodic, providing excellent cases to test models of roAp pulsations, and from which the most rewarding asteroseismic results can be gleaned. We report four cases of the occurrence of rotationally split frequency multiplets that imply different mode geometries for the same degree modes in the same star. This provides a conundrum in applying the oblique pulsator model to the roAp stars. Finally, we report the discovery of non-linear mode interactions in Cir (TIC 402546736, HD 128898) around the harmonic of the principal mode – this is only the second case of such a phenomenon.
keywords:
asteroseismology – stars: chemically peculiar – stars: oscillations – techniques: photometric – stars: variables – stars: magnetic fields1 Introduction
The rapidly oscillating Ap (roAp) stars are a rare subset of the chemically peculiar, magnetic, Ap stars. They are found at the base of the classical instability strip where it intersects the main sequence, and range in age from the zero-age main sequence to beyond the terminal-age main sequence. Since their discovery (Kurtz, 1978, 1982) there have been several attempts to enlarge, and study, the sample of roAp stars. These have included targeted and survey ground-based photometry (e.g., Martinez et al., 1991; Nelson & Kreidl, 1993; Martinez & Kurtz, 1994b; Paunzen et al., 2012; Holdsworth et al., 2014a; Joshi et al., 2016; Paunzen et al., 2018), time-resolved high resolution spectroscopic observations (e.g., Elkin et al., 2008; Freyhammer et al., 2008a; Kochukhov et al., 2013) and most recently space photometry (e.g., Bruntt et al., 2009; Gruberbauer et al., 2011; Kurtz et al., 2011; Balona et al., 2011; Weiss et al., 2016; Hey et al., 2019; Balona et al., 2019; Cunha et al., 2019; Holdsworth, 2021). To date, including the results presented here, there are 88 roAp stars known in the literature.
The overarching class of Ap stars hosts strong, stable, global magnetic fields that can have field strengths of up to 34 kG (Babcock, 1960; Mathys, 2017), with the magnetic axis misaligned with respect to the rotation axis. The magnetic field is thought to be the main factor in braking the rotation velocity of the star (Stȩpień, 2000), such that the Ap stars show rotation periods of between a few days and perhaps centuries (North, 1984; Sikora et al., 2019c; Mathys et al., 2020b). The presence of the magnetic field also serves to suppress near-surface convection, allowing for the stratification of elements in the stellar atmosphere (Michaud et al., 1981; LeBlanc et al., 2009; Alecian & Stift, 2010) through the effects of radiative levitation and gravitational settling. In particular, the radiative levitation leads to surface inhomogeneities of elements such as Ce, Pr, Nd, Sm, Eu and Tb, which can be overabundant by over a million times the solar value (e.g., Lüftinger et al., 2010).
These chemical spots, which are either bright or dark depending on the wavelength of observation, cause non-sinusoidal modulation of the light curve over the stellar rotation period. This allows for precise rotation periods to be measured, and is well represented by the oblique rotator model (Stibbs, 1950). Such a modulation is also seen in the magnetic field strength (e.g., Mathys, 2017; Hubrig et al., 2018), and spectral line strength. These rotationally modulated stars are commonly known as CVn stars (Samus’ et al., 2017). Kochukhov (2011) concluded that the distribution of the chemical spots of the Ap stars is diverse, rarely showing a connection with the magnetic field structure.
The pulsations in the roAp stars are high overtone (), low degree () pressure (p) modes with frequencies in the range mHz ( d -1; min). The pulsation axis in these stars is misaligned to both the rotation and magnetic axes, leading to the development of the oblique pulsator model (Kurtz, 1982; Shibahashi & Saio, 1985; Bigot & Dziembowski, 2002; Bigot & Kurtz, 2011). Such a configuration means that the pulsation mode is viewed from varying aspects over the rotation cycle of the star, leading to an apparent amplitude modulation of the mode. In a Fourier spectrum of a light curve, a multiplet is seen with components for a non-distorted mode, with the components split from the central mode frequency by exactly the stellar rotation frequency.
The driving mechanism for the pulsations in roAp stars is still an area of active research. In many cases, it is currently thought that the pulsations are driven by the opacity () mechanism in the hydrogen ionisation layers in regions of the star where the magnetic field suppresses convection (Balmforth et al., 2001). However, this theory cannot reproduce observations of the highest frequency modes in some stars. In these cases Cunha et al. (2013) proposed that a mechanism linked to turbulent pressure plays a role in the excitation of these highest frequency modes.
A further conundrum linked to the excitation mechanism of the pulsations in roAp stars comes with the inspection of the theoretical instability strip of these stars. Cunha (2002), based on the models of Balmforth et al. (2001), calculated the extent of the theoretical instability strip for roAp stars and found a much hotter blue edge than the observations mapped, and that some known roAp stars were cooler than the red edge. It is still unclear why the theoretical models do not match the observational evidence.
Of particular scientific interest are the roAp stars which show multiple pulsation modes as these stars provide the ability to constrain structure models of Ap stars. In the absence of a magnetic field, the pulsation modes of an roAp star would form a series of alternating degree modes that are equally spaced in frequency, as is expected in the asymptotic regime for high radial-order acoustic oscillations (Shibahashi, 1979; Tassoul, 1980). The acoustic waves in the outer layers of the roAp stars, in the presence of the strong magnetic field, become magnetoacoustic in nature which consequently changes the mode frequencies (Cunha & Gough, 2000; Cunha, 2006; Saio & Gautschy, 2004). In most cases, the frequency separation between consecutive modes is not significantly affected, still enabling the use of asteroseismic techniques to help constrain the stellar properties as would be done for non-magnetic stars (Cunha et al., 2003; Deal et al., 2021). Nevertheless, at some particular frequencies the coupling between the magnetic field and pulsations is optimal and the pulsation spectrum can be significantly modified. It is the multiperiodic stars, which in some cases show significant shifts from the expected non-magnetic frequency pattern, that provide the most scientific return (e.g. Cunha, 2001; Gruberbauer et al., 2008).
The Transiting Exoplanet Survey Satellite (TESS; Ricker et al., 2015) is surveying almost the entire sky, in 27-d long strips known as sectors, in the search for transiting exoplanets. As such, it is collecting high precision photometric data on millions of stars at 2-min and 30-min cadences (with a 20-s cadence added in the extended mission and reducing the full frame image cadence to 10 min). The Cycle 1 observations, conducted in the first year of the primary mission, covered the southern ecliptic hemisphere, with Cycle 2 observing the northern ecliptic hemisphere. Such an observational data set provides the opportunity to perform an homogeneous earch for high-frequency pulsations in a significant selection of stars.
This work utilises the 2-min cadence TESS Cycle 1 observations (sectors 1 through 13) to search for high-frequency pulsations in main sequence stars hotter than K. We present the observational results here, and will, in a future work, use these results to perform an ensemble study of the properties of the roAp stars. The paper is laid out as follows: in Section 2 we introduce our data sample; in Section 3 we provide details of spectroscopic follow up observations; in Section 4 we present the results of our search. In Section 5 we present candidate roAp stars where we have insufficient data to confirm their true nature, and in Section 6 we draw our conclusions.
2 Data sample and search strategy
To construct our catalogue of target stars, we took the 2-min target list (constructed from proposals from the exoplanet and asteroseismic communities) for each sector of observations from TESS111https://tess.mit.edu/observations/target-lists/ which consisted of 20 000 stars per sector. These lists were then crossmatched with version 8 of the TESS Input Catalog (TIC; Stassun et al., 2019) with a 3 arcsec radius. This gave us access to the secondary information in the TIC to refine our targets. Using only the parameter, we selected stars with temperatures of 6000 K or hotter. This temperature cut is to ensure we do not exclude around the red edge of the roAp star instability strip, and to account for any inaccuracies in the TIC temperature values. This amounted to about 7500 stars per sector, with 101 847 light curves in total, corresponding to 50 703 unique stars (with 15 363 stars observed in more than one sector). The light curves for each star in all available sectors were downloaded from the Mikulski Archive for Space Telescopes (MAST) server. These data have been processed with the Science Processing Operations Center (SPOC) pipeline (Jenkins et al., 2016). In the following we used the Pre-search Data Conditioning Simple Aperture Photometry (PDC_SAP) data unless otherwise stated.
Initially, three independent analysis techniques were implemented for the search of pulsational variability. For one team, each individual light curve was automatically prewhitened to a frequency of 0.23 mHz (20 d -1) to an amplitude limit of the approximate noise level between mHz ( d -1) to remove instrumental artefacts and any low-frequency signal whose window function affects the noise at high frequency. If multiple sectors for a target were available, the prewhitened sectors were then combined. An amplitude spectrum of the light curve was calculated to the Nyquist frequency of 4.2 mHz (360 d -1), which also included a calculation of the false alarm probability (FAP).
From these amplitude spectra, we selected stars which showed peaks with frequencies mHz ( d -1) and a corresponding FAP of . The amplitude spectra of these stars were then plotted for visual inspection. This totalled 6713 stars, of which 2125 stars have multi-sector observations.
A second team used a complementary method which calculated the skewness of the amplitude spectrum (Murphy et al., 2019) of the MAST PDC_SAP data above 0.46 mHz (40 d -1). Where multiple sectors of data were available, they were combined to a single light curve. If the skewness was greater than 5, then all peaks in the amplitude spectrum with FAP values below 0.05 were extracted and the star flagged as variable for later human inspection. This method produced a total of 189 variable star candidates.
The third team used the TESS-AP automated analysis procedure created by Khalack et al. (2019). The light curves of stars with TIC effective temperatures in the range K were analysed using the Period04 package (Lenz & Breger, 2005) in an automated way. A star was flagged as a candidate if a signal was found in the mHz ( d -1) range with an amplitude 3 times that of the local noise. These candidates were then checked by eye before being included in a final list. The final count of variable star candidates was 78.
These three lists were then combined to produce a master list where each star and light curve was subjected to human inspection. An initial pass was made to remove false positive detections. A detection was determined to be false positive if the S/N of the high-frequency signal was below 4.0; if there was obvious contamination from a low-frequency harmonic series; or if the amplitude spectrum displayed obvious characteristics of either Sct stars (with many modes in the mHz range), sdBV stars (stars with pulsations in low and high-frequency ranges) or pulsating white dwarfs (modes with amplitudes significantly greater than those known in roAp stars). The final sample consisted of 163 stars.
This final sample was distributed amongst the members of the TESS Asteroseismic Science Consortium (TASC) Working Group 4 (WG4) for detailed analysis to confirm the presence of a positive roAp detection, and to extract rotation periods from the light curves. This process identified 12 new roAp stars previously unreported in the literature and 10 roAp stars discovered through TESS observations and reported by either Cunha et al. (2019) or Balona et al. (2019). There are also positive detections of pulsations in 31 roAp stars known prior to the launch of TESS, with 3 roAp stars where TESS did not detect pulsational variability as their low amplitude modes are below the TESS detection limit. Finally, we present 5 roAp candidate stars where there is inconclusive evidence as to whether the star is truly an roAp pulsator.
3 Spectroscopic observations
For a subset of our sample, we have made new spectroscopic observations to confirm or detect the chemically peculiar nature of the star. Most of these observations were obtained with the SpUpNIC long-slit spectrograph (Crause et al., 2016) mounted on the 1.9-m telescope of the South African Astronomical Observatory (SAAO). The observations were made in the blue part of the spectrum ( Å) with grating 4 which achieves a resolution of about 0.6 Å per pixel, with some stars also having a red spectrum ( Å) obtained with grating 6 with a resolution of 1.4 Å per pixel. The data were reduced in the standard way222http://www.starlink.ac.uk/docs/sc7.htx/sc7.html, with wavelength calibrations provided by arc spectra obtained directly after the science observation.
Where possible, we also observed some stars with the Southern African Large Telescope (SALT; Buckley et al., 2006), utilising the High Resolution Spectrograph (HRS; Bramall et al., 2010; Crause et al., 2014). HRS is a dual-beam spectrograph with wavelength coverage of Å and Å. The observations were obtained in either the medium () or high () resolution modes, and automatically reduced using the SALT custom pipeline, which is based on the European Southern Observatory’s (ESO) midas pipeline (Kniazev et al., 2016, 2017).
Finally, we also used the High Efficiency and Resolution Canterbury University Large Échelle Spectrograph (HERCULES) at the 1.0-m McLellan Telescope of the University of Canterbury Mt John Observatory (Hearnshaw et al., 2003). HERCULES has a wavelength coverage of Å with observations made at . The observations were automatically reduced using the HERCULES custom pipeline, MEGARA. We provide a log of all spectroscopic observations in Table 4.
Spectral classification with these observations was made by comparison with MK standard stars, following the procedure of Gray & Corbally (2009). The observations were normalised using an automated spline fitting procedure in the ispec spectral analysis software (Blanco-Cuaresma et al., 2014; Blanco-Cuaresma, 2019), with the MK standards plotted for comparison. With the classification as a starting point, we computed synthetic spectra using ispec to estimate effective temperatures. The synthesis used the spectrum code (Gray & Corbally, 1994) with a MARCS Gaia-ESO survey model atmosphere (Gustafsson et al., 2008; Gilmore et al., 2012) and a VALD line list (Ryabchikova et al., 2015). Spectra were synthesised with a fixed (cm s-2), solar metallicity and zero microturbulence and macroturbulence. Although these parameters are not refined for each star, they are adequate given the low resolution of most of the data. Spectra were synthesised in temperature steps of 100 K, with the result taken as the best fit to the wings of the observed Balmer lines.
4 Results
Here we present the results of our search and analysis of new and known roAp stars in TESS Cycle 1 data. We provide an overview of the targets to be discussed in Table 1 and divide this section, and the table, into subsections addressing new discoveries reported in this work, previous discoveries reliant on the TESS data, and TESS observations of known roAp stars. Finally, we provide a list of candidate roAp stars where the currently available data do not allow us to confirm the nature of these stars.
| TIC | HD/TYC | TESS | Spectral | Sectors | Pulsation frequency | Pulsation amplitude | ||
| name | mag | type | (K) | (d) | (mHz) | (mmag) | ||
| New TESS roAp stars found in this work | ||||||||
| 96315731 | 51203 | 10.18 | Ap SrEuCr | 7100 | 6,7 | |||
| 119327278 | 45698 | 8.08 | A2p SrEu | 8540 | 6,7 | |||
| 170586794 | 107619 | 8.47 | F5 p EuCr* | 6590 | 10 | |||
| 176516923 | 38823 | 7.12 | A5p SrEuCr | 7660 | 6 | |||
| 178575480 | 55852 | 8.83 | Ap SrEuCr | 7720 | 7 | |||
| 294266638 | 6021-415-1 | 9.74 | A7p SrEu* | 7230 | 8 | No signature | ||
| 294769049 | 161423 | 9.17 | Ap SrEu(Cr) | 7760 | 12,13 | |||
| 310817678 | 88507 | 9.60 | Ap SrEu(Cr) | 8230 | 9,10 | |||
| 356088697 | 76460 | 9.53 | A8p SrEuCr* | 7110 | 9-11 | No signature | ||
| 380651050 | 176384 | 8.19 | F0/F2 | 6490 | 13 | |||
| 387115314 | 9462-347-1 | 9.56 | A5 | 7660 | 13 | |||
| 466260580 | 9087-1516-1 | 11.64 | Ap EuCr* | 6830 | 13 | No signature | ||
| roAp stars previously discovered by TESS | ||||||||
| 12968953 | 217704 | 10.09 | A7p SrEuCr* | 7880 | 2 | No signature | ||
| 17676722 | 63773 | 8.61 | A3p SrEuCr* | 8320 | 7 | |||
| 41259805 | 43226 | 8.84 | A6p SrEu(Cr)* | 8360 | 1-8,10-13 | |||
| 49818005 | 19687 | 9.36 | F2pSrEu(Cr)* | 7300 | 4 | No signature | ||
| 152808505 | 216641 | 7.88 | F3p EuCr* | 6430 | 1 | ** | ||
| 156886111 | 47284 | 9.11 | A8p SrEuCr* | 7540 | 6,7 | |||
| 259587315 | 30849 | 8.69 | Ap SrCrEu | 7720 | 4,5 | |||
| 349945078 | 57040 | 8.92 | A2p EuCr | 7200 | 6-9 | |||
| 350146296 | 63087 | 9.17 | F0p EuCr* | 7680 | 1-13 | |||
| 431380369 | 20880 | 7.82 | Ap Sr(EuCr) | 8230 | 2,6,13 | |||
| TIC | HD/TYC | TESS | Spectral | Sectors | Pulsation frequency | Pulsation amplitude | ||
|---|---|---|---|---|---|---|---|---|
| name | mag | type | (K) | (d) | (mHz) | (mmag) | ||
| Known roAp stars prior to TESS launch | ||||||||
| 6118924 | 116114 | 6.77 | F0Vp SrCrEu | 7670 | 10 | No signature | ||
| 33601621 | 42659 | 6.60 | Ap SrCrEu | 7880 | 6 | |||
| 35905913 | 132205 | 8.50 | Ap EuSrCr | 7510 | 11,12 | No signal in TESS data | ||
| 44827786 | 150562 | 9.48 | F5Vp SrCrEu | 7350 | 12 | No signature | ||
| 49332521 | 119027 | 9.66 | Ap SrEu(Cr) | 6940 | 11 | No signature | ||
| 69855370 | 213637 | 9.19 | A (pEuSrCr) | 6610 | 2 | No signature | ||
| 93522454 | 143487 | 9.11 | A3p SrEuCr | 7110 | 12 | No signature | No signal in TESS data | |
| 125297016 | 69013 | 9.21 | Ap EuSr | 7010 | 7 | No signature | *** | |
| 136842396 | 9289 | 9.20 | Ap SrEuCr | 7750 | 3 | |||
| 139191168 | 217522 | 7.18 | A5p SrEuCr | 6920 | 1 | No signature | ||
| 146715928 | 92499 | 8.72 | A2p SrEuCr | 7730 | 9,10 | No signature | ||
| 167695608 | 8912-1407-1 | 11.69 | F0p SrEu(Cr) | 7180 | 1-4,6-13 | No signature | ||
| 168383678 | 96237 | 9.25 | A4p SrEuCr | 7410 | 9 | or | ||
| 170419024 | 151860 | 8.53 | Ap SrEu(Cr) | 6630 | 12 | No signature | ||
| 173372645 | 154708 | 8.43 | Ap SrEuCr | 6920 | 12 | No signal in TESS data | ||
| 189996908 | 75445 | 6.89 | Ap SrEu(Cr) | 7610 | 8,9 | No signature | *** | |
| 211404370 | 203932 | 8.56 | Ap SrEu | 7540 | 1 | |||
| 237336864 | 218495 | 9.24 | Ap EuSr | 8120 | 1 | |||
| 268751602 | 12932 | 9.98 | Ap SrEuCr | 7320 | 3 | No signature | ||
| 279485093 | 24712 | 5.72 | A9p SrEuCr | 7280 | 5 | |||
| 280198016 | 83368 | 6.06 | A8p SrCrEu | 7710 | 9 | |||
| 315098995 | 84041 | 9.20 | Ap SrEuCr | 7780 | 8,9 | |||
| 322732889 | 99563 | 8.47 | F0p Sr | 7940 | 9 | |||
| 326185137 | 6532 | 8.35 | Ap SrEuCr | 8500 | 3 | |||
| TIC | HD/TYC | TESS | Spectral | Sectors | Pulsation frequency | Pulsation amplitude | ||
| name | mag | type | (K) | (d) | (mHz) | (mmag) | ||
| Known roAp stars prior to TESS launch – continued | ||||||||
| 340006157 | 60435 | 8.72 | A3p SrEu | 8160 | 3,6-10,13 | |||
| 348717688 | 19918 | 9.12 | A5p SrEuCr | 7790 | 1,12,13 | No signature | ||
| 363716787 | 161459 | 10.01 | Ap EuSrCr | 7330 | 13 | |||
| 368866492 | 166473 | 7.73 | A5p SrCrEu | 7510 | 13 | No signature | ||
| 369845536 | 12.90 | A7p Eu(Cr) | 7930 | 13 | ||||
| 394124612 | 218994 | 8.31 | A3p Sr | 1 | ||||
| 394272819 | 115226 | 8.27 | Ap Sr(Eu) | 7630 | 11,12 | |||
| 402546736 | 128898 | 1.84 | A7p SrCrEu | 11,12 | ||||
| 434449811 | 80316 | 7.69 | Ap Sr(Eu?) | 8180 | 8 | |||
| 469246567 | 86181 | 9.15 | Ap Sr | 7210 | 9,10 | |||
| Candidate roAp | ||||||||
| 1727745 | 113414 | 7.22 | F7/F8 | 6150 | 10 | |||
| 3814749 | 3748 | 9.73 | A0/1 IV/V | 8420 | 3 | |||
| 158637987 | 10330 | 8.91 | A9 | 7180 | 2,3 | No signature | ||
| 324048193 | 85892 | 7.74 | Ap Si | 11950 | 12,13 | |||
| 410163387 | 76276 | 9.50 | Ap SrEuCr | 7480 | 8 | No signature | ||
Throughout this section, to keep homogeneity of the results, we present the numerical results of a single team, hereafter named the reference team. These results have been corroborated by the WG4 contribution to the analysis of the target stars. Where discrepancies were identified between the reference team and the WG4 members, secondary checks were conducted to ensure accurate results are presented.
To avoid repetition, we outline here the process by which each star was analysed in detail, unless a different method is detailed in the appropriate star’s subsection. Where available, we combined multi-sector observations to produce a single light curve for analysis. Using the original PDC_SAP data, we calculated a Discrete Fourier Transform, following Kurtz (1985) in the low-frequency range (to 0.11 mHz; 10 d -1) in the search for rotational variability. Where present, we fitted a harmonic series by non-linear least squares to determine the rotation frequency. Where we found a harmonic to have a stronger signal, we derived the rotation frequency from that signal as it can be more precisely determined. Where no rotational variability was found, we also checked the SAP light curve for signs of rotation as the SPOC pipeline can mistakenly remove low-frequency astrophysical signal.
Subsequently, with the astrophysical information extracted, we removed the rotation signal and any instrumental artefacts through iterative pre-whitening of the light curve to a noise level determined in the range mHz ( d -1). This serves to make the noise in the amplitude spectrum white when considering the errors on pulsation signals. Any pulsation signals found were extracted through non-linear least squares fitting. Both the derived rotation period and the pulsation frequency(ies) for each star are listed in Table 1. We provide only the presumed pulsation mode frequencies and not rotationally split sidelobes; any sidelobes detected are mentioned in the text, and indicated on the appropriate figure.
Since the launch of TESS, there have been two papers addressing the discovery of roAp stars in the new data set. The TESS Ap first light paper (Cunha et al., 2019) focused on the analysis of the first and second TESS sectors, while a paper by Balona et al. (2019) analysed data from sectors 1-7. We do not present an in depth analysis of the stars addressed in those papers again, unless there are more data available, or significant differences in the results were found. We do, however, include these stars in Table 1 to provide a complete inventory of TESS observations of roAp stars in Cycle 1.
4.1 New TESS roAp stars
We classify the following stars as new roAp stars based on the presence of high frequency pulsation in the target and either an Ap spectral classification, the presence of multiplets in the amplitude spectrum split by the stellar rotation frequency, or Strömgren-Crawford indices that indicate a chemically peculiar star.
4.1.1 TIC 96315731
TIC 96315731 (HD 51203) is identified in the literature as an CVn with a spectral type of Ap SrEuCr (Houk, 1982). The star is reported to have a mean magnetic field modulus of kG (Chojnowski et al., 2019).
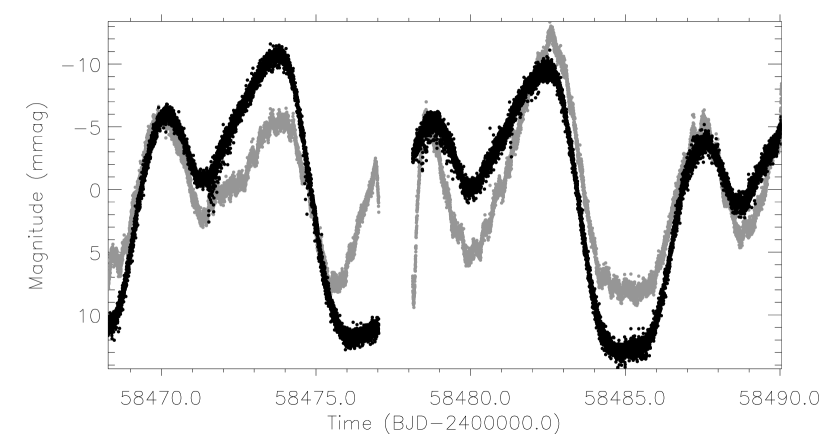
TIC 96315731 was observed by TESS during sectors 6 and 7, and shows clear signatures of rotation and pulsation, making this the first report that TIC 96315731 is a new roAp star, although (Kobzar, 2020) listed it as a candidate roAp star. From the combined TESS light curve, we measure a rotation period of d which is similar to the value of d presented by Netopil et al. (2017). We show a light curve phased on the rotation period in the top panel of Fig. 1.


At high frequency, the star shows an obvious pulsation signal at mHz ( d -1) which is flanked by two sidelobes with significant amplitude (S/N) separated from the pulsation by the rotation frequency, and two further sidelobes which have lower significance (S/N) separated by twice the rotation frequency. This is indicative of either a distorted dipole mode, or a quadrupole mode, although an analysis of the pulsation amplitude and phase as a function of rotation phase favours a distorted quadrupole mode. In the case of a distorted quadrupole mode, the pulsation phase does not change by the expected rad when a pulsation node crosses the line of sight, but rather results in a phase blip (see e.g., Holdsworth et al., 2016, 2018b, Shi et al. submitted). These peaks are shown in the bottom panel of Fig. 1.
4.1.2 TIC 119327278
TIC 119327278 (HD 45698) was initially classified as an Ap star by Bidelman & MacConnell (1973) due to the presence of Sr absorption, with a revised spectral type of A2 SrEu provided by Renson et al. (1991). There is little information about this star in the literature other than a rotation period of 1.085 d (Netopil et al., 2017), and a lack of pulsation signal reported by Joshi et al. (2016).
TIC 119327278 was observed during sectors 6 and 7. The data show the star to have a rotation period of d (Fig. 2) which is in agreement with the literature. Further to the harmonic series, we identify another mode that is typical of the Sct stars, at a frequency of mHz ( d -1). Although it was not expected that Ap stars show these low-overtone modes as a result of magnetic suppression (Saio, 2005), Murphy et al. (2020) have recently shown the existence of Sct and roAp pulsations in the same star.


The amplitude spectrum at high frequency shows a multiplet of 4 significant components ( is in the noise) of a presumed quintuplet (Fig. 2), with the highest peak representing the pulsation mode at a frequency of mHz ( d -1), which was also identified by Kobzar (2020). The components are split by the rotation frequency of the star as a result of oblique pulsation, thus confirming this star as a new roAp star. Given the presence of the low-overtone mode in TIC 119327278, it may be the second example of a Sct-roAp hybrid star. Given the low amplitude of the pulsation mode and the relatively short rotation period, analysing the pulsation amplitude and phase over the rotation period results in inconclusive results with regards to the identification of the mode degree. A detailed study, beyond the scope of this work, is needed to resolve this problem.
4.1.3 TIC 170586794
TIC 170586794 (HD 107619) was classified as a possible metallic-line late-A type star by Houk (1982). The star was later defined to be an F0 type by Cannon & Pickering (1993) and an F0 type Del star by Perry (1991). It is not a frequently studied object with the literature being mainly concerned with H333Throughout we use the H notation to refer to the Strömgren-Crawford index to avoid confusion between angle of magnetic obliquity which is given the symbol . photometry. Among these studies, Perry & Christodoulou (1996) gave dereddened Strömgren colour indexes and metallicity of the star, while Perry (1991) provided , , colour indexes and H index of 0.303, 0.226, 0.432 and 2.682, respectively. The temperature of the star was derived as K by Stevens et al. (2017) and K by Ammons et al. (2006) from photometric investigations.
TESS observed TIC 170586794 during sector 10. The light curve shows the star to have a rotation period of d, which has a double wave nature (Fig. 3). At high frequency, this star shows a single pulsation mode at mHz ( d -1; Fig. 3). With both the presence of a rotationally modulated light curve, and a high frequency pulsation, we revisited this star spectroscopically. Our SAAO classification spectrum (Fig. 53) shows this star to have overabundances of Eu ii and Cr ii, thus making it chemically peculiar. The Balmer lines in the spectrum are well matched to an F5 V star, thus making this a cool F5p EuCr star, and confirming it as a new roAp star and making it one of the coolest roAp stars to date.


4.1.4 TIC 176516923
TIC 176516923 (HD 38823) has several classifications in the literature: A5 SrEu (Vogt & Faundez, 1979; Hensberge et al., 1981); a strongly magnetic A5p Sr star (Chen et al., 2017); and A5 SrEuCr (Renson & Manfroid, 2009). Sikora et al. (2019a) confirmed the star as a magnetic CP star and provided several abundance measures and estimated the age to be (Gyrs). Estimates of the effective temperature range from 6600 K to 7700 K, the latter of which agrees with the TIC temperature provided in Table 1. values range from about 3.7 (cm s-2) to 4.6 (cm s-2), with most rotational velocity measurements suggesting a km s-1.
There are several studies related to the magnetic structure of TIC 176516923. The strong magnetic field of the star was first discovered by Romanyuk et al. (2016) after three observations made in 2009, with a value of 1.74 kG. They found a variable radial velocity within a small interval around km s-1 which is significantly different from the result of 1.40 km s-1 by Grenier et al. (1999). Based on this result, they concluded that such differences in radial velocity could be an indication of a variability on a scale of up to several years or a decade. Kudryavtsev et al. (2007) performed further spectroscopic observations and calculated radial velocities ranging from km s-1 to km s-1. Therefore, they suspected that the star is in a binary system.
The rotation period of the star has been under debate for several years, with fits to both photometric and magnetic data being used to determine it (Hensberge et al., 1981; Kudryavtsev et al., 2006; Kudryavtsev & Romanyuk, 2012). Most recently, Bernhard et al. (2020) calculated the period of the star as d which is representative of the other periods reported.
TIC 176516923 was observed by TESS in sector 6 only. The data for this star provides an example where the SPOC pipeline has interfered with the astrophysical signal of the rotation signature, and injected noise into the light curve. We demonstrate this in Fig. 4 where the top panel compares the PDC_SAP (grey) data to the SAP data (black). Using the SAP data, we extract a rotation period of d.


The pulsation spectrum of this star consists of a quadrupole quintuplet with a missing central component, a dipole triplet also with a missing central component, and a further dipole triplet with a significant central component. Furthermore, there are two peaks with significant amplitude (labelled by the arrows in Fig. 4) that do not show any multiplet components. The pulsation modes are found at mHz ( d -1), mHz ( d -1), and mHz ( d -1).
The difference in the multiplet structures is puzzling in this star. Although different modes have different depth pulsation cavities, one would expect both dipole modes to show very similar relative amplitudes since they are governed by the geometry of the star through , the inclination angle, and , the angle of magnetic obliquity. This difference may suggest different pulsation axes for the two dipole modes (as suggested for KIC 10195926; Kurtz et al. 2011). However, it is likely that we are seeing a depth dependence on the geometry which is being affected by different limb darkening weighting due to the stratified atmosphere of the star, as is proposed to be the case for HD 6532 (Kurtz & Holdsworth, 2020), and previously observed with time-resolved spectroscopic studies that resolved the vertical structure of pulsations by studying lines with different formation heights (Kochukhov, 2006; Freyhammer et al., 2009). Another option is that the difference may result from the modes suffering different magnetic distortions in the atmosphere (Sousa & Cunha, 2011; Quitral-Manosalva et al., 2018), due to their slightly different frequencies. Either way, the nature of these different multiplet structures is not clear, which clearly warrants a further, in-depth, study with additional multi-colour observations and detailed modelling.
4.1.5 TIC 178575480
TIC 178575480 (HD 55852) has a spectral classification of Ap SrEuCr (Houk & Swift, 1999a) and according to the TIC has an effective temperature of 7720 K. Netopil et al. (2017) provide a rotation period of 4.775 d, with Masana et al. (1998) providing Strömgren-Crawford photometric indices of , , and H.
This star was observed in sector 7, allowing us to measure a rotation period of d. A phase folded light curve is shown in the top panel of Fig. 5.


There are two pulsation modes seen in this star: a singlet at a frequency of mHz ( d -1), and a triplet with a central frequency of mHz ( d -1). Since the two modes show different multiplet structures, it is logical to assume that the modes are of different degree, however their identification is unclear. Given that the large frequency separation in roAp stars ranges between Hz, the separation of the two modes, Hz, is plausibly 1.5 times the large frequency separation. If this is the case, the two observed modes would be of different degree, as the different structures suggest. If the separation is twice the large frequency separation, the two modes seen would be of the same degree, with the same structure. We therefore suggest the large frequency separation in this star is about Hz, but note modelling of this star are required to confirm this.
4.1.6 TIC 294266638
TIC 294266638 (TYC 6021-415-1) is a star with no mention in the literature, other than a Gaia parallax measurement of mas, implying a distance of pc (Gaia Collaboration et al., 2016, 2021).
We obtained a spectrum for this star with the SpUpNIC instrument to confirm its nature as an Ap star (Fig. 54). The spectrum shows enhancements of Sr and Eu leading to a classification of A7p SrEu. There are signs of Cr in the spectrum at 4111 Å, but no other lines of this element are clearly enhanced.
This star was observed in sector 8. There is no evidence of rotational variability in the TESS light curve, however there are clear pulsation signals, as shown in Fig. 6. We extract two pulsation modes from the amplitude spectrum, at mHz ( d -1) and mHz ( d -1). The separation of these two modes, Hz, is plausibly the large frequency separation for this star. After prewhitening these peaks, there is still evidence of excess power in the residual spectrum. This is indicative of phase/amplitude variability (e.g., Holdsworth, 2021). Furthermore, there is evidence of two additional modes at low amplitude around 1.6 mHz which are significant. However, given the broad nature of the peaks, a clear frequency value cannot be determined.


4.1.7 TIC 294769049
TIC 294769049 (HD 161423) was classified as Ap SrEu(Cr) by Houk & Cowley (1975), and listed in the catalogue of Renson & Manfroid (2009) with a spectral type of A2 SrEu. TIC 294769049 has been the target in two searches for rapid variability; both Martinez & Kurtz (1994b) and Joshi et al. (2016) returned null results.
TESS observed this star during sectors 12 and 13, providing a light curve with a time base of d. From this we measure a rotation period of d, and show a phase folded light curve in Fig. 7. Analysis of the light curve at high frequency shows a single pulsation mode at mHz ( d -1; Fig. 7). The lack of an obliquely split multiplet suggests that either the pulsation axis is aligned with the rotation axis (thus , assuming the original oblique pulsator model), despite the significant rotational variation, or the mode is an undistorted radial mode. The former would imply that the spots causing the mean light variation are not close to the pulsation pole (Kochukhov et al., 2004; Alecian & Stift, 2010), or that the pulsation axis is aligned with the rotation axis, rather than the magnetic axis (Bigot & Dziembowski, 2002).


4.1.8 TIC 310817678
TIC 310817678 (HD 88507) was classified as Ap SrEu(Cr) by Houk (1978) and in the catalogue of Renson & Manfroid (2009) it is quoted as an Ap SrEu star. There is only one evaluation of the atmospheric parameters given by the TIC: K and (cm s-2).
TESS observed this star in sectors 9 and 10, providing a 51.8 d time base. We measure a rotation period of d (Fig. 8). The pulsation spectrum in this star is rich, consisting of a dipole triplet centred on mHz ( d -1), a quadrupole quintuplet with missing sidelobes centred on mHz ( d -1), and another dipole with a central frequency at mHz ( d -1). The two dipole modes are separated by Hz which is plausibly the large frequency separation for this star. Kobzar (2020) identified this star as a candidate roAp star.
The high-frequency dipole sidelobes are unlike those seen in the other multiplets: they form doublets. We suspect that this is a signature of magnetic distortion since despite the sidelobes having greater amplitude than the low-frequency dipole mode, the central component is entirely absent. This star is another example of how the multiplet structures vary for the same degree mode.


4.1.9 TIC 356088697
TIC 356088697 (HD 76460) was classified as an Ap Sr by Houk & Cowley (1975) with Elkin et al. (2012) measuring a magnetic field strength of kG through partial Zeeman splitting of Fe lines. The authors also determined the effective temperature to be K and km s-1, although this value is an upper limit due to the resolution limit of their data.
Observed in three consecutive TESS sectors (9-11), this star shows no signature of rotation. To confirm its Ap nature, we obtained a spectrum with SpUpNIC and derived a spectral class of A8p SrEuCr (Fig. 55).
A single pulsation signal is found in this star at a frequency of mHz ( d -1) with an amplitude of mmag (Fig. 9), which was also noted by Mathys et al. (2020b). This mode does not show any amplitude or phase variability over the observing window, which would be consistent with a rotation period much longer than the observing window (Mathys et al., 2020b). The single mode in this star is at a frequency commonly associated with the Sct stars (Bowman & Kurtz, 2018), but it is uncommon to find just a single frequency. Therefore, with just a single mode and an Ap stellar classification, this star can be classed as an roAp star, making it the longest period roAp star, after HD 177765, which was discovered by Alentiev et al. (2012) with the mode frequency later refined to be mHz ( d -1; Holdsworth, 2016). Given that the mode frequency overlaps with the Sct frequency range, modelling of the pulsation is needed to confirm the overtone is representative of an roAp pulsation.

4.1.10 TIC 380651050
TIC 380651050 (HD 176384) has no in-depth studies in the literature. Reiners & Zechmeister (2020) provide a mass of M⊙ and K, with Paunzen (2015) giving Strömgren-Crawford photometric indices of , , and H, which are consistent with a cool Ap star.
TIC 380651050 was observed in sector 13. There are two harmonic series at low frequency which both give plausible rotation periods; they are: d and d. We take the highest amplitude signal to be the rotation frequency (Fig. 10), but suggest further observations are obtained to corroborate this. One of the two periods may be the result of binarity or contamination by a background star; spectroscopic observations will provide insight into this.


Two high frequency pulsation modes are found in this star: mHz ( d -1) and mHz ( d -1) which are separated by Hz (Fig. 10). This separation is plausibly half of the large frequency separation, and would imply the that the star is quite evolved, possibly beyond the main sequence. This star was also identified in Kobzar (2020) as a candidate roAp star.
4.1.11 TIC 387115314
TIC 387115314 (TYC 9462-347-1) has a spectral classification of A5 (Jackson & Stoy, 1954), and has atmospheric parameters K, surface gravity (cm s-2), and metallicity [M/H] determined by Kordopatis et al. (2013) on the basis of RAdial Velocity Experiment (RAVE) data.
The star was observed in sector 13, from which we derive a rotation period of d (Fig. 11). We find a rich pulsation spectrum for this star at high frequencies, also seen by Kobzar (2020). Although we have a well determined rotation period, and significant mean light variations, the modes do not show significant rotationally split sidelobes which implies we see mostly one pulsation pole over the entire rotation period. The pulsation frequencies that we identify are: a singlet at mHz ( d -1), two components of a triplet with the mode at mHz ( d -1), a triplet centred on mHz ( d -1) and another triplet centred on mHz ( d -1). These modes, with their multiplet components, are shown in Fig. 11.


The separation of the three highest modes is Hz, with the lowest frequency two modes separated by Hz. Since we cannot determine the degree of the modes showing multiplets, due to the low amplitude of the obliquely split sidelobes, we are unable to determine if the separation of Hz is the large frequency separation, or half of it. The separation of Hz is plausibly the small frequency separation for this star.
4.1.12 TIC 466260580
TIC 466260580 (TYC 9087-1516-1) is a relatively obscure star with no previous reports of any variability. The RAVE survey (Kunder et al., 2017) obtained K, (cm s-2) and [M/H] which are consistent with the TIC values, although the metallicity is strikingly low for an Ap star. These suggest the star is spectral type F3, which is consistent with the Tycho . However, the is uncertain; for example, McDonald et al. (2017) obtained K from SED fitting, while Gaia Collaboration et al. (2018) give a value around 7000 K.
We have also obtained a spectrum of this star with the HRS on SALT. From this, we obtain K, (cm s-2) and [Fe/H] , which are consistent with the RAVE results. We estimate a spectral type of Ap EuCr, and note that rare earth elements are enhanced in the region around 6150 Å, confirming the star to be an Ap star. A full abundance analysis is beyond the scope of this work, but is required to address the low metallicity in this star.
The TESS data, obtained in sector 13, do not show clear signs of rotational variability, but exhibit many low-frequency variations. The pulsation signal is clear in this star, at a frequency of ṁHz ( d -1; Fig. 12).

4.2 roAp stars previously discovered by TESS
4.2.1 TIC 12968953
TIC 12968953 (HD 217704) star was observed in TESS sector 2 and was analysed by Cunha et al. (2019). We find no significant differences between our analysis here and that previously presented. We refer the reader to the aforementioned publication for the details on TIC 12968953. However, we obtained a new spectrum of this target. TIC 12968953 was classified as Ap Sr by Houk (1982); with our SAAO spectrum (Fig. 56), we classify this star as A7p SrEuCr, and determine a temperature of K through comparison with synthetic spectra.
4.2.2 TIC 17676722
TIC 17676722 (HD 63773) was observed in sector 7, and reported as an roAp star by Balona et al. (2019). We present a revised rotation period of d, which was derived by fitting a 10-component harmonic series to the data. As in Balona et al. (2019) we find four significant peaks which we interpret to be a single quadrupole pulsation mode ( mHz; d -1) and 3 sidelobes split by the rotation frequency of the star.
4.2.3 TIC 41259805
TIC 41259805 (HD 43226) was reported by both Cunha et al. (2019) and Balona et al. (2019) to be an roAp star, based on 7 sectors of data. There are now 12 sectors of data available for this star from Cycle 1, with no sector 9 data. With this extended time base, we are able to report a more precise rotation period of d; Fig. 13).
There is clear frequency variability in this star, as seen by the ragged nature of the pulsation mode at mHz ( d -1) in Fig. 13, but not in the mode at mHz ( d -1). The transient nature of the modes explains the presence of the peak found by Cunha et al. (2019), and the lack of its detection by Balona et al. (2019). We note that here the amplitude is about half that reported in Cunha et al. (2019) as a result of the power being spread over a broad frequency range. Since the frequency variability is only seen in one mode, it is likely to be intrinsic to the star, rather than caused by binary motion, for example. This type of frequency variability seems common in the roAp stars studied with high-precision data (Holdsworth, 2021), with a possible explanation of stochastic perturbations of classical pulsators (Avelino et al., 2020; Cunha et al., 2020), although this is currently untested.


We have obtained a classification spectrum of this star, since the literature class of A0 SrEu implies a hot star which is uncommon amongst the roAp stars. With our spectrum (Fig. 58) we derive a spectral class of A6p SrEu(Cr), with Balmer and metal lines indicating an A6p star.
4.2.4 TIC 49818005
TIC 49818005 (HD 19687) was given the spectral type A9 IV/V in the Michigan Catalog (Houk & Swift, 1999b). Conversely, Balona et al. (2019) list a spectral type of A3, which is inconsistent with the 6829 K temperature they cite (from Stevens et al., 2017). There is no information on its peculiarity, if any, but Balona et al. (2019) found a significant high frequency at 1.6424 mHz (141.9 d -1), suggesting this could be an roAp star. We obtained a new low-resolution classification spectrum to clarify this point (Fig. 59). We find the star to be an F2p SrEu(Cr), with Balmer and metal lines indicating an F1p star, and confirm the presence of rare earth element lines in a high-resolution SALT spectrum. With the high-resolution spectrum, we determine K, which is consistent with the TIC value and previous determinations.
The TESS observations of this star were collected in sector 4, which were analysed by Balona et al. (2019). We present a slightly different value for the pulsation frequency in this star, mHz ( d -1), as shown in Fig. 14. We suspect this difference is a result of the data treatment at low-frequency, which is not discussed in Balona et al. (2019).

4.2.5 TIC 152808505
TIC 152808505 (HD 216641) was observed in TESS sector 1 and was analysed by Cunha et al. (2019). We find no significant differences between our analysis here and that previously presented, so we refer the reader to the aforementioned publication for the details on this star, but provide the derived rotation period and pulsation frequencies in Table 1.
Since the only classification for this star is F3 IV/V (Houk, 1978), we obtained a new spectrum of this target with the SpUpNIC instrument at SAAO (Fig. 60). We classify this star as F3p EuCr, and determine a temperature of K through comparison with synthetic spectra. This confirms this star to be an roAp star.
4.2.6 TIC 156886111
TIC 156886111 (HD 47284) was observed in sectors 6 and 7, and originally reported as an roAp star by Balona et al. (2019). The spectral type of this star is commonly given in the literature as A5 SiEuCr (Houk, 1978). However, we have obtained a new spectrum of this star (Fig. 61) which shows this star to be an A8p SrEuCr star (showing Sr rather than Si).
We precisely determine the rotation period of this star to be d through analysis of the mean light variations, which is in line with the literature value (Watson et al., 2006). After the rotation signal, the dominant mode in this star is at mHz ( d -1). This may be another example of a Sct-roAp hybrid, as discussed for TIC 158637987.
We find no more pulsation modes in the data than were presented by Balona et al. (2019); we find a singlet at mHz ( d -1), a doublet which is presumed to be a dipole triplet with a missing central component at mHz ( d -1), and a quadrupole quintuplet centred on a frequency of mHz ( d -1).
4.2.7 TIC 259587315
TIC 259587315 (HD 30849) was classified as an Ap SrEuCr by Houk (1978), and has measures of 7720 K in the TIC, 7250 K (Glagolevskij, 1994), 8187 K (North et al., 1997) and 8000 K (Netopil et al., 2017).
The TESS data for this star, collected in sectors 4 and 5, have been analysed independently by Balona et al. (2019) and Sikora et al. (2019c) who both announced this star to be an roAp star, but provided conflicting rotational periods. Previous searches for high-frequency variability by Martinez & Kurtz (1994b) and Hubrig et al. (2000) were unsuccessful.
Here, we use the SAP data from sector 4 (since the pipeline has distorted the rotation signal) and the PDC_SAP data from sector 5 to determine a rotation period of d. This is similar to the first reported period in the literature ( d; Hensberge et al. 1981) and that reported by Balona et al. (2019), but is twice the period reported by Sikora et al. (2019c), who have detected the first harmonic of the true period. It is not ideal to mix the SAP and PDC_SAP data, but in this scenario such a procedure provides better results.
The star shows several pulsation modes: a triplet with a missing sidelobe, a closely spaced singlet (denoted by the dashed vertical line in Fig. 15), followed by two quintuplets. There appears to be further low amplitude modes between the multiplet groups, but at low S/N. The separation between the triplet and the singlet is Hz. The spacing between the two quintuplets is Hz which is plausibly the large frequency separation for this star, indicating it is evolved.


4.2.8 TIC 349945078
TIC 349945078 (HD 57040) was classified as A2 EuCr by Renson & Manfroid (2009). The TIC reports K, though literature values for this parameter range from as low as K (Schofield et al., 2019) to as high as K (Ammons et al., 2006). Elkin et al. (2012) reported the presence of a kG magnetic field on the star. Martinez & Kurtz (1994b) were unable to detect oscillations from ground-based observations, so it was not identified as an roAp star until Balona et al. (2019) used TESS data to detect two oscillation frequencies.
This star was observed in sectors 6-9, thus we revisit this star to provide a more detailed analysis of the variability with the availability of more data. To extract the rotation signal, we used the SAP data since the rotation signature in the PDC_SAP data has been significantly altered. This was evident upon visual inspection. We fitted a four element harmonic series to derive a rotation period of d (Fig. 16). This is different from that presented by Balona et al. (2019) by a factor of two. We confirm our rotation period through the analysis of the oblique pulsations below.


For the pulsation analysis, we used the PDC_SAP data and prewhitened the light curve to remove the rotation signal and instrumental artefacts. As a final correction, we removed outlying points. The resulting amplitude spectrum shows two groups of peaks composed of a quintuplet and a triplet (Fig. 16). The two modes in this star are separated by Hz which is plausibly the large frequency separation.
4.2.9 TIC 350146296
TIC 350146296 (HD 63087) was classified as A7 IV by Houk & Cowley (1975). However, due to the clearly spotted nature of this star, and the pulsation variability, we obtained several spectra with the SpUpNIC instrument, and find this star to be an F0p EuCr star (Fig. 62).
TIC 350146296 was first reported as an roAp star by Cunha et al. (2019), with Balona et al. (2019) providing an analysis of extra sectors of data. There are now 13 sectors for this star from Cycle 1 which we analyse here. With the extended time base (357 d) we derive a rotation period of d. The phased light curve, shown in Fig. 17, reveals a complex spot structure on this star.


There are five pulsation modes in TIC 350146296, all of which have been split into a multiplet by oblique pulsation. The multiplet structures allow us to conclude that the modes are alternating dipole and quadrupole modes, with three dipole modes and two quadrupole modes. All frequencies in this star show signs of variability, making precise frequency extraction difficult. All the modes are split by Hz which, given the multiplet structures, we understand to be half the large frequency separation. Shi et al. (submitted) have conducted an extensive study on this star, to which we refer the reader for further details, although we provide the pulsation frequencies and rotation period in Table 1 here.
4.2.10 TIC 431380369
TIC 431380369 (HD 20880) was identified as a chemically peculiar star by Houk & Cowley (1975) who gave the classification of Ap Sr(EuCr). It was later reported by Cunha et al. (2019) to be a new roAp star from the analysis of the TESS sector 2 data, after Joshi et al. (2016) presented a null result in the search for pulsations. The star was subsequently observed in sectors 6 and 13, where the significant gaps serve to produce a complicated window function. With the extended data, we are able to derive a more precise rotation period for this star of d.
This star shows a complex pulsation spectrum, as can be seen in Fig. 18, which is not helped by the significant gaps in the data. The mode at mHz ( d -1) is significantly broad, suggesting frequency and/or amplitude variability. The mode at mHz ( d -1) also shows amplitude variability, but includes a rotationally split sidelobe at . The four significant modes are listed in Table 1. We extract two extra modes, and the sidelobe, in addition to those reported by Cunha et al. (2019). This is likely a combination of the longer data set where the noise is slightly lower, and the mode lifetime of the pulsations seen in this star. A detailed study, on a rotation period-by-rotation period basis, of this star is required to extract the full information from the TESS data.

4.3 Known roAp stars prior to TESS launch
In this section, we present an analysis of the roAp stars which were known prior to the launch of the TESS mission. As with the new roAp star discoveries, we present only new information on stars which have already been discussed in the literature.
4.3.1 TIC 6118924
TIC 6118924 (HD 116114) was observed in sector 10. The star was classified as F0Vp SrCrEu by Abt et al. (1979) and was identified as an roAp star by Elkin et al. (2005a) who discovered variability in the Eu ii lines with a period around 21 min (0.790 mHz; 68.26 d -1). A search for photometric variability after the spectroscopic detection by Lorenz et al. (2005) returned a null result at an amplitude level of about 0.5 mmag in Johnson .
The rotation period of TIC 6118924 was determined to be 27.6 d by Landstreet & Mathys (2000) which is longer than the TESS data span. We see no evidence of this period in the light curve. We detect one significant frequency at mHz ( d -1) which is consistent with that found in the spectroscopic study (Fig. 19). This is the first photometric detection of the pulsation in this star.

4.3.2 TIC 33601621
TIC 33601621 (HD 42659) was classified as Ap SrCrEu by Houk & Smith-Moore (1988). There are several occurrences of the stellar parameters in the literature with ranging between K (Kochukhov & Bagnulo, 2006; Balona et al., 2019). Kochukhov & Bagnulo (2006) also provides and M⊙. There are also several measures of which provide an average of kG (Kochukhov & Bagnulo, 2006; Hubrig et al., 2006; Bagnulo et al., 2015).
This star was discovered to be an roAp star by Martinez et al. (1993b) with later observations providing more detailed results by Martinez & Kurtz (1994a). The TESS sector 6 observations have been previously analysed by Balona et al. (2019), with a more detailed analysis presented by Holdsworth et al. (2019), analysing the dipole triplet. We do not present a re-analysis of the same data here, but refer the reader to the previous literature. It is worthy of note, however, that TIC 33601621 is the only roAp star known to be a member of a spectroscopic binary (SB1) system (Hartmann & Hatzes, 2015; Holdsworth et al., 2019).
4.3.3 TIC 35905913
TIC 35905913 (HD 132205) was classified as an Ap EuSrCr star by Houk & Cowley (1975) and later discovered by Kochukhov et al. (2013) to be an roAp star through time-resolved spectroscopic analysis. Their data revealed a pulsation at d -1 with an amplitude less than 100 m s-1. The star had previously been monitored photometrically for pulsations many times (Martinez & Kurtz, 1994b), but no signal was detected which is unsurprising given the small amplitude in the spectroscopic data.
TESS observed TIC 35905913 during sectors 11 and 12. The PDC_SAP light curves for these two sectors differ significantly. A clear rotation signature can be seen the sector 12 data, whereas the sector 11 data have a greatly reduced amplitude attributed to this variability. On inspection, the contamination factor for this star is high, at 0.28, with the contaminating star about 18 arcsec away. According to Gaia DR2 Gaia Collaboration et al. (2018), the G-band magnitude difference is 3.25 mag which suggests, under the assumption of negligible extinction differences, that the contaminant star is a mid G-type star.
By fitting a harmonic series of 5 components to the SAP sector 11 and PDC_SAP sector 12 data simultaneously, we derive a rotation period of d (derived from in Fig. 20). Again, we reiterate that mixing the raw and pipeline corrected data is not ideal, but provides the best results in this case. After the removal of this harmonic series, there are clear signs of variability remaining in the data at low frequency ( and in the figure). The source of variability is uncertain given the proximity of the contaminating source. In fitting and removing a harmonic series to , power remains around these frequencies in the amplitude spectrum, indicating an unstable frequency/amplitude which is common with star spots that change in size. This leads us to conclude that the contaminant is the source of the harmonic series. The origin of required further investigation, but could be a g mode in the Ap or contaminant star.


We detect no pulsation in the roAp range to a limit of about 25 mag in the combined PDC_SAP flux data. This is unsurprising given the broad red bandpass of the TESS data, coupled with the low pulsation amplitude in spectroscopy.
4.3.4 TIC 44827786
TIC 44827786 (HD 150562) was classified as F5Vp SrCrEu by Buscombe & Foster (1995) and discovered to be an roAp star by Martinez & Kurtz (1992) with a period of 10.75 min.
The TIC gives = 7350 K, which is consistent with that obtained using H photometry from Joshi et al. (2016) and the Moon & Dworetsky (1985) calibration. However, several literature sources give a significantly lower value: 6390 K (Gaia Collaboration et al., 2018), 6620 K (McDonald et al., 2017) and 6820 K (Ammons et al., 2006). The star appears to be slowly rotating, with Elkin et al. (2008) obtaining a km s-1 and Mathys et al. (2020b) finding no obvious signature of rotational variation from TESS data. This star shows variation of the mean magnetic field modulus from 4.7 to 5.0 kG (Mathys, 2017), with the mean longitudinal field changing between 1.2 and 1.7 kG (Bagnulo et al., 2015; Mathys, 2017).
The mean magnetic field modulus was found to be 4.8 kG (Kudryavtsev & Romanyuk, 2003), while more recently Bagnulo et al. (2015) obtained a value of 2 kG.
We detect two significant modes of pulsation in the TESS sector 12 data (Fig. 21). The highest amplitude mode at a frequency of mHz ( d -1) is separated from the previously known pulsation mode ( mHz; d -1) by Hz which is plausibly the small frequency separation.

4.3.5 TIC 49332521
TIC 49332521 (HD 119027) is classified on SIMBAD as an CVn star, but Martinez et al. (1998a) found no rotational signal, and suggested a period of greater than 6 months if there is any rotational variation. Mathys et al. (2020b) also found no rotational variation. Its spectral type is Ap SrEu(Cr) (Houk, 1982). It has been known to be an roAp star for thirty years (Martinez & Kurtz, 1991b), and has a rich p-mode oscillation spectrum (Martinez et al., 1998b). Magnetic field properties have been measured for HD 119027 (Mathys, 2017), with a measured value for of 0.5 kG, and multiple measurements around 3.17 kG.
TESS observed HD 119027 in sector 11, with multiple oscillation frequencies discussed by Mathys et al. (2020b). Here we detect 7 independent modes in TIC 49332521. Six of these modes are almost the same as presented by Martinez et al. (1998b): their five roughly equally split modes (separated by Hz) plus their mode. Our additional mode is found at a lower frequency ( mHz; d -1) which is separated from the next mode by Hz. This means that modes spanning about five radial orders are not excited to a detectable amplitude in this star, which although is unusual, has been seen in other roAp stars, an excellent example of this being TIC 139191168 (HD 217522; Section 4.3.10).
We show in Fig. 22 the amplitude spectrum and the identified modes. Those marked by vertical dotted lines are separated by multiples of Hz while those with dashed lines do not fit this pattern. We suspect, given the stellar parameters, that this separation is half of the large frequency separation, such that Hz for TIC 49332521. The separation between the two highest amplitude modes (Hz) could represent the small frequency separation in this star, although this value is different from the value of 1.95 Hz proposed by Martinez et al. (1998b).

4.3.6 TIC 69855370
TIC 69855370 (HD 213637) was observed in sector 2. The star is classified as A (pEuSrCr) by Houk & Smith-Moore (1988) and was identified as an roAp star by Martinez et al. (1998c) who reported the discovery of two pulsation modes with periods around 11-12 min, while acknowledging that the frequency values identified needed to be confirmed due to the presence of 1 d -1 aliases in the data. Based on the TESS data, Cunha et al. (2019) confirmed the presence of two pulsation modes in the same period range, the first corresponding to one of the modes identified by Martinez et al. (1998c) and the other differing from their second mode by 1 d -1.
No sign of rotational modulation was found by Cunha et al. (2019) in their analysis of the TESS data for this star. Nevertheless, based on the measurement of a projected rotational velocity of km s-1, Kochukhov (2003) suggested a rotation period of 25 d. The lack of a rotational modulation in the TESS data could result from an unfavourable alignment ( or close to zero), as discussed by Cunha et al. (2019), or be a result of a long rotation period (Mathys et al., 2020b).
4.3.7 TIC 93522454
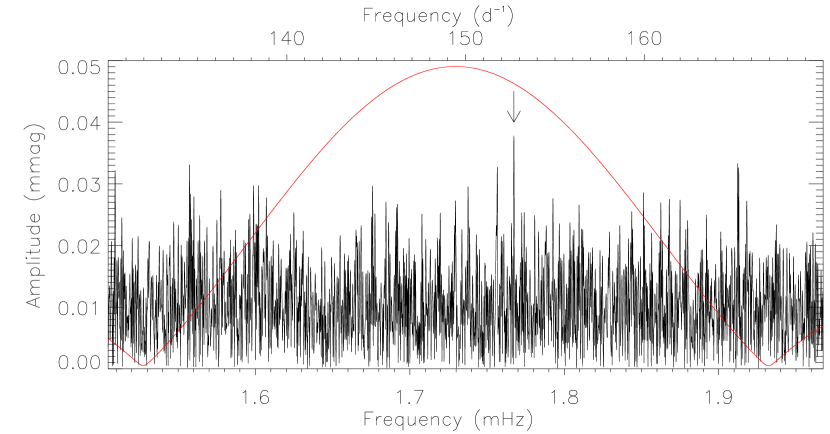
TIC 93522454 (HD 143487) was observed in sector 12. The star is classified as A3 SrEuCr in Renson & Manfroid (2009). It was identified as an roAp star by Elkin et al. (2010), following the analysis of high time resolution spectra obtained with UVES from which a low amplitude pulsation with a period around 10 min was inferred. The roAp nature of this star was later confirmed by Kochukhov et al. (2013) based on the analysis of a larger set of UVES spectra which allowed the detection of the pulsations in the lines of rare-earth elements as well as in the core of Hα and the determination of a pulsation period of 9.63 min (1.730 mHz; 149.47 d -1) with amplitudes up to m s-1. No rotation period is reported in the literature for this star.
The TESS data do not show a clear pulsation signal. We show, in Fig. 23, the amplitude spectrum in the frequency region where pulsations have been previously found. We indicate the possible location of the pulsation in this star with an arrow, but caution its presence. The lack of an obvious detection is not surprising given the low amplitude radial velocity variations reported.
4.3.8 TIC 125297016
TIC 125297016 (HD 69013) was observed in sector 7. The star is classified as Ap EuSr by Houk & Smith-Moore (1988). It was identified as an roAp star with a pulsation period around 11 min by Elkin et al. (2011), following the analysis of high time resolution spectra obtained with UVES. Pulsational variability with a similar period was also detected in photometric data published in the same work. The roAp nature of this star was confirmed by Kochukhov et al. (2013) based on the analysis of a larger set of UVES spectra which allowed the detection of the pulsations in the lines of rare-earth elements and the determination of a pulsation period of 11.22 min (1.4854 mHz; 128.34 d -1). No rotation period is reported in the literature and no sign of rotation variability was found by Mathys et al. (2020b) in their analysis of the TESS data for this star.
The TESS data of this star do not clearly show the known pulsation frequency. A significant peak is detected at a frequency of mHz ( d -1; Fig. 24) which is similar to the spectroscopic literature value, but further TESS observations are required to reduce the noise in the data to allow a confident photometric detection of the pulsation.

4.3.9 TIC 136842396
TIC 136842396 (HD 9289) is classified as A(p) SrEuCr by Houk & Swift (1999b) and its mean magnetic field modulus was determined to be kG (Ryabchikova et al., 2007). The star was discovered to be an roAp star by Kurtz et al. (1994b) who identified 3 pulsation modes in the amplitude spectrum of photometric data. Later, Gruberbauer et al. (2011) observed TIC 136842396 with the MOST satellite and found a greater number of frequencies, but with few in agreement with the first study. TESS observed TIC 136842396 during sector 3, with Balona et al. (2019) presenting the first analysis of those data.
Here, we derive a rotation period of the star from the SAP data since the pipeline has clearly altered the astrophysical signal. We measure a rotation period of d, which is different from that provided by Balona et al. (2019). The pulsation spectrum for this star poses questions due to the presence, and lack thereof, of many rotationally split sidelobes. We extract 9 significant peaks from the prewhitened light curve of this star, as shown in Fig. 25. Given the lack of complete multiplets, we investigated the frequency separation between the assumed mode frequencies and found a reoccurrence of a separation of Hz. Under the assumption that the highest amplitude mode is a quadrupole mode with missing sidelobes, the pulsation spectrum consists of: a quadrupole mode showing only the sidelobes, a dipole doublet split by the rotation frequency (with the pulsation mode being the highest amplitude peak), the quadrupole mode that is missing the sidelobes, and a final quadrupole mode showing only the sidelobes. These tentative mode identifications imply a large frequency separation of Hz.

4.3.10 TIC 139191168
TIC 139191168 (HD 217522) was observed in sector 1. The star is classified as A5 SrEuCr in Renson & Manfroid (2009) and has an upper limit on of 1.5 kG (Ryabchikova et al., 2008). It was first identified as an roAp star with pulsation periods around 13.72 min (1.2151 mHz; 104.98d -1) by Kurtz (1983), based on photometric data. The authors noted a significant night-to-night pulsation amplitude variability which was confirmed by a multi-site photometric campaign conducted by Kreidl et al. (1991) in 1989. In addition to the pulsational variability around the period detected earlier, the latter data revealed a new pulsation with a period around 8.26 min (2.0174 mHz; 174.23d -1). In 2008, further photometric data, as well as high time resolution UVES/ESO spectra were collected. The analysis of these data, published by Medupe et al. (2015), showed that pulsational variability around both periods was still present.
The Cycle 1 TESS data for this star were analysed by Cunha et al. (2019) who detected four modes with frequencies in the interval mHz, thus in the frequency region where all earlier data sets exhibited pulsations. However, the higher frequency mode, detected in the 1989 and 2008 data sets, was not detected in the TESS data. Similar to the earlier ground-based data, the TESS data showed evidence for amplitude and/or frequency modulation. No rotation period is reported in the literature for this star with Mathys et al. (2020b) classifying the star as a super slowly rotating Ap (ssrAp) star, although the longitudinal field measurements reported in the catalogue by Bagnulo et al. (2015) do show some indication of variability on the time scale of a few years. No sign of rotation variability was found in any of the published analyses of the TESS data (Cunha et al., 2019; David-Uraz et al., 2019; Mathys et al., 2020b).
Since the TESS data for this star have already been analysed in detail, we refer the reader to those works, but include the pulsation frequencies in Table 1 for completeness.
4.3.11 TIC 146715928
TIC 146715928 (HD 92499) was classified as A2p SrEuCr (Houk, 1978) with values ranging from 7200 K to 7810 K (Hubrig & Nesvacil, 2007; Freyhammer et al., 2008b; Elkin et al., 2010), and (cm s-2). Elkin et al. (2010) also provided a full chemical abundance analysis of this star. A mean magnetic field modulus of kG was derived from FEROS spectra by Hubrig & Nesvacil (2007) which was corroborated by Mathys (2017) who also suggested the rotation period of TIC 146715928 must be greater than 5 yr. TIC 146715928 has a km s-1 (Hubrig & Nesvacil, 2007; Elkin et al., 2010).
Rapid oscillations were found in the spectra of TIC 146715928 by Elkin et al. (2010) with a period of min. TESS observed the star during sectors 9 and 10. Mathys et al. (2020b) used the data to classify the star as an ssrAp star from the lack of rotation signal. They also provided a brief analysis of the two pulsation modes in this star that are separated by Hz, which could be the large frequency separation, or half of it. We present the extracted mode frequencies in Table 1, and show a plot of the amplitude spectrum in Fig. 26.

4.3.12 TIC 167695608
TIC 167695608 (TYC 8912-1407-1) was observed in 12 of the 13 sectors of Cycle 1 (all but sector 5). The star was classified as F0p SrEu(Cr) by Holdsworth et al. (2014a), who collected spectra to confirm its peculiar nature following the detection of rapid variability, with a period around 11 min (1.532 mHz; 132.38 d -1) in a survey conducted using the SuperWASP archive Pollacco et al. (2006).
The first two sectors of Cycle 1 TESS data were analysed by Cunha et al. (2019) who confirmed the pulsation detected previously and identified two more modes at slightly higher frequencies. A follow-up analysis of TESS data collected up to sector 7 revealed yet another pulsation mode at slightly lower frequency than the modes detected previously (Balona et al., 2019). Altogether, the TESS data up to sector 7 had revealed four pulsation frequencies. No sign of rotational variability was found for this star in the SuperWASP (Holdsworth et al., 2014a) or in the year-long TESS Cycle 1 data (Mathys et al., 2020b).
With the longer data set, we are now able to detect 6 pulsation frequencies in this star (Fig. 27), most of which show significant frequency variability, evidenced by broad ragged peaks in the amplitude spectrum that are not cleanly extracted when prewhitened. There is no clear pattern to the splitting of the pulsation modes, thus inhibiting the determination of the large or small frequency separation in this star.

4.3.13 TIC 168383678
TIC 168383678 (HD 96237) is an roAp star discovered by Elkin et al. (2011) and confirmed by Kochukhov et al. (2013) who determined the following stellar parameters: K, (cm s-2), km s-1 and a mean magnetic field modulus of kG. TIC 168383678 has a spectral classification of A4 SrEuCr (Renson & Manfroid, 2009) and a rotation period of 20.91 d (Freyhammer et al., 2008b). The dominant pulsation mode was reported at 1.2 mHz (Elkin et al., 2011; Kochukhov et al., 2013).
TESS observed the star during sector 9. The SPOC pipeline has removed the astrophysical signal associated with the rotation period in this star, so we use the SAP data. Upon inspection of the light curve, it is not clear if we have observed one rotation cycle or half of it. Inspection of the two observed light minima show subtly different shapes (Fig. 28). The data for this star span just 24.2 d which is just a little longer than the rotation period reported in the literature. From the light curve, we estimate a rotation period of either d or d.


We detect a significant peak in the amplitude of the SAP light curve at a frequency of mHz ( d -1) which has a S/N of 7.6. There are, perhaps, further modes in this star at slightly higher frequencies than that detected, but more data are required to confirm their presence.
4.3.14 TIC 170419024
TIC 170419024 (HD 151860) was classified as Ap SrEu(Cr) (Houk & Cowley, 1975). Kochukhov et al. (2013) measured a mean magnetic field modulus of 2.5 kG, and detected rapid pulsations through the analysis of high-resolution spectra collected with UVES, after the null detection in photometry (Martinez & Kurtz, 1994b). An average pulsation period of min was established from the radial velocity of lines of rare earth elements. Some lower amplitude peaks at other frequencies were detected indicating this star to be a multiperiodic roAp star.
The TESS sector 12 data show this star to be an ssrAp star (Mathys et al., 2020b) since the data show no rotation signature. Mathys et al. (2020b) also commented on the pulsation modes in this star, as detected in the TESS data. There is a significant peak at mHz ( d -1) which was not reported by Kochukhov et al. (2013), and a second peak at mHz ( d -1; Fig. 29) which is consistent with the spectroscopic analysis.

4.3.15 TIC 173372645
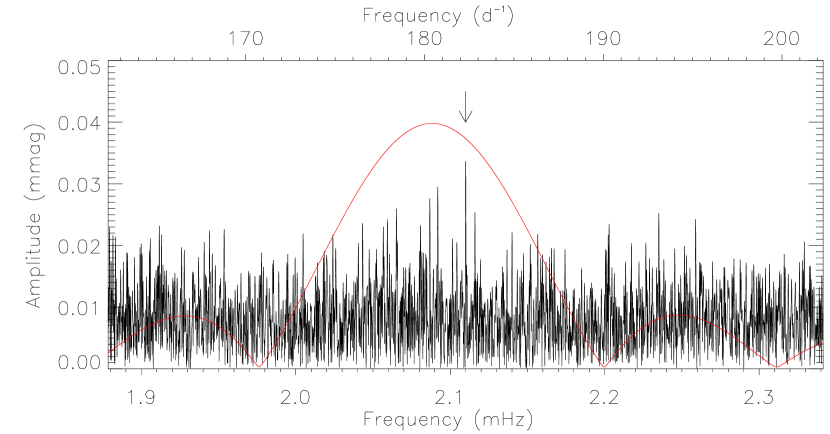
TIC 173372645 (HD 154708), with a rotation period of 5.37 d, an effective temperature of 7200 K (Joshi et al., 2016), (cm s-2), and km s-1, is classified as an Ap EuSrCr star (Renson & Manfroid, 2009). The dominant pulsation mode has a frequency of 2.088 mHz (180.4 d -1), which was discovered by Kurtz et al. (2006b) through the analysis of high time resolution UVES spectra at an amplitude of just m s-1. TIC 173372645 has a magnetic field of 24.5 kG, the strongest ever measured for an roAp star (Hubrig et al., 2005), and one of the strongest for an Ap star.
TESS observed TIC 173372645 in sector 12. The light curve is rotationally modulated with a period of d. There is no clear indication of pulsation in this star in the TESS data, only a few peaks in the amplitude spectrum in the frequency region where the pulsation was previously found (Fig. 30; Kurtz et al., 2006b). The low amplitude in the spectroscopic data seems to have translated to an undetectable peak in the TESS photometry.
4.3.16 TIC 189996908
TIC 189996908 (HD 75445) was classified as an Ap SrEu(Cr) star by Houk (1982) and has a magnetic field strength of kG (Mathys et al., 1997) . The stellar parameters were measured to be K , (cm s-2) (Ryabchikova et al., 2004), km s-1(Kochukhov et al., 2009a) and the Hipparcos parallax resulted in L⊙ (Kochukhov & Bagnulo, 2006). Based on radial velocity measurements, Kochukhov et al. (2009a) discovered rapid oscillations in this star, with a main pulsation frequency at 1.85 mHz (159.8 d -1).
TESS observed TIC 189996908 in sectors 8 and 9. The data show no rotational modulation which implies a long rotation period, or an unfavourable view. The magnetic field measurements presented by Mathys (2017) show changes over short time periods, implying a low inclination angle, rather than slow rotation. The pulsation signal is weak in this star, and would perhaps be classed as noise if it was not previously known. We find a peak in the amplitude spectrum at mHz ( d -1) with a S/N of 5.3 (Fig. 31). This is another example of how low amplitude modes in spectroscopic observations are difficult to observe photometrically.

4.3.17 TIC 211404370
TIC 211404370 (HD 203932) is classified as A5 SrEu in the catalogue of Renson & Manfroid (2009). Gelbmann et al. (1997) derived K and (cm s-2) for this star, while the average magnetic field, , was estimated to be below 1 kG (Ryabchikova et al., 2008), while the root mean square longitudinal field was reported to be kG (Bychkov et al., 2009) and the was measured to be 4.7 km s-1 (Smalley et al., 2015). Pulsations were first detected in TIC 211404370 by Kurtz (1984) and it was later shown to have 4 significant peaks in the amplitude spectrum between 1.280 and 2.737 mHz (Martinez et al., 1990).
This star was observed in TESS’s sector 1, with the data analysed in Cunha et al. (2019). We find no significant difference in our analysis and that previously presented, so we refer the reader to that work. We include the rotation frequency, and the frequency of the two pulsation modes, in Table 1.
4.3.18 TIC 237336864
TIC 237336864 (HD 218495), with a spectral type of Ap EuSr (Renson & Manfroid, 2009), was shown to have a of 16 km s-1 (Smalley et al., 2015) with a mean longitudinal magnetic field, , of about kG (Bagnulo et al., 2015). Cunha et al. (2019) derived K and (cm s-2). Rapid oscillations were first detected by Martinez & Kurtz (1990) in this star.
This star was observed in sector 1, with the data analysed in Cunha et al. (2019) and by Kobzar (2020). The data show a complex pulsation pattern with, in increasing frequency, a singlet, a doublet which is split by twice the rotation frequency, a quintuplet with components split by the rotation frequency, and a triplet of frequencies with each component split by twice the rotation frequency. Given the variety of different multiplet structures, a simple understanding of this star is not possible, but to develop a complete understanding is beyond the scope of this work. We provide the inferred pulsation frequencies and amplitudes in Table 1.
4.3.19 TIC 268751602
Houk & Smith-Moore (1988) classified TIC 268751602 (HD 12932) as Ap SrEuCr, with Kochukhov et al. (2007) providing parameters of K, (cm s-2), and km s-1, and Ryabchikova et al. (2007) deriving kG.
Schneider & Weiss (1990) and Kreidl (1990) independently collected high time resolution photometric data of TIC 268751602 and discovered variability with a period of about 11.6 min (1.4368 mHz; 124.14 d -1), thus announcing TIC 268751602 as an roAp star. This period was later refined by Schneider et al. (1992) to be 11.7 min, with the authors suggesting a rotation period of 3.5295 d. Analysis of photometric data by Martinez et al. (1994) showed that TIC 268751602 was a single-mode pulsator with a period of 11.6 min. The earlier identification of the rotation period was concluded to be likely incorrect. Kochukhov et al. (2007) identified variability in spectral lines of some elements in the atmosphere of TIC 268751602.
TESS observed this star during sector 3, with an analysis of those data presented by Balona et al. (2019). We confirm the lack of detection of rotation in this star, and agree with the pulsation frequency presented in that work, namely mHz ( d -1). There is only one pulsation mode seen in these data of this star (Fig. 32).

4.3.20 TIC 279485093
TIC 279485093 (HD 24712, HR 1217) was classified as A9Vp SrEuCr by Abt & Morrell (1995). Perraut et al. (2016) derived a temperature from bolometric flux and optical interferometry of K, while Sikora et al. (2019a) derived K from spectroscopy. The mean magnetic field modulus for TIC 279485093 was determined to be 2.3 kG (Ryabchikova et al., 2008). Detailed topology of the magnetic field of this star was reconstructed by Lüftinger et al. (2010) and Rusomarov et al. (2015) - the only roAp for which such constraint is available. Kurtz & Marang (1987b) obtained a rotation period from the mean light variation of 12.45733 d, while Rusomarov et al. (2013) derived 12.45812 d from the longitudinal field measurements spanning 40 yr and Kobzar et al. (2020) found a signal in the Fourier spectrum of the TESS data that may correspond to a rotation period of d. Kurtz (1981) first discovered 6.15 min (2.71 mHz; 234.1 d -1) oscillations in this star, and Balona et al. (2019) list 10 independent frequencies. Many of these modes show the expected rotation-modulated amplitude variations, but unexplained variations in this modulation also occur on shorter timescales of days (White et al., 2011). This star is one of the first discovered and best studied roAp stars, appearing extensively in the literature.
As mentioned, TESS observed this star in sector 5. From the SAP data, we derive a rotation period of d which is different from previous literature values (Fig. 33). The sector 5 SAP data, after removing points obviously affected by instrumental artefacts, span d – a little over twice the derived rotation period, thus this value should be treated with caution.


To inspect the pulsations in this star, we used the PDC_SAP light curve. The pulsation spectrum is known to be rich in this star, as evidenced by the middle panel in Fig. 33. We are able to extract 9 pulsation modes (as listed in Table 1) and 15 sidelobes that are split from the pulsation frequency by oblique pulsation. In comparison to the best ground based photometric data set for this star (Kurtz et al., 2005), we detect all but their frequency (2.789 mHz; 240.97 d -1) although we see a power excess in the bottom panel of Fig. 33 around this frequency. We detect two further modes (our lowest frequencies) which likely correspond to two modes detected by Mkrtichian & Hatzes (2005) via high-resolution spectroscopy.
4.3.21 TIC 280198016
TIC 280198016 (HD 83368, HR 3831) is a close visual binary, with the roAp star having spectral type A8V SrCrEu and the companion having type F9V (Corbally, 1984). Sikora et al. (2019a) derive K which is consistent with the TIC value. TIC 280198016 shows a polarity reversing magnetic field strength that varies about zero mean with amplitude kG (Mathys, 1991), and has a mean field modulus of 2.1 kG (Kochukhov et al., 2004). The rotation period of TIC 280198016 was precisely determined to be d (Kurtz et al., 1997a), with the star showing a single dipole pulsation mode at 123.38 d -1 that was exactly split into a septuplet by pulsation amplitude modulation with the rotation frequency. Baldry et al. (1998b) found that the radial velocity variations were amplitude and phase modulated in the same manner as the photometric variations, first confirming the oblique pulsator model and ruling out the spotted pulsator model for roAp stars (Mathys, 1985). A detailed study of pulsational line profile variations based on high-resolution spectroscopic observations was carried out by Kochukhov (2006). The surface distribution of the pulsation amplitude and phase was mapped by Kochukhov (2004) with the help of the Doppler imaging method - the only such analysis available for an roAp star.
The TESS sector 9 data of TIC 280198016 allow us to derive a rotation frequency (Table 1) which agrees with that of Kurtz et al. (1997a). We detect 6 significant peaks (Fig. 34) of the reported septuplet in TIC 280198016 and find that the mode shows frequency variability, as reported by (Kurtz et al., 1997a). We also detect the second harmonic of the pulsation mode which forms a triplet centred on twice the pulsation frequency, although Kurtz et al. (1997a) show four harmonics.

4.3.22 TIC 315098995
TIC 315098995 (HD 84041) was classified as Ap SrEuCr by Houk (1982), and has effective temperature measurements of 8100 K (Mathys et al., 1996), 7800 K and 7500 K from Elkin et al. (2008) obtained through the photometric calibrations of Moon & Dworetsky (1985) and fitting synthetic spectra to the Hα profile. TIC 315098995 is a magnetic star with Kochukhov & Bagnulo (2006) reporting the first detection of a longitudinal magnetic field of kG. The latest evaluation given in the FORS1 catalogue of stellar magnetic field measurements was kG measured from Balmer and metal lines (Bagnulo et al., 2015).
Martinez (1991) first reported the star as an roAp star with a pulsation period of about 14.6 min (1.14 mHz; 98.6 d -1). Later Martinez et al. (1993a) clarified that the star pulsated in at least three modes with periods near 15 min and with frequency separations of about Hz. However, it was noted that these frequencies were not a complete description of the pulsation behaviour of TIC 315098995. It exhibited mean light variations of a double-wave nature, indicating that both magnetic poles were visible. The rotation period determined from these observations was d. Elkin et al. (2008) reported maximum pulsation amplitude of km s-1and a pulsation amplitude from the Hα core of km s-1.
TESS observed TIC 315098995 during sectors 8 and 9. We cautiously combined the PDC_SAP data from sector 8 and the SAP sector 9 data to determine the rotation period since the SPOC pipeline has distorted the astrophysical signal in the latter. We measure a rotation period of d, which is consistent with the literature value.
The TESS data show this star to have a very variable pulsation signal, as reported by previous studies. We find two peaks (Fig. 35) that are split by twice the rotation frequency. We assume then, that we are seeing two sidelobes of a dipole triplet where the peak corresponding to the actual pulsation mode frequency is missing, implying that either or are close to . This is corroborated when considering the results of Martinez et al. (1993a). We do not detect, in the combined light curve, the other modes reported to be present in this star. A careful inspection of the data, in shorter segments, is required to extract the full information on this star.

4.3.23 TIC 322732889
TIC 322732889 (HD 99563) was classified as A9 III star by Houk (1978) and with a Sr peculiarity added later (Bidelman, 1981), although the star appears in the catalogue of Renson & Manfroid (2009) as an F0 Sr. From high-resolution spectra, Elkin et al. (2008) found K and (cm s-2). The first measure of the longitudinal magnetic field gave kG (Hubrig et al., 2004), with two further measurements at different phases of kG and kG (Hubrig et al., 2006). These detections were confirmed by Kochukhov & Bagnulo (2006) who measured a field strength of kG.
Dorokhova & Dorokhov (1998) first announced the detection of pulsation in TIC 322732889 with a period of about 11.17 min (1.4921 mHz; 128.9 d -1). Later, Handler & Paunzen (1999) confirmed the roAp nature of the star with a period of 10.7 min. Elkin et al. (2005b) discovered remarkably large amplitude pulsations in the star for some spectral lines with amplitudes up to 5 km s-1 making this star the largest radial velocity amplitude roAp star known. A more detailed study by Handler et al. (2006) using multi-site photometry found a single rotationally modulated mode with a frequency 1.558 mHz (134.6 d -1) connected with the rotation determined to be 2.912 d. Further spectroscopic observations found little variation in the pulsation amplitude in TIC 322732889 (Kurtz et al., 2006a), while Freyhammer et al. (2009) claimed the presence of H spots caused by the settling of He in the presence of the magnetic field. Based on MOST observations, Gruberbauer et al. (2011) found a new candidate frequency independent of the primary multiplet.
TESS observed TIC 322732889 during sector 9. With those data, we derive a rotation period of d which is consistent with that in the literature. As reported in previous works, we find a septuplet of peaks in the amplitude spectrum separated by the rotation frequency. The central peak, representing the pulsation mode, is at mHz ( d -1; Fig. 36), and has a smaller amplitude than the first rotational sidelobes. We detect none of the candidate modes of Gruberbauer et al. (2011).

4.3.24 TIC 326185137
TIC 326185137 (HD 6532) was classified as Ap SrCrEu by Houk (1982), although there are a variety of different classifications (Skiff, 2014). Effective temperature measurements for this star range from 7995 K by Bai et al. (2019) to 8382 K by McDonald et al. (2017). The value for this star is also poorly constrained in the literature, with an average value of (cm s-2). Several measurements of the magnetic field have been made, with the being 0.411 kG (Mathys & Hubrig, 1997; Bychkov et al., 2009; Bagnulo et al., 2015).
TIC 326185137 was discovered to be an roAp star by Kurtz & Kreidl (1985) with a period of 6.9 min (2.4155 mHz; 208.7 d -1). They found a frequency triplet split by the rotation frequency of the star. Subsequently, the star was the subject of many ground-based photometric campaigns, with Kurtz et al. (1996b) concluding the star pulsates with a distorted dipole mode. The rotation period of this star has been refined many times in the literature, with an average period of 1.94 d (Kurtz & Marang, 1987a; Kurtz et al., 1996a; Renson & Manfroid, 2009; Balona et al., 2019).
TESS observed this star in sector 3, with an initial analysis of the data being presented by Balona et al. (2019) where it was noted that the multiplet structure was vastly different from previous photometric data. Kurtz & Holdsworth (2020) explored this further, postulating two scenarios that could explain the striking difference between the two data sets: either the star has changed its pulsation axis or, more likely, we are seeing a depth dependence on the mode geometry revealed by the two wavelengths of observation.
From the data, we determine a rotation period of d, and a pulsation frequency of mHz ( d -1). We identify 4 of the 5 peaks of the distorted dipole multiplet (Fig. 37) in the TESS Cycle 1 data.

4.3.25 TIC 340006157
TIC 340006157 (HD 60435) was classified as A3 SrEu in Renson et al. (1991). Ghazaryan et al. (2019) report abundances for the star and classify it as neither He-poor or rich. Kochukhov & Bagnulo (2006) detected a surface magnetic field with kG. The TIC gives , though values in the literature range as low as (McDonald et al., 2012). The rotation period was reported by Kurtz et al. (1990) to be d, with the light curve displaying a double wave of unequal depth.
The star was first identified as an roAp star by Kurtz (1984). Matthews (1987) conducted a detailed study and identified 17 frequencies, which were identified as consecutive radial overtones of and modes, with amplitudes which were highly variable on timescales of days. Vauclair & Théado (2004) attempted modelling based on these frequencies, with results that suggested the presence of a He gradient inside the star. Balona et al. (2019) performed a preliminary analysis using TESS and detected 6 independent frequencies between 1.3079 and 1.4352 mHz ( d -1). All peaks were broad and poorly resolved, and many displayed variable amplitudes which both confirmed the results of Matthews (1987) and perhaps explained why not all the frequencies reported by the earlier author were detected in TESS data.
This star was observed in 7 sectors of Cycle 1, with data spanning a total of 296 d but with two 2-sector gaps. To derive the rotation period here, we used a combination of the raw and pipeline corrected data since the pipeline has altered the astrophysical signal in sectors 7 and 10 for this star. We derive a rotation period of d.
The TESS amplitude spectrum is no different for this star as reported in the literature: it shows significant frequency and/or amplitude variability, making precise frequency extraction difficult. We are, however, able to identify 8 pulsation frequencies in the data, which we have listed in Table 1. Some of the extracted frequencies are the same as those reported by Matthews (1987), but we do not detect the lowest frequency modes reported in that work. Only the second highest frequency mode shows rotationally split sidelobes in the amplitude spectrum. Due to the broad nature of the signal in the amplitude spectrum (Fig. 38) we have inflated our uncertainties by a factor of 100 to reflect the uncertainty in the frequency determination. This star requires a detailed individual study in the light of significant amplitude variations and short mode lifetimes.

4.3.26 TIC 348717688
TIC 348717688 (HD 19918) was observed in sectors 1,12 and 13, and has a spectral type of A5 SrEuCr (Renson & Manfroid, 2009). Its pulsations were first detected by Martinez & Kurtz (1991a) and revisited later by Martinez et al. (1995) using ground-based photometry from SAAO. In addition to the dominant pulsation frequency at 1.510 mHz (130.5 d -1) and its harmonics, a second frequency at 1.4806 mHz (127.9 d -1) was detected. TIC 348717688 has a known mean longitudinal magnetic field strength of kG (Hubrig et al., 2006), although a rotation period is not currently known. A mean field modulus of 1.6 kG was derived by Ryabchikova et al. (2007).
More recently, Cunha et al. (2019) analysed TESS sector 1 data of TIC 348717688 and extracted eight significant pulsation frequencies, including the dominant frequency originally reported by Martinez & Kurtz (1991a). Mathys et al. (2020b), using the complete TESS Cycle 1 data set, classified this star as an ssrAp star through the lack of detection of a rotation signal, and very sharp spectral lines.
Despite the large gap in the Cycle 1 data set, the window function of the data does not significantly interfere with the frequency analysis of this star. However, we identify frequency variability in this star. We are able to extract seven pulsation frequencies from the Cycle 1 light curve (Fig. 39), and note the presence of the first harmonic of the highest amplitude mode. The frequency not detected here, but quoted in Cunha et al. (2019), is likely the result of the frequency variability of a nearby mode as this mode is now split into several peaks in the amplitude spectrum.

4.3.27 TIC 363716787
TIC 363716787 (HD 161459) was observed in sector 13, and has a spectral type of Ap EuSrCr (Houk, 1978). It has a dominant pulsation frequency of 1.39 mHz (120.1 d -1; Martinez & Kauffmann, 1990; Martinez et al., 1991). A single mean longitudinal magnetic field measurement indicates kG (Bagnulo et al., 2015).
The TESS data allow us to provide a rotation period measurement of d. The folded light curve, Fig. 40, shows a double wave, implying that we see both magnetic poles, under the assumption that the chemical spots form at or near the magnetic poles. The pulsation spectrum of this star, as noted by Martinez et al. (1991), shows amplitude variability of its modes. We detect two independent modes in this star, with one showing rotationally split sidelobes. It is unclear which of the multiplet peaks is the pulsation mode, but we follow Martinez et al. (1991), taking the mode to be at 1.3909 mHz ( d -1). This mode is separated from the next by Hz which is plausibly half the large frequency separation in this star.


4.3.28 TIC 368866492
TIC 368866492 (HD 166473) was classified as A5p SrCrEu in Renson & Manfroid (2009). The TESS Asteroseismic Target List (ATL; Schofield et al., 2019) reports K, but this is the low end of the range of values from the literature, which range as high as K (Ammons et al., 2006). Abundance analysis of this star, conducted by Gelbmann et al. (2000), indicated abundance anomalies typical of roAp stars. Mathys et al. (2020a) used magnetic field modulus measurements to determine the rotation period to be d, using high-resolution spectroscopy spanning the period , and confirming an earlier report of d by Shavrina et al. (2014). The magnetic field modulus varies from 5.6 to 8.6 kG for this star (Mathys et al., 2020a).
Kurtz & Martinez (1987) first detected photometric oscillations in TIC 368866492, finding periods between 8.8 and 9.1 min ( mHz; d -1), while Kurtz et al. (2003) and Mathys et al. (2007) confirmed the presence of oscillations using radial velocity measurements. Mathys et al. (2007) reported three frequencies, 1.833, 1.886, and 1.928 mHz, with amplitudes up to m s-1, but all with low signal-to-noise. They also suggested that their data hinted at periodic variability of the mean magnetic field modulus, with an amplitude of kG.
TESS observed TIC 368866492 in sector 13. As discussed by Mathys et al. (2020b), there is no sign of rotational variability in the light curve, only low-frequency noise suspected to arise from contamination. We detect three main pulsation frequencies in this star, but note there is power excess in the amplitude spectrum after they have been removed. This leads us to speculate there are further low-amplitude modes that are not fully resolved in the TESS data.
The three peaks that we do see (Fig. 41) have equal phases and are equally split by Hz which would correspond to a rotation frequency of d if the multiplet is caused by oblique pulsation. However, from the literature, we know this star to have an extremely long rotation period. A different interpretation of this splitting is either the large or small frequency separation. With a value of Hz this is too small to be the large frequency separation, but is plausibly the small separation. However, in that situation, one would require modes of or to be visible and would need an explanation for why they would be equally split. This star needs careful consideration and modelling to solve these conundrums, which we leave to a future study.

4.3.29 TIC 369845536
TIC 369845536 (2MASS J19400781-4420093) is a well-studied, high-amplitude roAp star with a distorted quadrupole mode (Holdsworth et al., 2018a). It was originally discovered to have high-frequency variability by Holdsworth et al. (2014a) using SuperWASP photometry, and a dominant pulsation frequency of 2.042 mHz (176.4 d -1). Spectroscopy obtained by Holdsworth et al. (2018a) led them to classify its spectral type as A7Vp Eu(Cr). The ground-based photometry also allowed the rotation period to be determined as d, and modelling of the amplitude and phase modulation of its quadrupole pulsation mode confirmed its distorted nature.
TESS observed TIC 369845536 during sector 13. The data span 26 d which makes the determination of the rotation period less certain in the TESS data, at d over the previous measurement. The pulsation signature is strikingly large in this star; it is the roAp star with the highest amplitude mode seen in photometric observations, which is also the case here with the TESS observations (Fig. 42). Beyond the known pulsation mode in this star, we detect no further modes. The multiplet structure of the mode is similar to that seen in data (Holdsworth et al., 2018a).

4.3.30 TIC 394124612
TIC 394124612 (HD 218994) was observed in sector 1, and previously analysed by Cunha et al. (2019). It has a spectral type of A3 Sr (Renson & Manfroid, 2009), but is also known to be a visual binary with a separation of 1.2 arcsec (Renson et al., 1991). Pulsations consistent with a Sct star and a longitudinal magnetic field strength of kG were detected by Kurtz et al. (2008). Despite attempts to detect roAp pulsations, none have so far been detected in photometry (see e.g. Martinez & Kurtz 1994b). However, analysis of spectroscopic time series data has discovered variability in its Nd iii and Pr iii lines (González et al., 2008), which showed a frequency of 1.17 mHz (101.1 d -1).
4.3.31 TIC 394272819
TIC 394272819 (HD 115226) is a well-known CVn variable star. It was classified as Ap Sr(Eu) by Houk & Cowley (1975). The values in the literature for this star are mostly in agreement, with a value around K (Kochukhov & Bagnulo, 2006; Smalley et al., 2015). Using this value and the Hipparcos parallax, Kochukhov & Bagnulo (2006) determine L⊙. Later, Kochukhov et al. (2008) determined the projected rotational velocity km s-1 and conducted an abundance analysis, finding nearly solar abundances of Mg, Si, Ti, and Fe, an overabundance of Cr, Co, and rare earth elements, and an under-abundance of Ba. Bagnulo et al. (2015) reported a value of 0.828 kG.
The roAp nature of TIC 394272819 was discovered by Kochukhov et al. (2008). Using time-series high-resolution HARPS spectroscopy, they measured the high-amplitude 10.87-min (1.5333 mHz; 132.5 d -1) oscillation in this star from radial velocity variations. Pulsational variability was discovered in the cores of hydrogen lines and in doubly-ionized Pr, Nd, and Dy lines. Recently, the same 102 HARPS spectra were analysed by Binnenfeld et al. (2020) by using the unit-sphere representation periodogram (USuRPER), finding the same period.
Photometric ASAS-3 data of TIC 394272819 were analysed by Hümmerich et al. (2016). They detected a clear signal with a period of d. In addition they checked the Hipparcos data and found marginal variability with d, which is not present in the ASAS-3 data. Joshi et al. (2016) confirmed the presence of 10.86-min oscillations analysing high-speed photometry from the Nainital-Cape Survey.
TIC 394272819 was observed during sectors 11 and 12. The combined PDC_SAP data allow us to derive a rotation period of d which is consistent with the ASAS-3 data. There is no evidence of the 3.61-d signal found in the Hipparcos data. We detect four pulsation modes in this star. In increasing frequency we see a singlet, three components of a quintuplet, a triplet and another singlet. Fig. 43 shows the amplitude spectrum of this star. We interpret this pattern as a series of alternating and modes with some components lost in the noise. This interpretation is reinforced when considering the spacing between the modes; under our assumption they are all separated by Hz which we understand to be the half of the large frequency separation for this star.

4.3.32 TIC 402546736
TIC 402546736 (HD 128898; Cir) has many similar classifications in the literature. Here we quote that of Gray et al. (2006): A7Vp SrCrEu. This star is a well studied, naked eye object, and as such has a plethora of information in the literature. We provide here a very limited introduction to the star, and encourage the interested reader to explore the references provided.
Effective temperature measurements for TIC 402546736 range from 7420 K (e.g., Bruntt et al., 2008; Desidera et al., 2015) to around 8000 K (e.g., Kurtz & Martinez, 1993; Matthews et al., 1999) derived through a variety of different methods. determinations also vary, but are consistently around 4.1 (cm s-2) within the quoted errors (e.g., Kochukhov et al., 2009b; Sikora et al., 2019a), with values consistently around 13 km s-1 (e.g., Kupka et al., 1996; Ammler-von Eiff & Reiners, 2012). The abundance pattern in TIC 402546736 is typical for Ap stars (Kupka et al., 1996; Bruntt et al., 2008), with under-abundances of C, N, and O, and overabundances of rare-earth and some other heavy elements. Kochukhov et al. (2009b) built a self-consistent empirical model atmosphere of TIC 402546736 and conducted stratification modelling of some elements, showing that chemical stratification has an important effect on the model structure of TIC 402546736. A value of 0.9 kG have been reported for this star (Bruntt et al., 2008) Sikora et al. (2019b) derived a dipolar field strength of 1.4 kG from the analysis of mean longitudinal field measurements.
TIC 402546736 was classified as an roAp star showing a 6.8-min (2.4510 mHz; 211.8 d -1) oscillation by Kurtz & Cropper (1981) and subsequently, 47 hours of high-speed, ground-based photometry was analysed by Kurtz et al. (1981). Notable results from studies of this star are those of Kurtz et al. (1994a) who found the star to pulsate in a dipole mode with a frequency of 2.442 mHz (211.0 d -1), and subsequent lower amplitude modes. They also provided a precise rotation period of 4.4790 d. Later, Bruntt et al. (2009) used 84 d of WIRE observations to refine the separation of the modes in this star to be Hz. Weiss et al. (2016) and Weiss et al. (2020) used 4 BRITE satellites to observe TIC 402546736 for a total of 146 d, providing them data to model the spot configuration of the star, and confirm the previously tentative detection of some low amplitude modes.
Beside the photometric observations of TIC 402546736, there have been substantial spectroscopic studies using high time resolution spectra. These studies (e.g., Baldry et al., 1998a, 1999; Kochukhov & Ryabchikova, 2001; Balona & Laney, 2003; Ryabchikova et al., 2007) have shown that the principal pulsation mode can have an amplitude up to 1 km s-1, with some spectral lines pulsating in anti-phase with others, suggesting a node, or false node, in the atmosphere of the star (Sousa & Cunha, 2011; Quitral-Manosalva et al., 2018).
TESS observed TIC 402546736 during sectors 11 and 12. We use the SAP data to determine a rotation period of d which is different from that of Kurtz et al. (1994a) by . We also use the SAP data for the pulsation analysis that follows, since the SPOC pipeline has introduced significant noise to this bright star. As expected from the literature, the amplitude spectrum is rich in pulsation modes and rotationally split sidelobes (Fig. 44). We extract 23 significant peaks from the amplitude spectrum, but note there is evidence of further modes seemingly present in the data. Of those 23 peaks, we identify 10 as pulsation modes (see Table 1), one as a harmonic and 2 as peaks due to non-linear interactions. The latter 3 peaks are all found above the Nyquist frequency and are reminiscent of those seen in the K2 data of 33 Lib (HD 137949; Holdsworth et al., 2018c), making TIC 402546736 only the second roAp star to show such non-linear interactions.


Although not all modes are separated by the same frequency, many are separated by Hz which we take to be half of the large frequency separation in this star, as did Bruntt et al. (2009). For those modes where the frequency spacing is not a multiple of Hz, we postulate that these mode frequencies have been affected by the magnetic field, as was seen in TIC 279485093 (HR 1217; Kurtz et al., 2005).
4.3.33 TIC 434449811
TIC 434449811 (HD 80316) was classified as Ap Sr(Eu?) with ‘extremely strong Sr ii’ by Bonsack (1974). There is no detailed spectroscopic analysis of the fundamental properties in the literature, so values are based on photometry with values ranging from 8110 K (Gaia Collaboration et al., 2018) to 9120 K (Ammons et al., 2006). Using H from Paunzen (2015), and the calibrations of Moon & Dworetsky (1985), gives = 8420 K, which is consistent with 8280 K obtained from the spectral energy distribution (McDonald et al., 2012). The mean longitudinal magnetic field strength has been determined to be kG by Hubrig et al. (2006) and kG by Bagnulo et al. (2015).
The rotation period was determined to be 2.09 d (Manfroid & Mathys, 1986; Kurtz et al., 1997b), although a recent value of 1.91 d was given by Oelkers et al. (2018). With km s-1 Wade (1997) estimated a rotational axis inclination of . The radial velocity is given as km s-1 by Gontcharov (2006). However, five measurements with HARPS show a large variation over a 2-yr time-span, ranging from 10.6 to 46.7 km s-1 (Trifonov et al., 2020), indicating this could be a spectroscopic binary star. The star is part of a very wide ( arcsec) optical pair with HD 80298 (BD-19 2673; WDS J09184-2022A; Mason et al., 2001), but there is no physical association.
TIC 434449811 is a known roAp star, with a 7.4-min (2.2523 mHz; 194.6 d -1) oscillation discovered by Kurtz (1990) in photometric observations. A later, more in depth photometric study was presented by Kurtz et al. (1997b) who found a frequency triplet with equal amplitudes in a filter. Elkin et al. (2008) found a pulsation signal of the same period with an amplitude of 0.32 km s-1 in spectral lines.
TESS observed the star during sector 8. The PDC_SAP data, after the removal of some outlying points at the start of the second orbit, provide a rotation period for this star of d, which is consistent with the literature value. After removal of the rotation signature and its harmonics, there are two peaks remaining in the Sct frequency range (Fig. 45). It is unclear whether these are mode frequencies in TIC 434449811 or in a companion star. Given the relatively weak magnetic field in this star, it is possible that the Sct frequencies are in the Ap star (Murphy et al., 2020), but detailed modelling and the exclusion of other possibilities is required.


The roAp pulsation signature in this star has a different multiplet structure than previously seen (Kurtz et al., 1997b); there are, in the TESS data, two peaks with similar amplitudes, and a further 3 peaks with low signal-to-noise. This change in multiplet structure is similar to that seen in TIC 326185137 (HD 6532; Kurtz & Holdsworth, 2020) and may be a result of the different filters probing different depths in the stellar atmosphere. A detailed analysis of this star is required to fully understand its pulsation properties.
4.3.34 TIC 469246567
TIC 469246567 (HD 86181) is listed as an CVn star on SIMBAD and has a spectral type Ap Sr (Houk & Cowley, 1975). Kurtz & Martinez (1994) discovered 6.2-min (2.6882 mHz; 232.3 d -1) oscillations in TIC 469246567, making it one of the most rapidly oscillating Ap stars. A longitudinal magnetic field strength of kG was measured by Bagnulo et al. (2015). Despite the CVn classification, there is only one recent measure of the rotation period of this star (Shi et al. submitted).
TIC 469246567 was observed by TESS during sectors 9 and 10. These data have been extensively analysed by Shi et al. (submitted) so we refer the reader there to a detailed discussion. In short, the pulsation spectrum consists of alternating dipole, quadrupole, and dipole modes, all rotationally split into multiplets. The TESS data also provide the first measure of the rotation period of this star to be d. The pulsation frequencies, and rotation period, are included in Table 1 for completeness.
5 Candidate roAp stars
In this section, we provide information on a number of stars which were flagged by the search teams as possible roAp stars. These stars are classed as candidate roAp stars since either their spectral classification does not indicate chemical peculiarity, their pulsation signature does not show signs of multiplets split by the rotation frequency, or their presumed pulsation signal is close to a signal-to-noise limit of 4.0.
5.1 TIC 1727745
TIC 1727745 (HD 113414) was classified as an F7/8V type star by Houk & Smith-Moore (1988). There have been numerous studies that attempt to calculate physical parameters of the star. Among these, Haakonsen & Rutledge (2009) identified the star as an x-ray source and Suchkov et al. (2003) found its x-ray luminosity to be log erg s-1 in the investigation of x-ray properties of the ROSAT F stars. Suchkov et al. (2003) also estimated the temperature and metallicity to be K and Fe/H , respectively.
Using precision radial velocities from HIRES on the Keck I telescope, Butler et al. (2017) stated that the star showed chromospheric emission variations, which led to radial velocity variations, due to either stellar rotation or long-term activity cycles. Additionally, , , colour indexes and H index of the star were provided to be 0.357, 0.182, 0.386 and 2.624, respectively (Paunzen, 2015; Hauck & Mermilliod, 1998), which do not imply this star is chemically peculiar.
Observed in sector 10, the TESS data show a rotationally modulated light curve, which has a period of d (Fig. 46). The well defined phased light curve suggests that the surface inhomogeneities are stable over the observations period. The pulsation signal in the star occurs at mHz ( d -1) which is in the frequency range of known roAp pulsations.


The contamination factor, in the TIC, for this star is very small (0.0001) which implies all of the light in the photometric aperture is originating from the target star.
5.2 TIC 3814749
TIC 3814749 (HD 3748) was also listed in both Balona et al. (2019) and Kobzar (2020) as an roAp candidate. The star is a known double system (with a contamination factor of 1.431) which have spectral types of A0/1 IV/V and A9/F0V (Houk & Swift, 1999b), but with also A5 quoted in the literature. We obtained a classification spectrum from SAAO and confirm the lack of strong chemical peculiarities in this star, suggesting it is not an Ap star (Fig. 63). However, the Ca ii K line is weak in the star, as is the Mg ii 4481 Å line.
TESS observed TIC 3814749 during sector 3. With those data, we detect a low frequency signal corresponding to a period of d. We also find two peaks at higher frequency which we assume are a result of pulsational variability (Fig. 47), although the lower frequency peak is at low significance. These two peaks are well separated in frequency, by 1.12 mHz, which requires a significant range of unexcited overtones as has been seen in TIC 139191168 (HD 217522) and now also in TIC 49332521 (HD 119027).
However, the star is listed as an Algol type binary (Samus’ et al., 2003). It is possible that the low frequency signal is the orbital frequency of the A star and a compact companion. In this case, a large gap between the observed frequencies is less uncommon (e.g., Sahoo et al., 2020). High-resolution spectroscopic monitoring of this system is needed to solve this problem.


5.3 TIC 158637987
There is little information in the literature about TIC 158637987 (HD 10330). Houk & Cowley (1975) gave the spectral type as A9V, indicating a chemically normal star. Paunzen (2015) provided Strömgren-Crawford photometric indices of , , , and H. Using the calibrations of Crawford (1979), these indices suggest the star is significantly metal weak.
The TESS observations, collected during sectors 2 and 3, show significant variability in the low-frequency range which we take to be g mode pulsations (Fig. 48). The high-frequency variability in this star occurs at about 2.71 mHz (236 d -1; Fig. 48), where we identify two peaks of marginal significance. The separation of these two peaks (0.01642 mHz; 1.4187 d -1) is close to, but not the same as, a peak in the low frequency range (0.01713 mHz; 1.4797 d -1), thus we cannot deduce whether the peaks are split by the stellar rotation frequency. Spectroscopic observations are required of this star to test the existence of chemical peculiarities and/or a magnetic field. If either exist, this star provides another example of a Dor-roAp hybrid star. If this is an roAp star, it is unique in having apparently low metallicity.


The TIC provides a contamination factor of 0.048 for TIC 158637987, suggesting there is very little contamination from a nearby (on the sky) star.
5.4 TIC 324048193
TIC 324048193 (HD 85892) was classified as Ap Si by Houk & Cowley (1975). The literature provides values of between K (Bai et al., 2019) to K (Anders et al., 2019), but with most estimates around K (McDonald et al., 2012; Chandler et al., 2016; Ammons et al., 2006). The TIC estimate is by far the highest temperature estimate at K, and we treat that with caution. The presence of Si in the stellar spectrum suggests a late B early A star which is consistent with the higher temperature range. The mass and radius estimates for the star, 5.2 M⊙ and 4.5 R⊙ (Kervella et al., 2019; McDonald et al., 2017), suggest it has evolved away from the zero-age main sequence. A value of km s-1 was quoted by Renson & Manfroid (2009), with Watson et al. (2006) measuring a rotation period of 4.295 d.
TESS observed TIC 324048193 during sectors 11 and 12. The light curve shows clear modulation due to spots, as expected for a magnetic CP star. From the variations, we derive a rotation period of d which is consistent with that in the literature. The pulsation signal in this star is at a high frequency of mHz ( d -1; Fig. 49). This is among the highest frequencies known in the roAp stars. This star is also at the upper temperature range of the known roAp stars, after TIC 123231021 (KIC 7582608; Holdsworth et al., 2014b), but it is well within the theoretical instability strip for this class of pulsator (Cunha, 2002).
We classify this as a candidate roAp star since the signal is detected at marginal significance (S/N), and lacks signs of rotationally split sidelobes (which would be lost in the noise). Further TESS observations of this star are due, which will hopefully allow this star to be confirmed as a new roAp star. Since the contamination factor is small (0.0032) we are confident that the signal is from this star.

5.5 TIC 410163387
TIC 410163387 (HD 76279) was classified as an Ap SrEuCr star by Houk & Smith-Moore (1988), although they note it as a ‘weak case’. There are differing values in the literature, with most in the region of 7100 K (e.g., Ammons et al., 2006; Bai et al., 2019). There has been one previous published attempt to find pulsations in this star, however the authors returned a null result at a magnitude limit of 0.8 mmag in 2-hrs of photometric observations (Nelson & Kreidl, 1993).
TESS observed TIC 410163387 in sector 8. An amplitude spectrum of the light curve at low frequency (Fig. 50) reveals the presence of probable g-mode pulsations in this star. At high frequency, we detect a single peak at mHz ( d -1) which has a S/N of . We cannot conclude, with confidence, that this peak is a true pulsation mode, and, coupled with the presence of the g-modes, we rate this star as a candidate roAp star until further observations are made to confirm the existence of the mode. We also note that the TIC contamination factor for this star is non-negligible at 0.01, implying that some of the signals may be from a contaminant source.


These factors led us to obtain a high resolution spectrum of TIC 410163387 with SALT/HRS. The single spectrum reveals this star to be a spectroscopic binary of two components of similar temperature given the relative depths of the Hα absorption line (Fig. 64). We suspect that the two pulsation signals are therefore originating on two separate stars, but confirmation of the high frequency variability is still required.
6 Conclusions
We have presented the results of a systematic survey of hot ( K) stars observed during the first Cycle of TESS observations, covering the Southern Ecliptic hemisphere, in 2-min cadence. We selected over 50 700 stars in this temperature range, and searched for pulsational variability with frequencies greater than 0.52 mHz, resulting in over 6713 detections. After the removal of obvious contaminant stars, the final sample consisted of 163 stars for detailed frequency analysis. The main discoveries from this work can be summarised as follows:
-
1.
We have reported the discovery of 12 new roAp stars. Six of these stars show multiple pulsation frequencies in their light curves, making them of utmost importance for asteroseismic modelling. In addition to these stars, another (TIC 119327278) shows the presence of a Sct mode, suggesting this star belongs to the rare Sct-roAp hybrid stars. This star also shows the shortest rotation period among the class of roAp stars, at 1.085 d. We have identified the roAp star with the lowest frequency pulsation, TIC 356088697, which shows a single pulsation mode at mHz (min), allowing us to test the lowest end of the radial orders excited in the roAp stars. Of the 12 new roAp stars, we provided the first measures of the rotation period for five, and find three to show no rotational variability.
-
2.
We have presented the results of TESS observations of a further 44 roAp stars that were known in the literature. Of these 44, we find three (TIC 35905913 – HD 132205, TIC 93522454 – HD 143487, and TIC 173372645 – HD 154708) that show no clear pulsation signal in the high-precision TESS data and note that these three stars were discovered to have low amplitude pulsations through the analysis of time-resolved high resolution spectroscopic observations. Furthermore, we present the tentative detection of modes in 2 other roAp stars which were discovered through spectroscopic observations.
-
3.
Of the entire sample of 56 confirmed roAp stars observed, 68 per cent (38) show rotationally modulated light curves, with rotation periods in the range d. It is not yet clear if there is a causal link between rotation and pulsation, but these observations will provide new results to test this relationship.
-
4.
There are many instances where the rotationally split multiplets show different structures, in the same star, for the same degree mode (e.g., TIC 176516923 – HD 38823, TIC 310817678 – HD 88507, TIC 259587315 – HD 30849). This provides a problem for the application of the oblique pulsator model where the stellar inclination angle, , and the magnetic obliquity, , can be derived or constrained. This, coupled with the difference in structure between observations made in different filters (e.g., TIC 326185137 – HD 6532; Kurtz & Holdsworth, 2020), and spectral lines (e.g., TIC 280198016 – HD 83368 Kochukhov, 2006), provides a significant challenge in understanding the results of the oblique pulsator model.
-
5.
We have reported the presence of non-linear interactions in the pulsation spectrum of TIC 402546736 (HD 128898) around the harmonic of the principal mode. This is only the second star (after 33 Lib; Holdsworth et al., 2018c) where this phenomenon is seen.
The results presented here have provided new insights into the roAp class of pulsationally variable stars. We have identified new pulsation frequencies in many stars, and shown frequency variability is a common feature of the roAp stars. These observational results will drive forward the development of state-of-the-art theoretical models of these stars, providing insight into the physical processes at play in these magnetic, chemically peculiar stars. Puzzling frequency separations, high-frequency modes, and a lack of roAp stars probing the blue edge of the instability strip, mean these results will have a significant impact on the theoretical understanding of the rapidly oscillating Ap stars. We will use these results to conduct a homogeneous study of the properties of roAp stars and explore any correlations between stellar and pulsation properties, and investigate any differences between the observed frequencies and those predicted by models.
Acknowledgements
We thank the anonymous referee for a careful reading of the manuscript. DLH acknowledges financial support from the Science and Technology Facilities Council (STFC) via grant ST/M000877/1. MSC acknowledges the support by FCT/MCTES through the research grants UIDB/04434/2020, UIDP/04434/2020 and PTDC/FIS-AST/30389/2017, and by FEDER - Fundo Europeu de Desenvolvimento Regional through COMPETE2020 - Programa Operacional Competitividade e Internacionalização (grant: POCI-01-0145-FEDER-030389). MSC is supported by national funds through FCT in the form of a work contract. VA was supported by a research grant (00028173) from VILLUM FONDEN. Funding for the Stellar Astrophysics Centre is provided by The Danish National Research Foundation (Grant agreement no.: DNRF106). The research leading to these results has received funding from the Research Foundation Flanders (FWO) by means of a senior postdoctoral fellowship to DMB with grant agreement No. 1286521N. This project has been supported by the Lendület Program of the Hungarian Academy of Sciences, project No. LP2018-7/2020 and by the EU’s MW-Gaia COST Action (CA18104). ASG acknowledges financial support from the Max Planck Society under grant “Preparations for PLATO science” and from ALMA-CONICYT under grant #31170029. ZsB acknowledges the support by the János Bolyai Research Scholarship of the Hungarian Academy of Sciences. LFM acknowledges the financial support from the UNAM under grant PAPIIT IN100918. CCL acknowledges the support of the Natural Sciences and Engineering Research Council of Canada (NSERC). DM acknowledges the support of the National Astronomical Research Institute of Thailand (NARIT). JPG acknowledges funding support from Spanish public funds for research from project PID2019-107061GB-C63 from the ‘Programas Estatales de Generación de Conocimiento y Fortalecimiento Científico y Tecnológico del Sistema de I+D+i y de I+D+i Orientada a los Retos de la Sociedad’, and from the State Agency for Research through the “Center of Excellence Severo Ochoa” award to the Instituto de Astrofísica de Andalucía (SEV-2017-0709), all from the Spanish Ministry of Science, Innovation and Universities (MCIU). TRY acknowledges support from the NSF REU program, grant number PHY-1359195. The material is based upon work supported by NASA under award number 80GSFC21M0002. AD was supported by the ÚNKP-20-5 New National Excellence Program of the Ministry of Human Capacities and the János Bolyai Research Scholarship of the Hungarian Academy of Sciences. AD would like to thank the City of Szombathely for support under Agreement No. 67.177-21/2016. AGH acknowledges support from “FEDER/Junta de Andalucía-Consejería de Economía y Conocimiento” under project E-FQM-041-UGR18 by Universidad de Granada and from Spanish public funds (including FEDER funds) for research under project ESP2017-87676-C5-2-R. ARB acknowledges funding support from Spanish public funds for research through the research grant PRE2018-084322, through projects ESP2017-87676-C5-5-R and PID2019-107061GB-C63, and from the State Agency for Research through the “Center of Excellence Severo Ochoa” award to the Instituto de Astrofísica de Andalucía (SEV-2017-0709), all from the Spanish Ministry of Science, Innovation and Universities (MCIU). We are grateful to Sowgata Chowdhury, supported by Polish NCN grant 2015/18/A/ST9/00578, for conducting some spectroscopic observations that are reported in this work. This paper includes data collected by the TESS mission, which are publicly available from the Mikulski Archive for Space Telescopes (MAST). Funding for the TESS mission is provided by NASA’s Science Mission directorate. Funding for the TESS Asteroseismic Science Operations Centre is provided by the Danish National Research Foundation (Grant agreement no.: DNRF106), ESA PRODEX (PEA 4000119301) and Stellar Astrophysics Centre (SAC) at Aarhus University. We thank the TESS team and staff and TASC/TASOC for their support of the present work. This research has made use of the SIMBAD database, operated at CDS, Strasbourg, France. This work has made use of data from the European Space Agency (ESA) mission Gaia (https://www.cosmos.esa.int/gaia), processed by the Gaia Data Processing and Analysis Consortium (DPAC, https://www.cosmos.esa.int/web/gaia/dpac/consortium). Funding for the DPAC has been provided by national institutions, in particular the institutions participating in the Gaia Multilateral Agreement.
Data availability
Data used in this work are available upon reasonable request from the corresponding author.
References
- Abt & Morrell (1995) Abt H. A., Morrell N. I., 1995, ApJS, 99, 135
- Abt et al. (1979) Abt H. A., Brodzik D., Schaefer B., 1979, PASP, 91, 176
- Alecian & Stift (2010) Alecian G., Stift M. J., 2010, A&A, 516, A53
- Alentiev et al. (2012) Alentiev D., Kochukhov O., Ryabchikova T., Cunha M., Tsymbal V., Weiss W., 2012, MNRAS, 421, L82
- Ammler-von Eiff & Reiners (2012) Ammler-von Eiff M., Reiners A., 2012, A&A, 542, A116
- Ammons et al. (2006) Ammons S. M., Robinson S. E., Strader J., Laughlin G., Fischer D., Wolf A., 2006, ApJ, 638, 1004
- Anders et al. (2019) Anders F., et al., 2019, A&A, 628, A94
- Avelino et al. (2020) Avelino P. P., Cunha M. S., Chaplin W. J., 2020, MNRAS, 492, 4477
- Babcock (1960) Babcock H. W., 1960, ApJ, 132, 521
- Bagnulo et al. (2015) Bagnulo S., Fossati L., Landstreet J. D., Izzo C., 2015, A&A, 583, A115
- Bai et al. (2019) Bai Y., Liu J., Bai Z., Wang S., Fan D., 2019, AJ, 158, 93
- Baldry et al. (1998a) Baldry I. K., Bedding T. R., Viskum M., Kjeldsen H., Frandsen S., 1998a, MNRAS, 295, 33
- Baldry et al. (1998b) Baldry I. K., Kurtz D. W., Bedding T. R., 1998b, MNRAS, 300, L39
- Baldry et al. (1999) Baldry I. K., Viskum M., Bedding T. R., Kjeldsen H., Frandsen S., 1999, MNRAS, 302, 381
- Balmforth et al. (2001) Balmforth N. J., Cunha M. S., Dolez N., Gough D. O., Vauclair S., 2001, MNRAS, 323, 362
- Balona & Laney (2003) Balona L. A., Laney C. D., 2003, MNRAS, 344, 242
- Balona et al. (2011) Balona L. A., et al., 2011, MNRAS, 413, 2651
- Balona et al. (2019) Balona L. A., Holdsworth D. L., Cunha M. S., 2019, MNRAS, 487, 2117
- Bernhard et al. (2020) Bernhard K., Hümmerich S., Paunzen E., 2020, MNRAS, 493, 3293
- Bidelman (1981) Bidelman W. P., 1981, AJ, 86, 553
- Bidelman & MacConnell (1973) Bidelman W. P., MacConnell D. J., 1973, AJ, 78, 687
- Bigot & Dziembowski (2002) Bigot L., Dziembowski W. A., 2002, A&A, 391, 235
- Bigot & Kurtz (2011) Bigot L., Kurtz D. W., 2011, A&A, 536, A73
- Binnenfeld et al. (2020) Binnenfeld A., Shahaf S., Zucker S., 2020, A&A, 642, A146
- Blanco-Cuaresma (2019) Blanco-Cuaresma S., 2019, MNRAS, 486, 2075
- Blanco-Cuaresma et al. (2014) Blanco-Cuaresma S., Soubiran C., Heiter U., Jofré P., 2014, A&A, 569, A111
- Bonsack (1974) Bonsack W. K., 1974, PASP, 86, 408
- Bowman & Kurtz (2018) Bowman D. M., Kurtz D. W., 2018, MNRAS, 476, 3169
- Bramall et al. (2010) Bramall D. G., et al., 2010, in Ground-based and Airborne Instrumentation for Astronomy III. p. 77354F, doi:10.1117/12.856382
- Bruntt et al. (2008) Bruntt H., et al., 2008, MNRAS, 386, 2039
- Bruntt et al. (2009) Bruntt H., et al., 2009, MNRAS, 396, 1189
- Buckley et al. (2006) Buckley D. A. H., Swart G. P., Meiring J. G., 2006, in Society of Photo-Optical Instrumentation Engineers (SPIE) Conference Series. p. 62670Z, doi:10.1117/12.673750
- Buscombe & Foster (1995) Buscombe W., Foster B. E., 1995, MK spectral classifications. Twelfth general catalogue, Epoch 2000 including UBV photometry
- Butler et al. (2017) Butler R. P., et al., 2017, AJ, 153, 208
- Bychkov et al. (2009) Bychkov V. D., Bychkova L. V., Madej J., 2009, MNRAS, 394, 1338
- Cannon & Pickering (1993) Cannon A. J., Pickering E. C., 1993, VizieR Online Data Catalog, p. III/135A
- Chandler et al. (2016) Chandler C. O., McDonald I., Kane S. R., 2016, AJ, 151, 59
- Chen et al. (2017) Chen P. S., Liu J. Y., Shan H. G., 2017, AJ, 153, 218
- Chojnowski et al. (2019) Chojnowski S. D., et al., 2019, ApJ, 873, L5
- Corbally (1984) Corbally C. J., 1984, ApJS, 55, 657
- Crause et al. (2014) Crause L. A., et al., 2014, in Ground-based and Airborne Instrumentation for Astronomy V. p. 91476T, doi:10.1117/12.2055635
- Crause et al. (2016) Crause L. A., et al., 2016, in Proc. SPIE. p. 990827, doi:10.1117/12.2230818
- Crawford (1979) Crawford D. L., 1979, AJ, 84, 1858
- Cunha (2001) Cunha M. S., 2001, MNRAS, 325, 373
- Cunha (2002) Cunha M. S., 2002, MNRAS, 333, 47
- Cunha (2006) Cunha M. S., 2006, MNRAS, 365, 153
- Cunha & Gough (2000) Cunha M. S., Gough D., 2000, MNRAS, 319, 1020
- Cunha et al. (2003) Cunha M. S., Fernandes J. M. M. B., Monteiro M. J. P. F. G., 2003, MNRAS, 343, 831
- Cunha et al. (2013) Cunha M. S., Alentiev D., Brandão I. M., Perraut K., 2013, MNRAS, 436, 1639
- Cunha et al. (2019) Cunha M. S., et al., 2019, MNRAS, 487, 3523
- Cunha et al. (2020) Cunha M. S., Avelino P. P., Chaplin W. J., 2020, MNRAS, 499, 4687
- David-Uraz et al. (2019) David-Uraz A., et al., 2019, MNRAS, 487, 304
- Deal et al. (2021) Deal M., Cunha M. S., Keszthelyi Z., Perraut K., Holdsworth D. L., 2021, arXiv e-prints, p. arXiv:2104.08097
- Desidera et al. (2015) Desidera S., et al., 2015, A&A, 573, A126
- Dorokhova & Dorokhov (1998) Dorokhova T. N., Dorokhov N. I., 1998, Contributions of the Astronomical Observatory Skalnate Pleso, 27, 338
- Elkin et al. (2005a) Elkin V. G., Riley J. D., Cunha M. S., Kurtz D. W., Mathys G., 2005a, MNRAS, 358, 665
- Elkin et al. (2005b) Elkin V. G., Kurtz D. W., Mathys G., 2005b, MNRAS, 364, 864
- Elkin et al. (2008) Elkin V., Kurtz D. W., Mathys G., 2008, Contributions of the Astronomical Observatory Skalnate Pleso, 38, 317
- Elkin et al. (2010) Elkin V. G., Kurtz D. W., Mathys G., Freyhammer L. M., 2010, MNRAS, 404, L104
- Elkin et al. (2011) Elkin V. G., Kurtz D. W., Worters H. L., Mathys G., Smalley B., van Wyk F., Smith A. M. S., 2011, MNRAS, 411, 978
- Elkin et al. (2012) Elkin V. G., Kurtz D. W., Nitschelm C., 2012, MNRAS, 420, 2727
- Freyhammer et al. (2008a) Freyhammer L. M., Kurtz D. W., Cunha M. S., Mathys G., Elkin V. G., Riley J. D., 2008a, MNRAS, 385, 1402
- Freyhammer et al. (2008b) Freyhammer L. M., Elkin V. G., Kurtz D. W., Mathys G., Martinez P., 2008b, MNRAS, 389, 441
- Freyhammer et al. (2009) Freyhammer L. M., Kurtz D. W., Elkin V. G., Mathys G., Savanov I., Zima W., Shibahashi H., Sekiguchi K., 2009, MNRAS, 396, 325
- Gaia Collaboration et al. (2016) Gaia Collaboration et al., 2016, A&A, 595, A1
- Gaia Collaboration et al. (2018) Gaia Collaboration et al., 2018, A&A, 616, A1
- Gaia Collaboration et al. (2021) Gaia Collaboration et al., 2021, A&A, 649, A1
- Gelbmann et al. (1997) Gelbmann M., Kupka F., Weiss W. W., Mathys G., 1997, A&A, 319, 630
- Gelbmann et al. (2000) Gelbmann M., Ryabchikova T., Weiss W. W., Piskunov N., Kupka F., Mathys G., 2000, A&A, 356, 200
- Ghazaryan et al. (2019) Ghazaryan S., Alecian G., Hakobyan A. A., 2019, MNRAS, 487, 5922
- Gilmore et al. (2012) Gilmore G., et al., 2012, The Messenger, 147, 25
- Glagolevskij (1994) Glagolevskij Y. V., 1994, Bulletin of the Special Astrophysics Observatory, 38, 152
- Gontcharov (2006) Gontcharov G. A., 2006, Astronomy Letters, 32, 759
- González et al. (2008) González J. F., Hubrig S., Kurtz D. W., Elkin V., Savanov I., 2008, MNRAS, 384, 1140
- Gray & Corbally (1994) Gray R. O., Corbally C. J., 1994, AJ, 107, 742
- Gray & Corbally (2009) Gray R. O., Corbally Christopher J., 2009, Stellar Spectral Classification
- Gray et al. (2006) Gray R. O., Corbally C. J., Garrison R. F., McFadden M. T., Bubar E. J., McGahee C. E., O’Donoghue A. A., Knox E. R., 2006, AJ, 132, 161
- Grenier et al. (1999) Grenier S., et al., 1999, A&AS, 137, 451
- Gruberbauer et al. (2008) Gruberbauer M., et al., 2008, A&A, 480, 223
- Gruberbauer et al. (2011) Gruberbauer M., et al., 2011, A&A, 530, A135
- Gustafsson et al. (2008) Gustafsson B., Edvardsson B., Eriksson K., Jørgensen U. G., Nordlund Å., Plez B., 2008, A&A, 486, 951
- Haakonsen & Rutledge (2009) Haakonsen C. B., Rutledge R. E., 2009, ApJS, 184, 138
- Handler & Paunzen (1999) Handler G., Paunzen E., 1999, A&AS, 135, 57
- Handler et al. (2006) Handler G., et al., 2006, MNRAS, 366, 257
- Hartmann & Hatzes (2015) Hartmann M., Hatzes A. P., 2015, A&A, 582, A84
- Hauck & Mermilliod (1998) Hauck B., Mermilliod M., 1998, A&AS, 129, 431
- Hearnshaw et al. (2003) Hearnshaw J. B., Barnes S. I., Frost N., Kershaw G. M., Graham G., Nankivell G. R., 2003, in Ikeuchi S., Hearnshaw J., Hanawa T., eds, Astronomical Society of the Pacific Conference Series Vol. 289, The Proceedings of the IAU 8th Asian-Pacific Regional Meeting, Volume 1. pp 11–16
- Hensberge et al. (1981) Hensberge H., et al., 1981, A&AS, 46, 151
- Hey et al. (2019) Hey D. R., et al., 2019, MNRAS, 488, 18
- Holdsworth (2016) Holdsworth D. L., 2016, IBVS, 6185, 1
- Holdsworth (2021) Holdsworth D. L., 2021, Frontiers in Astronomy and Space Sciences, 8, 31
- Holdsworth et al. (2014a) Holdsworth D. L., et al., 2014a, MNRAS, 439, 2078
- Holdsworth et al. (2014b) Holdsworth D. L., Smalley B., Kurtz D. W., Southworth J., Cunha M. S., Clubb K. I., 2014b, MNRAS, 443, 2049
- Holdsworth et al. (2016) Holdsworth D. L., Kurtz D. W., Smalley B., Saio H., Handler G., Murphy S. J., Lehmann H., 2016, MNRAS, 462, 876
- Holdsworth et al. (2018a) Holdsworth D. L., et al., 2018a, MNRAS, 473, 91
- Holdsworth et al. (2018b) Holdsworth D. L., Saio H., Bowman D. M., Kurtz D. W., Sefako R. R., Joyce M., Lambert T., Smalley B., 2018b, MNRAS, 476, 601
- Holdsworth et al. (2018c) Holdsworth D. L., Cunha M. S., Shibahashi H., Kurtz D. W., Bowman D. M., 2018c, MNRAS, 480, 2976
- Holdsworth et al. (2019) Holdsworth D. L., Saio H., Kurtz D. W., 2019, MNRAS, 489, 4063
- Houk (1978) Houk N., 1978, Michigan catalogue of two-dimensional spectral types for the HD stars
- Houk (1982) Houk N., 1982, Michigan Catalogue of Two-dimensional Spectral Types for the HD stars. Volume_3. Declinations -40_f0 to -26_f0.
- Houk & Cowley (1975) Houk N., Cowley A. P., 1975, University of Michigan Catalogue of two-dimensional spectral types for the HD stars. Volume I. Declinations -90_ to -53_f0.
- Houk & Smith-Moore (1988) Houk N., Smith-Moore M., 1988, Michigan Catalogue of Two-dimensional Spectral Types for the HD Stars. Volume 4, Declinations -26°.0 to -12°.0.. Vol. 4
- Houk & Swift (1999b) Houk N., Swift C., 1999b, Michigan catalogue of two-dimensional spectral types for the HD Stars ; vol. 5. Vol. 5
- Houk & Swift (1999a) Houk N., Swift C., 1999a, Michigan Spectral Survey, 5, 0
- Hubrig & Nesvacil (2007) Hubrig S., Nesvacil N., 2007, MNRAS, 378, L16
- Hubrig et al. (2000) Hubrig S., Kharchenko N., Mathys G., North P., 2000, A&A, 355, 1031
- Hubrig et al. (2004) Hubrig S., Szeifert T., Schöller M., Mathys G., Kurtz D. W., 2004, A&A, 415, 685
- Hubrig et al. (2005) Hubrig S., et al., 2005, A&A, 440, L37
- Hubrig et al. (2006) Hubrig S., North P., Schöller M., Mathys G., 2006, Astronomische Nachrichten, 327, 289
- Hubrig et al. (2018) Hubrig S., Järvinen S. P., Madej J., Bychkov V. D., Ilyin I., Schöller M., Bychkova L. V., 2018, MNRAS, 477, 3791
- Hümmerich et al. (2016) Hümmerich S., Paunzen E., Bernhard K., 2016, AJ, 152, 104
- Jackson & Stoy (1954) Jackson J., Stoy R. H., 1954, Annals of the Cape Observatory, 17
- Jenkins et al. (2016) Jenkins J. M., et al., 2016, in Chiozzi G., Guzman J. C., eds, Society of Photo-Optical Instrumentation Engineers (SPIE) Conference Series Vol. 9913, Software and Cyberinfrastructure for Astronomy IV. p. 99133E, doi:10.1117/12.2233418
- Joshi et al. (2016) Joshi S., et al., 2016, A&A, 590, A116
- Kervella et al. (2019) Kervella P., Arenou F., Mignard F., Thévenin F., 2019, A&A, 623, A72
- Khalack et al. (2019) Khalack V., et al., 2019, MNRAS, 490, 2102
- Kniazev et al. (2016) Kniazev A. Y., Gvaramadze V. V., Berdnikov L. N., 2016, MNRAS, 459, 3068
- Kniazev et al. (2017) Kniazev A. Y., Gvaramadze V. V., Berdnikov L. N., 2017, in Balega Y. Y., Kudryavtsev D. O., Romanyuk I. I., Yakunin I. A., eds, Astronomical Society of the Pacific Conference Series Vol. 510, Stars: From Collapse to Collapse. p. 480 (arXiv:1612.00292)
- Kobzar (2020) Kobzar O., 2020, Master’s thesis, Université de Moncton, Canada
- Kobzar et al. (2020) Kobzar O., et al., 2020, in Wade G., Alecian E., Bohlender D., Sigut A., eds, Vol. 11, Stellar Magnetism: A Workshop in Honour of the Career and Contributions of John D. Landstreet. pp 214–218 (arXiv:2003.05337)
- Kochukhov (2003) Kochukhov O., 2003, A&A, 404, 669
- Kochukhov (2004) Kochukhov O., 2004, ApJ, 615, L149
- Kochukhov (2006) Kochukhov O., 2006, A&A, 446, 1051
- Kochukhov (2011) Kochukhov O., 2011, in Prasad Choudhary D., Strassmeier K. G., eds, Vol. 273, Physics of Sun and Star Spots. pp 249–255 (arXiv:1010.0264), doi:10.1017/S1743921311015328
- Kochukhov & Bagnulo (2006) Kochukhov O., Bagnulo S., 2006, A&A, 450, 763
- Kochukhov & Ryabchikova (2001) Kochukhov O., Ryabchikova T., 2001, A&A, 377, L22
- Kochukhov et al. (2004) Kochukhov O., Drake N. A., Piskunov N., de la Reza R., 2004, A&A, 424, 935
- Kochukhov et al. (2007) Kochukhov O., Ryabchikova T., Weiss W. W., Landstreet J. D., Lyashko D., 2007, MNRAS, 376, 651
- Kochukhov et al. (2008) Kochukhov O., Ryabchikova T., Bagnulo S., Lo Curto G., 2008, A&A, 479, L29
- Kochukhov et al. (2009a) Kochukhov O., Bagnulo S., Lo Curto G., Ryabchikova T., 2009a, A&A, 493, L45
- Kochukhov et al. (2009b) Kochukhov O., Shulyak D., Ryabchikova T., 2009b, A&A, 499, 851
- Kochukhov et al. (2013) Kochukhov O., Alentiev D., Ryabchikova T., Boyko S., Cunha M., Tsymbal V., Weiss W., 2013, MNRAS, 431, 2808
- Kordopatis et al. (2013) Kordopatis G., et al., 2013, AJ, 146, 134
- Kreidl (1990) Kreidl T. J., 1990, IBVS, 3539, 1
- Kreidl et al. (1991) Kreidl T. J., Kurtz D. W., Bus S. J., Kuschnig R., Birch P. B., Candy M. P., Weiss W. W., 1991, MNRAS, 250, 477
- Kudryavtsev & Romanyuk (2003) Kudryavtsev D. O., Romanyuk I. I., 2003, Astrophysics, 46, 234
- Kudryavtsev & Romanyuk (2012) Kudryavtsev D. O., Romanyuk I. I., 2012, Astronomische Nachrichten, 333, 41
- Kudryavtsev et al. (2006) Kudryavtsev D. O., Romanyuk I. I., Elkin V. G., Paunzen E., 2006, MNRAS, 372, 1804
- Kudryavtsev et al. (2007) Kudryavtsev D. O., Romanyuk I. I., Semenko E. A., Solov’ev G. A., 2007, Astrophysical Bulletin, 62, 147
- Kunder et al. (2017) Kunder A., et al., 2017, AJ, 153, 75
- Kupka et al. (1996) Kupka F., Ryabchikova T. A., Weiss W. W., Kuschnig R., Rogl J., Mathys G., 1996, A&A, 308, 886
- Kurtz (1978) Kurtz D. W., 1978, IBVS, 1436, 1
- Kurtz (1981) Kurtz D. W., 1981, IBVS, 1915, 1
- Kurtz (1982) Kurtz D. W., 1982, MNRAS, 200, 807
- Kurtz (1983) Kurtz D. W., 1983, MNRAS, 205, 3
- Kurtz (1984) Kurtz D. W., 1984, MNRAS, 209, 841
- Kurtz (1985) Kurtz D. W., 1985, MNRAS, 213, 773
- Kurtz (1990) Kurtz D. W., 1990, MNRAS, 242, 489
- Kurtz & Cropper (1981) Kurtz D. W., Cropper M. S., 1981, IBVS, 1987, 1
- Kurtz & Holdsworth (2020) Kurtz D. W., Holdsworth D. L., 2020, Astrophysics and Space Science Proceedings, 57, 313
- Kurtz & Kreidl (1985) Kurtz D. W., Kreidl T. J., 1985, MNRAS, 216, 987
- Kurtz & Marang (1987a) Kurtz D. W., Marang F., 1987a, MNRAS, 228, 141
- Kurtz & Marang (1987b) Kurtz D. W., Marang F., 1987b, MNRAS, 229, 285
- Kurtz & Martinez (1987) Kurtz D. W., Martinez P., 1987, MNRAS, 226, 187
- Kurtz & Martinez (1993) Kurtz D. W., Martinez P., 1993, in Dworetsky M. M., Castelli F., Faraggiana R., eds, Astronomical Society of the Pacific Conference Series Vol. 44, IAU Colloq. 138: Peculiar versus Normal Phenomena in A-type and Related Stars. p. 561
- Kurtz & Martinez (1994) Kurtz D. W., Martinez P., 1994, IBVS, 4013, 1
- Kurtz et al. (1981) Kurtz D. W., Allen S., Cropper M. S., 1981, IBVS, 2033, 1
- Kurtz et al. (1990) Kurtz D. W., van Wyk F., Marang F., 1990, MNRAS, 243, 289
- Kurtz et al. (1994a) Kurtz D. W., Sullivan D. J., Martinez P., Tripe P., 1994a, MNRAS, 270, 674
- Kurtz et al. (1994b) Kurtz D. W., Martinez P., Tripe P., 1994b, MNRAS, 271, 421
- Kurtz et al. (1996a) Kurtz D. W., Marang F., van Wyk F., Roberts G., 1996a, MNRAS, 280, 1
- Kurtz et al. (1996b) Kurtz D. W., Martinez P., Koen C., Sullivan D. J., 1996b, MNRAS, 281, 883
- Kurtz et al. (1997a) Kurtz D. W., van Wyk F., Roberts G., Marang F., Handler G., Medupe R., Kilkenny D., 1997a, MNRAS, 287, 69
- Kurtz et al. (1997b) Kurtz D. W., Martinez P., Tripe P., Hanbury A. G., 1997b, MNRAS, 289, 645
- Kurtz et al. (2003) Kurtz D. W., Elkin V. G., Mathys G., 2003, MNRAS, 343, L5
- Kurtz et al. (2005) Kurtz D. W., et al., 2005, MNRAS, 358, 651
- Kurtz et al. (2006a) Kurtz D. W., Elkin V. G., Mathys G., 2006a, MNRAS, 370, 1274
- Kurtz et al. (2006b) Kurtz D. W., Elkin V. G., Cunha M. S., Mathys G., Hubrig S., Wolff B., Savanov I., 2006b, MNRAS, 372, 286
- Kurtz et al. (2008) Kurtz D. W., Hubrig S., González J. F., van Wyk F., Martinez P., 2008, MNRAS, 386, 1750
- Kurtz et al. (2011) Kurtz D. W., et al., 2011, MNRAS, 414, 2550
- Landstreet & Mathys (2000) Landstreet J. D., Mathys G., 2000, A&A, 359, 213
- LeBlanc et al. (2009) LeBlanc F., Monin D., Hui-Bon-Hoa A., Hauschildt P. H., 2009, A&A, 495, 937
- Lenz & Breger (2005) Lenz P., Breger M., 2005, Communications in Asteroseismology, 146, 53
- Lorenz et al. (2005) Lorenz D., Handler G., Kurtz D. W., 2005, IBVS, 5651, 1
- Lüftinger et al. (2010) Lüftinger T., Kochukhov O., Ryabchikova T., Piskunov N., Weiss W. W., Ilyin I., 2010, A&A, 509, A71
- Manfroid & Mathys (1986) Manfroid J., Mathys G., 1986, A&AS, 64, 9
- Martinez (1991) Martinez P., 1991, IBVS, 3621, 1
- Martinez & Kauffmann (1990) Martinez P., Kauffmann G., 1990, IBVS, 3507, 1
- Martinez & Kurtz (1990) Martinez P., Kurtz D. W., 1990, IBVS, 3509, 1
- Martinez & Kurtz (1991a) Martinez P., Kurtz D. W., 1991a, IBVS, 3553, 1
- Martinez & Kurtz (1991b) Martinez P., Kurtz D. W., 1991b, IBVS, 3611, 1
- Martinez & Kurtz (1992) Martinez P., Kurtz D. W., 1992, IBVS, 3750, 1
- Martinez & Kurtz (1994a) Martinez P., Kurtz D. W., 1994a, MNRAS, 271, 118
- Martinez & Kurtz (1994b) Martinez P., Kurtz D. W., 1994b, MNRAS, 271, 129
- Martinez et al. (1990) Martinez P., Kurtz D. W., Heller C. H., 1990, MNRAS, 246, 699
- Martinez et al. (1991) Martinez P., Kurtz D. W., Kauffmann G. M., 1991, MNRAS, 250, 666
- Martinez et al. (1993a) Martinez P., Kurtz D. W., Kreidl T. J., Koen C., van Wyk F., Marang F., Roberts G., 1993a, MNRAS, 263, 273
- Martinez et al. (1993b) Martinez P., Kurtz D. W., Ashley R., 1993b, IBVS, 3844, 1
- Martinez et al. (1994) Martinez P., Kurtz D. W., van Wyk F., 1994, MNRAS, 271, 305
- Martinez et al. (1995) Martinez P., Kurtz D. W., Hoffman M. J. H., van Wyk F., 1995, MNRAS, 276, 1435
- Martinez et al. (1998a) Martinez P., Marang F., van Wyk F., Roberts G. R., 1998a, The Observatory, 118, 153
- Martinez et al. (1998b) Martinez P., Koen C., Sullivan D. J., 1998b, MNRAS, 300, 188
- Martinez et al. (1998c) Martinez P., Meintjes P., Ratcliff S. J., Engelbrecht C., 1998c, A&A, 334, 606
- Masana et al. (1998) Masana E., Jordi C., Maitzen H. M., Torra J., 1998, A&AS, 128, 265
- Mason et al. (2001) Mason B. D., Wycoff G. L., Hartkopf W. I., Douglass G. G., Worley C. E., 2001, AJ, 122, 3466
- Mathys (1985) Mathys G., 1985, A&A, 151, 315
- Mathys (1991) Mathys G., 1991, A&AS, 89, 121
- Mathys (2017) Mathys G., 2017, A&A, 601, A14
- Mathys & Hubrig (1997) Mathys G., Hubrig S., 1997, A&AS, 124, 475
- Mathys et al. (1996) Mathys G., Kharchenko N., Hubrig S., 1996, A&A, 311, 901
- Mathys et al. (1997) Mathys G., Hubrig S., Landstreet J. D., Lanz T., Manfroid J., 1997, A&AS, 123, 353
- Mathys et al. (2007) Mathys G., Kurtz D. W., Elkin V. G., 2007, MNRAS, 380, 181
- Mathys et al. (2020a) Mathys G., Khalack V., Landstreet J. D., 2020a, A&A, 636, A6
- Mathys et al. (2020b) Mathys G., Kurtz D. W., Holdsworth D. L., 2020b, A&A, 639, A31
- Matthews (1987) Matthews J. M., 1987, PhD thesis, The University of Western Ontario, Canada
- Matthews et al. (1999) Matthews J. M., Kurtz D. W., Martinez P., 1999, ApJ, 511, 422
- McDonald et al. (2012) McDonald I., Zijlstra A. A., Boyer M. L., 2012, MNRAS, 427, 343
- McDonald et al. (2017) McDonald I., Zijlstra A. A., Watson R. A., 2017, MNRAS, 471, 770
- Medupe et al. (2015) Medupe R., Kurtz D. W., Elkin V. G., Mguda Z., Mathys G., 2015, MNRAS, 446, 1347
- Michaud et al. (1981) Michaud G., Megessier C., Charland Y., 1981, A&A, 103, 244
- Mkrtichian & Hatzes (2005) Mkrtichian D. E., Hatzes A. P., 2005, A&A, 430, 263
- Moon & Dworetsky (1985) Moon T. T., Dworetsky M. M., 1985, MNRAS, 217, 305
- Murphy et al. (2019) Murphy S. J., Hey D., Van Reeth T., Bedding T. R., 2019, MNRAS, 485, 2380
- Murphy et al. (2020) Murphy S. J., Saio H., Takada-Hidai M., Kurtz D. W., Shibahashi H., Takata M., Hey D. R., 2020, MNRAS, 498, 4272
- Nelson & Kreidl (1993) Nelson M. J., Kreidl T. J., 1993, AJ, 105, 1903
- Netopil et al. (2017) Netopil M., Paunzen E., Hümmerich S., Bernhard K., 2017, MNRAS, 468, 2745
- North (1984) North P., 1984, A&A, 141, 328
- North et al. (1997) North P., Jaschek C., Hauck B., Figueras F., Torra J., Kunzli M., 1997, in Bonnet R. M., et al., eds, ESA Special Publication Vol. 402, Hipparcos - Venice ’97. pp 239–244
- Oelkers et al. (2018) Oelkers R. J., et al., 2018, AJ, 155, 39
- Paunzen (2015) Paunzen E., 2015, A&A, 580, A23
- Paunzen et al. (2012) Paunzen E., Netopil M., Rode-Paunzen M., Handler G., Božić H., Ruždjak D., Sudar D., 2012, A&A, 542, A89
- Paunzen et al. (2018) Paunzen E., et al., 2018, Research in Astronomy and Astrophysics, 18, 135
- Perraut et al. (2016) Perraut K., Brandão I., Cunha M., Shulyak D., Mourard D., Nardetto N., ten Brummelaar T. A., 2016, A&A, 590, A117
- Perry (1991) Perry C. L., 1991, PASP, 103, 494
- Perry & Christodoulou (1996) Perry C. L., Christodoulou D. M., 1996, PASP, 108, 772
- Pollacco et al. (2006) Pollacco D. L., et al., 2006, PASP, 118, 1407
- Quitral-Manosalva et al. (2018) Quitral-Manosalva P., Cunha M. S., Kochukhov O., 2018, MNRAS, 480, 1676
- Reiners & Zechmeister (2020) Reiners A., Zechmeister M., 2020, ApJS, 247, 11
- Renson & Manfroid (2009) Renson P., Manfroid J., 2009, A&A, 498, 961
- Renson et al. (1991) Renson P., Gerbaldi M., Catalano F. A., 1991, A&AS, 89, 429
- Ricker et al. (2015) Ricker G. R., et al., 2015, Journal of Astronomical Telescopes, Instruments, and Systems, 1, 014003
- Romanyuk et al. (2016) Romanyuk I. I., Semenko E. A., Kudryavtsev D. O., Moiseevaa A. V., 2016, Astrophysical Bulletin, 71, 302
- Rusomarov et al. (2013) Rusomarov N., et al., 2013, A&A, 558, A8
- Rusomarov et al. (2015) Rusomarov N., Kochukhov O., Ryabchikova T., Piskunov N., 2015, A&A, 573, A123
- Ryabchikova et al. (2004) Ryabchikova T., Nesvacil N., Weiss W. W., Kochukhov O., Stütz C., 2004, A&A, 423, 705
- Ryabchikova et al. (2007) Ryabchikova T., Sachkov M., Kochukhov O., Lyashko D., 2007, A&A, 473, 907
- Ryabchikova et al. (2008) Ryabchikova T., Kochukhov O., Bagnulo S., 2008, A&A, 480, 811
- Ryabchikova et al. (2015) Ryabchikova T., Piskunov N., Kurucz R. L., Stempels H. C., Heiter U., Pakhomov Y., Barklem P. S., 2015, Phys. Scr., 90, 054005
- Sahoo et al. (2020) Sahoo S. K., Baran A. S., Sanjayan S., Ostrowski J., 2020, MNRAS, 499, 5508
- Saio (2005) Saio H., 2005, MNRAS, 360, 1022
- Saio & Gautschy (2004) Saio H., Gautschy A., 2004, MNRAS, 350, 485
- Samus’ et al. (2003) Samus’ N. N., et al., 2003, Astronomy Letters, 29, 468
- Samus’ et al. (2017) Samus’ N. N., Kazarovets E. V., Durlevich O. V., Kireeva N. N., Pastukhova E. N., 2017, Astronomy Reports, 61, 80
- Schneider & Weiss (1990) Schneider H., Weiss W. W., 1990, IBVS, 3520, 1
- Schneider et al. (1992) Schneider H., Kreidl T. J., Weiss W. W., 1992, A&A, 257, 130
- Schofield et al. (2019) Schofield M., et al., 2019, ApJS, 241, 12
- Shavrina et al. (2014) Shavrina A. V., Khalack V., Glagolevskij Y., Lyashko D., Landstreet J., Leone F., Giarrusso M., 2014, in Petit P., Jardine M., Spruit H. C., eds, Vol. 302, Magnetic Fields throughout Stellar Evolution. pp 274–275, doi:10.1017/S1743921314002269
- Shibahashi (1979) Shibahashi H., 1979, PASJ, 31, 87
- Shibahashi & Saio (1985) Shibahashi H., Saio H., 1985, PASJ, 37, 601
- Sikora et al. (2019a) Sikora J., Wade G. A., Power J., Neiner C., 2019a, MNRAS, 483, 2300
- Sikora et al. (2019b) Sikora J., Wade G. A., Power J., Neiner C., 2019b, MNRAS, 483, 3127
- Sikora et al. (2019c) Sikora J., et al., 2019c, MNRAS, 487, 4695
- Skiff (2014) Skiff B. A., 2014, VizieR Online Data Catalog, p. B/mk
- Smalley et al. (2015) Smalley B., et al., 2015, MNRAS, 452, 3334
- Sousa & Cunha (2011) Sousa J. C., Cunha M. S., 2011, MNRAS, 414, 2576
- Stassun et al. (2019) Stassun K. G., et al., 2019, AJ, 158, 138
- Stȩpień (2000) Stȩpień K., 2000, A&A, 353, 227
- Stevens et al. (2017) Stevens D. J., Stassun K. G., Gaudi B. S., 2017, AJ, 154, 259
- Stibbs (1950) Stibbs D. W. N., 1950, MNRAS, 110, 395
- Suchkov et al. (2003) Suchkov A. A., Makarov V. V., Voges W., 2003, ApJ, 595, 1206
- Tassoul (1980) Tassoul M., 1980, ApJS, 43, 469
- Trifonov et al. (2020) Trifonov T., Tal-Or L., Zechmeister M., Kaminski A., Zucker S., Mazeh T., 2020, A&A, 636, A74
- Vauclair & Théado (2004) Vauclair S., Théado S., 2004, A&A, 425, 179
- Vogt & Faundez (1979) Vogt N., Faundez A. M., 1979, A&AS, 36, 477
- Wade (1997) Wade G. A., 1997, A&A, 325, 1063
- Watson et al. (2006) Watson C. L., Henden A. A., Price A., 2006, Society for Astronomical Sciences Annual Symposium, 25, 47
- Weiss et al. (2016) Weiss W. W., et al., 2016, A&A, 588, A54
- Weiss et al. (2020) Weiss W. W., et al., 2020, A&A, 642, A64
- White et al. (2011) White T. R., Bedding T. R., Stello D., Kurtz D. W., Cunha M. S., Gough D. O., 2011, MNRAS, 415, 1638
Appendix A Author Affiliations
1Jeremiah Horrocks Institute, University of Central Lancashire, Preston PR1 2HE, UK
2Instituto de Astrofísica e Ciências do Espaço, Universidade do Porto CAUP, Rua das Estrelas, PT4150-762 Porto, Portugal
3Centre for Space Research, Physics Department, North West University, Mahikeng, 2745, South Africa
4DTU Space, National Space Institute, Technical University of Denmark, Elektrovej 328, 2800 Kgs., Lyngby, Denmark
5Stellar Astrophysics Centre, Aarhus University, DK-8000 Aarhus C, Denmark
6School of Physics, Sydney Institute for Astronomy (SIfA), The University of Sydney, NSW 2006, Australia
7Institute of Astronomy, KU Leuven, Celestijnenlaan 200D, 3001 Leuven, Belgium
8Département de Physique et d’Astronomie, Université de Moncton, 18 avenue Antonine-Maillet, Moncton, NB E1A 3E9, Canada
9Department of Chemistry and Physics, Florida Gulf Coast University, 10501 FGCU Blvd. S., Fort Myers, FL 33965 USA
10Department of Physics and Astronomy, Uppsala University, Box 516, 75120 Uppsala, Sweden
11Astronomical Institute of University of Wrocław, ul. Kopernika 11, 51-622 Wrocław, Poland
12Ankara University, Faculty of Science, Dept. of Astronomy and Space Sciences, 06100, Tandogan - Ankara / Turkey
13Department of Astronomy, School of Physics, Peking University, Beijing 100871, People’s Republic of China
14Kavli Institute for Astronomy and Astrophysics, Peking University, Beijing 100871, People’s Republic of China
15Konkoly Observatory, Research Centre for Astronomy and Earth Sciences, ELKH, H-1121 Konkoly Thege Miklós út 15-17, Budapest, Hungary
16MTA CSFK Lendület Near-Field Cosmology Research Group
17ELTE Eötvös Loránd University, Institute of Physics, Budapest, Hungary
18Max-Planck-Institut für Sonnensystemforschung, Justus-von-Liebig-Weg 3, 37077 Göttingen, Germany
19Núcleo de Astronomía, Facultad de Ingeniería y Ciencias, Universidad Diego Portales, Av. Ejército Libertador 441, Santiago, Chile
20Instituto de Astronomía–Universidad Nacional Autónoma de México, Ap. P. 877, Ensenada, BC 22860, Mexico
21Instituto de Astrofísica de Andalucía (CSIC), Glorieta de la Astronomía s/n, E-18008 Granada, Spain
22Physics Department, Mount Allison University, Sackville, NB, Canada, E4L1E6
23National Astronomical Research Institue of Thailand, 260 Moo 4, T. Donkaew, A. Maerim, Chiangmai, 50180 Thailand
24Department of Theoretical Physics and Astrophysics, Masaryk University, Kotlářská 2, 611 37 Brno, Czech Republic
25School of Earth and Space Exploration, Arizona State University, Tempe, AZ 85281, USA
26Physics and Astronomy Department, Bishop’s University, 2600 College Street, Sherbrooke, QC J1M 1Z7, Canada
27School of Physics, Xi’an Jiaotong University, 710049 Xi’an, People’s Republic of China
28Department of Physics, University of York, Heslington, York, YO10 5DD, UK
29School of Physical and Chemical Sciences, Te Kura Matū, University of Canterbury, Christchurch 8020, New Zealand
30Department of Physics and Astronomy, Howard University, Washington, DC 20059, USA
31Center for Research and Exploration in Space Science and Technology, and X-ray Astrophysics Laboratory, NASA/GSFC, Greenbelt, MD 20771, USA
32ELTE Eötvös Loránd University, Gothard Astrophysical Observatory, Szombathely, Hungary
33MTA-ELTE Exoplanet Research Group, 9700 Szombathely, Szent Imre h. u. 112, Hungary
34Dept. Física Teórica y del Cosmos, Universidad de Granada, Campus de Fuentenueva s/n, E-18071 Granada, Spain
35Los Alamos National Laboratory, MS T-082, Los Alamos, NM 87545 USA
36Department of Astronomy, University of Cape Town, Private Bag X3, Rondebosch 7701, South Africa
37Núcleo de Astronomía de la Facultad de Ingeniería y Ciencias, Universidad Diego Portales, Av. Ejército Libertador 441, Santiago, Chile
38Koninklijke Sterrenwacht van België, Ringlaan 3, 1180 Brussel, Belgium
38LESIA, UMR 8109, Observatoire de Paris et Université Pierre et Marie Curie Sorbonne Universités, place J. Janssen, Meudon, France
40Departamento de Física, Universidad Técnica Federico Santa María, Avda. España 1680, Valparaíso, Chile
41Astrophysics Group, Keele University, Staffordshire ST5 5BG, UK
42Institute of Astronomy and NAO, Bulgarian Academy of Sciences, blvd. Tsarigradsko chaussee 72, Sofia 1784, Bulgaria
43Department of Physics and Kavli Institute for Astrophysics and Space Research, Massachusetts Institute of Technology, Cambridge, MA 02139, USA
Appendix B Spectral classification plots
Here we provide the spectral classification plots used to provide new or updated spectral classifications. We have used the SpUpNIC long slit spectrograph mounted on the SAAO 1.9-m telescope to record these spectra. We used grating 4 with a grating angle of 4.2∘, with observations typically made with a 1 arcsec slit to reach a resolving power of , but was widened in poor seeing or low sky transparency situations. The data were flat field and bias corrected, cleaned of cosmic rays, and had a wavelength solution applied using a CuAr reference spectrum obtained directly after the science observation. The spectra were normalised using an automated spline fitting procedure in ispec spectral analysis software (Blanco-Cuaresma et al., 2014; Blanco-Cuaresma, 2019). We also provide, in Table 4, a log of all spectroscopic observations related to this work.
| TIC | Spectrograph | Resolution | Nobs |
| 119327278 | HRS | 63000 | 1 |
| 170586794 | SpUpNIC | 7500 | 1B |
| HRS | 63000 | 1 | |
| 176516923 | SpUpNIC | 7500 | 1B |
| 294266638 | SpUpNIC | 7500 | 1B |
| 310817678 | HRS | 43000 | 4 |
| 356088697 | SpUpNIC | 7500 | 1B |
| 380651050 | HRS | 63000 | 1 |
| 466260580 | HRS | 63000 | 1 |
| 12968953 | SpUpNIC | 7500 | 1B |
| HRS | 63000 | 2 | |
| 17676722 | SpUpNIC | 7500/4700 | 2B,1R |
| 41259805 | SpUpNIC | 7500 | 4B |
| HRS | 63000 | 1 | |
| 49818005 | SpUpNIC | 7500 | 3B |
| HRS | 63000 | 1 | |
| 152808505 | SpUpNIC | 7500 | 1B |
| HRS | 63000 | 1 | |
| 156886111 | SpUpNIC | 7500/4700 | 1B,1R |
| HRS | 63000 | 1 | |
| 259587315 | SpUpNIC | 7500 | 3B |
| HRS | 63000 | 1 | |
| 349945078 | SpUpNIC | 7500/4700 | 2B,3R |
| HRS | 63000 | 1 | |
| 350146296 | SpUpNIC | 7500/4700 | 5B,1R |
| HRS | 63000 | 2 | |
| HERCULES | 41000 | 6 | |
| 431380369 | SpUpNIC | 7500 | 2B |
| HRS | 63000 | 1 | |
| 3814749 | SpUpNIC | 7500 | 1B |
| 410163387 | SpUpNIC | 7500 | 1B |
| HRS | 63000 | 1 |
Where we have high resolution data available, we plot two regions of useful in identifying chemical peculiarities in Ap stars in Fig. 51 and Fig. 52.


