Evolution of high-redshift quasar hosts and promotion of massive black hole seed formation
Abstract
High-redshift luminous quasars powered by accreting supermassive black holes (SMBHs) with mass constrain their formation pathways. We investigate the formation of heavy seeds of SMBHs through gas collapse in the quasar host progenitors, using merger trees to trace the halo growth in highly-biased, overdense regions of the universe. The progenitor halos are likely irradiated by intense H2-photodissociating radiation from nearby star-forming galaxies and heat the interior gas by successive mergers. The kinetic energy of the gas originating from mergers as well as baryonic streaming motion prevents gas collapse and delays prior star formation. With a streaming velocity higher than the root-mean-square value, gas clouds in nearly all realizations of merger trees enter the atomic-cooling stage and begin to collapse isothermally with via Ly cooling. The fraction of trees which host isothermal gas collapse is and increases with streaming velocity, while the rest form H2-cooled cores after short isothermal phases. If the collapsing gas is enriched to , requiring efficient metal mixing, this fraction could be reduced by additional cooling via metal fine-structure lines. In the massive collapsing gas, the accretion rate onto a newly-born protostar ranges between , among which a large fraction exceeds the critical rate suppressing stellar radiative feedback. As a result, we expect a distribution of stellar mass (presumably BH mass) ranging from several hundred to above , potentially forming massive BH binary mergers and yielding gravitational wave events.
1 Introduction
Supermassive black holes (SMBHs) with masses of are one of the most fundamental ingredients on the structure formation paradigm and are believed to coevolve with their host galaxies over the cosmic timescale through gas feeding and feedback processes (Kormendy & Ho, 2013). The existence of high-redshift quasars at suggests that such monster SMBHs form in the first billion years of the cosmic age (Fan et al., 2006; Mortlock et al., 2011; Wu et al., 2015; Jiang et al., 2016; Matsuoka et al., 2018; Onoue et al., 2019; Wang et al., 2021) via rapid assembly processes, such as the formation of heavy BH seeds (initial mass), rapid mass growth via gas accretion, or a combination of the two mechanisms (see a review by Inayoshi et al. 2020).
For massive seed BH formation, a sufficiently high accretion rate of gas onto stellar objects is required. In early protogalaxies where the halo virial temperature is as high as and the temperature of a self-gravitating gas cloud is as warm as that value, the mass accretion rate is expected to be , where is the sound speed of the gas and is the gravitational constant. To keep the gas warm against efficient cooling via H2 lines, several mechanisms suppressing, delaying, and counteracting H2 formation/cooling have been proposed by many previous studies in literature: photo-dissociation of H2 by Lyman-Werner (LW) radiation (Omukai, 2001; Oh & Haiman, 2002; Shang et al., 2010; Latif et al., 2013; Inayoshi et al., 2014; Sugimura et al., 2014; Regan et al., 2014; Visbal et al., 2014a; Chon et al., 2016), supersonic baryonic streaming motion relative to dark matter (Tanaka & Li, 2014; Hirano et al., 2018; Inayoshi et al., 2018; Schauer et al., 2019), and rapid halo mergers which cause heating (Yoshida et al., 2003; Wise et al., 2019; Lupi et al., 2021) as well as reduce H2 cooling through accretion shocks (Fernandez et al., 2014) All the three processes bring the gas cloud into a dense and hot region on the gas phase diagram, where collisional dissociation from the excited rovibrational levels of H2 reduces the H2 fraction (Inayoshi & Omukai, 2012). In the subsequent stage, the gas collapses almost isothermally, keeping itself as warm as and avoiding vigorous gas fragmentation into smaller clumps (Bromm & Loeb, 2003; Latif et al., 2013; Inayoshi et al., 2014; Becerra et al., 2015; Chon et al., 2018). Due to global and monolithic collapse of the warm cloud, the embryonic protostar is fed by rapidly accreting gas at a rate of through a compact accretion disk where gas clumps could quickly migrate inward and merge with the central protostar (Inayoshi & Haiman, 2014; Sakurai et al., 2016). Moreover, since the protostar evolves with an expanding stellar envelope due to rapid entropy inject from the accreting matter, the surface temperature is limited to , which is too low for the protostar to emit ionizing radiation (Hosokawa et al., 2013; Haemmerlé et al., 2018). As a result of inefficient radiative feedback, the protostar would likely reach before the end of its lifetime and collapse into a massive seed BH. However, those formation sites of mass seed BHs are expected to be as rare as the number density of high- quasars in a comoving volume ( from Willott et al., 2010).
Recent cosmological hydrodynamical simulations have suggested that the conditions required to form massive seeds should be more modest than previously considered (e.g., Wise et al., 2019). Even with a moderate level of LW radiation, streaming motion and merger heating, a high mass accretion rate is sustained at larger radii in a protogalaxy, although the isothermality of gas is not maintained at high densities (). Under such less stringent situations, the average mass accretion rate onto the central protostar is reduced but the peak rate can exceed the critical rate for bifurcating the protostellar evolution (Latif & Volonteri, 2015; Hirano et al., 2017; Regan et al., 2020b). As a result, the central star grows to the intermediate mass regime at , which is lower than originally expected the expected mass for a SMS but still massive enough to form massive seeds that will end up as high- SMBHs (Sakurai et al., 2020a, Toyouchi et al. in prep). Therefore, those environmental effects are potentially important to initiate intermediate massive BHs (IMBHs) in the high- universe by (Inayoshi et al., 2020), and form gravitational-wave sources for the space-based GW interferometers such as LISA, Taiji, and Tianqin (Sesana et al., 2008; Amaro-Seoane et al., 2017; Bonetti et al., 2019; Dayal et al., 2019; Luo et al., 2016) However, we emphasize that the massive seed forming halos in those scenarios do not necessarily merge into high- quasar host galaxies.
In this paper, we consider a new scenario of the massive seed formation in biased, over-dense regions with mass variance, where high- SMBHs are expected to form (Wyithe & Padmanabhan, 2006). In such intrinsically rare patches of the universe, stronger halo clustering increases the frequency of halo mergers and boosts the mean intensity of LW radiation background in the regions. Therefore, the modest conditions required to form massive seeds with will be naturally satisfied there. We generate merger trees of the progenitor halos that end up a high- quasar host, based on the extended Press-Schechter formalism, and quantify the expected mean LW intensity irradiating the main progenitors and the merger heating rate along with the trees. By taking into account the environmental input, the thermal and dynamical evolution of a massive gas cloud in the main progenitor halo is calculated in a self-consistent way.
Among previous studies in literature, Valiante et al. (2016) investigated the origin of SMBHs using semi-analytical models and found massive BHs seeded in the quasar progenitor halos, depending on their environmental effects. Recently, Lupi et al. (2021) also proposed a similar idea that massive seed BH formation would be much more efficient in a biased halo merger tree based on dark matter (DM) only N-body simulation. They found that in an overdense region, a large number of atomic-cooling halos experience successive merger heating that counteracts radiative cooling via H2 lines and potentially promote massive seed formation. However, most of the halos in their samples do not end up in the most massive DM halo that is supposed to be a high- quasar host. Instead, we study the statistical properties of the progenitor halos of a high- quasar host by generating merger trees. Moreover, we explicitly follow the evolution of gas clouds in the main progenitors, taking into account merger heating, radiative cooling, and chemical reaction networks. Thus, the two studies are complementary.
This paper is organized as follows. In §2, we summarize our construction of merger histories of a quasar host, the calculation of environmental LW intensity for individual halos, and subsequent gas evolution following the underlying halo mass growth. In §3, we discuss the results of LW intensity, the fraction of promising heavy seed formation sites, and the distribution of accretion rate realized. In §4, we quantify the critical metallicity that affects thermal evolution of gas and the efficiency of metal enrichment, and discuss caveats of our model. In §5, we show the mass distribution of seed BHs formed in the high- quasar progenitors. Finally, in §6, we summarize the main conclusions of this paper.
2 methodology
In order to investigate the evolution of luminous quasar progenitors that form in rare, overdense regions in the universe at redshift , we construct the merger history of DM halos up to , and model the evolution of the gas properties within the DM halos along each merger tree. The processes we model consist of three parts: (1) We first construct the hierarchical merger history of a quasar host halo using the Monte Carlo merger tree algorithm. For a SMBH powering the luminous quasar at , the halo mass is estimated to be by comparing the growth rate of quasar density indicated from observations with that predicted by the Press-Schechter formalism (Wyithe & Padmanabhan, 2006). We therefore focus our analysis on halos that grow to at . (2) For a given merger tree, we calculate the LW radiation background produced by the surrounding star-forming galaxies at each redshift, in order to model the radiative impact on the gas within the halo. (3) The evolution of the gas in the parent halo of each tree is studied by taking into account the injection of thermal and kinetic energy due to violent merger events, as well as LW irradiation calculated in step (2) that dissociates the gas coolants. In the following subsections, we describe in detail the three key ingredients. Throughout the paper, we adopt cosmological parameters estimated by Planck assuming a CDM universe (Planck Collaboration et al., 2016), i.e., .
2.1 Merger histories of progenitors
We construct DM merger trees based on the extended Press-Schechter formalism (Press & Schechter, 1974; Lacey & Cole, 1993; Cole et al., 2000) using the GALFORM semi-analytic algorithm summarized in Parkinson et al. (2008). Our sample consists of merger tree realizations for the DM halos that end up as high- quasar hosts with at . For each tree, we adopt a minimum DM halo mass of . Halos smaller than this threshold do not significantly impact the gas evolution, because the critical virial temperature above which gas collapse can be induced by coolant is (see Haiman et al., 1996; Tegmark et al., 1997), corresponding to halo mass higher than (see also Fig. 1). Reflecting the rarity of quasar host galaxies, the progenitor halos form in highly biased regions with mass variance (Mo & White, 2002). Note that the fraction of all matter in such rare halos is .
2.2 Lyman-Werner background intensity
Due to the photo-dissociation of H2 exposed to LW radiation, we also consider the local LW intensity (at , hereafter in units of ) in order to follow the gas evolution in a given progenitor halo. Along each merger tree, we calculate the cumulative from neighboring star-forming galaxies (hereafter source halos). Based on the model developed by Dijkstra et al. (2014), the basic equations and assumptions we adopt are summarized as below.
We consider a DM halo with mass (gas + DM) at redshift , which is supposed to be the main progenitor in a merger tree. The average number of source halos (within mass range ) that populate a surrounding spherical shell (at a physical distance with thickness ) is calculated by
| (1) |
where is the mass function of source halos (Sheth et al., 2001), and denotes the non-linear bias function (Iliev et al., 2003), which gives the deviation (from random) probability of finding a halo with mass at distance from the main progenitor. We set the minimum source halo mass to be , where the halo virial temperature is just above the hydrogen atomic-cooling threshold of , where radiative cooling by Ly emission leads to star formation. In our model, we do not consider the production of LW radiation background by star formation activity in less-massive DM halos. The maximum mass of source halos is determined so that the LW intensity converges towards the higher mass bins, namely in terms of averaged flux, contributions from the halos vanish due to their low abundance. The value of ranges from to and is larger at lower .
Following Dijkstra et al. (2014), we compute the average LW radiation flux that irradiates the target halo. The time-averaged production rate of LW photons (per unit stellar mass) emitted from a surrounding source galaxy is approximated by
| (2) |
where and is the time after a single star burst in the star-forming halo. Thus, the specific LW luminosity from the halo is calculated by
| (3) |
where the mean frequency and frequency width of the LW band () are set to and . The total stellar mass is calculated by , assuming the star formation efficiency to be . The escape fraction of LW photons from the halo is assumed to be unity (). This value tends to be lower for atomic-cooling halos with . As a reference, Schauer et al. (2015) calculated the LW escape fraction for a single PopIII star in an atomic-cooling halo with 1D simulations and found . However, this is considered to be a lower bound because the escape fraction would be higher for 3D calculations through directions with lower optical depths, besides a higher SFR is expected in our case (rather than a single massive star). We estimate the LW luminosity at one free-fall time after the burst of star formation: , where . Using Eqs. (1)-(3), we obtain the mean LW radiation intensity in the target halo as
| (4) |
where and are the minimum and maximum distance of the source halo from the target halo. In the absence of metal pollution, can be safely set by adding the virial radii of the target and source halos. However, metal enrichment of the main progenitor is a main obstacle in the formation scenario of massive seed BHs, because efficient metal-line cooling (and possibly dust thermal emission) will likely lead to gas fragmentation during its gravitational collapse and thus suppress massive star formation. Generically, there are two types of enrichment processes: (1) genetic enrichment due to past star formation episodes in the progenitors, and (2) environmental enrichment owing to metal bubbles created by supernova (SN) explosions in nearby galaxies. In our model, we consider the environmental enrichment process by adopting the minimum distance to source halos as , where is the size of the metal-polluted region surrounding the source halo
| (5) |
where is the stellar mass budget required to form a SN progenitor and is the explosion energy of a SN. The density of gas surrounding the wind is considered to be , where is the IGM baryon density, and corresponding to the typical baryonic overdensity of halos at their virial radius for a NFW profile Dijkstra et al. (2014). Similar to the production of LW radiation, we estimate the size of metal-enriched bubbles at . We note that metal-enrichment through in-situ star formation should be subdominant because intense LW radiation suppresses star formation in low-mass progenitors (see §4).
On the other hand, the maximum distance in the integration is given by , where the and are wavelengths of the lowest LW energy and Ly line, respectively (see Haiman et al., 1997). We consider the redshift effect by cosmic expansion, where is the Hubble constant at redshift and is the light speed. LW photons emitted at are redshifted into one of the Lyman series resonances and are converted into low-energy photons before reaching the target halo. The is thus set as an absorbing screen, i.e., we exclude the contribution of from halos located at .
2.3 Energy injection through halo mergers
The main progenitor halo experiences vigorous halo mergers in the high- universe. Successive merger events, in particular major mergers, inject energy into the gas in the parent halo. At early phase, energy loss through radiative cooling is inefficient, i.e., the cooling timescale is comparable or longer than the Hubble timescale. Gas is heated through shock formation at the halo virial radius in an adiabatic manner. Subsequently, the energy is transported into the halo interior, leading to gas virialization with a nearly constant temperature profile () across all radii (Wise & Abel, 2007). Assuming that the virial equilibrium state is reached after a merger event,
the virial theorem applies to the gas in the post-merger halo, where the internal and kinetic (turbulence) energy is balanced with the gravitational energy as
| (6) |
where , and are the total, thermal, and kinetic energy per unit mass, and is the gravitational energy at the virial radius. In this work, we adopt the NFW potential for DM halos given by
| (7) |
where is the halo virial temperature, the concentration parameter of the DM density profile (Bullock et al., 2001), is the Boltzmann constant, is the mean molecular weight, and is the proton mass. Therefore, the total energy change owing to the halo evolution is given by
| (8) |
where the first term of the right hand side denotes the energy change associated with mass growth and the second term represents the cosmic expansion effect. In the generally turbulent virialized gas, the kinetic-to-thermal energy ratio is equal to 1 around the virial radius, and decreases to at the center (see Wise & Abel, 2007). Adopting this branching ratio of the total injected energy, the thermal and kinetic heating rate associated with mergers are given by and , respectively. Combining Eqs. (6)-(8), the gas temperature follows the halo virial temperature as
| (9) |
This ratio is close to unity for a wide range of (, ) halos of interest, e.g., and for and . Note that our method is different from that adopted in previous papers (e.g., Yoshida et al., 2003; Lupi et al., 2021), where is imposed. The treatment allows us to precisely calculate the radiative cooling rates and chemical reaction coefficients, which sensitively depend on the gas temperature.
2.4 Turbulence and baryonic streaming motion
The kinetic energy injected through mergers is stored in the halo as turbulence. During the viliarization process, turbulence plays an important role on massive star formation (e.g., McKee & Tan, 2002). Namely, turbulence acts as a source of pressure, which stabilizes the gas against its self-gravity and delays the collapse until the cloud becomes massive enough to overcome the turbulent pressure. In addition to turbulence, the baryonic streaming motion relative to the DM produced in the epoch of cosmic recombination at also significantly delays gas collapse and star formation in protogalaxies. The streaming velocity is found to follow a Maxwell-Boltzmann distribution with the root-mean-square speed of at and decays as (Tseliakhovich & Hirata, 2010). We note that the volume fraction of the universe with streaming velocities of is estimated as , , and for , , and , respectively.
Considering both the three-dimensional turbulence and coherent baryonic streaming velocity, we approximate the effective pressure by kinetic motion of gas as
| (10) |
where is the kinetic specific energy accumulated through successive mergers and the coefficient of is required to estimate the pressure due to isotropic turbulence (Chandrasekhar, 1951a, b). With pressure support from turbulence, gas collapse is delayed to different extents, with varying strengths of the streaming motion. In this work, we adopt in our fiducial model, in order to match the delay of collapse obtained from cosmological simulations (Hirano et al., 2018). The total gas pressure is therefore defined by .
2.5 Density evolution
With the energy injection processes defined above, in this section we describe our model for calculating the density evolution of a gas cloud concentrated in a DM halo that grows through successive merger episodes. There are three characteristic stages of the evolution: (1) initial adiabatic phase, (2) transition to isothermal gas due to radiative cooling, and (3) gravitationally collapsing phase in a runaway fashion. We model the gas dynamics in these stages based on a one-zone model (e.g., Omukai, 2001), which is often used to follow the physical quantities at the center of a gravitationally collapsing cloud with a self-similar density profile . However, this profile does not apply to gas in hydrostatic equilibrium before the onset of gravitational collapse. Therefore, we construct a new method to model the three characteristic stages in a physically motivated way.
2.5.1 Adiabatic Stage
In the early stage, since the gas density is not high enough for radiative cooling to operate through collisionally excited transitions, the gas is adiabatically compressed in the DM halo as the underlying DM gravitational potential evolves. In the DM assembly history through mass accretion, the entropy profile of the adiabatic gas is characterized by a power-law outer profile of , and a constant core with , where is the gas entropy at the virial radius (Voit et al., 2003, 2005). This self-similar entropy profile is also found to be established inside high- protogalaxies formed in DM halos more massive than at , while the core entropy for less massive halos is maintained at the IGM entropy when gas decouples from the cosmic microwave background (CMB; see more details in Visbal et al., 2014b). Motivated by both numerical simulations and galaxy cluster observations, we approximate the entropy profile as
| (11) |
where . Using the entropy profile and the equation of state given by , where , we calculate the density profile by solving the hydrostatic equation (the so-called Lane-Emden equation) for the cloud embedded in the DM potential:
| (12) |
Throughout this paper, we adopt the NFW density profile of dark matter halos of all masses characterized by a simple analytical form of
| (13) |
where is the mean matter density and
| (14) |
is the characteristic overdensity within halo virial radius (Navarro et al., 1997).
We integrate this hydrostatic equation with respect to imposing the regularity conditions at the center, i.e., and at . Since the solution for adiabatic gas generally has the radius where , we determine the central density so that the enclosed gas mass at satisfies , where is the baryonic fraction.
2.5.2 Isothermal Stage
As the gas temperature increases due to gravitational compression and merger heating, radiative cooling processes begin to operate in the cloud and the adiabatic assumption no longer applies. When the radiative cooling timescale is shorter than the heating timescale, we solve the hydrostatic equation for the density profile assuming an isothermal equation of state:
| (15) |
where is the effective sound speed developed from the isothermal sound speed . The solution of the isothermal Lane-Emden equation with the regularity condition does not have the radius where the density becomes zero, but connects to the external medium with a density of . The central density is determined so that at the virial radius.
From the analogy of the Bonnor-Ebert sphere, the isothermal gas cloud embedded in a DM halo potential has a critical mass for the onset of its gravitational collapse. Practically, for a given and , we construct the density profile with different values of the gas central density and thus obtain as a function of . Since this function has a local maximum value and the value decreases with increasing halo mass, a hydrostatic equilibrium solution where no longer exists for (see Appendix A). In this case, the gas evolution is described by the free-fall stage below.
2.5.3 Free-fall Stage
Once the gas cloud becomes gravitationally unstable, the evolution of the gas density profile is well described by the Penston-Larson self-similar solution (Penston, 1969; Larson, 1969), which has a density profile with a flat core of the Jeans scale and an envelope with a power-law density distribution . The central density increases over the free-fall timescale as
| (16) |
where the free-fall timescale is calculated with
| (17) |
where represents the averaged DM density 111 The squared density of a NFW profile averaged within the characteristic radius of is given by , independent of the concentration factor . .
In the collapsing stage, compressional heating by the self-gravitating gas is taken into account and the rate is given by
| (18) |
We note that the compressional heating rate is enhanced by turbulent pressure through the effective sound speed.
2.6 Temperature and chemical evolution
We consider the evolution of thermal and kinetic energy of the gas by solving the two energy equations:
| (19) |
where is the cooling/heating rate associated with chemical reactions, and is the radiative cooling rate (note that all the rates are in units of erg s-1 g-1). While the compressional heating rate is included only in the collapse stage, the other effects are taken into account to calculate the gas temperature over the three evolutionary stages. The cooling term includes radiative cooling by H, He, He+, and He++ (Glover & Jappsen, 2007), H2 (Glover & Abel, 2008; Glover, 2015a, b), and cooling/heating associated with chemical reactions.
We solve the chemical reactions of primordial gas among the following 9 species; H, H2, e-, H+, H , H-, He, He+, and He++. In Table. 1, we show the 35 reaction rate coefficients adopted in this work. In terms of photodissociation of H2, H- and H by external radiation emitted from nearby star-forming galaxies, the reaction rate is calculated by assuming the radiation spectral energy distribution (SED) to be a blackbody spectra with . The SED model approximates more realistic spectra of observed metal-poor star-forming galaxies (Inoue, 2011). The dissociation rates of H- and H are calculated by a convolution with the cross section of the -th chemical species ( H- and H) as
| (20) |
The cross sections we adopt are from references listed in Table. 1.
3 Results
|
|
3.1 Merger history & evolution of LW radiation background
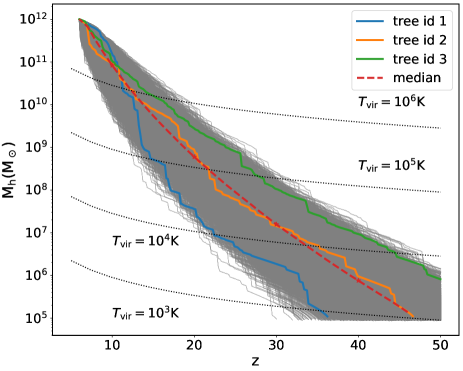
In Fig. 1, we show the evolution of the main progenitors, i.e., the most massive halos at each epoch, for all the merger trees that grow to at . In such over-dense regions of the universe, the DM halo mass increases via rapid mergers. The median halo mass (dashed curve) reaches , , , and at , , , and , respectively, and the virial temperature exceeds the atomic-cooling threshold of at . Therefore, the gas cloud concentrated in the massive halo collapses at an epoch earlier than when typical first-galaxies would form in atomic-cooling halos ( at ; see Bromm & Yoshida, 2011), which are usually considered to be massive seed forming sites in most previous studies (e.g., Dijkstra et al. 2014). For illustration purposes, we highlight three merger trees: the blue (id 1, a less massive tree), orange (id 2, a tree comparable to the median evolution), and green curve (id 3, a more massive tree). In the following sections, we focus our analysis on these three representative cases.
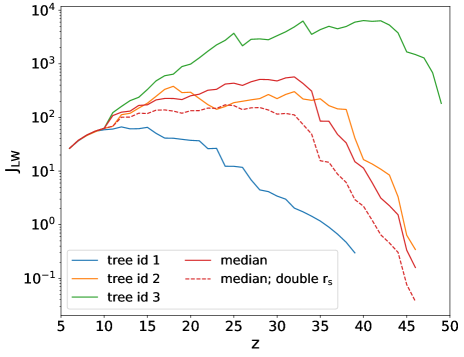
Following the method laid out in § 2, in Fig. 2 we present the redshift evolution of for the three representative trees and the median track. For all the cases, the LW background intensity gradually increases from higher redshifts, peaks at the intermediate redshifts, and decreases toward lower redshifts. This redshift dependence reflects the nature of the non-linear bias function which boosts the abundance of halo pairs with comparable masses (Scannapieco & Barkana, 2002). Namely, when the mass of the main progenitor is close to the atomic-cooling halo mass (), a large number of source halos form nearby owing to the halo clustering effect and thus the LW intensity is maximized. As the main progenitor grows, its mass difference from is larger and thus the clustering effect of atomic-cooling sources becomes weaker so that their spacial distribution is approximated to be uniform (i.e., ). As a result, the LW intensity is dominated by the contribution from a large number of atomic-cooling source halos within the absorbing screen () and begins to decline due to the cosmic dilution effect at lower redshifts. For rapidly growing progenitor halos exceeding earlier, the LW intensity quickly rises at higher redshifts and the peak values become higher owing to stronger clustering at earlier epochs. Namely, the peak values of LW intensity in the overdense regions are (id 1), (id 2), (median), and (id 3), which are significantly higher than the level of LW intensity irradiating typical atomic-cooling halos that are expected to form massive BH seeds (see Dijkstra et al., 2008; Agarwal et al., 2012; Johnson et al., 2013).
In our semi-analytical approach, we model metal pollution of the progenitor halos due to SN explosions that occur in source halos. Although we treat this effect by replacing the minimum distance between the target and source halos with , there is no information on the time-dependent spatial distributions of DM halos in our framework. To examine the impact of the model assumptions, in Fig. 2 we also show the case where the size of the metal-polluted bubbles () is doubled, the corresponding is comparable to the Hubble time at the redshift, or equivalent to setting with the fiducial value of . In this case, the LW intensity is overall reduced at higher redshifts, indicating a significant contribution from nearby source halos with to the LW radiation background. We note that our treatment simply removes the contribution from source halos within distances of , but does not address how likely the main progenitor is affected by environmental metal-enrichment. Our argument nevertheless provides a conservative estimate of if the efficiency of environmental metal-enrichment is low. As discussed in §4, the efficiency should be negligibly low because metal-polluted bubbles rarely penetrate the interior of the target halo (Chiaki et al., 2018).
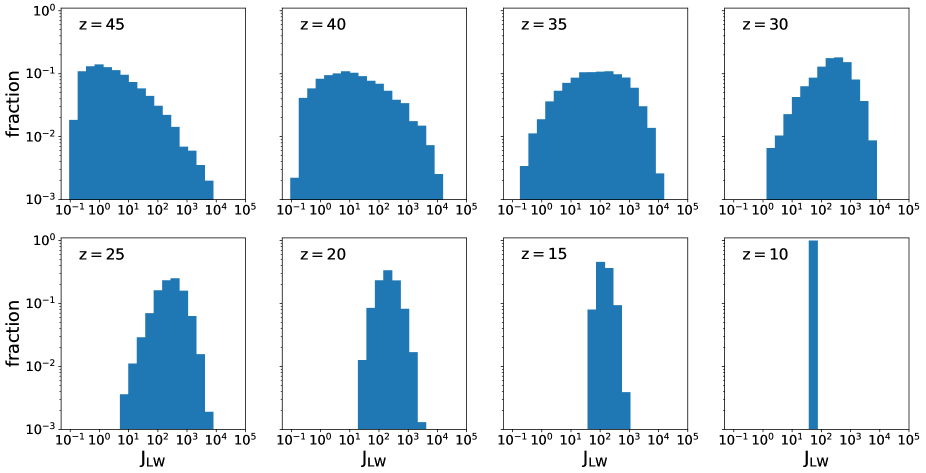
In Fig. 3, we present the histograms of the LW background intensity that irradiates the main progenitor halos for the trees at different redshifts. For the whole sample of the target halos in highly-biased regions, the histogram resembles a probability distribution function (PDF) of , with the bar height in each bin () represents the number fraction of halos irradiated within . From higher redshifts down to , the mean value of in the PDF increases owing to a large number of clustered source halos with and the distribution peaks around at . Towards lower redshifts, the target halo mass becomes higher than the typical mass of source halos. Therefore the abundance of sources is hardly boosted by the clustering effect (Iliev et al., 2003). Moreover, the LW intensity is diluted by the cosmic expansion, lowering the mean value. While the dispersion of the PDF is larger at higher redshifts, reflecting the diversity of the progenitor mass, the PDF peaks at by when all the trees converge to the high- quasar host. We note that our model does not consider LW radiation produced from DM minihalos with , where is the only coolant to induce star formation. However, strong LW background radiation in the over-dense region likely suppresses its formation. Therefore, the histogram shown in Fig. 3 counts the lower bound of the LW background intensity.
3.2 Thermal and dynamical evolution of gas clouds in the high- quasar hosts
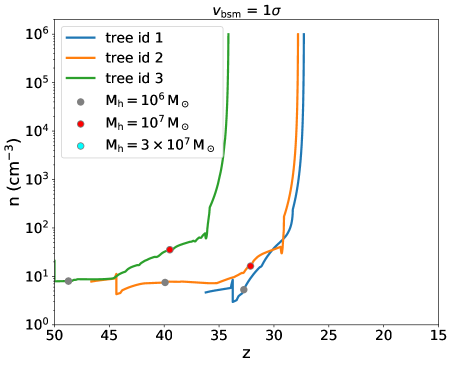
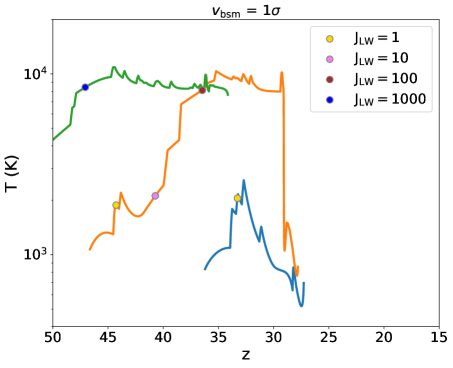
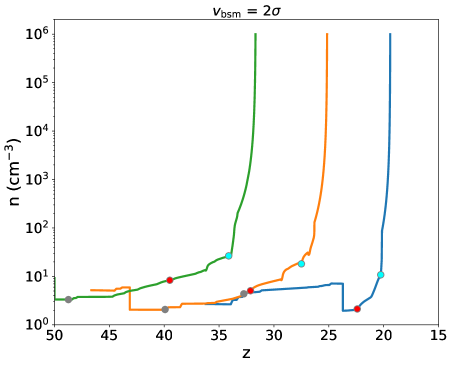
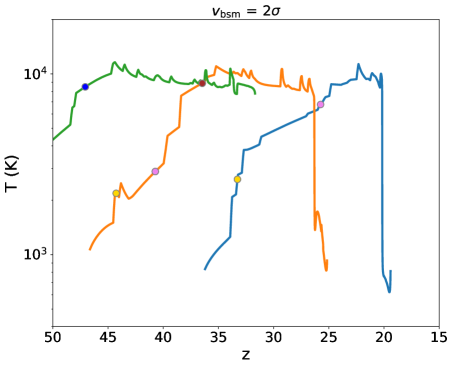
In this section we focus our analysis on the gas properties in the main progenitors along the three representative merger trees. In Fig. 4, we show the evolution of gas density (left panels) and temperature (right panels) at the central core as a function of redshift. In order to examine the impact of baryonic streaming motion, for each merger tree we assume two different values, i.e., (upper panels), and (lower panels). Each curve corresponds to the representative case highlighted in Fig. 1. Along with the three evolutionary tracks, we denote the epochs when the DM halo mass exceeds , , and in the left panels, and when the LW background intensity first crosses , , , and in the right panels. In the following paragraphs, we first describe the gas properties with , and then discuss the impact of the baryonic streaming motion on gas evolution in cases with .
For the lowest mass case (blue curve, tree id 1), the gas density gradually increases with the halo mass in the early stage (), where the gas cloud is supported by thermal and turbulent pressure against its self-gravity and DM gravitational force. After the halo mass reaches , the cloud becomes gravitationally unstable owing to its low temperature, and collapses over one free-fall timescale at . The gas temperature remains at due to H2 cooling, under a modest level of LW intensity () at . In addition to LW radiation, the gas is heated by four major merger events around , but the dynamical heating rate does not overcome the H2 cooling rate in this case.
For the intermediate mass case (orange curve, tree id 2), the evolution begins from a redshift higher than in the previous case. In this case, the gas temperature is substantially higher as a result of the combination of merger heating and intense LW irradiation with in the early stage. As several episodes of halo mergers increase the halo mass to by (the corresponding halo virial temperature is ), the gas temperature reaches , where the atomic cooling via Ly emission begins to operate. Although the LW intensity reaches before the cloud gravitationally collapses, the level of LW intensity is not strong enough to suppress H2 formation in the dense region (), where H2 reforms owing to its self-shielding effect. As a result of efficient H2 cooling, the gas temperature drops down to in the collapsing stage.
For the highest mass case (green curve, tree id 3), the gas temperature quickly rises to due to frequent mergers. Owing to the clustering effect of the massive parent halo, the LW intensity reaches at , prominently higher than those seen in the less massive cases. Although the H2 self-shielding becomes more effective as the central density increases up to , the gas collapses keeping a nearly constant temperature of . Inside the dense and warm region, H2 is collisionally dissociated and its radiative cooling does not alter the thermal evolution.
In cases where , the gas property evolution is shown in the lower panels of Fig. 4. Overall, the collapse of gas clouds is delayed due to kinetic energy injection to the gas concentrated at the halo center. When the cloud begins to collapse, the corresponding halo masses reach . For comparison, the collapse halo masses are for . The delay effect is more remarkable for the lower-mass cases because the halo circular velocity is lower than the effective sound speed boosted by injection of turbulence and streaming motion. As the gas collapse proceeds, forms efficiently in the modest environment, and eventually its cooling reduces the gas temperature in the low- and intermediate-mass cases.
3.3 The statistical properties of the high- quasar progenitors
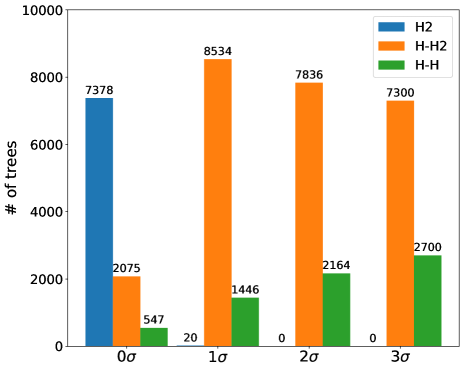
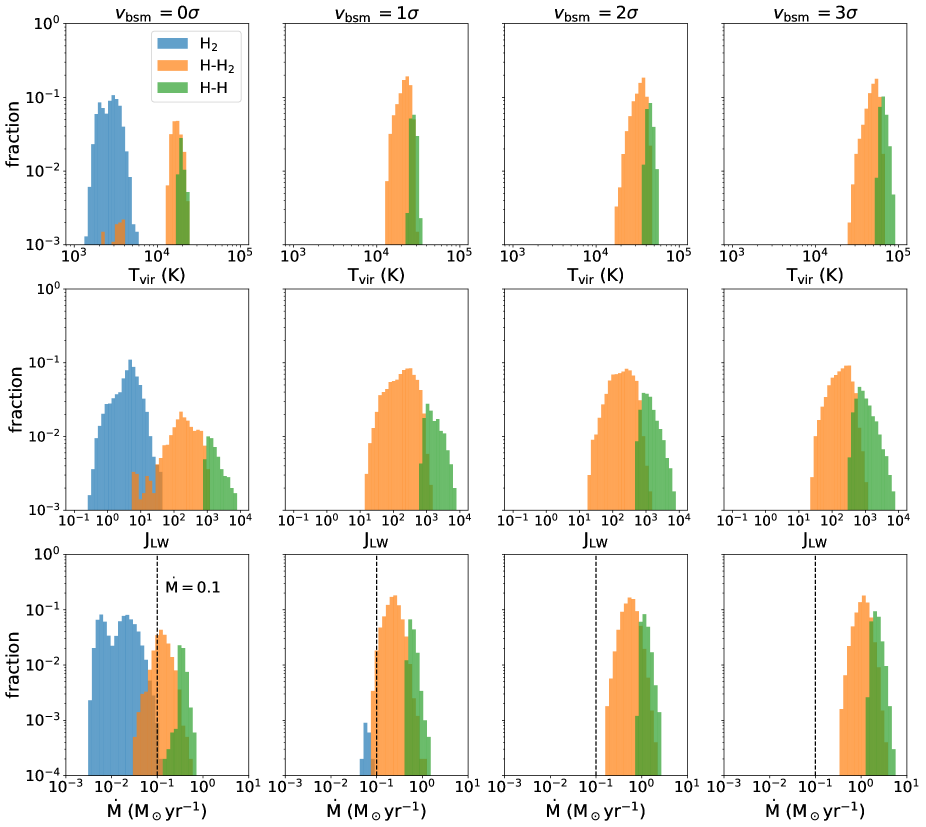
As noted in §3.2 and Fig. 4, depending on the main cooling processes inducing star formation, the evolutionary tracks of the gas clouds embedded in the main progenitors of high- quasar hosts are classified into three cases: (i) cooling, (ii) initial H Ly cooling followed by cooling after a short isothermal collapse, (iii) H Ly cooling when temperature is kept above by compression along a wide density range. In Fig. 5, we present the number count of merger trees for the three types with different baryonic streaming velocities, denoted as (i) H2, (ii) H-H2, and (iii) H-H. Without the streaming velocity, 74% of the trees experience gas collapse via H2 cooling, while the rest () form atomically-cooling gas clouds (cases H-H2 and H-H). With non-zero streaming motion (), nearly all cases enter the atomic-cooling stage because the halo mass reaches via mergers due to the significant delay effect. As the streaming velocity increases, the gas mass becomes higher at the onset of gravitational collapse, and thus the compressional heating rate during the collapse stage is higher owing to the accumulation of kinetic energy. Therefore, the number of trees where gas isothermally collapses with (case H-H) increases monotonically from to with increasing streaming velocity from to .
In Fig. 6, we show the distributions of the halo virial temperature (upper panels) and LW background intensity (middle panels) for the three types of gas collapse. For each case, the values of and are measured at the epoch when the gas cloud first enters its unstable stage. In contrast to cases with , where gas collapse is led by H2 cooling in less massive halos with , the streaming velocity delays the cloud collapse until after the halo grows across the atomic cooling threshold of . The virial temperature for the H-H cases is generally higher than that for the H-H2 cases and the mean value of for each case increases with larger streaming velocity. This trend is more clearly shown in the distributions of , namely the mean LW background intensity for the H-H cases is , which is times higher than that for the H-H2 cases. The higher value of is mainly caused by the delay of gas collapse until the halo mass becomes massive enough to be exposed by a larger number of LW source halos. In addition, compressional heating in collapsing clouds is stronger with larger and the minimum LW intensity required to keep isothermal collapse is extended to lower values.
In the main progenitors of high- quasar hosts, massive gas clouds form owing to the significant delay effect of cloud collapse by rapid halo mergers and intense LW irradiation from nearby star-forming galaxies. The mass accretion rate onto the central region of a gravitationally collapsing cloud is approximated as , where and are the gas mass and free-fall timescale at the onset of gravitational collapse. Since the cloud is supported by thermal and kinetic energy of the gas, the accretion rate can be written as (Larson, 1969; Penston, 1969, etc.), which depends only on the gas thermal and kinetic temperature (see below Eq. 15). In the lower panels of Fig. 6, we show the distributions of , for which we adopt the minimum temperature value in the cloud collapse stage at . The accretion rate is broadly distributed over . The vertical line in the bottom panels indicates a reference value of , above which the outer envelope of an accreting protostar is bloated due to rapid heat injection through mass accretion and the emission of stellar ionizing photons is strongly suppressed. For , the majority of the H-H2 cases yield . With , all the cases have sufficiently high accretion rates exceeding the reference value (see more discusssion in § 5).
4 Effects of Metal enrichment
4.1 Critical Metallicity
Metal enrichment is considered to be a major obstacle in forming massive BH seeds through star formation because efficient radiative cooling via metal fine-structure lines will induce gas fragmentation and suppress the formation of masive stars. In order to quantify the critical metallicity, we calculate the cooling rate by CII and OI, assuming that the number fractions of carbon and oxygen nuclei in the gas phase with respect to hydrogen nuclei are and (Pollack et al., 1994), and all the carbon and oxygen are in the form of CII and OI, respectively. This treatment is justified for warm gas with (Omukai et al., 2008).
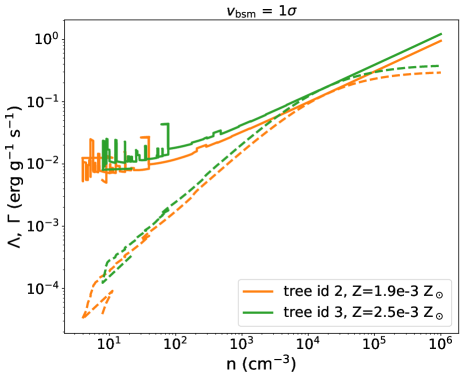
In Fig. 7, we present the metal-line cooling rate (dashed) and heating rate associated with mergers and gravitational compression (solid) as a function of the density of gas embedded in the two representative progenitor halos (tree id 2 and 3) with . In order to examine the cooling effect by metal lines against heating, the H2 cooling is turned off, and metal-line cooling is calculated but not included in the thermal evolution. The metallicity for each case is set so that the cooling rate is marginally balanced with the heating rate at least once during the collapse phase. Namely, the critical metallicity is estimated as (tree id 2) and (tree id 3), respectively. These values are higher than the critical metallicity of (in the absence of dust) obtained by Omukai et al. (2008), where the effect of turbulence and merger heating is not included. Although the critical metallicity depends on the relative abundance of metals produced in SN ejecta, we use as a reference value in the following discussion.
4.2 Efficiency of Metal Enrichment
Throughout this paper, we do not consider the genetic pollution process through mergers of metal-rich minihalos, given that the star forming efficiency is strongly suppressed by intense LW radiation in the overdense region. However, we note that this treatment is justified only when the “actual” LW intensity is as high as the average value shown in Fig. 3. Otherwise, H2 cooling induces star formation in weak LW-radiation pockets. We do not quantify this effect that reduces the number of the main progenitors where gas is kept pristine. As a reference, Lupi et al. (2021) found of the atomic-cooling halos in the overdense region to be polluted genetically. Since some of those polluted halos do not belong to the merger history of the final massive quasar host halo, more than 70% of our main-progenitor samples should remain pristine (or sufficiently metal poor). On the other hand, together with the metal enrichment effect, we also exclude the contribution of LW flux from such lower mass halos, making our treatment conservative.
Next, we discuss the modeling of environmental pollution led by SN-driven bubbles from nearby star-forming halos. One important caveat is that the progenitor halo is assumed to be immediately enriched once the bubble front reaches the halo virial radius. However, the instantaneous enrichment process considered in many previous studies in literature may not be realistic. In fact, metals in SN ejecta cannot penetrate into the halo center but pollute the halo superficially in the outer region with low densities of (Chen et al., 2017; Chiaki et al., 2018), leaving the gas in the halo interior un-polluted, even for low mass halos. If more energetic pair-instability SNe occur in nearby source halos, the ejecta with stronger ram pressure deeply penetrate into the target halo and induce metal mixing at the shock front (Chen et al., 2017). To consider this uncertainty, we introduce the metal mixing efficiency , which is the fraction of metals mixed with the interior gas in the target halo and is treated as a free parameter below.
Another important quantity is the total amount of metals carried into the target halo through multiple SN-driven bubbles. Let us consider a source halo with a distance of from the target halo with a size of . The mass of metals produced by multiple SNe in the source halo is given by , where is the number of SNe and is the average mass of metals produced by one SN. We here adopt , which corresponds to the metal ejecta mass produced by a stellar progenitor (Chiaki et al., 2018). Assuming that a fraction of the metals is launched isotropically by the SN bubble, the mass of the metals that reach the target halo is given by . Therefore, due to SN bubbles produced from one source halo, the gas metallicity in the target halo increases by
| (21) | ||||
where is motivated by a 3D high-resolution hydrodynamical simulations of SN-driven galactic outflows (Li et al., 2017).
As discussed in § 3.1, the LW intensity peaks when the target halo reaches the atomic-cooling threshold because (1) source halos with are the most abundant population in number and (2) two halos with comparable mass are strongly clustered. This circumstance will also maximize the efficiency of environmental enrichment. Assuming , we estimate the number of source halos with mass of located within ( typically) from the target halo for the three representative trees as 0.4 (tree id 1), 6 (tree id 2), and 86 (tree id 3), respectively. As a result, the gas metallicity in the target halo is calculated as . Therefore, we obtain the conditions where the environmental enrichment process affects the thermal evolution of gas in the target halo as , or equivalently
| (22) |
Since , the gas evolution in the main progenitor surrounded by nearby source halos within is unlikely to be affected by metal-line cooling. On the other hand, if the mixing efficiency is as high as , metal enrichment will play an important role in changing the gas evolution in rapidly growing halos (tree id 3), reducing the number fraction of H-H collapse cases (see Fig. 5).
Additionally, inhomogeneous density distributions inside the source halos and non-steady SFR that form SNe in the earlier stage change the velocity and shape of expanding bubbles. Those effects could result in either an overestimation or underestimation of the bubble size. To discuss the efficiency of environmental enrichment precisely, we need to further study a variety of situations with different physical parameters as well as the metal mixing efficiency . We leave this to future work.
4.3 Dynamical evolution of metal enriched gas
We quantify the critical metallicity and discuss the impact of metal-line cooling on the thermal evolution of gas clouds. However, dynamical evolution of a collapsing cloud with that composes of a warm outer-envelope () and a cool central core has not been fully understood; especially, longterm behavior of the mass inflow rate onto the central newly-formed protostar is still uncertain. Recent cosmological simulations suggest that rapid mass inflows may occur even with metal pollution above the critical metallicity in atomic-cooling halos (Regan et al., 2020a), but widespread star formation limits the final mass of the central star to (Regan et al., 2020b). On the other hand, when the metallicity is lower than the critical value, the collapsing gas cloud fragments only at the central region and forms a compact disk, in which a vast majority of the clumps merge with the central protostar via inward migration (Inayoshi & Haiman, 2014; Chon & Omukai, 2020). As a result, the stellar growth is not quenched by metal pollution. Future work is needed to investigate the star formation in the overdense regions where high- quasar form to quantify the impact of metal pollution on the gas dynamics.
|
|
5 Discussion
5.1 Protostellar Mass and BH Mass Distribution
We apply the obtained mass accretion rate to estimate the final protostellar mass distribution at the end of star formation episodes. Due to the existing angular momentum at large scales, the rapidly accreted pristine gas settles into a disk, which becomes gravitationally unstable and thus results in fragmentation and clump formation (e.g., Oh & Haiman, 2002). Most clumps can migrate inward and merge with the central protostar before forming stars (Inayoshi & Haiman, 2014), yielding accretion rate onto the stellar surface through the disk , where denotes the conversion efficiency from the global accretion rate to that through the accretion disk. Hydrodynamical simulations find that mass accretion through the unstable disk proceeds episodically and the time-averaged value of the efficiency is (Sakurai et al. 2016; Toyouchi et al. in prep).
When the time-averaged accretion rate is higher than a critical rate, , the accreting star continues to expand its envelope with a lower surface temperature of , from which UV radiation hardly emits. As a result, stellar radiative feedback does not prevent the central star growing via mass accretion (Omukai & Palla, 2001; Hosokawa et al., 2012, 2013; Schleicher et al., 2013; Haemmerlé et al., 2018; Sakurai et al., 2015, 2020b). Since the value of ranges from to , depending on the treatment of the stellar evolution calculations and their boundary conditions (Hosokawa et al., 2013; Haemmerlé et al., 2018), we adopt the highest as a reference value. This choice leads to a lower bound of the stellar/BH mass. With , the final stellar mass is determined either by its finite lifetime or by the onset of stellar collapse triggered by the general-relativistic (GR) instability (Shibata et al. 2016; see a review by Woods et al. 2019 and references therein). The final mass is also affected by fuel supply through mass accretion onto the star. Woods et al. (2017) have investigated the final mass of stars accreting at a constant rate over (radiative feedback is neglected), and found that the final mass linearly increases with the accretion rate below but is saturated around due to the GR instability. The relation between the critical mass and accretion rate is fitted as
| (23) |
at , which is used for our analysis.
On the other hand, when the stellar accretion rate is lower than the critical rate, , the star evolves to the main-sequence stage and begins to emit strong ionizing radiation, quenching the stellar growth. Here, we simply consider that ionizing radiation from the star heats the disk surface and thus photoevaporation suppresses the accretion rate (McKee & Tan, 2008; Hosokawa et al., 2011; Tanaka et al., 2013). This process becomes important when the ionization front reaches the stellar gravitational influence radius for ionized gas with a temperature of defined by
| (24) |
and the ionized gas breaks out through the neutral infalling gas. The photoevaporation rate can be expressed as
| (25) |
where is the ionizing photon number flux and is the size of the accretion disk. The photon flux is approximated as in the range of for main-sequence stars (Johnson et al., 2012). We evaluate the mass outflow rate owing to photoevaporation by setting as
| (26) |
which gives a lower bound for the rate because the outflow of ionized gas is mainly driven from larger radii (i.e., a lager surface area). Therefore, equating , we obtain the feedback-regulated stellar mass as or
| (27) |
at , where is the characteristic photoevaporation timescale (note that this expression is valid when the stellar lifetime is longer than ). The final mass at the intermediate accretion rate () is estimated by performing logarithmic interpolation.
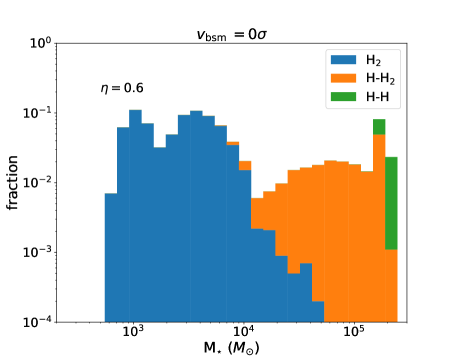
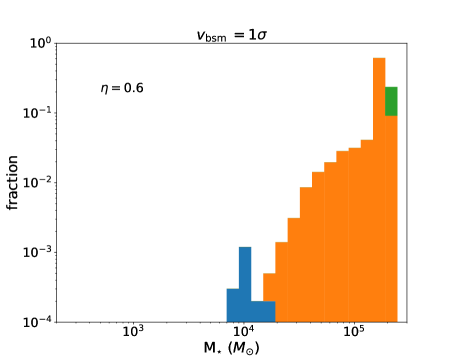
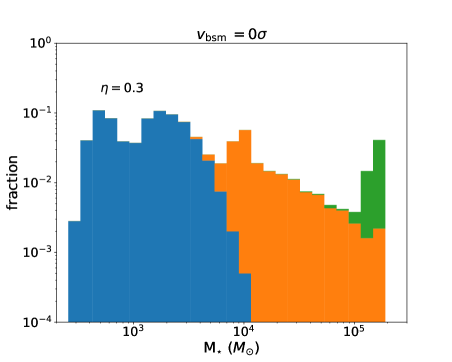
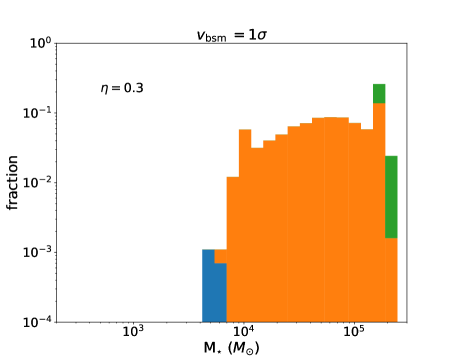
In Fig. 8, we show the mass distribution of massive BH seeds formed in the high- quasar progenitor halos, calculated with the method described above (see also the bottom panels in Fig. 6). Note that the number fraction from the different types of gas evolution is stacked at the same mass bin. Without the streaming motion (; left panels), the BH mass is widely distributed from () to for (, respectively) with a few peaks corresponding to the virial temperatures of halos when the BHs form by gas collapse. Overall, the cases with high accretion rates (H-H2 and H-H cases) are responsible for high-mass BH formation beyond , while the H2 case with lower accretion rates yields less massive BHs with . The number of BH seeds above is limited because the GR instability induces direct collapse of accreting supermassive stars. The shape of the mass distribution at depend on the accretion efficiency; namely, the smaller value of yields a distribution skewed toward lower masses. With non-zero streaming motion (; right panels), the less massive population with decreases abruptly since nearly all the cases experience the atomic-cooling stage and thus the central stars accrete at high rates without strong radiative feedback. We note that the BH mass distribution for higher streaming velocities are similar to that for , but their contribution to the total BH mass distribution is less important because regions with are rarer.
As discussed in §4, the number fraction of the cases with highest mass accretion rates (H-H cases) would be reduced by the effect of line cooling via atomic carbon and oxygen which are produced in nearby source halos through SNe and carried into the quasar main progenitor halos with interest. The level of reduction depends on the metal mixing efficiency in the main progenitor; namely, the enrichment effect could be neglected if the mixing efficiency is lower than . Nevertheless, the overall shape of the BH mass distribution still holds.
5.2 Subsequent BH growth and evolution
How do those massive seed BHs formed in overdense regions grow to be SMBHs that are observed as high- quasars at ? In previous studies in literature, the subsequent growth of their BHs via gas accretion and/or mergers and the required conditions have been discussed (e.g., Tanaka & Haiman, 2009; Valiante et al., 2016). Recently, large-scale cosmological simulations have been exploring the evolution of SMBHs and the coevolution of their host galaxies including various feedback processes due to SNe and AGN activity with subgrid models. These simulations have generally found that massive seed BHs formed in protogalaxies hardly grow via gas accretion because dense, cold gas is expelled by energetic SN feedback associated with star formation. However, it is worth noting that most simulations in which SN feedback quenches BH growth have focused on “typical” atomic-cooling halos that will grow to by (e.g., Habouzit et al., 2017; Latif et al., 2018; Smith et al., 2018)
On the other hand, as pointed out by Inayoshi et al. (2020), the progenitor halos of high- quasar hosts with at form in rarer regions and have reached with deeper gravitational potential by the time when star formation takes place (). In such massive halos, a large amount of cold gas is supplied to the nuclear region through filamentary structures of the proto-cosmic web (Di Matteo et al., 2012), and the seed BHs can be fed at high rates significantly exceeding the Eddington limit when the metallicity of inflowing gas is as low as (Toyouchi et al. 2021; see also Inayoshi et al. 2016). The critical halo mass required for the onset of rapid mass accretion exceeding the Eddington rate is , almost independent of redshift. Most of the quasar progenitor halos of interest can reach this mass threshold after birth of seed BHs in Myr, within which intense star bursts would take place and form protogalaxies. Exploring the nature of BH growth embedded in such a protogalaxy is left for future investigations.
This process is a possible way to form intermediate massive BH (IMBH) populations. Observations of IMBHs in the local universe have the potential to constrain high- BH (seed) formation (see the review by Greene et al. 2020). Furthermore, if those IMBHs form binaries through galaxy mergers and dynamical processes during the cosmic history, the seed forming channel also provides a significant number of gravitational wave events (e.g., Hartwig et al., 2018; Chon et al., 2018; Regan et al., 2020b), which will be detectable by the space-based gravitational wave detectors such as the Laser Interferometer Space Antenna (LISA) (Amaro-Seoane et al., 2017) and Tianqin (Luo et al., 2016), and third-generation terrestrial instruments.
6 Summary
In this paper, we investigate a new scenario of the formation of heavy BH seeds through collapse of warm gas in massive halos that end up in quasar hosts at . In the highly biased, overdense regions of the universe, stronger halo clustering increases the frequency of halo mergers and boosts the mean intensity of LW radiation background produced from star-forming galaxies. Those effects are expected to increase the probability of massive seed formation because the conditions required for their formation (intense LW irradiation and violent merger heating) become less stringent than previous considered. Under such unique environments, we model the thermal and dynamical evolution of massive gas clouds along with merger trees of the main progenitors of high- quasar hosts using the Monte Carlo method. With those samples, we study the statistical properties of the progenitor halos of high-z quasar hosts and massive seed BHs. Our major findings can be summarized as follows.
-
1.
In the high- quasar forming regions, DM halos are likely irradiated by strong LW radiation with intensity of (in units of ) from nearby star-forming galaxies at and gas clouds in the halo interiors are heated by successive gaseous halo mergers. Suppression of H2 cooling via LW irradiation/merger hating as well as injection of gas kinetic energy through halo mergers prevent gas collapse and delays prior star formation episodes.
-
2.
Without baryonic streaming motion, 74% of the trees experience gas collapse led by H2 cooling, while the rest (26%) form atomically-cooling gas clouds that begin to collapse isothermally with via Ly cooling. With a streaming velocity higher than the root-mean-square value, gas clouds for nearly all realizations of the merger trees enter the atomic-cooling stage.
-
3.
The fraction of trees which host isothermal gas collapse is and increases with streaming velocity, while the rest form H2-cooled cores after short isothermal phases. However, this fraction is reduced by additional cooling via metal fine-structure lines when the collapsing gas could be enriched to , requiring efficient metal mixing . This high probability reflects that high-redshift quasar forming regions likely provide such peculiar environments, which hardly occur in typical high-redshift star-forming regions.
-
4.
The mass accretion rate onto a newly-born protostar is distributed over , a large fraction of which exceeds the critical rate suppressing stellar radiative feedback. As a result, we expect a distribution of stellar masses (presumably BH masses) ranging from several hundred to above .
Appendix A The critical conditions for collapse of an isothermal gas cloud
In the Appendix, we briefly describe the method of how to calculate the critical gas density at the center by solving the hydrostatic equation for an isothermal gas cloud (Eq. 15), where the gas pressure gradient force is balanced with the gas self-gravity and DM gravitational force. For demonstration purpose, in the left panel of Fig. 9, we show the radial profiles of gas with an effective sound speed of (corresponding to gas in the absence of turbulence) for different values of in a DM halo with at . As the central density increases, the density at the virial radius does not increase monotonically but has a local maximum value around . In general, the maximum value of can be found for a given combination of , , and . In the right panel of Fig. 9, we present the relation between and for different halo masses ( and are fixed). As seen in the left panel, each curve has a local maximum and the maximum value decreases with . The density value at the outer boundary () weakly depends on and through the concentration factor , i.e., the three halos have , varying within . For , there exist two solutions where the boundary conditions are satisfied. Since the solution with the higher value of is not stable, we adopt the solution with the lower value of (see Ebert, 1955; Bonnor, 1958; Lynden-Bell & Wood, 1968). As the halo mass increases to and , there is no hydrostatic solution of the gas cloud. In our semi-analytical model, we calculate the hydro-static density profile which satisfies the boundary conditions at each time step and quantify the critical halo mass above which the gas begins to collapse. We note that this method can be applied to a wide range of and of interest in our paper.
|
References
- Abel et al. (1997) Abel, T., Anninos, P., Zhang, Y., & Norman, M. L. 1997, New A, 2, 181, doi: 10.1016/S1384-1076(97)00010-9
- Abel et al. (2002) Abel, T., Bryan, G. L., & Norman, M. L. 2002, Science, 295, 93, doi: 10.1126/science.295.5552.93
- Agarwal et al. (2012) Agarwal, B., Khochfar, S., Johnson, J. L., et al. 2012, MNRAS, 425, 2854, doi: 10.1111/j.1365-2966.2012.21651.x
- Amaro-Seoane et al. (2017) Amaro-Seoane, P., Audley, H., Babak, S., et al. 2017, arXiv e-prints, arXiv:1702.00786. https://arxiv.org/abs/1702.00786
- Barlow (1984) Barlow, S. E. 1984, PhD thesis, UNIVERSITY OF COLORADO AT BOULDER.
- Becerra et al. (2015) Becerra, F., Greif, T. H., Springel, V., & Hernquist, L. E. 2015, MNRAS, 446, 2380, doi: 10.1093/mnras/stu2284
- Bonetti et al. (2019) Bonetti, M., Sesana, A., Haardt, F., Barausse, E., & Colpi, M. 2019, MNRAS, 486, 4044, doi: 10.1093/mnras/stz903
- Bonnor (1958) Bonnor, W. B. 1958, MNRAS, 118, 523, doi: 10.1093/mnras/118.5.523
- Bromm & Loeb (2003) Bromm, V., & Loeb, A. 2003, ApJ, 596, 34, doi: 10.1086/377529
- Bromm & Yoshida (2011) Bromm, V., & Yoshida, N. 2011, ARA&A, 49, 373, doi: 10.1146/annurev-astro-081710-102608
- Bullock et al. (2001) Bullock, J. S., Kolatt, T. S., Sigad, Y., et al. 2001, MNRAS, 321, 559, doi: 10.1046/j.1365-8711.2001.04068.x
- Chandrasekhar (1951a) Chandrasekhar, S. 1951a, Proceedings of the Royal Society of London Series A, 210, 18, doi: 10.1098/rspa.1951.0227
- Chandrasekhar (1951b) —. 1951b, Proceedings of the Royal Society of London Series A, 210, 26, doi: 10.1098/rspa.1951.0228
- Chen et al. (2017) Chen, K.-J., Whalen, D. J., Wollenberg, K. M. J., Glover, S. C. O., & Klessen, R. S. 2017, ApJ, 844, 111, doi: 10.3847/1538-4357/aa7b34
- Chiaki et al. (2018) Chiaki, G., Susa, H., & Hirano, S. 2018, MNRAS, 475, 4378, doi: 10.1093/mnras/sty040
- Chon et al. (2016) Chon, S., Hirano, S., Hosokawa, T., & Yoshida, N. 2016, ApJ, 832, 134, doi: 10.3847/0004-637X/832/2/134
- Chon et al. (2018) Chon, S., Hosokawa, T., & Yoshida, N. 2018, MNRAS, 475, 4104, doi: 10.1093/mnras/sty086
- Chon & Omukai (2020) Chon, S., & Omukai, K. 2020, MNRAS, 494, 2851, doi: 10.1093/mnras/staa863
- Cole et al. (2000) Cole, S., Lacey, C. G., Baugh, C. M., & Frenk, C. S. 2000, MNRAS, 319, 168, doi: 10.1046/j.1365-8711.2000.03879.x
- Coppola et al. (2011) Coppola, C. M., Longo, S., Capitelli, M., Palla, F., & Galli, D. 2011, ApJS, 193, 7, doi: 10.1088/0067-0049/193/1/7
- Croft et al. (1999) Croft, H., Dickinson, A. S., & Gadea, F. X. 1999, MNRAS, 304, 327, doi: 10.1046/j.1365-8711.1999.02346.x
- Dalgarno & Lepp (1987) Dalgarno, A., & Lepp, S. 1987, in Astrochemistry, ed. M. S. Vardya & S. P. Tarafdar, Vol. 120, 109–118
- Dayal et al. (2019) Dayal, P., Rossi, E. M., Shiralilou, B., et al. 2019, MNRAS, 486, 2336, doi: 10.1093/mnras/stz897
- Di Matteo et al. (2012) Di Matteo, T., Khandai, N., DeGraf, C., et al. 2012, ApJ, 745, L29, doi: 10.1088/2041-8205/745/2/L29
- Dijkstra et al. (2014) Dijkstra, M., Ferrara, A., & Mesinger, A. 2014, MNRAS, 442, 2036, doi: 10.1093/mnras/stu1007
- Dijkstra et al. (2008) Dijkstra, M., Haiman, Z., Mesinger, A., & Wyithe, J. S. B. 2008, MNRAS, 391, 1961, doi: 10.1111/j.1365-2966.2008.14031.x
- Dove et al. (1987) Dove, J. E., Rusk, A. C. M., Cribb, P. H., & Martin, P. G. 1987, ApJ, 318, 379, doi: 10.1086/165375
- Ebert (1955) Ebert, R. 1955, ZAp, 37, 217
- Fan et al. (2006) Fan, X., Strauss, M. A., Richards, G. T., et al. 2006, AJ, 131, 1203, doi: 10.1086/500296
- Ferland et al. (1992) Ferland, G. J., Peterson, B. M., Horne, K., Welsh, W. F., & Nahar, S. N. 1992, ApJ, 387, 95, doi: 10.1086/171063
- Fernandez et al. (2014) Fernandez, R., Bryan, G. L., Haiman, Z., & Li, M. 2014, MNRAS, 439, 3798, doi: 10.1093/mnras/stu230
- Glover (2015a) Glover, S. C. O. 2015a, MNRAS, 451, 2082, doi: 10.1093/mnras/stv1059
- Glover (2015b) —. 2015b, MNRAS, 453, 2901, doi: 10.1093/mnras/stv1781
- Glover & Abel (2008) Glover, S. C. O., & Abel, T. 2008, MNRAS, 388, 1627, doi: 10.1111/j.1365-2966.2008.13224.x
- Glover & Jappsen (2007) Glover, S. C. O., & Jappsen, A. K. 2007, ApJ, 666, 1, doi: 10.1086/519445
- Greene et al. (2020) Greene, J. E., Strader, J., & Ho, L. C. 2020, ARA&A, 58, 257, doi: 10.1146/annurev-astro-032620-021835
- Habouzit et al. (2017) Habouzit, M., Volonteri, M., & Dubois, Y. 2017, MNRAS, 468, 3935, doi: 10.1093/mnras/stx666
- Haemmerlé et al. (2018) Haemmerlé, L., Woods, T. E., Klessen, R. S., Heger, A., & Whalen, D. J. 2018, MNRAS, 474, 2757, doi: 10.1093/mnras/stx2919
- Haiman et al. (1997) Haiman, Z., Rees, M. J., & Loeb, A. 1997, ApJ, 476, 458, doi: 10.1086/303647
- Haiman et al. (1996) Haiman, Z., Thoul, A. A., & Loeb, A. 1996, ApJ, 464, 523, doi: 10.1086/177343
- Hartwig et al. (2018) Hartwig, T., Agarwal, B., & Regan, J. A. 2018, MNRAS, 479, L23, doi: 10.1093/mnrasl/sly091
- Hirano et al. (2017) Hirano, S., Hosokawa, T., Yoshida, N., & Kuiper, R. 2017, Science, 357, 1375, doi: 10.1126/science.aai9119
- Hirano et al. (2018) Hirano, S., Yoshida, N., Sakurai, Y., & Fujii, M. S. 2018, ApJ, 855, 17, doi: 10.3847/1538-4357/aaaaba
- Hosokawa et al. (2012) Hosokawa, T., Omukai, K., & Yorke, H. W. 2012, ApJ, 756, 93, doi: 10.1088/0004-637X/756/1/93
- Hosokawa et al. (2011) Hosokawa, T., Omukai, K., Yoshida, N., & Yorke, H. W. 2011, Science, 334, 1250, doi: 10.1126/science.1207433
- Hosokawa et al. (2013) Hosokawa, T., Yorke, H. W., Inayoshi, K., Omukai, K., & Yoshida, N. 2013, ApJ, 778, 178, doi: 10.1088/0004-637X/778/2/178
- Hummer & Storey (1998) Hummer, D. G., & Storey, P. J. 1998, MNRAS, 297, 1073, doi: 10.1046/j.1365-8711.1998.2970041073.x
- Huq et al. (1982) Huq, M. S., Doverspike, L. D., Champion, R. L., & Esaulov, V. A. 1982, Journal of Physics B Atomic Molecular Physics, 15, 951, doi: 10.1088/0022-3700/15/6/020
- Iliev et al. (2003) Iliev, I. T., Scannapieco, E., Martel, H., & Shapiro, P. R. 2003, MNRAS, 341, 81, doi: 10.1046/j.1365-8711.2003.06410.x
- Inayoshi & Haiman (2014) Inayoshi, K., & Haiman, Z. 2014, MNRAS, 445, 1549, doi: 10.1093/mnras/stu1870
- Inayoshi et al. (2016) Inayoshi, K., Haiman, Z., & Ostriker, J. P. 2016, MNRAS, 459, 3738, doi: 10.1093/mnras/stw836
- Inayoshi et al. (2018) Inayoshi, K., Li, M., & Haiman, Z. 2018, MNRAS, 479, 4017, doi: 10.1093/mnras/sty1720
- Inayoshi & Omukai (2012) Inayoshi, K., & Omukai, K. 2012, MNRAS, 422, 2539, doi: 10.1111/j.1365-2966.2012.20812.x
- Inayoshi et al. (2014) Inayoshi, K., Omukai, K., & Tasker, E. 2014, MNRAS, 445, L109, doi: 10.1093/mnrasl/slu151
- Inayoshi et al. (2020) Inayoshi, K., Visbal, E., & Haiman, Z. 2020, ARA&A, 58, 27, doi: 10.1146/annurev-astro-120419-014455
- Inoue (2011) Inoue, A. K. 2011, MNRAS, 415, 2920, doi: 10.1111/j.1365-2966.2011.18906.x
- Jacobs et al. (1967) Jacobs, T. A., Giedt, R. R., & Cohen, N. 1967, J. Chem. Phys., 47, 54, doi: 10.1063/1.1711890
- Janev et al. (1987) Janev, R. K., Langer, W. D., Post, D. E., & Evans, K. 1987, in Elementary Processes in Hydrogen-Helium Plasmas: Cross Sections and Reaction Rate Coefficients (Berlin, Heidelberg: Springer Berlin Heidelberg), 217–231, doi: 10.1007/978-3-642-71935-6_7
- Jiang et al. (2016) Jiang, L., McGreer, I. D., Fan, X., et al. 2016, ApJ, 833, 222, doi: 10.3847/1538-4357/833/2/222
- Johnson et al. (2013) Johnson, J. L., Dalla Vecchia, C., & Khochfar, S. 2013, MNRAS, 428, 1857, doi: 10.1093/mnras/sts011
- Johnson et al. (2012) Johnson, J. L., Whalen, D. J., Fryer, C. L., & Li, H. 2012, ApJ, 750, 66, doi: 10.1088/0004-637X/750/1/66
- Karpas et al. (1979) Karpas, Z., Anicich, V., & Huntress, W. T. 1979, J. Chem. Phys., 70, 2877, doi: 10.1063/1.437823
- Kimura et al. (1993) Kimura, M., Lane, N. F., Dalgarno, A., & Dixson, R. G. 1993, ApJ, 405, 801, doi: 10.1086/172410
- Kormendy & Ho (2013) Kormendy, J., & Ho, L. C. 2013, ARA&A, 51, 511, doi: 10.1146/annurev-astro-082708-101811
- Kreckel et al. (2010) Kreckel, H., Bruhns, H., Čížek, M., et al. 2010, Science, 329, 69, doi: 10.1126/science.1187191
- Lacey & Cole (1993) Lacey, C., & Cole, S. 1993, MNRAS, 262, 627, doi: 10.1093/mnras/262.3.627
- Larson (1969) Larson, R. B. 1969, MNRAS, 145, 271, doi: 10.1093/mnras/145.3.271
- Latif et al. (2013) Latif, M. A., Schleicher, D. R. G., Schmidt, W., & Niemeyer, J. 2013, MNRAS, 433, 1607, doi: 10.1093/mnras/stt834
- Latif & Volonteri (2015) Latif, M. A., & Volonteri, M. 2015, MNRAS, 452, 1026, doi: 10.1093/mnras/stv1337
- Latif et al. (2018) Latif, M. A., Volonteri, M., & Wise, J. H. 2018, MNRAS, 476, 5016, doi: 10.1093/mnras/sty622
- Lepp & Shull (1983) Lepp, S., & Shull, J. M. 1983, ApJ, 270, 578, doi: 10.1086/161149
- Li et al. (2017) Li, M., Bryan, G. L., & Ostriker, J. P. 2017, ApJ, 841, 101, doi: 10.3847/1538-4357/aa7263
- Luo et al. (2016) Luo, J., Chen, L.-S., Duan, H.-Z., et al. 2016, Classical and Quantum Gravity, 33, 035010, doi: 10.1088/0264-9381/33/3/035010
- Lupi et al. (2021) Lupi, A., Haiman, Z., & Volonteri, M. 2021, MNRAS, doi: 10.1093/mnras/stab692
- Lynden-Bell & Wood (1968) Lynden-Bell, D., & Wood, R. 1968, MNRAS, 138, 495, doi: 10.1093/mnras/138.4.495
- Mac Low & Shull (1986) Mac Low, M. M., & Shull, J. M. 1986, ApJ, 302, 585, doi: 10.1086/164017
- Martin et al. (1998) Martin, P. G., Keogh, W. J., & Mandy, M. E. 1998, ApJ, 499, 793, doi: 10.1086/305665
- Matsuoka et al. (2018) Matsuoka, Y., Iwasawa, K., Onoue, M., et al. 2018, ApJS, 237, 5, doi: 10.3847/1538-4365/aac724
- McKee & Tan (2002) McKee, C. F., & Tan, J. C. 2002, Nature, 416, 59, doi: 10.1038/416059a
- McKee & Tan (2008) —. 2008, ApJ, 681, 771, doi: 10.1086/587434
- McLaughlin et al. (2017) McLaughlin, B. M., Stancil, P. C., Sadeghpour, H. R., & Forrey, R. C. 2017, Journal of Physics B Atomic Molecular Physics, 50, 114001, doi: 10.1088/1361-6455/aa6c1f
- Mo & White (2002) Mo, H. J., & White, S. D. M. 2002, MNRAS, 336, 112, doi: 10.1046/j.1365-8711.2002.05723.x
- Mortlock et al. (2011) Mortlock, D. J., Warren, S. J., Venemans, B. P., et al. 2011, Nature, 474, 616, doi: 10.1038/nature10159
- Navarro et al. (1997) Navarro, J. F., Frenk, C. S., & White, S. D. M. 1997, ApJ, 490, 493, doi: 10.1086/304888
- Oh & Haiman (2002) Oh, S. P., & Haiman, Z. 2002, ApJ, 569, 558, doi: 10.1086/339393
- Omukai (2001) Omukai, K. 2001, ApJ, 546, 635, doi: 10.1086/318296
- Omukai & Palla (2001) Omukai, K., & Palla, F. 2001, ApJ, 561, L55, doi: 10.1086/324410
- Omukai et al. (2008) Omukai, K., Schneider, R., & Haiman, Z. 2008, ApJ, 686, 801, doi: 10.1086/591636
- Onoue et al. (2019) Onoue, M., Kashikawa, N., Matsuoka, Y., et al. 2019, ApJ, 880, 77, doi: 10.3847/1538-4357/ab29e9
- Orel (1987) Orel, A. E. 1987, J. Chem. Phys., 87, 314, doi: 10.1063/1.453628
- Parkinson et al. (2008) Parkinson, H., Cole, S., & Helly, J. 2008, MNRAS, 383, 557, doi: 10.1111/j.1365-2966.2007.12517.x
- Peart & Hayton (1994) Peart, B., & Hayton, D. A. 1994, Journal of Physics B Atomic Molecular Physics, 27, 2551, doi: 10.1088/0953-4075/27/12/013
- Penston (1969) Penston, M. V. 1969, MNRAS, 144, 425, doi: 10.1093/mnras/144.4.425
- Planck Collaboration et al. (2016) Planck Collaboration, Ade, P. A. R., Aghanim, N., et al. 2016, A&A, 594, A13, doi: 10.1051/0004-6361/201525830
- Pollack et al. (1994) Pollack, J. B., Hollenbach, D., Beckwith, S., et al. 1994, ApJ, 421, 615, doi: 10.1086/173677
- Poulaert et al. (1978) Poulaert, G., Brouillard, F., Claeys, W., McGowan, J. W., & Van Wassenhove, G. 1978, Journal of Physics B Atomic Molecular Physics, 11, L671, doi: 10.1088/0022-3700/11/21/006
- Press & Schechter (1974) Press, W. H., & Schechter, P. 1974, ApJ, 187, 425, doi: 10.1086/152650
- Regan et al. (2020a) Regan, J. A., Haiman, Z., Wise, J. H., O’Shea, B. W., & Norman, M. L. 2020a, The Open Journal of Astrophysics, 3, E9, doi: 10.21105/astro.2006.14625
- Regan et al. (2014) Regan, J. A., Johansson, P. H., & Wise, J. H. 2014, ApJ, 795, 137, doi: 10.1088/0004-637X/795/2/137
- Regan et al. (2020b) Regan, J. A., Wise, J. H., Woods, T. E., et al. 2020b, The Open Journal of Astrophysics, 3, 15, doi: 10.21105/astro.2008.08090
- Sakurai et al. (2020a) Sakurai, Y., Haiman, Z., & Inayoshi, K. 2020a, MNRAS, 499, 5960, doi: 10.1093/mnras/staa3227
- Sakurai et al. (2020b) —. 2020b, MNRAS, 499, 5960, doi: 10.1093/mnras/staa3227
- Sakurai et al. (2015) Sakurai, Y., Hosokawa, T., Yoshida, N., & Yorke, H. W. 2015, MNRAS, 452, 755, doi: 10.1093/mnras/stv1346
- Sakurai et al. (2016) Sakurai, Y., Vorobyov, E. I., Hosokawa, T., et al. 2016, MNRAS, 459, 1137, doi: 10.1093/mnras/stw637
- Savin et al. (2004) Savin, D. W., Krstić, P. S., Haiman, Z., & Stancil, P. C. 2004, ApJ, 606, L167, doi: 10.1086/421108
- Scannapieco & Barkana (2002) Scannapieco, E., & Barkana, R. 2002, ApJ, 571, 585, doi: 10.1086/340063
- Schauer et al. (2019) Schauer, A. T. P., Glover, S. C. O., Klessen, R. S., & Ceverino, D. 2019, MNRAS, 484, 3510, doi: 10.1093/mnras/stz013
- Schauer et al. (2015) Schauer, A. T. P., Whalen, D. J., Glover, S. C. O., & Klessen, R. S. 2015, MNRAS, 454, 2441, doi: 10.1093/mnras/stv2117
- Schleicher et al. (2013) Schleicher, D. R. G., Palla, F., Ferrara, A., Galli, D., & Latif, M. 2013, A&A, 558, A59, doi: 10.1051/0004-6361/201321949
- Schneider et al. (1994) Schneider, I. F., Dulieu, O., Giusti-Suzor, A., & Roueff, E. 1994, ApJ, 424, 983, doi: 10.1086/173948
- Schulz & Asundi (1967) Schulz, G. J., & Asundi, R. K. 1967, Physical Review, 158, 25, doi: 10.1103/PhysRev.158.25
- Sesana et al. (2008) Sesana, A., Vecchio, A., & Colacino, C. N. 2008, MNRAS, 390, 192, doi: 10.1111/j.1365-2966.2008.13682.x
- Shang et al. (2010) Shang, C., Bryan, G. L., & Haiman, Z. 2010, MNRAS, 402, 1249, doi: 10.1111/j.1365-2966.2009.15960.x
- Shapiro & Kang (1987) Shapiro, P. R., & Kang, H. 1987, ApJ, 318, 32, doi: 10.1086/165350
- Sheth et al. (2001) Sheth, R. K., Mo, H. J., & Tormen, G. 2001, MNRAS, 323, 1, doi: 10.1046/j.1365-8711.2001.04006.x
- Shibata et al. (2016) Shibata, M., Sekiguchi, Y., Uchida, H., & Umeda, H. 2016, Phys. Rev. D, 94, 021501, doi: 10.1103/PhysRevD.94.021501
- Smith et al. (2018) Smith, B. D., Regan, J. A., Downes, T. P., et al. 2018, MNRAS, 480, 3762, doi: 10.1093/mnras/sty2103
- Stancil (1994) Stancil, P. C. 1994, ApJ, 430, 360, doi: 10.1086/174411
- Sugimura et al. (2014) Sugimura, K., Omukai, K., & Inoue, A. K. 2014, MNRAS, 445, 544, doi: 10.1093/mnras/stu1778
- Tanaka et al. (2013) Tanaka, K. E. I., Nakamoto, T., & Omukai, K. 2013, ApJ, 773, 155, doi: 10.1088/0004-637X/773/2/155
- Tanaka & Haiman (2009) Tanaka, T., & Haiman, Z. 2009, ApJ, 696, 1798, doi: 10.1088/0004-637X/696/2/1798
- Tanaka & Li (2014) Tanaka, T. L., & Li, M. 2014, MNRAS, 439, 1092, doi: 10.1093/mnras/stu042
- Tegmark et al. (1997) Tegmark, M., Silk, J., Rees, M. J., et al. 1997, ApJ, 474, 1, doi: 10.1086/303434
- Toyouchi et al. (2021) Toyouchi, D., Inayoshi, K., Hosokawa, T., & Kuiper, R. 2021, ApJ, 907, 74, doi: 10.3847/1538-4357/abcfc2
- Trevisan & Tennyson (2002) Trevisan, C. S., & Tennyson, J. 2002, Plasma Physics and Controlled Fusion, 44, 1263, doi: 10.1088/0741-3335/44/7/315
- Tseliakhovich & Hirata (2010) Tseliakhovich, D., & Hirata, C. 2010, Phys. Rev. D, 82, 083520, doi: 10.1103/PhysRevD.82.083520
- Valiante et al. (2016) Valiante, R., Schneider, R., Volonteri, M., & Omukai, K. 2016, MNRAS, 457, 3356, doi: 10.1093/mnras/stw225
- Visbal et al. (2014a) Visbal, E., Haiman, Z., & Bryan, G. L. 2014a, MNRAS, 445, 1056, doi: 10.1093/mnras/stu1794
- Visbal et al. (2014b) —. 2014b, MNRAS, 442, L100, doi: 10.1093/mnrasl/slu063
- Voit et al. (2003) Voit, G. M., Balogh, M. L., Bower, R. G., Lacey, C. G., & Bryan, G. L. 2003, ApJ, 593, 272, doi: 10.1086/376499
- Voit et al. (2005) Voit, G. M., Kay, S. T., & Bryan, G. L. 2005, MNRAS, 364, 909, doi: 10.1111/j.1365-2966.2005.09621.x
- Walkauskas & Kaufman (1975) Walkauskas, L., & Kaufman, F. 1975, Symposium (International) on Combustion, 15, 691, doi: https://doi.org/10.1016/S0082-0784(75)80339-0
- Wang et al. (2021) Wang, F., Yang, J., Fan, X., et al. 2021, ApJ, 907, L1, doi: 10.3847/2041-8213/abd8c6
- Willott et al. (2010) Willott, C. J., Delorme, P., Reylé, C., et al. 2010, AJ, 139, 906, doi: 10.1088/0004-6256/139/3/906
- Wise & Abel (2007) Wise, J. H., & Abel, T. 2007, ApJ, 665, 899, doi: 10.1086/520036
- Wise et al. (2019) Wise, J. H., Regan, J. A., O’Shea, B. W., et al. 2019, Nature, 566, 85, doi: 10.1038/s41586-019-0873-4
- Wolcott-Green & Haiman (2011) Wolcott-Green, J., & Haiman, Z. 2011, MNRAS, 412, 2603, doi: 10.1111/j.1365-2966.2010.18080.x
- Woods et al. (2017) Woods, T. E., Heger, A., Whalen, D. J., Haemmerlé, L., & Klessen, R. S. 2017, ApJ, 842, L6, doi: 10.3847/2041-8213/aa7412
- Woods et al. (2019) Woods, T. E., Agarwal, B., Bromm, V., et al. 2019, PASA, 36, e027, doi: 10.1017/pasa.2019.14
- Wu et al. (2015) Wu, X.-B., Wang, F., Fan, X., et al. 2015, Nature, 518, 512, doi: 10.1038/nature14241
- Wyithe & Padmanabhan (2006) Wyithe, J. S. B., & Padmanabhan, T. 2006, MNRAS, 366, 1029, doi: 10.1111/j.1365-2966.2005.09858.x
- Yoshida et al. (2003) Yoshida, N., Abel, T., Hernquist, L., & Sugiyama, N. 2003, ApJ, 592, 645, doi: 10.1086/375810
- Zygelman et al. (1989) Zygelman, B., Dalgarno, A., Kimura, M., & Lane, N. F. 1989, Phys. Rev. A, 40, 2340, doi: 10.1103/PhysRevA.40.2340
| Number | Reaction | Reference |
| H collisional reactions | ||
| 1 | H + e- H+ + 2e- | 1 |
| 2 | H+ + e- H + | 2∗ |
| 3 | H + e- H- + | 3 |
| 4 | H- + H H2 + e | 4 |
| 5 | H + H+ H + | 5 |
| 6 | H+ H H2 + H+ | 6 |
| 7 | H2 + H 3H | 7 |
| 8 | H2 + H+ H + H | 8 |
| 9 | H2 + e- 2H + e- | 9 |
| 10 | H- + e- H + 2e- | 10 |
| 11 | H- + H+ 2H | 11 |
| 12 | H- + H+ H + e- | 12 |
| 13 | H + e- 2H | 13 |
| 14 | H + H- H2 + H | 14 |
| 15 | 3H H2 + H | 15 |
| 16 | 2H + H2 2H2 | 16 |
| 17 | 2H2 2H + H2 | 17 |
| 18 | H- + H 2H + e- | 18 |
| 19 | H- + H 3H | 19 |
| 20 | H2 + e- H- + H | 20 |
| photo-dissociation and detatchment reactions | ||
| 21 | H2 + 2H | 21 |
| 22 | H- + H + e- | 22 |
| 23 | H + H + H+ | 23 |
| He reactions | ||
| 24 | He + e- He+ + 2e- | 24 |
| 25 | He+ + e- He + | 25 |
| 26 | He+ + e- He++ + 2e- | 26 |
| 27 | He++ + e- He+ + H+ + | 27 |
| 28 | H2 + He 2H + He | 28 |
| 29 | H2 + He+ He + H + H+ | 29 |
| 30 | H2 + He+ H + He | 30 |
| 31 | He+ + H He + H+ | 31 |
| 32 | He + H+ He+ + H | 32 |
| 33 | He+ + H- He + H | 33 |
| 34 | He + H- He + H + e- | 34 |
| 35 | 2H + He H2 + He | 35 |
(1) Abel et al. (1997); (2) Ferland et al. (1992), Case B; (3) McLaughlin et al. (2017); (4) Kreckel et al. (2010); (5) Coppola et al. (2011); (6) Karpas et al. (1979); (7) Mac Low & Shull (1986); Lepp & Shull (1983); (8) Savin et al. (2004); Coppola et al. (2011); (9) Trevisan & Tennyson (2002); (10) Janev et al. (1987); (11) Croft et al. (1999); (12) Poulaert et al. (1978); (13) Schneider et al. (1994); (14) Dalgarno & Lepp (1987); (15) Abel et al. (2002); Orel (1987); (16) Jacobs et al. (1967); (17) Martin et al. (1998); Shapiro & Kang (1987) (18) Janev et al. (1987); (19) Dalgarno & Lepp (1987); (20) Schulz & Asundi (1967); (21) Wolcott-Green & Haiman (2011); (22) McLaughlin et al. (2017); (23) Stancil (1994); (24) Janev et al. (1987); (25) Hummer & Storey (1998); (26) Janev et al. (1987); (27) Ferland et al. (1992); (28) Dove et al. (1987); (29) Barlow (1984); (30) Barlow (1984); (31) Zygelman et al. (1989); (33) Kimura et al. (1993); (33) Peart & Hayton (1994); (34) Huq et al. (1982); (35) Walkauskas & Kaufman (1975);