What will they do?
Modelling self-evacuation archetypes
Abstract
A decade on from the devastating Black Saturday bushfires in Victoria, Australia, we are at a point where computer simulations of community evacuations are starting to be used within the emergency services. While fire progression modelling is embedded in strategic and operational settings at all levels of government across Victoria, modelling of community response to such fires is only just starting to be evaluated in earnest. For community response models to become integral to bushfire planning and preparedness, the key question to be addressed is: when faced with a bushfire, what will a community really do? Typically this understanding has come from local experience and expertise within the community and services, however the trend is to move towards more informed data driven approaches. In this paper we report on the latest work within the emergency sector in this space. Particularly, we discuss the application of Strahan et al.’s self-evacuation archetypes to an agent-based model of community evacuation in regional Victoria. This work is part of the consolidated bushfire evacuation modelling collaboration between several emergency management stakeholders.
1 Introduction
Wildfires (called bushfires in Australia) now pose serious threats to life and property in numerous countries globally 111For a global list of serious wildfires see https://en.wikipedia.org/wiki/List_of_wildfires. There is general agreement among environmental scientists and wildfire researchers that severe wildfires will become more frequent in future, in many regions, as a result of climate change [1]. The immediate threats to human life from wildfire result from the intense heat generated by large masses of burning vegetation fuels. Most wildfire fatalities are caused by radiant or convective heat; vehicle accidents during late evacuation have also caused significant numbers of civilian casualties [2]. Residents threatened by a severe wildfire have, in principle, three protective action options: contesting the threat by actively defending their property, enduring the threat by sheltering passively on their property, or avoiding the threat by timely evacuation to a safer location—which may be remote from the threatened area (e.g., at a designated evacuation centre) or nearby in an ad hoc last-resort shelter location [3]. Timely evacuation away from the threatened location is the protective action preferred overwhelmingly by authorities in countries where wildfires are a serious hazard. In North America and Europe evacuation is usually mandated; in Australia bushfire evacuation is typically advisory, forced evacuations are rare.
Historically, two research perspectives have dominated hazard evacuation research generally, including wildfire threat evacuation: an engineering perspective, and a behavioural perspective [4]. An engineering perspective focusses on vehicular (mostly) traffic flow modelling—volume and timing analysis. A behavioural perspective focusses on understanding factors influencing public compliance with evacuation orders or advice— preparation and readiness. More recently, there has been an integration of these two perspectives so that understandings of evacuation behaviour are incorporated into modelling in order to improve the accuracy of evacuation traffic routing and time estimates [4, 5]. A recent review of research findings about behavioural factors in evacuation under wildfire threat [6] concluded the following (pp. 503): (i) Regardless of whether an evacuation is mandatory or advisory, some residents will want to remain on their property to protect it. (ii) A significant percentage of residents will want to delay leaving because they will not leave until they are certain that leaving is necessary. (iii) Some residents who are not on their property when the evacuation warning is given will attempt to return to their property first, rather than proceeding to a safer location immediately. (iv) Mandatory evacuation orders are likely to result in higher rates of compliance and fewer residents delaying evacuation. (v) Residents of farms and other agribusinesses are more likely to stay and defend their properties. Residents of amenity dwellings are more likely to leave. (vi) Three important determinants of residents’ actions are: (a) their prior plan about what they will do if threatened, (b) their perceived danger from the fire, and (c) their level of logistical preparations and readiness to evacuate. (vii) Evacuation will be more difficult and involve longer delays for families with: (a) children, (b) members who have disabilities or special needs, (c) companion animals and/or livestock.
Safe evacuation is not simply a matter of authorities convincing residents to leave early, sufficient means of safe egress must be available for the traffic volume under the conditions of the day. Modelling the impact of a wildfire threat on a specific location or area can assist authorities to better plan and prepare for an evacuation under a range of vegetation fuel loads, fire weather conditions, population characteristics, and egress capacities.
Models of bushfire progression [7, 8] and traffic evacuation dynamics [9, 10, 11] assist in understanding the physical and social dynamics of bushfire threats. However the integration of householder decision response to imminent bushfire threat into dynamic travel demand models of vehicular traffic is in its early stages [12]. While several studies that consider household behaviours in bushfires have been conducted [13, 14, 15], a failure to incorporate these important elements of human behaviour in computer models continues to be a shortcoming [16]. The infancy of this work may be explained by the lack of a systematic modelling framework of household perceptions and response to bushfire [12, 17]. Progress on identifying functional requirements of a model [18], the factors to include [16] and recently, a means of connecting physical conditions with householder decision-making and their protective response are being made [5].
In this context an agent-based model [19] of householder decision-making, using the behavioural insights provided by the self-evacuation archetypes [20, 21] was developed. Factors affecting householder decision-making and how they respond to different information and cues were systematically incorporated into a dynamic vehicle travel demand model. The archetype-based model enables perception and response-based predictions of householders’ decision to stay or leave and the timing of their action. Communities are modelled at the level of an individual who are each assigned to an archetypal persona. Synthetic individuals in the simulation make decisions based on their personal circumstance (such as their location and whether they have dependants to attend to), their understanding of the unfolding bushfire situation (built from what they “hear” from the emergency services and “see” based on their proximity to the fire), and their individual propensity for risk (which differs between archetypes and also individuals of the same archetype).
The archetype-based behaviour model has been integrated into the Emergency Evacuation Simulator (EES) [9] that is currently being used by Victorian emergency services for understanding community response in bushfire evacuation scenarios. The EES allows community evacuation response to be simulated for any bushfire situation and weather conditions. It takes as input a time-varying fire progression shape output by the Phoenix RapidFire model [7]222Phoenix RapidFire outputs for the chosen weather conditions are supplied by the Victorian emergency services., and simulates the response of the affected communities in terms of individuals’ decisions to stay or leave, as well as vehicular movements where decisions to leave have been made. The situation-based cognitive decision making is modelled using the Belief-Desire-Intention paradigm [22, 23], while the vehicular movements of the associated individual on the road network are modelled using the MATSim traffic simulator [24], with the coupling between the two provided by the BDI-MATSim integration framework [25].
Outputs of the simulation include full details of vehicles’ trajectories along with individuals’ time-stamped decisions, which together constitute virtual accounts of archetypal individuals’ bushfire experience, and resemble anecdotal accounts from survivors of real bushfires. These outputs can be utilised by the emergency services in different ways. Visualisations of the simulation can help to identify likely congestion bottleneck areas in the road network. Outputs from a range of bushfire situations can help improve understanding of likely, worst, and best case evacuation outcomes for communities and inform planning, preparedness, and community education programs. Analysis from simulation runs for current weather conditions and possible bushfire scenarios can be used in an operational setting on the day. A range of response strategies can be virtually tested, including the timing and level of emergency messages sent to residents, as well as traffic control points and road blockages that could be deployed to direct evacuating vehicles readily towards safety.
2 Self-evacuation Archetypes
An archetype is a typical character who resonates with an observer due to their universally shared, fundamental characteristics of humanity based on myths, legends and esoteric teachings [26]. Social cues, replicated through dominant discourse [27] and collective memory, as shared experiences that are constructed and validated through social interaction [28] are also a basis for the formation of individual and societal perceptions of archetypes.
Archetypes do not represent the circumstances or behaviour of individuals but reflect typical groupings. Archetypes provide a framework for addressing the questions about who does what, why and when they do it, reflecting individual attitudes, needs, motivations, and issues fundamental to them. They provide insights into how people think, feel, and act in a prevailing situation, clarifying patterns of behaviour and drivers to action. Different archetypes reflect a range of typical and generally predictable patterns of actions or response which are influenced by the interaction between the context and a variety of other salient factors. Archetypes also enable a greater understanding of both the potential barriers to and the opportunities and strategies for communicating and engaging with individuals.
Archetypes in a bushfire context are characterised by the way they understand bushfire risk, and their attitudes, intentions and priorities including self-efficacy and responsibility, bushfire experience, threat perception, preparedness, use of environmental and social cues and networks, and intended protective response.
| Archetype | Key Characteristics | Evacuate or Remain |
| Responsibility Denier | Believe they are not responsible for their personal safety or for their property | Highly committed evacuators but expect others to direct and assist |
| Dependent Evacuator | Expect the emergency services to protect them and their property because they are incapable of taking responsibility for themselves | Highly committed evacuators but expect others to direct and assist |
| Considered Evacuator | Having carefully considered evacuation, are committed to it as soon as they are aware of a bushfire threat | Committed to self-directed evacuation |
| Community Guided | Seek guidance from neighbours, media and members of the community who they see as knowledgeable, well informed and providing reliable advice | Committed to evacuation on community advice |
| Worried Waverer | Prepare and equip their property and train to defend it but worry they lack practical experience to fight bushfire putting their personal safety at risk | Wavering between evacuating and remaining |
| Threat Denier | Do not believe that their personal safety or property is threatened by bushfire | Committed to remain at their property as perceived lack of threat makes evacuation unnecessary |
| Experienced Independent | Are highly knowledge, competent and experienced and are responsible and self-reliant fighting bushfire | Highly committed to remaining to defend their property because they are highly experienced and well prepared |
Seven bushfire self-evacuation archetypes reported by Strahan et al. [20] in Table LABEL:tab:archetypes characterise the diverse attitudes and behaviours of typical groupings of householders faced with making a protective decision during a bushfire. The archetypes were established using the following process (cf. [20]). Four hundred and fifty-seven householders who had recently experienced bushfire participated in a telephone interview as part of a study of factors predicting self-evacuation [21]. The Protective Action Decision Model (PADM) [29, 30] provided a theoretical framework for the survey questions, data from many of which were converted to Z scores and analysed using the K-means cluster procedure of IBM SPSS 24 to identify groupings of cases. The procedure was repeated for 3 to 8 clusters with 7 clusters (n= 31-93) achieved after 13 iterations and providing the greatest stability. Univariate ANOVAs indicating clustered groups differed significantly (p¡0.05) on all except four variables. The seven clusters were subject to explanatory discriminant function analysis to demonstrate their statistical validity. Weighted linear combinations of variables that best differentiated the clusters produced discriminant functions that accounted for a statistically significant percentage of between group differences. 93.4% of the grouped cases were correctly classified and 79% using a leave-one-out cross validation approach.
3 Method
We describe here the process of constructing a synthetic population of archetypes for a new region, assigning evacuation behaviours to it, and putting together and simulating a full bushfire evacuation scenario.
3.1 Estimating the likelihood of archetypes
We used Strahan et al.’s [20] original data from telephone interviews of individuals (n=457) of bushfire affected areas in the Perth (2014) and Adelaide Hills (2015) to extract the makeup of the archetypes by demography. The output of this step was a matrix giving the likelihood of an individual with the demographic signature <age,gender,hhtype>, i.e., of a given age, gender, and household type (rows), belonging to a certain archetype (columns). A sample row of the matrix is shown in Table 2. Some cells in were evidently empty, due to a lack of samples for that demographic signature in the original data. Where rows had only some missing values, the empty cells were assigned a zero probability 333This step could be improved by estimating the values of the empty cells based on neighbouring cells in the matrix, though we did not do this here., such as for the WW and DE cells in Table 2. For rows where all cells were empty, i.e., no sample existed for that type of person, the signature was allocated to a new Unknown Type class with 100% probability. The size of the probabilities matrix was , given by archetype columns (7 archetypes plus Unknown Type), and signatures (7 age groups: , , , , , , ; 2 genders: Male, Female; and 5 household types: Single adults with/without dependant children, Couples with/without dependent children, and Group adults).
| Person | CE | CG | TD | WW | RD | DE | EI | UT |
|---|---|---|---|---|---|---|---|---|
| Female, 25-34, Couple with dependants living at home | 2.4 | 4.8 | 2.4 | - | 2.4 | - | 2.4 | - |
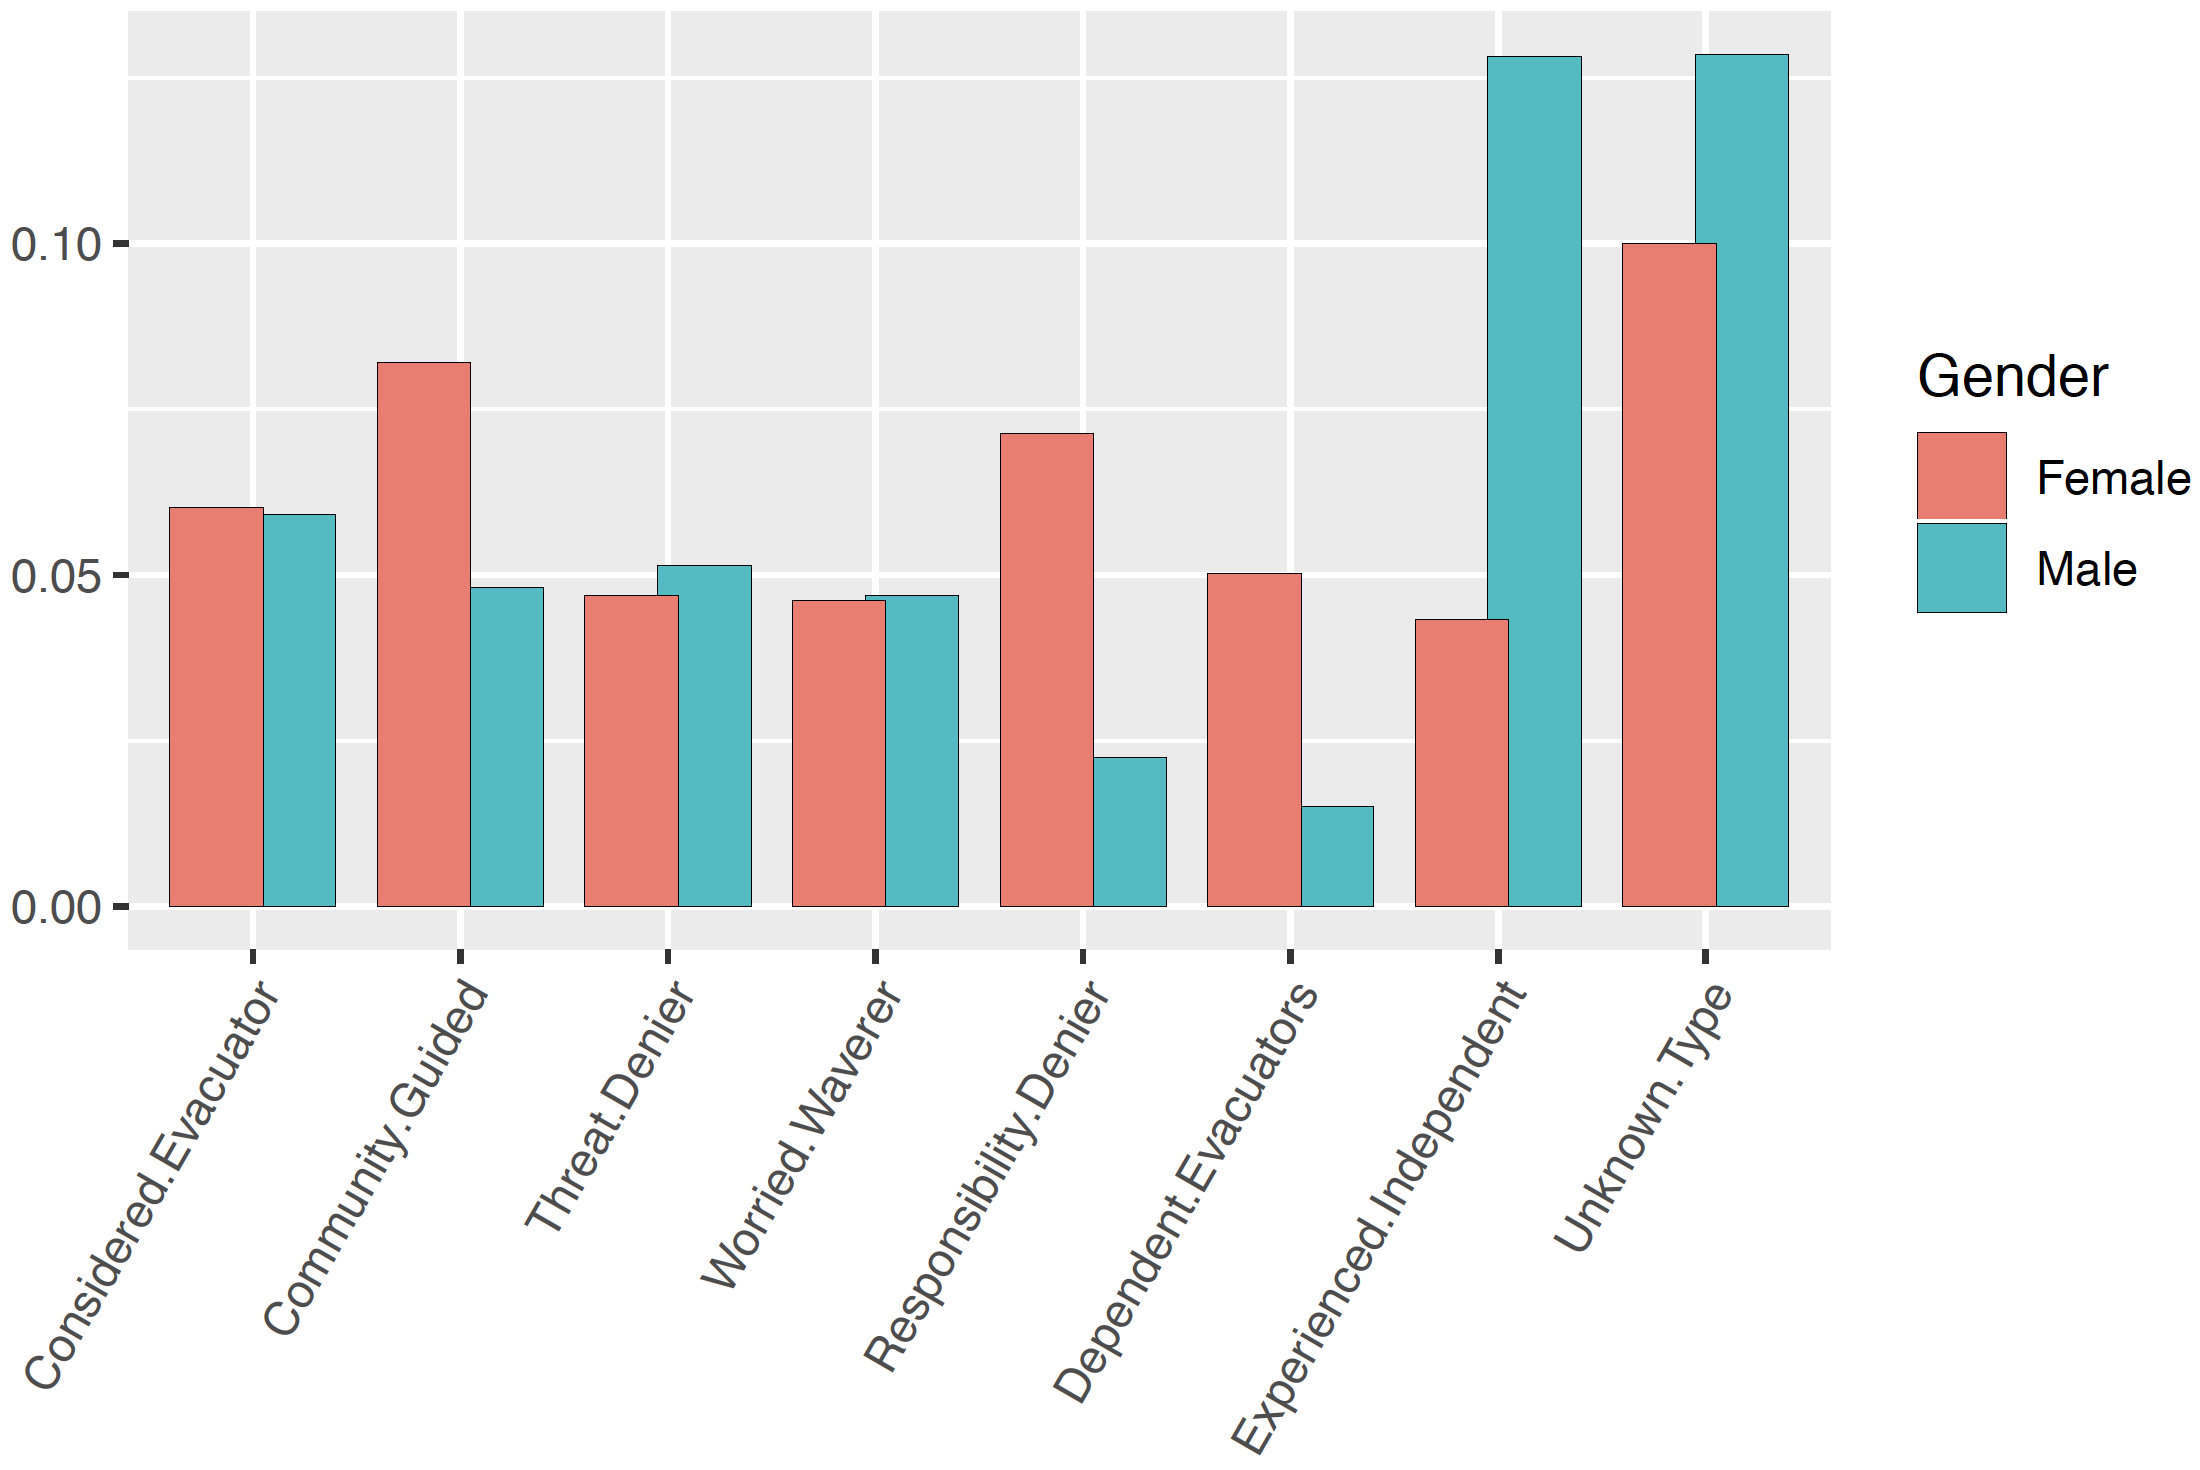
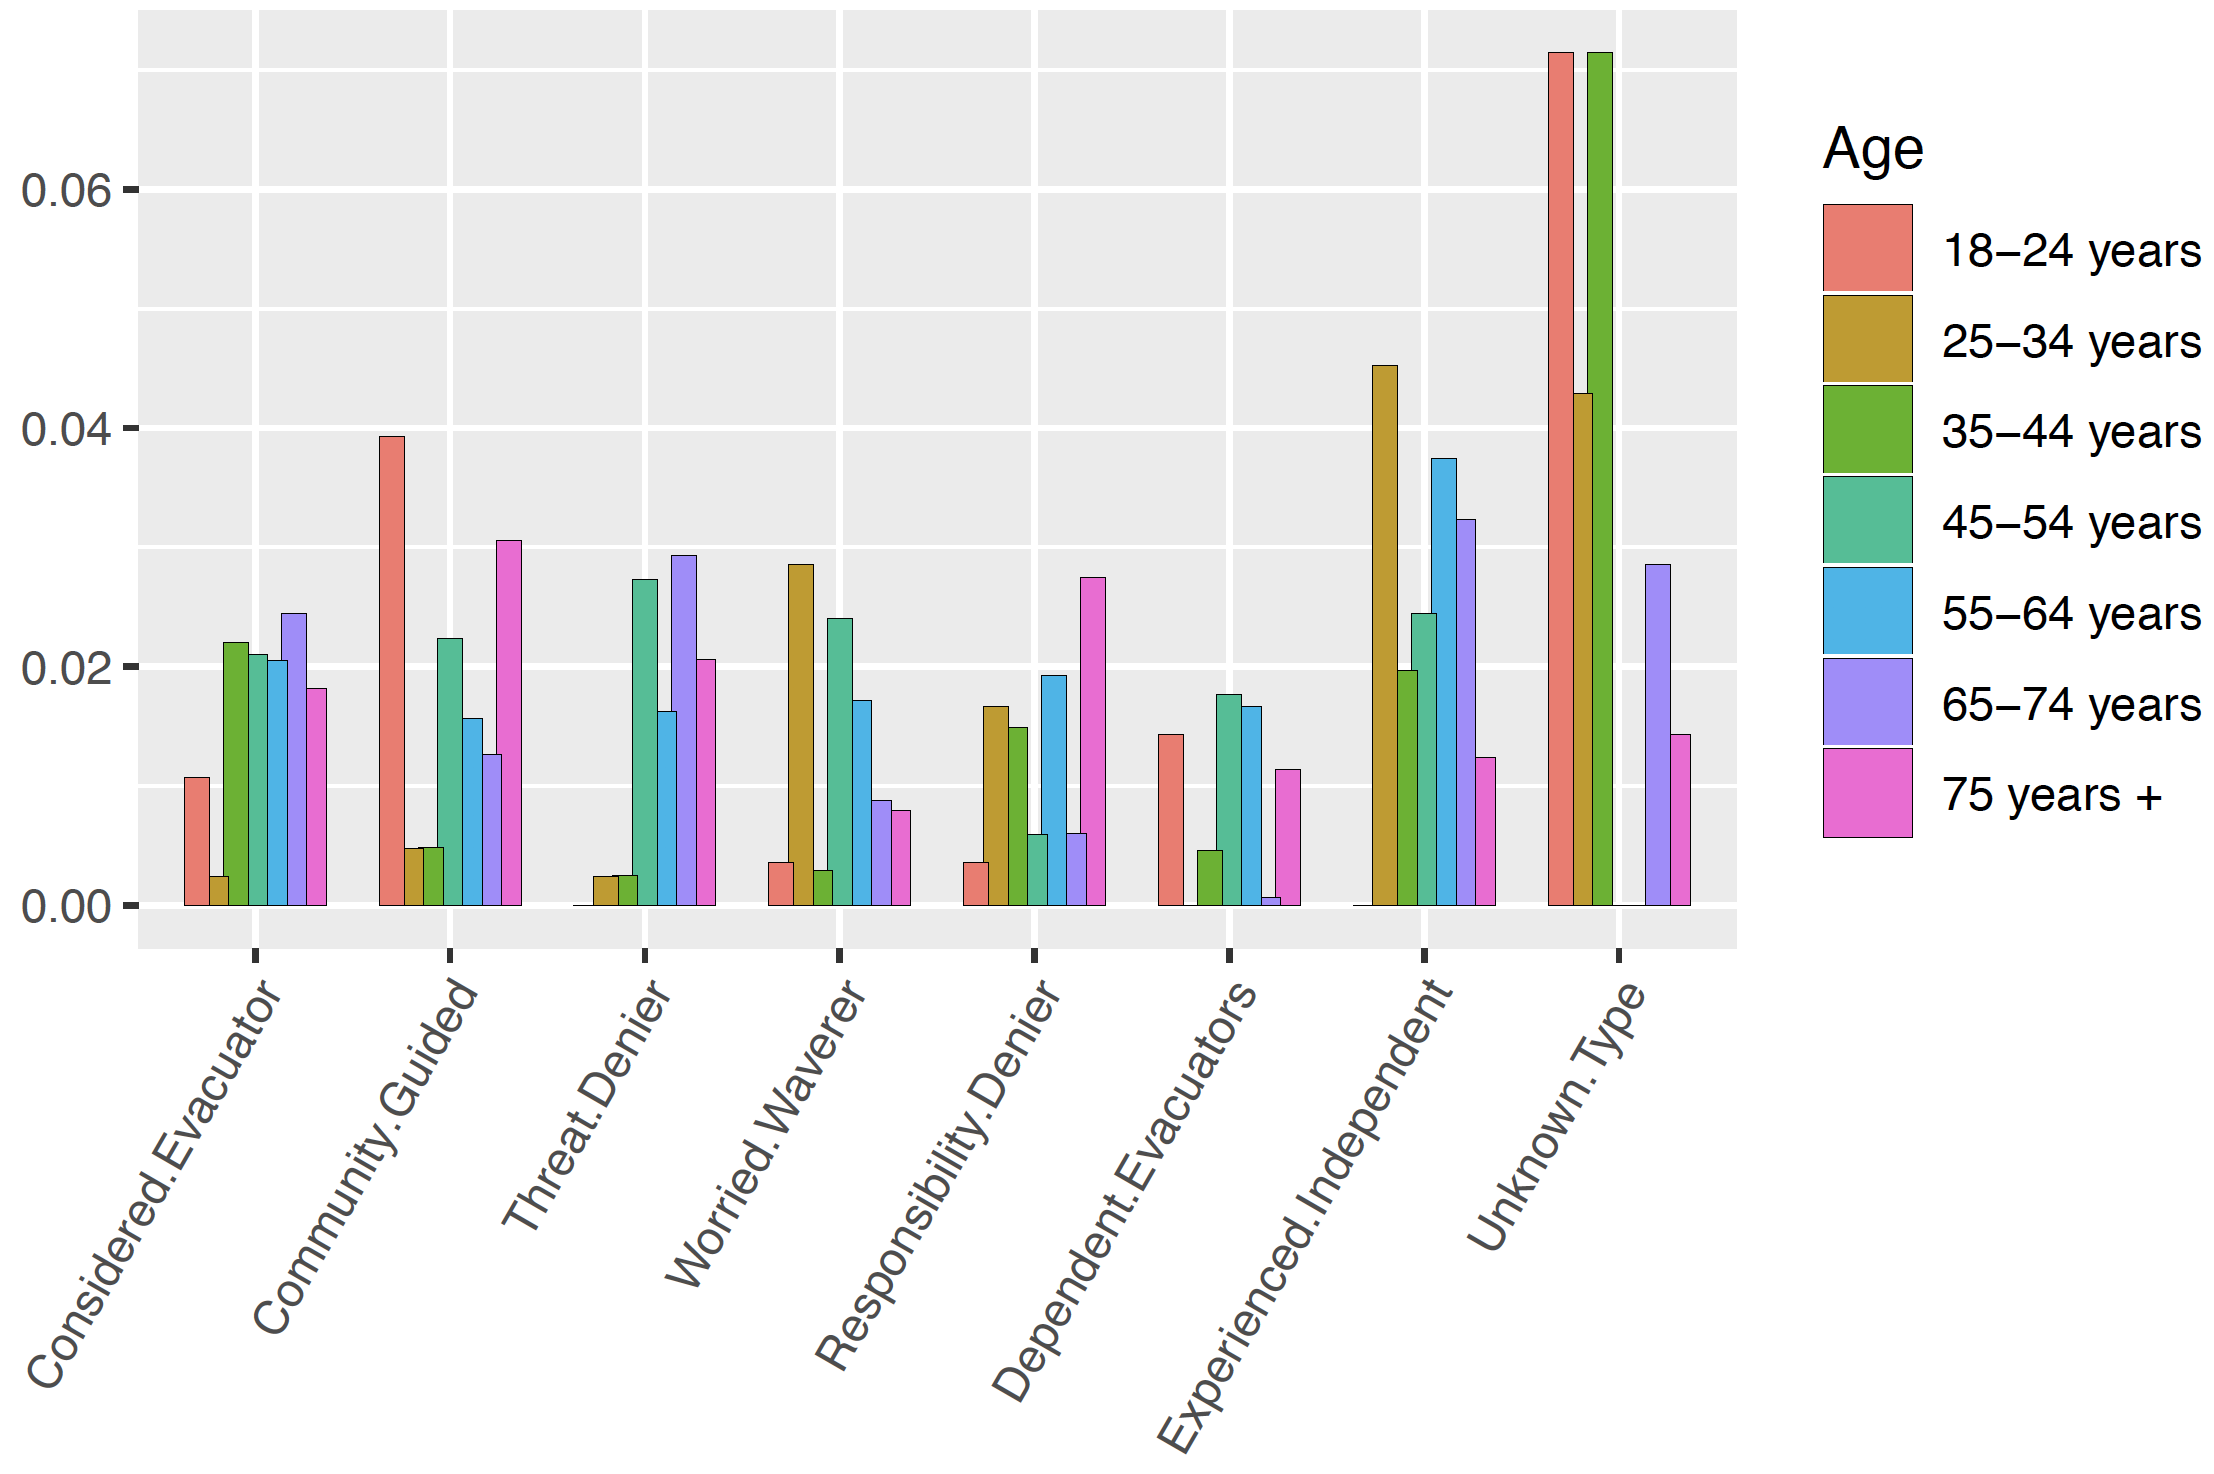
Figure 1 shows two different views of , by gender (1a), and by age groups (1b). A third view of the data by household types is omitted here for brevity. In subsequent steps, we use the distribution of archetypes by demographic signature (<age,gender,hhtype>) given by here, to probabilistically assign archetypes to individuals of a different region (to the original group), based on that region’s demography.
3.2 Synthesising the population for a region
The aim of population synthesis is to construct virtual instances of persons and households and assign to them attributes of a real population, such as age, sex, and relationships, in such a way that the virtual population is a good match, statistically, to the real population, with respect to those attributes. The population attributes being matched are typically taken from marginal distributions available in census tables.
We used a sample-free approach to population synthesis that does not rely on a disaggregate sample from the original population to seed the algorithm, as is required by methods like Iterative Proportional Updating (IPU) [31]. This is particularly useful in the Australian context where samples are not freely available. Joint marginal distributions for exactly the desired attributes of the population can readily be downloaded from the Australian Bureau of Statistics (ABS) website444https://abs.gov.au using their TableBuilder tool, making it unnecessary to use techniques like Iterative Proportional Fitting (IPF) [32, 33] for deriving such. The technique we used is described in [34] and summarised below. Full code for the population synthesis algorithm, along with instructions for building a synthetic population for any region of Australia are available on GitHub from https://github.com/agentsoz/synthetic-population. A similar approach to ours was proposed in [35] for 2006 Australian census. However, that work is not suitable any more as different household categorisations are used 2011 onwards. Additionally, that work assumes a family to be a household. One used here constructs multi-family households, and is more informative.
Our population synthesiser uses the census data available from the ABS, which provides population distributions and ESRI Shapefiles of statistical areas. The Australian Statistical Geography Standard (ASGS)555https://www.abs.gov.au/websitedbs/D3310114.nsf/home/Australian+Statistical+Geography+Standard+(ASGS) divides Australia into regions at different granularities. Here, we use data at Statistical Area 2 (SA2) granularity, which roughly coincides with suburbs and localities. The person-level data is a joint distribution of the number of persons under age, gender and family/household relationship categories. There are eight age categories (0--14, 15--24, 25--39, ..., 100+), two genders (Male and Female) and eight family/household relationship categories (Married, Lone Parent, Under 15 Children, Student, Over 15 Children, Relatives, Lone Person and Group household member). This gives a total of 128 categories (). The household-level data is a joint distribution of number of households under eight household size (1, 2, ..., 8 or more persons) and 14 family household composition categories, giving a total of 96 categories (). Lone person households and group households are the only two non-family categories in the family household composition categories. The remaining 12 relate to familial compositions, which represent the number of families (1, 2 and 3 or more) in a household and the type of its primary family (Couple with no children, Couple with children, One parent family and Other family). An example of a household category is 5 persons, 2 Families: Couple with children that consists of 5 persons in two families where the primary family is a couple that has children.
Households marginal distribution ()
SA2 age distribution ()
List of SA2s ()
Dwellings geographical data ()
Our algorithm uses the following assumptions, made by us, and heuristics derived from the census data descriptions. A couple is assumed to be a pair of a married male and a female from the same age category or the female from one age category younger than the male. Children are at least 15 years younger than the youngest parent. A parent can have up to eight children. A one parent family consists of a lone parent and at least one child. A family consisting of two or more relatives, like two siblings living together, is called an other family. A family nucleus can also have relatives like a single older parent or a sibling living together. The primary family of a multi-family household is decided in the priority order of couple with children and then one parent families. If there are two families of the same type, one with more children gets priority. Couple with no children and other family have the lowest but equal priority.
Algorithm 1 illustrates the process of synthesising the population according to the above specifications. The data cleaning checks whether the persons distribution has the required numbers to generate all the households and families in the households distribution, and fixes any discrepancies. As the data does not fully describe secondary and tertiary families, the cleaning process cannot fix all the discrepancies. The missing persons required for families are created probabilistically in the later population synthesis steps. A basic family structure is the minimum configuration of persons required by the family/household type. The age of a person is determined based on the age category and the distribution of persons by age within a.
Algorithm 1 was validated by generating the populations for 306 non-empty SA2s in the 2016 Greater Melbourne area census. As the algorithm uses the household-level joint distribution as the reference, household-level distributions of the generated populations match perfectly with the input data. Thus, the evaluation focused on validating the generated person-level data distributions against the corresponding input census distributions using the Freeman-Tukey’s goodness of fit test (FT test) [36] and the Standardised Absolute Error (SAE) [37]. Further, all the tests were performed after removing impossible person-types like married under 15 children from the person-level distributions. The FT test results showed that the distributions cannot be concluded to be different by rejecting the null hypothesis for any of the 306 SA2 populations at 0.05 significance level, in fact, most p-values were well above 0.05, with 291 SA2s having p-values above 0.9. For the SAE test, 298 SA2s gave errors less than 0.05. Among the eight bad SA2s (out of 306) were four industrial SA2s with very small populations and significant census data inconsistencies. The remaining four were residential areas, and their worst SA2 had an SAE of 0.061, which is still well below the 0.1 SAE acceptance threshold proposed in [38].
Geographical locations of households are determined by randomly allocating them to dwellings within an SA2. Vicmap data666http://services.land.vic.gov.au/landchannel/content/productCaalogue provides geographical coordinates and addresses of dwellings in Victoria. A dwelling’s SA2 is obtained by finding the SA2-geographical-polygon containing it.
The output of this step was a set of .csv files that constitute a relational database of unique persons, in unique families, in unique households, in unique dwellings. Importantly, each person in the synthetic population has its own set of attributes including <age,gender,hhtype> 777Note that the hhtype household type names in Strahan et al.’s data [20] do not directly match the names used by the population synthesis algorithm [34], however this was easily resolved by mapping one to the other since conceptually they deal in the same groupings. among others, which we use to perform the demographic match to and assignment of archetypes, using the matrix from Section 3.1, as described next.
3.3 Assigning archetypes to the population
The function for probabilistically assigning archetypes to the synthetic population of a new region is given in Algorithm 2. The function operates one by one on the set of individuals in the input synthetic population (lines 1–9). For a given individual , it first extracts its demographic signature of the form <age,gender,hhtype> (line 2), and the associated archetypes probabilities for that signature from matrix (line 3). The obtained vector has size , being the probabilities of the seven archetypes plus the extra Unknown Type type. Vector is then normalised to (line 4), and re-assigned the cumulative sum of its elements (line 5). The function then picks a random number in the range [0,1] (line 6), and finds the vector index for which the cumulative probability exceeds (line 7). Finally the archetype associated with index is assigned to individual (line 8).
3.4 Assigning attitudes to archetypes
The matrix in Table 3 shows the different bushfire-related attitudes (in the range ) that are assigned to individuals of the different archetypes. Each row captures the relative difference in the value that each archetype places on the attitude of the first column, irrespective of all other considerations. Each column captures how a given archetype values the different attitudes relative to each other. Higher values indicate a higher level of importance placed on an attitude. For instance, a Community Guided person (column 2) places a lot more importance on the sight of fire (VisibleFire =) than smoke (VisibleSmoke =). Also this kind of person is impacted more by some official messages received from the emergency services (EmergencyWarning =, EvacuateNow =), than the sight of smoke. On the other hand, an official EmergencyWarning (row 7) is considered important by Considered Evacuator, Community Guided, and Worried Waverer archetypes, but is of no consequence to the other types (EmergencyWarning =).
For each archetype, each attitude-value pair in the respective column of matrix was assigned to every individual of that type in the population. The only values from matrix that varied between individuals of the same archetype were ThresholdInitial and ThresholdFinal which represent the risk-averseness of an individual. For these attitudes, the values in the matrix were taken as the mean of a normal distribution with standard deviation , and the values assigned to the individuals were samples drawn from this distribution. The standard deviation is not calibrated here, and the value was chosen manually to give sufficient variation in attitudes across archetypes.
| Attitude | CE | CG | TD | WW | RD | DE | EI |
|---|---|---|---|---|---|---|---|
| VisibleSmoke | |||||||
| VisibleEmbers | |||||||
| VisibleFire | |||||||
| Advice | |||||||
| WatchAndAct | |||||||
| EmergencyWarning | |||||||
| EvacuateNow | |||||||
| ThresholdInitial | |||||||
| ThresholdFinal |
The choice of attitudes to include in was influenced by the functionality afforded by the underlying simulation system. For instance, while it is known that the sight and sounds of emergency services vehicles in the vicinity impacts the anxiety levels of people in different ways [14], this attitude was not included in because movements of emergency vehicles are not included in the underlying simulation model presented here. It is expected that as the model is refined in future work and the functionality of the system expanded, other missing but significant attitudes will be added to the model.
The attitudes’ values in were initially chosen manually based on the derived understanding of attitudes of the archetypes from Strahan et al.’s paper [20]. These were subsequently calibrated to match more generally the levels of responses typically seen in bushfires in Australia, as described in Section 3.5.
3.5 Calibrating attitudes of archetypes
The purpose of the calibration effort was to tune the model such that the observed reactions to environmental stimuli matched expected levels of responses to such stimuli from previous bushfires. We will use the example of calibrating the responses to official emergency messages in this section, but note that the same method applies also for other stimuli such as the sight of smoke. Table 4 shows a matrix which is a subset of rows of matrix related to the attitudes towards official emergency messages.
| Attitude | CE | CG | TD | WW | RD | DE | EI |
|---|---|---|---|---|---|---|---|
| Advice | |||||||
| WatchAndAct | |||||||
| EmergencyWarning | |||||||
| EvacuateNow |
The values in are the uncalibrated values that were manually assigned to these rows initially from derived understanding of attitudes of the archetypes from Strahan et al.’s paper [14]. We then applied the calibration process described in Algorithm 3 to , to get the final calibrated rows of reported in Table 3. Algorithm 3 takes these best-guess values and adjusts them, such that the initial response rates achieved across the population for the different types of emergency messages match generally observed response rates in previous bushfires being , , , and [6].
is a matrix of the same dimensions as and is obtained by matrix multiplication of the row vector of probabilities with the column vector of archetypes . The vector is the distribution of archetypes in the synthetic population.
Algorithm 3 proceeds by first calculating the normalised joint distribution by row, i.e, for each emergency message type, given by (lines 1-5). This distribution is then multiplied by to effectively get the desired response rates by emergency message, by archetypes’ distribution, by initial estimate (line 6). Since the initial response thresholds of archetypes are normally distributed about the means and standard deviation (see Section 3.4), we can therefore use the obtained probability for a given message type (row ) and archetype (column ), to calculate the value for the normal distribution at which the cumulative distribution matches the probability (line 8). 888The qnorm function in the R statistical package does precisely this and was used here. The output of the process is matrix which constitutes the relevant rows in (see Table 3).
| Message | Response (%) desired | Response (%) pre-calibration | Response (%) post-calibration |
|---|---|---|---|
| Advice | 1.0 | 16.3 | 1.0 |
| WatchAndAct | 5.0 | 16.3 | 5.1 |
| EmergencyWarning | 30.0 | 31.8 | 31.5 |
| EvacuateNow | 40.0 | 45.0 | 42.1 |
To verify that the desired response rates are achieved after calibration, we ran the simulation several times without any bushfire, but instead each time sending just one of the four emergency messages to the full population, and recording the total number of agents whose initial threshold ThresholdInitial was breached. The response in this case could therefore be fully attributed to the individual message that was sent. The actual response rates observed are reported in Table 5.
3.6 Assigning activities to the population
In this step we address the question: where is the population and what is it doing at the time of the bushfire emergency? A common approach for capturing regular activities and trips of a population is activity-based travel demand modelling [39, 24]. The typical process here is to use available data about the population on origins and destinations, timings of trips and activities, and modes of travel, to estimate the travel demand for a given day. The model is then calibrated against expected travel times and distances, mode share, and traffic volumes.
For Victoria, the best source of information on population activities is Victorian Integrated Survey of Travel and Activity (VISTA) 999https://transport.vic.gov.au/data-and-research/vista, which is a regular survey of 1% of the population. Together with Australian census data 101010https://www.abs.gov.au/census, VISTA travel dairies can be successfully used to construct a validated activity-based model, as demonstrated by the Melbourne Activity-Based Model (MABM) [40]. However, VISTA data coverage for regional Victoria–where bushfire risk is highest–is limited, and models like MABM therefore have limited representation of traffic patterns in these regions. In any case, census and VISTA data may not sufficiently capture the population that may be present in the region on the bushfire day. For instance, townships along the famous Great Ocean Road in Victoria may see the daytime population surge by 10-fold due to visiting tourists.
Previous work with emergency services in regional Victoria has looked at an alternative method that elicits best-guess information from experts about the makeup of the population and the distribution of their activities on the day, in the form of an easily specified table, and uses this information to automatically construct a synthetic population that on the whole matches this distribution [41]. In this model, a plan is generated for each individual based on the population subgroup they belong to. A set of possible activities that people are typically engaged with in the region is used to define both activity distributions and a set of feasible activity location co-ordinates for each subgroup. Candidate activities are assigned first with a per time-step procedure that uses start-time probabilities derived from the activity distribution. The output of this process can be interpreted as a Boolean matrix with each row representing an activity and each column representing a time-step:
A workable ordered plan is then established according to durations associated with each activity (these may also vary by subgroup). Iteratively, the matrix is organised according to the length of time remaining from a previously selected activity. The resultant matrix will then give a feasible day plan:
where the unique 1 value in each column represents the planned activity for that time-step. Start times are then added to each activity by selecting a random time within the corresponding time-step, which across the population avoids waves of trips occurring periodically at each time-step interval.
Once an ordered schedule has been organised, it remains to assign locations to each activity. Individuals are given a home location, according to their subgroup, which denotes where their plan will start (and end). The location of each subsequent activity is then iteratively chosen at the locality level, which is essentially a group of addresses in a common area. The probability of a locality being chosen for the next activity is inversely proportional to its centroid distance from the current activity’s locality and proportional to a sum of an allocation weighting assigned to each eligible location within the locality. Once the locality is chosen, an eligible location within it is chosen at random, and that location’s allocation weighting is reduced by one. Locality-based selection allows some representation of personal preference in location choice, and also reduces the computational requirements of the algorithm as the number of prescribed location options increases. With correctly selected allocation weights, location selection follows the gravity model of transportation [42] and allows for specific scenarios to be tested in the model, such as an event at a beach resulting in that beach being more popular than others on that particular day. 111111 A population was constructed for Surf Coast Shire using the algorithm from [41] in consultation with domain experts from the Surf Coast Shire Council (SCSC) and the Department of Environment, Land, Water and Planning (DELWP). Subgroups were defined as Resident, ResidentPartTime, VisitorRegular, VisitorOvernight and VisitorDaytime. The set of possible activities were home, work, beach, shops and other; the Visitor* subgroups were not eligible for the work activity and thus it did not appear in their activity distribution tables. The other activity was useful to distinguish between locations that different subgroups would be likely to attend. An other activity for a Resident may be at a school, whereas for Visitor* individuals it would likely map to local landmarks or national parks. In the output plans, for the two Resident* subgroups the cumulative effect of work having a longer duration than other activities resulted in discrepancy towards the end of the peak working period, when compared against the desired input distribution. In the other subgroups where work was not a valid activity, the generated plans matched the input distributions to a maximum error of , with the error spread evenly throughout the ‘busy’ part of the day. Per-address data was supplied by SCSC and allowed the home locations for the Resident* population to be distributed accurately throughout the region. VisitorRegular and VisitorOvernight individuals had their home mapped to hotels, camp grounds and some allocated residential addresses to reflect the tendency for visitors to stay in lodging or home stay type arrangements. VisitorDaytime had a small number of source nodes set on the edges of the region, with the majority allocated to the eastern side (traffic inbound from Melbourne). An additional parameter in the algorithm allows for the likelihood of moving between localities for new activities to be set at a per-subgroup level. In this case, the Visitor* individuals were more likely to move across the region throughout the day.
This method allows rich activity-based populations to be constructed through the relatively simple specification of the input matrix of daily activities, however it relies heavily on expert opinion and therefore results can vary significantly depending on the experts consulted.
In the end what is required is very likely a scheme that takes the best of the above two approaches, by generalising trip patterns found in urban and peri-urban samples of VISTA data to regional areas, and using expert opinion as well as regional traffic data counts to calibrate the result. This is an open research area and no complete solution of this kind is available at present to the best of our knowledge.
For the purpose of this work, and given that activity modelling is not the focus here, we will simplify the issue and assume that the synthetic individuals are all located in their homes at the time of the bushfire. This is rather unrealistic, but captures the expected clustering of vehicles in densely populated areas. The assignment of individuals to street addresses, while a simplification, is nevertheless non-trivial and is performed by the Address Mapper algorithm 121212https://github.com/agentsoz/synthetic-population during the population synthesis step described in Section 3.2. Overall, while we do not assign activities with locations, each individual in the population is still assigned a set of coordinates that are used during evacuation to drive to the location of dependants, and/or to evacuation points, as described in Table 6.
| Coordinates | Description |
|---|---|
| Geographical.Coordinate | Home coordinates assigned by the population synthesis algorithm of Section 3.2 to be statistically correct with respect to the distribution of households in SA1 areas given by the 2016 census. |
| EvacLocationPreference | An individual’s preferred out-of-region evacuation destination, when no evacuation destination is suggested by the emergency services messaging; typically assigned by drawing with replacement from a small set of coordinates of nearby townships. |
| InvacLocationPreference | An individual’s preferred within-region evacuation destination when evacuation to EvacLocationPreference is not possible, such as due to heavy congestion and/or a road blockages; typically assigned to the nearest town centre from Geographical.Coordinate. |
| HasDependentsAtLocation | Location of dependants, assigned only to those individuals that have dependants; coordinates are assigned by randomly drawing without replacement from the set of home coordinates of Dependent Evacuator individuals, and if exhausted from a circle of radius 5km around Geographical.Coordinate. |
3.7 Assigning behaviours to the population
The question we address in this section is: what will the population do when the bushfire emergency is upon it? The underlying paradigm we use is called the Belief-Desire-Intention (BDI) model of agency, based in folk psychology and initial work by Bratman on rational systems [43] and Dennett on intentional stance [44]. This work has since been translated to a computational model of bounded rationality [23, 22, 45] and many systems exist today in the BDI-tradition such as Jack [46], Jason [47], and Jadex [48]–and one we use in this work called Jill 131313Our motivation for using Jill is that it is a fast and lightweight open-source BDI engine designed for large-scale simulations with millions of agents. Jill is available at https://github.com/agentsoz/jill..
The BDI premise is that people act according to their beliefs–factual or not–about the world. We hold desires–often conflicting–about states of affairs we would like to bring about, and these desires determine our goals. Our intentions are goals we are committed to achieving. And while we do form plans of action to achieve goals, these are usually fairly high level and change as we go, adapting to unforeseen situations.
The BDI computational model is a program of the type that provides a plan of action for handling goal when the context condition holds. The plan is an abstract recipe written by a programmer and prescribes a course of action for achieving the goal . Several such plans might be supplied by the programmer, for achieving the same goal but in different situations, captured by different context conditions. The plan could be composed of a sequence of complex tasks, or sub-goals, that may invoke other sub-plans to achieve them, in a hierarchical fashion.

Figure 2 shows the BDI goal-plan tree that we assign to each archetype person. Note that this behaviour is applied to every individual in the population irrespective of its archetype. This is because while Strahan et al.’s archetypes [20] are useful for understanding behaviour leading up to the decision to leave, they tell us little about what people will do once on the road. For this we rely on expert knowledge and accounts from reports and research papers. The goals and plans shown in Figure 2 are the final result of an iterative process of co-development with experts. The goal-plan tree captures sufficient variability in the behaviour of the population in a compact representation as shown in Table 7.
| Id | Initial response | Final response |
|---|---|---|
| A1 | Has no dependants and goes home to prepare | Leaves from home |
| A2 | Goes home first, then collects dependants, then goes back home to wait | Leaves from home with dependants |
| A3 | Attends to dependants and stays there | Leaves from dependants location |
| A4 | Collects dependants then goes home | Leaves from home with dependants |
| A5 | Has no dependants and continues with activity | Stops activity and leaves |
| A6 | Goes home first, then collects dependants, and waits there | Leaves from dependants location |
The goal-plan tree contains three high level goals InitialResp, FinalResp, and Response that are triggered depending on whether the internal anxiety barometer of the individual crosses the initial threshold ThresholdInitial, or final threshold ThresholdFinal, or both together, given observations and their values (see Table 3).
The way the values of external stimuli are combined to calculate an individual’s internal anxiety barometer is as follows. Over the course of the simulation, as an agent becomes aware of the unfolding bushfire situation, only the highest value of any environmental observation (Visible* attitudes in Table 3) is kept. Similarly for emergency messages (remaining rows of Table 3), only the highest value of any received messages is maintained. The individual’s anxiety barometer value is then given by the sum of these two values at any given time.
During the initial response, people who have dependants will always go and attend to them, but the behaviour is slightly different depending on whether their current location is closer to the dependants (plan DepsNear) or home (plan DepsFar). If closer to dependants, they always attend to them, and then optionally go home afterwards. If closer to home, they go home first (goal Go(h)) then to dependants (goal Go(d)), and then again optionally back home. If on the other hand they do not have dependants (plan NoDeps), they either go home or continue doing what they are doing.
The final response is always to either stay and defend the residence, or leave. In the model, those with dependants will always leave, but some others with higher thresholds of response–such as Experienced Independent types–are more likely to stay. The leaving behaviour realised by the Leave plan is in itself non-trivial, since things can go wrong along the way, such as if the person leaving gets stuck in traffic congestion or comes across an accident or road closure (all possibilities in the simulation model). In such cases, the evacuating agent will try re-routing to find an alternative path to the evacuation destination e up to three times 141414Anecdotal accounts by some field researchers who conducted post-bushfire interviews with residents who had survived major bushfires in Australia over the period 2009-2014 [49] suggested that residents who had self-evacuated in vehicles tended to make up to three thwarted attempts to drive to their initially chosen destination before abandoning that goal and deciding to drive to another presumed place of safety., before giving up, and trying for an alternative “in-vac” location i within the region that it might consider safe. If that also fails for similar reasons, then it tries to go to its home location h, failing which it stops, and is counted in the list of stranded persons in the final statistics calculated from the simulation outputs.
3.8 Putting it all together
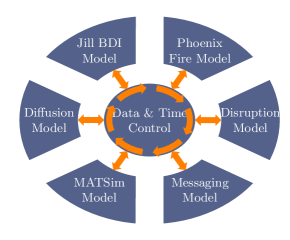
The final simulation model is realised in the Emergency Evacuation Simulator as shown in Figure 3 and has the following components.
MATSim Model: Contains the MATSim [10] 151515https://github.com/matsim-org/matsim traffic model including the road network derived from OpenStreetMap 161616https://www.openstreetmap.org, and the driving agents representing the population of the region in consideration.
Jill BDI Model: Contains the “brains” of the archetypes agents implemented as BDI agents in the Jill system 171717https://github.com/agentsoz/jill as per the description in Section 3.7. The “bodies” of these agents are the driving agents within the MATSim Model, with the two coupled together using the BDI-ABM framework [25].
Phoenix Fire Model: Reads the outputs of the Phoenix RapidFire simulator (available as a time-varying polygon shape saved in geojson format), and injects these at the appropriate times into the simulation. The shapes are received by the MATSim Model that then dynamically adjusts the penalty on the affected road links such that vehicles subsequently routing through the network will tend to avoid the fire-affected area.
Disruption Model: Injects user-specified road disruptions–such as road closures that restrict access, or accidents that constrict traffic flow–at specified times into the simulation. Information includes the start and end time of the disruption, the affected road network links, and the impact in terms of percentage reduction in traffic flow. The information is received by the MATSim Model that dynamically adjusts the network accordingly so that vehicles subsequently routing will notice the change.
Diffusion Model: Responsible for modelling the diffusion of information–such as about the location of the fire or road blockages–through a social network using standard information diffusion schemes (not covered here). Social messages are sent and received by the BDI agents residing in Jill BDI Model.
Messaging Model: Injects the proposed evacuation plan into the simulation, which is effectively a series of messages over time sent by the emergency services. Each message has a type–one of Advice, WatchAndAct, EmergencyWarning, or EvacuateNow, some content which may be interpreted by the receiving agents in some way, and the SA1 zones (see Figure 4) to send the message to. The value of a message will differ between persons of different archetypes as per Table 3. Within persons of the same archetypes, response to the same message will also differ due to differences in their risk averseness determined by ThresholdInitial (see Section 3.7).
Data & Time Control is the controller that contains the simulation loop and is responsible for progressing simulation time, calling the components once in each time step, and managing the data sharing between components. The data and control scheme is not dislike that prescribed by the HLA [50] standard, although, unlike HLA, multiple models can represent aspects of the same conceptual agents at the same time as supported by the BDI-ABM integrated framework [25].
4 Evaluation
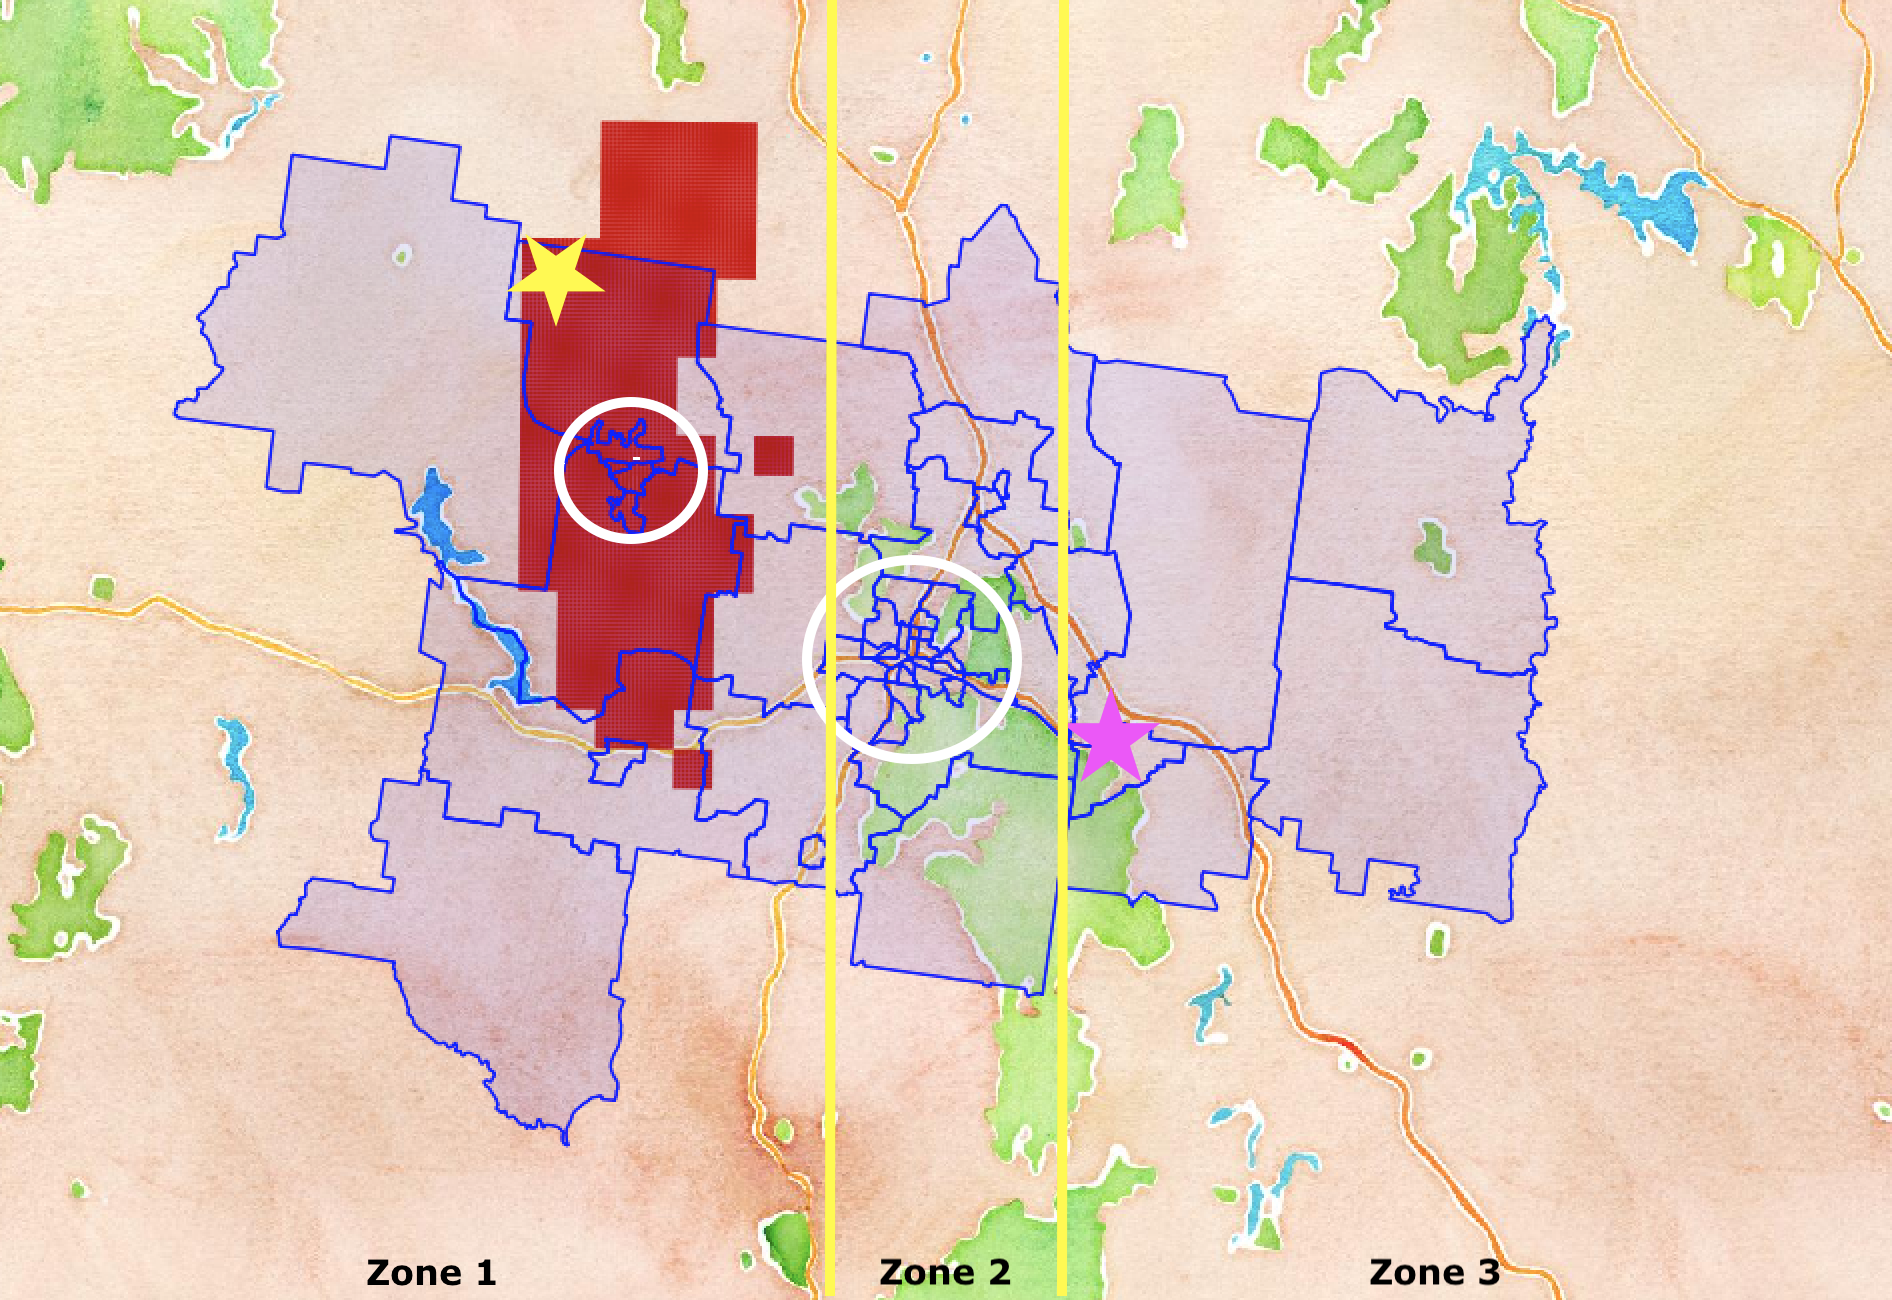
We applied the method of Section 3 to build a bushfire evacuation simulation for the Castlemaine region181818By Castlemaine region, we mean strictly the combined SA2 areas of Castlemaine and Castlemaine Region in the ABS 2016 census. shown in Figure 4. The region lies 120 km north-west of Melbourne, Australia, and constitutes a census (2016) population of 16,623 persons.191919As per data downloaded using ABS TableBuilder. The synthetic population created for Castlemaine region (as per Section 3.2) resulted in 16,489 unique individuals, to whom we assigned the archetypes (as per Section 3.3).
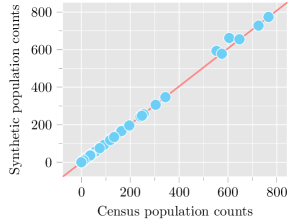
The evaluation showed that the synthetic populations of the two SA2s are very similar to the corresponding census distributions. At person-level, both SA2s produced p-values close to 1.0 for the FT test. Thus, none of them can be concluded dissimilar by rejecting the null hypothesis at the 0.05 significance level. For the SAE test, Castlemaine and Castlemaine Region SA2s received 0.004 and 0.007, respectively, indicating that the errors are very small. Figure 5 compares the generated and census person-level distributions of the two SA2s. Each dot represents a person-type, and it falls right on the identity () line if the number of persons in the census (represented by axis) and generated (represented by axis) populations match perfectly. The plots show that all the person-types are generally very close to the identity line, indicating that generated and census distributions match reasonably well. Here, we do not discuss household-level distribution in detail as the Algorithm 1 ensures that the generated population is a perfect match to the census household-level distributions.
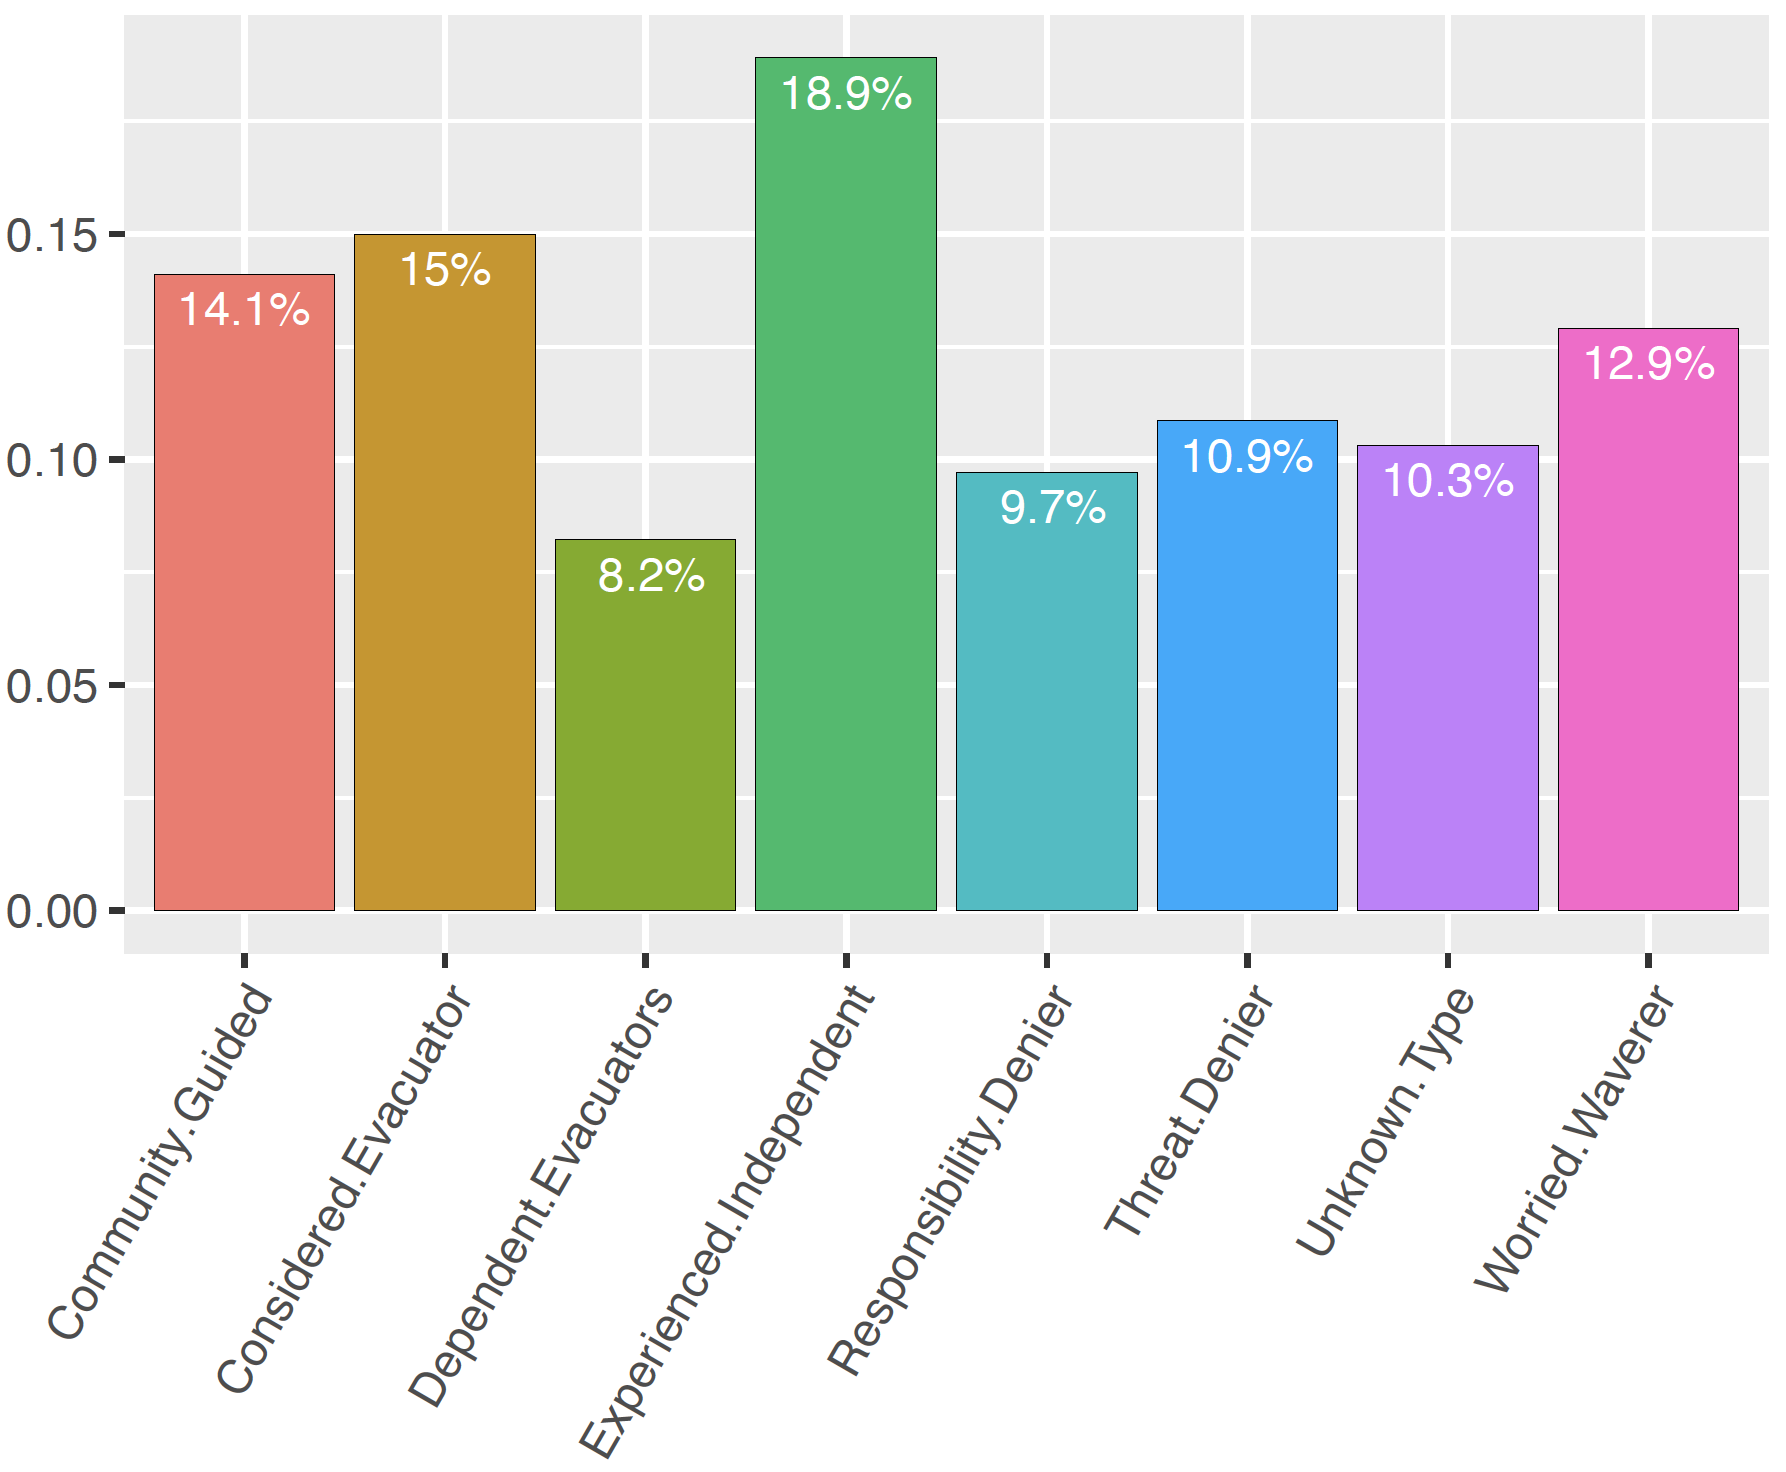
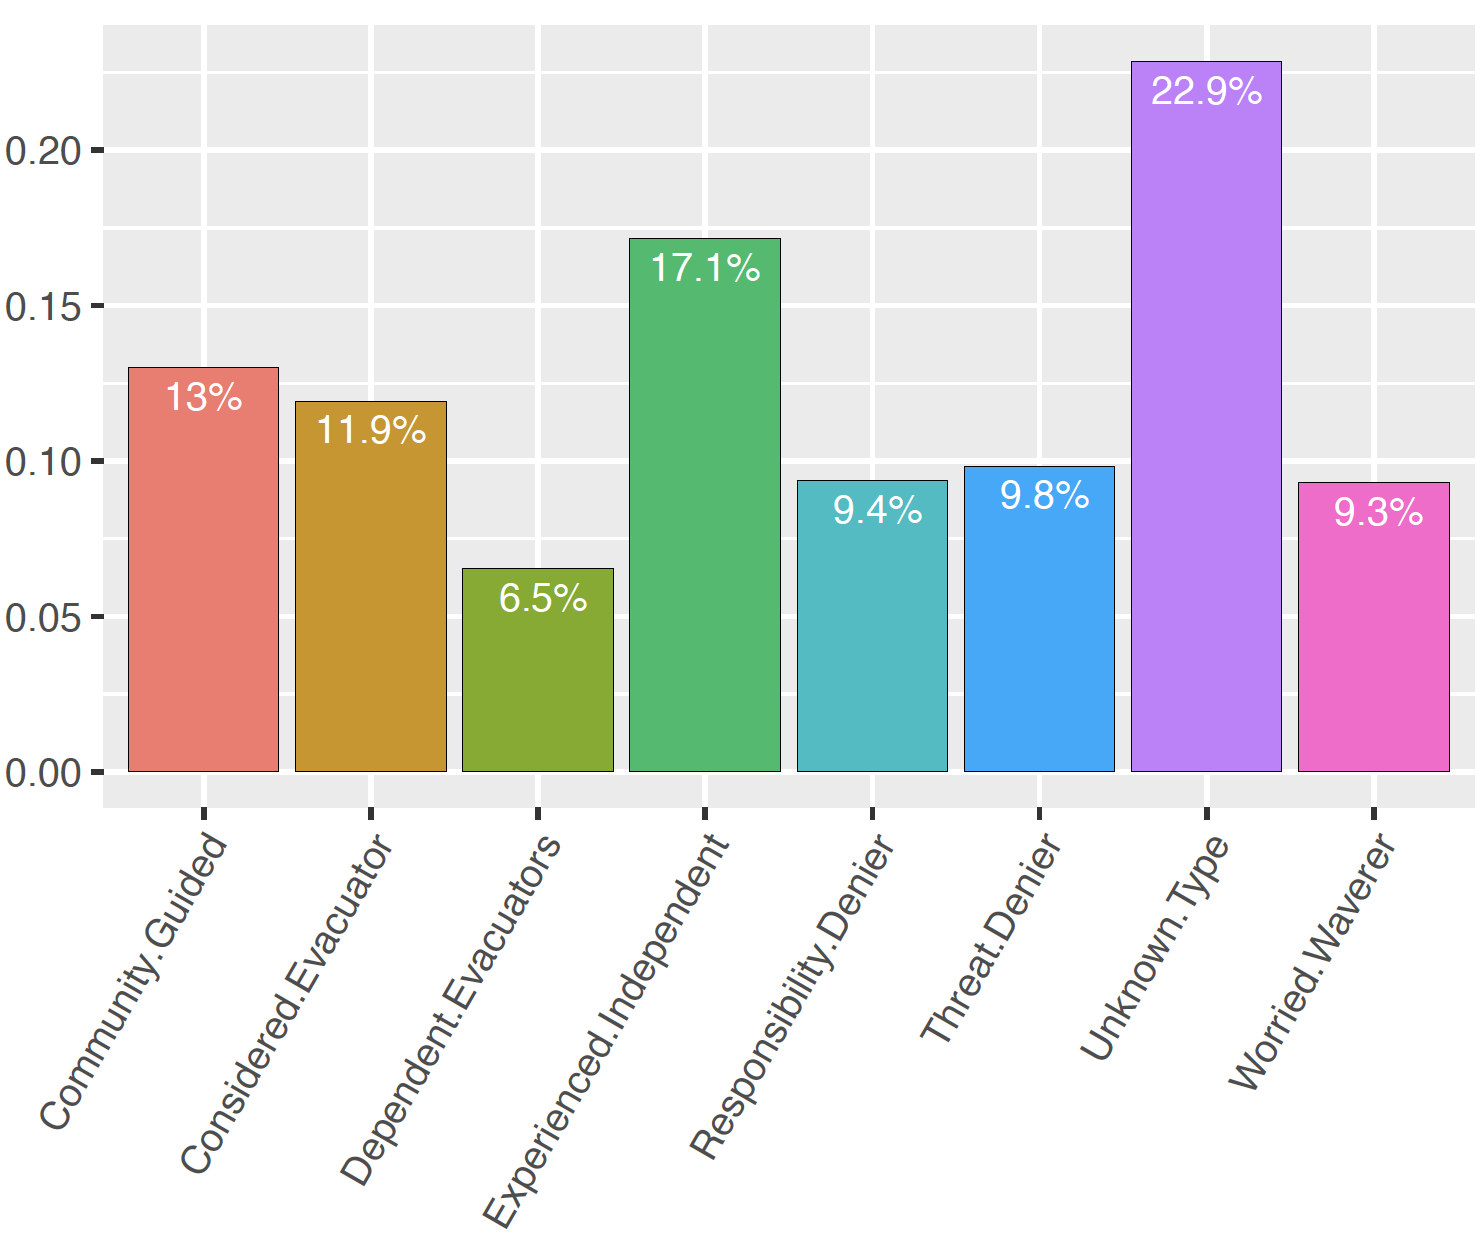
Figure 6 shows the makeup of the created population with respect to the different archetypes, compared against Strahan et al.’s [20] original data. The Unknown Type category includes individuals over 18 years of age for which the archetypes are unknown (see Section 3.1). Evidently the archetypal makeup of Castlemaine region is a prediction, purely based on the demographic profile of the population of the region compared to the demographic profile of Strahan et al.’s [20] original cohort of individuals from the Perth and Adelaide Hills. The natural question to ask then is, how true is this prediction? To verify this, we are currently analysing a new data set of post-season telephone surveys conducted by Strahan for the larger Bendigo SA4 area202020The Castlemaine region represents 2 of the 16 SA2s that constitute Bendigo SA4.. Our process is to construct the full synthetic population of Bendigo SA4, analyse its archetypal makeup (prediction), and compare it to the archetypal makeup of Bendigo SA4 as derived from the post-season survey samples (actual). This exercise is work in progress and is not reported here. The perceived outcome here is a (potentially revised) robust prediction model of the archetypal makeup of new communities.
For simulation purposes, we removed all the individuals from the Castlemaine region synthetic population that did not have an archetype assigned, which included children under the age of 18212121Under 18s are not part of Strahan et al.’s [20] original data and therefore cannot be assigned an archetype., any Unknown Type individuals that did not match the demographic signature of known archetypes (see Section 3.3), and Dependent Evacuator individuals who do not drive and depend on others to evacuate them to safety. Dependent children and Dependent Evacuator individuals were instead accounted for by assigning them as dependants of other individuals in the population (as per Section 3.6), so that they get attended to during the initial response of those individuals to the bushfire (as per Section 3.7). The final synthetic population used in the simulation contained 10,868 archetype individuals.
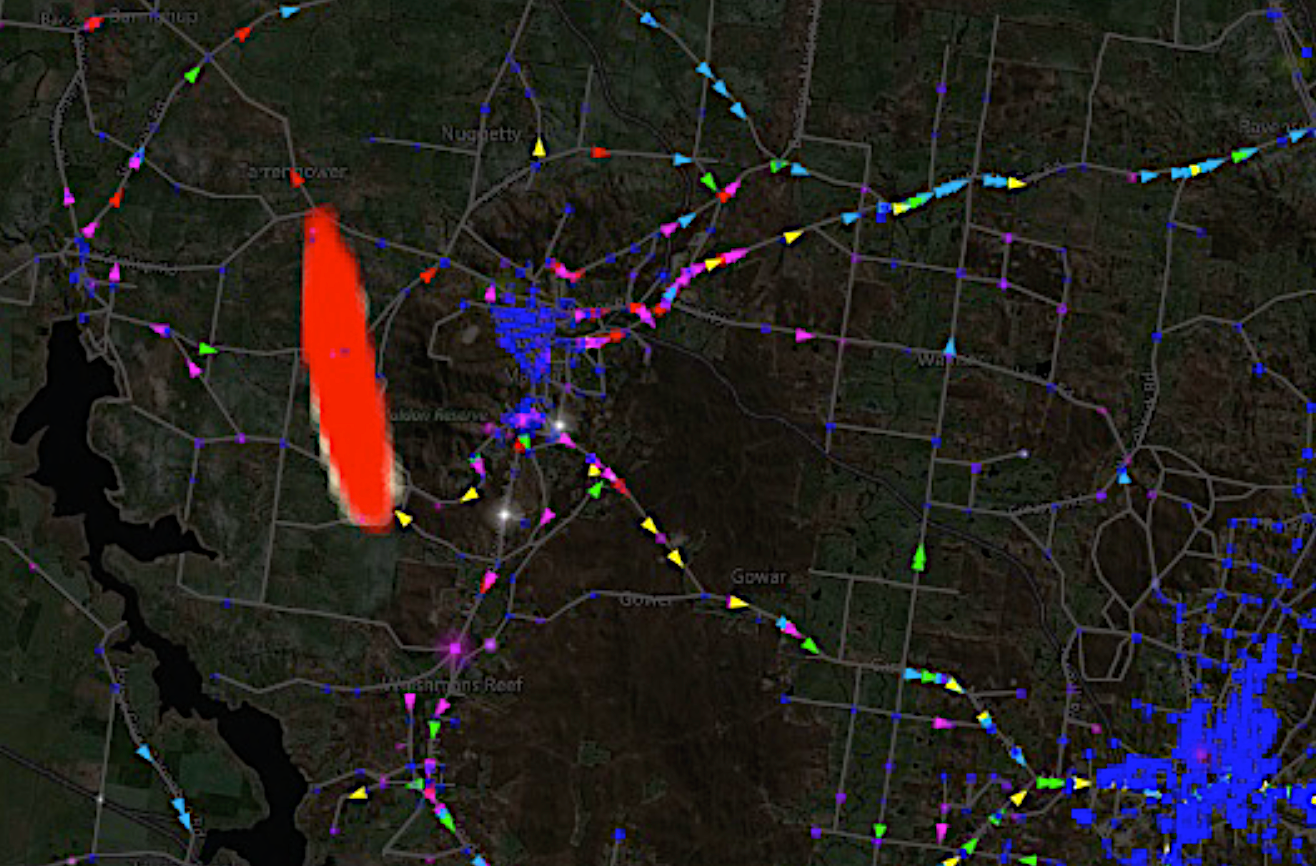
Figure 7 shows a snapshot of the modelled bushfire evacuation scenario for Castlemaine region. In this scenario, a catastrophic fire222222Modelled in Phoenix RapidFire [7] for weather conditions comparable to a Code Red day, i.e., a Forest Fire Danger Index [51] of 100. has started to the northwest of Maldon at 11am that eventually engulfs the town by 5pm (cf. Figure 4). Based on discussions with emergency services, the emergency messages regime chosen for this situation is as shown in Table 8.
| Message | Time sent | Region sent to (Figure 4) |
|---|---|---|
| Advice | 1100 hrs | Zone1 (western region) |
| WatchAndAct | 1200 hrs | Zone1 (western region) |
| EmergencyWarning | 1230 hrs | Zone1 (western region) |
| EvacuateNow | 1300 hrs | Zone1 (western region) |
| Advice | 1330 hrs | Zone2 (inner region) |
| EmergencyWarning | 1500 hrs | Zone2a (SW part of Castlemaine circle) |
| WatchAndAct | 1600 hrs | Zone2 (inner region) |
Since data sources on the actual movements of people in bushfires are not readily available, it is difficult to validate the trajectories of vehicles observed in the simulation. However, since the 2009 Black Saturday fires in Victoria, significant work has been conducted in surveys of affected people, and it is much easier to find anecdotal accounts of what people did in such situations when on the road [52, 13, 15, 21, 53]. Our process for calibrating and validating the simulation model has therefore been one of randomly sampling individuals and visually inspecting their trip chains and routes in MATSim (Figure 7) together with the output log of their BDI reasoning that shows when they chose to do what and for what purpose. This allows us to build virtual anecdotal accounts of these individuals, not too dissimilar from those constructed from post-event surveys of real individuals. These virtual accounts were then compared to Strahan et al.’s [20] understanding of how those archetypal individuals are likely to behave. If we found a discrepancy, we revisited the BDI behaviour model (Section 3.7) or attitudes assignment (Section 3.4) and made adjustments as necessary. We stopped when our random sampling no longer produced virtual accounts that were inconsistent with our understanding of the archetypes.
Archetypes behaved in the virtual accounts, at a macro level, as the researchers and domain experts consulted had expected. For example, Considered Evacuator agents tended to act early in the bushfire event, responding to warnings from the emergency services and their own assessment of the immediacy of the threat based on ember and flame cues. Considered Evacuator and Community Guided represented many individuals who acted early by picking up dependants (if they had them) and deciding to return home or driving directly to an evacuation centre. They appeared in the simulation visualisation as streams of yellow (Considered Evacuator) and green (Community Guided) agents moving away from the fire front toward the evacuation centre in the first few hours of the event. On the other hand, few Experienced Independent or Threat Denier agents appeared on the roads early in the event. They stayed to defend or refused to see the fire as a threat. They were expected not to respond to warnings and to leave at the last minute when either their defensive efforts failed or when the threat became too immediate to continue to deny. Experienced Independent agents did not begin to move until later in the fire and Threat Denier even later when a wind change moved the fire front and blew embers over them substantially heightening the level and immediacy of the threat.
The manual inspection of select individual trip chains and associated decision making supported the observations of archetypal evacuation behaviour at the micro level. For example, a Considered Evacuator agent left very early in the fire event, to pick up a dependent, then returned home (perhaps to pick up other family members, a pet or personal belongings) before leaving again almost immediately for the evacuation centre. Other agents representing various archetypes, located above the fire, with it moving away from them, did not receive warnings and until a wind change moved embers and flames in their direction, remained at their residences. Some of these were Considered Evacuator and Community Guided types who tend to leave early. Such delayed evacuation for these types reflects what might be expected in reality when there is no official warning, as they carefully monitor the fire, assess its likely impact and respond to the conditions and increasing threat created by the change in wind direction, blowing the fire toward them.
Some individual trip chains highlighted areas in which further work on the model is required. For example, a Responsibility Denier acting consistent with their view that others should take responsibility for dealing with the fire did not respond until warnings had escalated to the highest levels. Only at that point did they decide to act, proceeding to pick up a dependent who was incidentally located within the fire zone and then returning home. This behaviour was deemed unlikely since the knowledge of dependants in the danger zone should have triggered a decision to pick them up early not late. Another unlikely behaviour was when an agent who had no dependants chose to go home to ‘wait and see’, however their house was located close to the fire zone. In this case the individual should either have waited where they originally were or evacuated immediately which would both have been safer options. These kinds of specific accounts give useful insight into our own understanding of behaviours that may have been oversimplified, overlooked, or misunderstood, and can be addressed through further refinement of the model.
Overall, unlikely behaviours were not sufficiently widespread to warrant further revision of the model. On the whole the model exhibited a variety of known evacuation behaviours, including: agents initially going to pick up dependants, (visiting or not their homes in the process); waiting to see how the situation unfolded (at locations where they initially were, or at home, or at the dependants location); and eventually evacuating (via their homes if deemed necessary) to the recommended evacuation location outside the region (but falling back to a preferred within-region location or their home location if the attempt to evacuate the region failed due to roads being cut off by the fire or heavy congestion on evacuation routes).
Our early findings indicate that Strahan et al.’s [20] archetypes are robust and hold well across communities. Were this the case, predictions such as those in Figure 6 can already be very valuable for the community. For instance, in the Castlemaine region, a community education program could be tailored specifically for the predicted large cohort of Experienced Independent individuals who are likely to stay and defend their property at an increased risk to their lives. Videos of simulation runs against a range of weather and bushfire conditions can help to inform communities of potential gaps in their understanding of bushfire risk to them. For instance, in the simulation run shown in Figure 7 we saw a late out flux of people from Maldon around 5pm when, due to a wind change, the bushfire started to encroach on the town. On inspection we found that many of those who left late from Maldon were Experienced Independent individuals.
In our current work in the Castlemaine region, we are exploring–together with the communities and emergency services–how the use of this evacuation modelling technology can help with community planning and preparedness.
5 Discussion and Conclusion
In this paper we showed how Strahan et al.’s [20] archetypes have been used to build a behaviour model that captures the kinds of attitudes seen in communities in the event of major bushfires. The model combines the fire progression output–a time-varying fire front–generated from the Phoenix RapidFire model used currently by the emergency services to predict fire behaviour, with the MATSim traffic simulator and a BDI-based behaviour model to simulate movements of the population of a region in response to that fire. The outputs of the simulation including visualisations of traffic are used by the emergency services to improve understanding of community risks and to improve planning and preparedness. The system is initially being trialled in Mount Alexander Shire, Surf Coast Shire, Colac Otway Shire, and Yarra Ranges Shire that together constitute an area of 9,000 km2.
While there have been several efforts since the 2009 Black Saturday fires to understand the decision making of residents in terms of whether they will stay and defend or leave [13, 15, 21, 53], data on what actually happens during the process of evacuation is scarce. This is because data collection–such as of movements–during an unfolding bushfire event, is made difficult by the nature of the emergency. As such, understanding of behaviours during evacuations has to date been limited to post-event surveys and accounts [54, 55, 56, 49].
Our approach to modelling evacuation behaviour has been one of collaboration with bushfire experts and emergency services personnel eliciting knowledge from their lived experience as well as from existing reports and research papers. It is worth mentioning that the notion of “validating” such a model is already elusive. For what does it mean to say that a computer model of human behaviour–one that if not random is inherently tied in rationality–for life-threatening emergencies where high levels of anxiety can distort rational thinking, has been validated to be correct? Even if one could make the claim, how is one to convince others of it? This has indeed been our own experience of several years. What has consistently worked however, is a process of co-creation and iterative refinement of such a model with domain experts. Key in this has been to ensure that the model exhibits in sufficient detail the diversity of behaviour seen in actual bushfires, while still being general enough to be applied to different regions. Importantly the process has led to stakeholders understanding and owning the model’s assumptions, limitations, and approximations, which have come about after robust discussions between experts with potentially differing view points. The result is a model that is informally validated in the sense that it is consistent with the understanding of the various experts and exhibits the kinds of behaviour traces that match anecdotal accounts from survivors. What adds some sense of trust in the use of such a model for decision making is the fact that behaviour parameters can be varied over ranges of values (where calibration is not possible), such that the results can be intuitively interpreted as likely, best, or worst case outcomes.
Our current work is focusing on improving the answer to “what are they doing at the time of the bushfire?” (see discussion of issues in Section 3.6), given that evacuation outcomes are sensitive to locations of agents. It seems unlikely that the solution will be an algorithm that generates these populations on demand even if such an algorithm is conceivable, since the use of any population requires careful thought and consideration of the underlying assumptions. What seems more likely is that libraries of populations–such as for weekdays, weekends, and special events–will be built, critiqued, and approved for operational use.
A remaining big challenge is to move from individuals to households. Even though we already have the model of household structures now (see Section 3.2), the big unknown is our understanding of the dynamics of interactions between household members. For instance, how are tasks like picking up dependants and going home to collect items shared between household members, given their locations and available resources (cars per household)? What does decision making look like for a household where one member is a Threat Denier and another a Worried Waverer? We intend to begin analysing post-season telephone surveys in Victoria conducted by Strahan over the past two years ( to date) where a subset of interviews are also household members. This will be a start at gaining understanding of the dynamics of archetypal households.
6 Acknowledgements
We thank (in alphabetical order) Country Fire Authority (CFA), Commonwealth Scientific and Industrial Research Organisation (CSIRO) Data 61, Emergency Management Victoria (EMV), Department of Environment, Land, Water and Planning (DELWP), Department of Premier and Cabinet Victoria (DPC), Mount Alexander Shire Council, RMIT University. Safer Together program, Surf Coast Shire Council, VicRoads, Victoria Police, and Yarra Ranges Shire Council for ongoing support for the bushfire evacuation modelling project. We thank (in alphabetical order) Jason Amos (Mount Alexander Shire Council), Peter Ashton (Surf Coast Shire Council), Raphaele Blanchi (CSIRO), Chaminda Bulumulla (RMIT University), Steve Cameron (EMV), Trevor Dess (DELWP), Callum Fairnie (Colac Otway Shire Council), Tim Gazzard (DELWP), Justin Halliday (DPC), Vincent Lemiale (CSIRO Data61), Leorey Marquez (CSIRO Data61), John Gilbert (CFA), Kai Nagel (TU Berlin), Lin Padgham (RMIT University), Mahesh Prakash (CSIRO Data61), Luke Ryan (Mount Alexander Shire Council), Rajesh Subramanian (CSIRO Data61), and for their immensely valuable contributions to the work presented in this paper.
Appendix A Castlemaine region simulation video
A video of the Castlemaine region simulation of Section 4 is available at https://cloudstor.aarnet.edu.au/plus/s/sG6VjNSmHGjHB3c.
Appendix B Summary of data sources and tools used
| Task | Data Sources and Tools |
| 3.1 Estimating the likelihood of archetypes | Strahan et al’s. [20] raw data was used to estimate the likelihood of archetypes; this data however has not been made publicly available at this stage due to privacy contraints. |
| 3.2 Synthesising the population for a region (Algorithm 1) | The synthetic population was produced using the algorithm available from https://github.com/agentsoz/synthetic-population; the input 2016 census data was sourced from Australian Bureau of Statistics and available from https://abs.gov.au/census. |
| 3.3 Assigning archetypes to the population (Algorithm 2), 3.4 Assigning attitudes to archetypes, 3.5 Calibrating attitudes of archetypes (Algorithm 3) | All R code and related scripts used for these tasks are available from https://bitbucket.org/dhixsingh/archetypes-modelling, however the repository has currently not been made public to preserve privacy of Strahan et al’s. [20] raw data. |
| 3.6 Assigning activities to the population | Expert opinion based activities assignment algorithm used for Surf Coast Shire is available from https://github.com/agentsoz/ees-synthetic-population (though not used here); Address Mapper algorithm for home locations assignment for the Castlemaine region simulation is available from https://github.com/agentsoz/synthetic-population, where the legal street addresses for the region were sourced from LandVic and available from http://services.land.vic.gov.au/landchannel/content/productCaalogue. |
| 3.7 Assigning behaviours to the population | The evacuation behaviour model that determines what agents do once they decide to evacuate is written in the Jill BDI language available at https://github.com/agentsoz/jill. |
| 3.8 Putting it all together | The road network was extracted from OpenStreetMap at https://www.openstreetmap.org, bushfire progression model outputs from Phoenix RapidFire were provided by Department of Environment, Land, Water and Planning (DELWP), the full Emergency Evacuation Simulator (EES) model and Castlemaine region scenario are available from https://github.com/agentsoz/ees, with the various components being the BDI-ABM integration framework from https://github.com/agentsoz/bdi-abm-integration, the MATSim traffic simulator from https://github.com/matsim-org/matsim, and the social information diffusion model from https://github.com/agentsoz/diffusion-model. |
References
- [1] Fantina Tedim, Vittorio Leone, Malik Amraoui, Christophe Bouillon, Michael Coughlan, Giuseppe Delogu, Paulo Fernandes, Carmen Ferreira, Sarah McCaffrey, Tara McGee, Joana Parente, Douglas Paton, Mário Pereira, Luís Ribeiro, Domingos Viegas, and Gavriil Xanthopoulos. Defining Extreme Wildfire Events: Difficulties, Challenges, and Impacts. Fire, 1(1):9, February 2018. 00036.
- [2] Raphaele Blanchi, Justin Leonard, Katharine Haynes, Kimberley Opie, Melissa James, and Felipe Dimer de Oliveira. Environmental circumstances surrounding bushfire fatalities in Australia 1901–2011. Environmental Science & Policy, 37:192–203, March 2014. 00087.
- [3] Raphaele Blanchi, Joshua Whittaker, Katharine Haynes, Justin Leonard, and Kimberley Opie. Surviving bushfire: the role of shelters and sheltering practices during the Black Saturday bushfires. Environmental Science & Policy, 81:86–94, March 2018. 00007.
- [4] Thomas J. Cova, Frank A. Drews, Laura K. Siebeneck, and Adrian Musters. Protective Actions in Wildfires: Evacuate or Shelter-in-Place? Natural Hazards Review, 10(4):151–162, November 2009. 00067.
- [5] R. Lovreglio, E. Kuligowski, S. Gwynne, and K. Strahan. A modelling framework for householder decision-making for wildfire emergencies. International Journal of Disaster Risk Reduction, page 101274, August 2019. 00001.
- [6] Jim McLennan, Barbara Ryan, Chris Bearman, and Keith Toh. Should We Leave Now? Behavioral Factors in Evacuation Under Wildfire Threat. Fire Technology, 55(2):487–516, March 2019. 00011.
- [7] Kevin G Tolhurst and Derek M Chong. Assessing potential house losses using PHOENIX RapidFire. In Proceedings of Bushfire CRC & AFAC 2011 Conference Science Day, volume 1, pages 74–76, 2011. 00011.
- [8] Claire Miller, James Hilton, Andrew Sullivan, and Mahesh Prakash. SPARK – A Bushfire Spread Prediction Tool. In Ralf Denzer, Robert M. Argent, Gerald Schimak, and Jiří Hřebíček, editors, Environmental Software Systems. Infrastructures, Services and Applications, volume 448, pages 262–271. Springer International Publishing, Cham, 2015. 00000.
- [9] Dhirendra Singh and Lin Padgham. Emergency Evacuation Simulator (EES) - a Tool for Planning Community Evacuations in Australia. In Proceedings of the Twenty-Sixth International Joint Conference on Artificial Intelligence, pages 5249–5251, Melbourne, Australia, August 2017. International Joint Conferences on Artificial Intelligence Organization. 00000.
- [10] Lin Padgham and Dhirendra Singh. Making MATSim Agents Smarter with the Belief-Desire-Intention Framework. In Andreas Horni, Kai Nagel, and Kay W. Axhausen, editors, The Multi-Agent Transport Simulation MATSim, pages 201–210. Ubiquity Press, August 2016. 00000.
- [11] Carole Adam, Geoffrey Danet, John Thangarajah, and Julie Dugdale. BDI Modelling and Simulation of Human Behaviours in Bushfires. In Paloma Díaz, Narjès Bellamine Ben Saoud, Julie Dugdale, and Chihab Hanachi, editors, Information Systems for Crisis Response and Management in Mediterranean Countries, volume 265, pages 47–61. Springer International Publishing, Cham, 2016. 00000.
- [12] F. Russo and G. Chilà. Integrated travel demand models for evacuations: a bridge between social science and engineering. International Journal of Safety and Security Engineering, 4(1):19–37, March 2014. 00008.
- [13] Jim McLennan, Sean Cowlishaw, Douglas Paton, Ruth Beatson, and Glenn Elliott. Predictors of south-eastern Australian householders’ strengths of intentions to self-evacuate if a wildfire threatens: two theoretical models. International Journal of Wildland Fire, 23(8):1176, 2014. 00020.
- [14] James McLennan and Glenn Elliott. Wait and see’: the elephant in the community bushfire safety room. In Proceedings of the Bushfire CRC & AFAC 2012 conference research forum, volume 28, pages 56–69, 2012. 00019.
- [15] Jim McLennan, Glenn Elliott, and Mary Omodei. Householder decision-making under imminent wildfire threat: stay and defend or leave? International Journal of Wildland Fire, 21(7):915, 2012. 00043.
- [16] Lauren H. Folk, Erica D. Kuligowski, Steven M. V. Gwynne, and John A. Gales. A Provisional Conceptual Model of Human Behavior in Response to Wildland-Urban Interface Fires. Fire Technology, March 2019. 00002.
- [17] Vinayak V. Dixit, Chester Wilmot, and Brian Wolshon. Modeling Risk Attitudes in Evacuation Departure Choices. Transportation Research Record, 2312(1):159–163, January 2012. 00043.
- [18] Enrico Ronchi, Steven Gwynne, Guillermo Rein, Rahul Wadhwani, Paolo Intini, and Albin Bergstedt. e-Sanctuary: Open Multi-Physics Framework for Modelling Wildfire Urban Evacuation. Fire Protection Research Foundation Report, December 2017. 00012.
- [19] Sameera Abar, Georgios K. Theodoropoulos, Pierre Lemarinier, and Gregory M.P. O’Hare. Agent Based Modelling and Simulation tools: A review of the state-of-art software. Computer Science Review, 24:13–33, May 2017. 00122.
- [20] Ken Strahan, Joshua Whittaker, and John Handmer. Self-evacuation archetypes in Australian bushfire. International Journal of Disaster Risk Reduction, 27:307–316, March 2018. 00007.
- [21] Kenneth William Strahan, Joshua Whittaker, and John Handmer. Predicting self-evacuation in Australian bushfire. Environmental Hazards, 18(2):146–172, March 2019. 00003.
- [22] Anand S. Rao and Michael P. Georgeff. Modeling Rational Agents within a BDI-Architecture. In Proceedings of the Second International Conference on Principles of Knowledge Representation and Reasoning, pages 473–484. Morgan Kaufmann Publishers Inc., 1991. 03388.
- [23] Philip R. Cohen and Hector J. Levesque. Intention is choice with commitment. Artificial Intelligence, 42(2-3):213–261, March 1990. 02913.
- [24] Andreas Horni, Kai Nagel, and Kay W. Axhausen. The Multi-Agent Transport Simulation MATSim. Ubiquity Press, August 2016. 00359.
- [25] Dhirendra Singh, Lin Padgham, and Brian Logan. Integrating BDI agents with Agent-based simulation platforms. Autonomous Agents and Multi-Agent Systems, pages 1–22, March 2016. 00020.
- [26] C. G. Jung. The Archetypes and the Collective Unconscious. Routledge, 1968. 00088.
- [27] Joseph Campbell and Bill Moyers. The Power of Myth. Doubleday, 1988.
- [28] Maurice Halbwachs. On collective memory. University of Chicago Press, 1992. 11063.
- [29] Michael K. Lindell and Ronald W. Perry. The Protective Action Decision Model: Theoretical Modifications and Additional Evidence: The Protective Action Decision Model. Risk Analysis, 32(4):616–632, April 2012. 00568.
- [30] Ken Strahan and Stuart J. Watson. The protective action decision model: when householders choose their protective response to wildfire. Journal of Risk Research, pages 1–22, November 2018. 00000.
- [31] Xin Ye, Karthik Konduri, Ram M Pendyala, Bhargava Sana, and Paul Waddell. A methodology to match distributions of both household and person attributes in the generation of synthetic populations. 88th Annual Meeting of the Transportation Research Board, 9600:24, 2009. 00141.
- [32] W. Edwards Deming and Frederick F. Stephan. On a Least Squares Adjustment of a Sampled Frequency Table When the Expected Marginal Totals are Known. The Annals of Mathematical Statistics, 11(4):427–444, 1940. 01689.
- [33] Stephen E. Fienberg. An Iterative Procedure for Estimation in Contingency Tables. The Annals of Mathematical Statistics, 41(3):907–917, June 1970. 00397.
- [34] Bhagya Wickramasinghe. Heuristic Based Population Synthesis Using Different Data Sources, June 2018. 00000.
- [35] Nam Huynh, Johan Barthelemy, and Pascal Perez. A Heuristic Combinatorial Optimisation Approach to Synthesising a Population for Agent Based Modelling Purposes. Journal of Artificial Societies and Social Simulation, 19(4), 2016.
- [36] Murray F Freeman and John W Tukey. Transformations Related to the Angular and the Square Root. The Annals of Mathematical Statistics, 21(4):607–611, 1950.
- [37] David Voas and Paul Williamson. Evaluating Goodness-of-Fit Measures for Synthetic Microdata. Geographical and Environmental Modelling, 5(2):177–200, 2001.
- [38] Robin Lovelace, Dimitris Ballas, M.H. Birkin, and Eveline van Leeuwen. Evaluating the performance of Iterative Proportional Fitting for spatial microsimulation: new tests for an established technique. Journal of Artificial Societies and Social Simulation, 18(2):21, 2015.
- [39] Joe Castiglione, Mark Bradley, and John Gliebe. Activity-Based Travel Demand Models: A Primer. Number S2-C46-RR-1 in SHRP 2 Report. Transportation Research Board, 2015. 00058.
- [40] Infrastrucure Victoria, KPMG, and ARUP. Model Calibration and Validation Report: Melbourne Activity-Based Model. Final Report, Infrastructure Victoria, December 2018. 00000.
- [41] Joel Robertson. Modelling Bushfire Evacuation Behaviours. arXiv:1909.00991, page 84, September 2019. 00000 arXiv: 1909.00991.
- [42] James E. Anderson. The Gravity Model. Annual Review of Economics, 3(1):133–160, September 2011. 01060.
- [43] Michael Bratman. Intention, plans, and practical reason, volume 10. Harvard University Press Cambridge, MA, 1987. 06336.
- [44] Daniel Clement Dennett. The Intentional Stance. MIT Press, 1989. 00181.
- [45] Anand S Rao and Michael P Georgeff. BDI Agents: From Theory to Practice. In Proceedings of the First International Conference on Multiagent Systems (ICMAS), volume 95, pages 312–319. AAAI Press, 1995. 03924.
- [46] M. Winikoff. JACK intelligent agents: an industrial strength platform. Springer, 2005. 00291.
- [47] Rafael H. Bordini, Jomi Fred Hübner, and Michael Wooldridge. Programming Multi-Agent Systems in AgentSpeak Using Jason (Wiley Series in Agent Technology). John Wiley & Sons, Inc., USA, 2007. 00000.
- [48] Alexander Pokahr, Lars Braubach, Christopher Haubeck, and Jan Ladiges. Programming BDI Agents with Pure Java. In Proceedings of the 12th German Conference on Multiagent System Technologies, volume 8732 of MATES 2014, pages 216–233, New York, NY, USA, 2014. Springer-Verlag New York, Inc. 00026 event-place: Stuttgart, Germany.
- [49] Jim McLennan, Douglas Paton, and Lyndsey Wright. At-risk householders’ responses to potential and actual bushfire threat: An analysis of findings from seven Australian post-bushfire interview studies 2009–2014. International Journal of Disaster Risk Reduction, 12:319–327, June 2015. 00044.
- [50] Judith S. Dahmann, Frederick Kuhl, and Richard Weatherly. Standards for Simulation: As Simple As Possible But Not Simpler The High Level Architecture For Simulation. SIMULATION, 71(6):378–387, December 1998. 00132.
- [51] Andrew J Dowdy, Centre for Australian Weather and Climate Research, Australia, Bureau of Meteorology, and CSIRO (Australia). Australian fire weather as represented by the McArthur Forest Fire Danger Index and the Canadian Forest Fire Weather Index. Centre for Australian Weather and Climate Research, Melbourne, 2009. 00000 OCLC: 415889135.
- [52] Dr Raymond Matthews, Laura Haigh, and Drew Dawson. Capturing Community Experiences in the 2015 Sampson Flat Fire. Technical Report 2015.154, Bushfire and Natural Hazards CRC, December 2015. 00001.
- [53] Sarah McCaffrey, Robyn Wilson, and Avishek Konar. Should I Stay or Should I Go Now? Or Should I Wait and See? Influences on Wildfire Evacuation Decisions. Risk Analysis, 38(7):1390–1404, July 2018. 00014.
- [54] Joshua Whittaker, Katharine Haynes, John Handmer, and Jim McLennan. Community safety during the 2009 Australian ’Black Saturday’ bushfires: an analysis of household preparedness and response. International Journal of Wildland Fire, 22(6):841, 2013. 00100.
- [55] J Handmer, A Bedford, M Ladds, L Wright, J Whittaker, C Haynes, and B Towers. Human behaviour and community safety. Research results from February 7th Victorian bushfires–Final report. Retrieved from Melbourne, Victoria, 2011. 00002.
- [56] John Handmer and Saffron O’Neill. Examining bushfire policy in action: Preparedness and behaviour in the 2009 Black Saturday fires. Environmental Science & Policy, 63:55–62, September 2016. 00016.