Database Workload Characterization with Query Plan Encoders \vldbAuthorsDebjyoti Paul, Jie Cao, Feifei Li, Vivek Srikumar \vldbDOIhttps://doi.org/TBD
Database Workload Characterization with Query Plan Encoders
Abstract
Smart databases are adopting artificial intelligence (AI) technologies to achieve instance optimality, and in the future, databases will come with prepackaged AI models within their core components. The reason is that every database runs on different workloads, demands specific resources, and settings to achieve optimal performance. It prompts the necessity to understand workloads running in the system along with their features comprehensively, which we dub as workload characterization.
To address this workload characterization problem, we propose our query plan encoders that learn essential features and their correlations from query plans. Our pretrained encoders captures the structural and the computational performance of queries independently. We show that our pretrained encoders are adaptable to workloads that expedites the transfer learning process. We performed independent assessments of structural encoder and performance encoders with multiple downstream tasks. For the overall evaluation of our query plan encoders, we architect two downstream tasks (i) query latency prediction and (ii) query classification. These tasks show the importance of feature-based workload characterization. We also performed extensive experiments on individual encoders to verify the effectiveness of representation learning, and domain adaptability.
1 Introduction
Database Management Systems (DBMS) are general-purpose systems that aim to provide solutions to many applications as possible. Database designers expose many configuration settings to facilitate end-users in managing complex workloads efficiently. However, there is no single configuration that works for all workloads and finding the optimal configuration setting is very dependent on the workload characteristics.
In the usual process, DBAs first need to learn about the database queries that frequently run on their database system and then dig deeper to characterize these queries. It requires an in-depth knowledge and robust understanding of the queries and its execution features. It is a challenging as well as laborious task for DBAs to comprehend execution features of queries and its relations with configuration knobs. Furthermore, the large number of possible DBMS configurations settings makes it a daunting task for DBAs. Currently, advanced DBAs applies simple data mining techniques and hand-tweaked feature engineering to understand the nature of workload, but this requires domain expertise, which is rare.
Nowadays, many small to medium businesses (SMBs) manage their databases with cloud services. Cloud database service providers can now obtain and analyze large amounts of anonymized workload data. Managing database resources efficiently is indispensable for providing quality services. Each database instance runs a different workload. Applying data science can help in identifying workloads with similar characteristics, and then it can be used in downstream tasks e.g., query optimization, configuration recommendation and index recommendation. Essentially, it raises a requirement of database workload characterization, i.e., ability to describe distinctive nature and features of queries in a workload.
Previous work [27] shows with TPC-H benchmarks how each database query behaves differently with changes in database configuration settings. For example, query Q18 and query Q7 in TPC-H benchmark responds to knob changes shared_buffers vs. effective_cache_size very differently w.r.t. query latency. Each query possesses distinct features, and the demands for computational resources are also different. It suggests that each query needs to be treated uniquely and based on their characteristic. Recent research works [9, 10, 16] leverages query plans as the feature description of queries and use it for tasks like index recommendation [9, 10] and configuration knob tuning [16].
In natural language domain, a word is a structural and functional unit of a meaningful sentence. Similarly, in the database domain, if a query is the structural unit, then a database query plan is the functional unit of a workload. With the advancement in distributed representation of words, the downstream tasks like sentence similarity, question answering, and textual entailment have improved dramatically [20, 8, 34]. In a similar way, we foresee that downstream tasks like workload similarity, index recommendation, and database configuration recommendation can benefit from the study of workload characterization.
We propose a scalable data-driven artificial intelligence (AI) approach for workload characterization with distributed representation of query plans. One of the benefits of AI deep learning models is automatic feature engineering and auto-correlation among features. It is an non-trivial arduous task and possess many challenges in achieving the aim of workload characterization. Some of the challenges that makes it very different from other entity represention learning are Query Independence, Diverse Query Structure, Modeling Computational Complexity, and Data Dependence. We present a constructive detail on each of aforementioned challenges in §2.3.
Our Approach.
In our work, we first propose a query plan distributed representation model that captures the inherent characteristics such as structure, computational demand, and feature manifests embedded within a query plan structure. Hence, we created two parts for query plan representation, (i) Structure Representation, (ii) Computational Performance Representation. The two representations, either separately or collectively, can be used in downstream tasks to understand a query comprehensively. As an example, we demonstrate an approach to perform query latency prediction with the help of query representations. It can help in offline profiling of workloads and aid in tuning database settings. We believe that instance optimality of a database can only be achieved with the in-depth understanding of queries running in a system, and suggests the introduction of workload characterization component for it.
In our choice of design for distributed representation, we can either use a fixed-embedding or a pretrained encoder approach. Fixed embedding is useful where the set of elements is complete, and after model training, we get a fixed representation for all the elements in the set. This approach is instrumental in domain like graph embedding. On the other hand, pretrained encoder is a learned model that can output embedding on receiving the input by featurizing the attributes from the input along with learned weights from previous observations. We follow the pretrained encoder approach for adaptibility and transfer of knowledge.
Furthermore, we follow a bidirectional encoder strategy with both feature-based and finetuning-based approach inspired by the language models [8]. In this approach, the embedding obtained from the pretrained encoder is trained to learn features, and then the feature embedding output can be fed to multiple task-specific models. The approach aims to alleviates the requirement of task- specific representation and facilitates reuse of already learned features from the model to multiple domain-specific task. A pre-trained plan representation model also simplifies the transfer learning process when trained on a large dataset and fine-tuned for specific data and problem set.
We summarize the contribution of this paper.
-
•
We propose plan encoders for distributed representation of query plans. The general feature-based encoders capture inherent characteristics of query plans.
-
•
We capture two aspects of the query plans independently with two classes of encoders. The structure , and the computation of query plans.
-
•
The structure encoder is inspired by the natural language model, representing a tree-structure of heterogeneous operators in a latent multidimensional space. Thereafter, we evaluate our structure encoder model with similar query classification and regression tasks on multiple datasets.
-
•
Our computational encoder is a collection of encoder instances. Each encoder corresponds to a database operator such as scan, join, sort, aggregate, etc., optimizing for multiple metrics to capture the computational features. The encoder uses statistical information and data distribution of the underlying relational data along with the explicitly specified plan features and database configurations.
-
•
The train both our encoders with a large dataset of diverse query plans and benchmarks for pretraining. We then introduce a finetuning-based approach that can quickly adapt to new data distribution with limited data resources. It is essential for increment learning and fast domain adaptation with new workloads.
-
•
To show the overall effectiveness of our encoders, we performed query latency prediction and query classification tasks. In query latency prediction, given a query plan and a database configuration setting, the downstream model predicts the query latency using our plan encoders. In query classification task, we use our plan encoders to classify closely related queries.
The rest of the paper is organized as follows. §2 provides background and challenges we face while performing query plan representation, respectively. In §3, we present our structure encoder and performance encoder, followed by downstream tasks using plan encoders in §4. We present experiments and results of our downstream tasks with plan encoders in §5, and analysis of individual encoders in §6. We present a brief section on related works in §7, followed by conclusion in §8.
2 Preliminaries
Recently we are noticing a trend of utilizing the power of Artificial Intelligence (AI) in buffer resource tuning, indexing, and query optimizer [14, 26, 18]. In the near future, we expect database systems packaged with pretrained AI models, and dedicated cloud servers with embedded AI accelerators to facilitate the processing. Our proposed workload characterization with distributed representation of query plans can empower database core components to operate efficiently with in-depth insights on workloads.
Operator Plan Properties or Features All Actual Loops , Actual Rows , Local Dirtied Blocks , Local Hit Blocks , Local Read Blocks , Local Written Blocks , Plan Rows , Plan Width , Shared Dirtied Blocks , Shared Hit Blocks , Shared Read Blocks , Shared Written Blocks , Temp Read Blocks , Temp Written Blocks , Parent Relationship , Plan Buffers Scan Relation Name, Scan Direction, Index Name, Index Condition, Scan Condition, Filter, Rows Removed, Heap Blocks, Parallel, Recheck Condition Join Join Type, Inner Unique, Merge Condition, Hash Condition, Rows Removed by Join Filter, Parent Relationship, Hash Algorithm, Hash Algo, Hash Buckets, Hash Batches, Peak Memory Sort Sort Type, Sort Method, Sort Space, Sort Key, Sort Space Type, Sort Space Used, Peak Memory Aggregate Strategy, Hash Algo, Hash Buckets, Hash Batches, Parallel Aware, Partial Mode, Peak Memory
2.1 Workload, Query and Query Plan.
We define a database workload as , where is the database query, and is a normalized weight of importance of in workload such that . The weight can be as simple as the frequency of appearance of in or can be arbitrarily decided by the DBA. Generally, database users mostly runs a set of predefined template queries with seldom ad-hoc queries on databases. A data-driven smart database should collect statistics of each query and use it to determine the importance of a query.
For each query , one can obtain the corresponding query plan from the database system. Also, to note that a query with a similar template can generate a different query execution plan or query-plan based on the meta-information of a table in a database. Let us say, generates two query plan and query plan on different instances. In our approach, it is safe to assume and treat both the queries different from the functional point of view. Hence, there can be a one-to-many mapping from queries to query-plans.
Alternatively, we can now define workload as
where is the database query-plan, and is a normalized weight of importance of in workload such that . For readability, we will refer a query-plan as a plan in the paper from now.
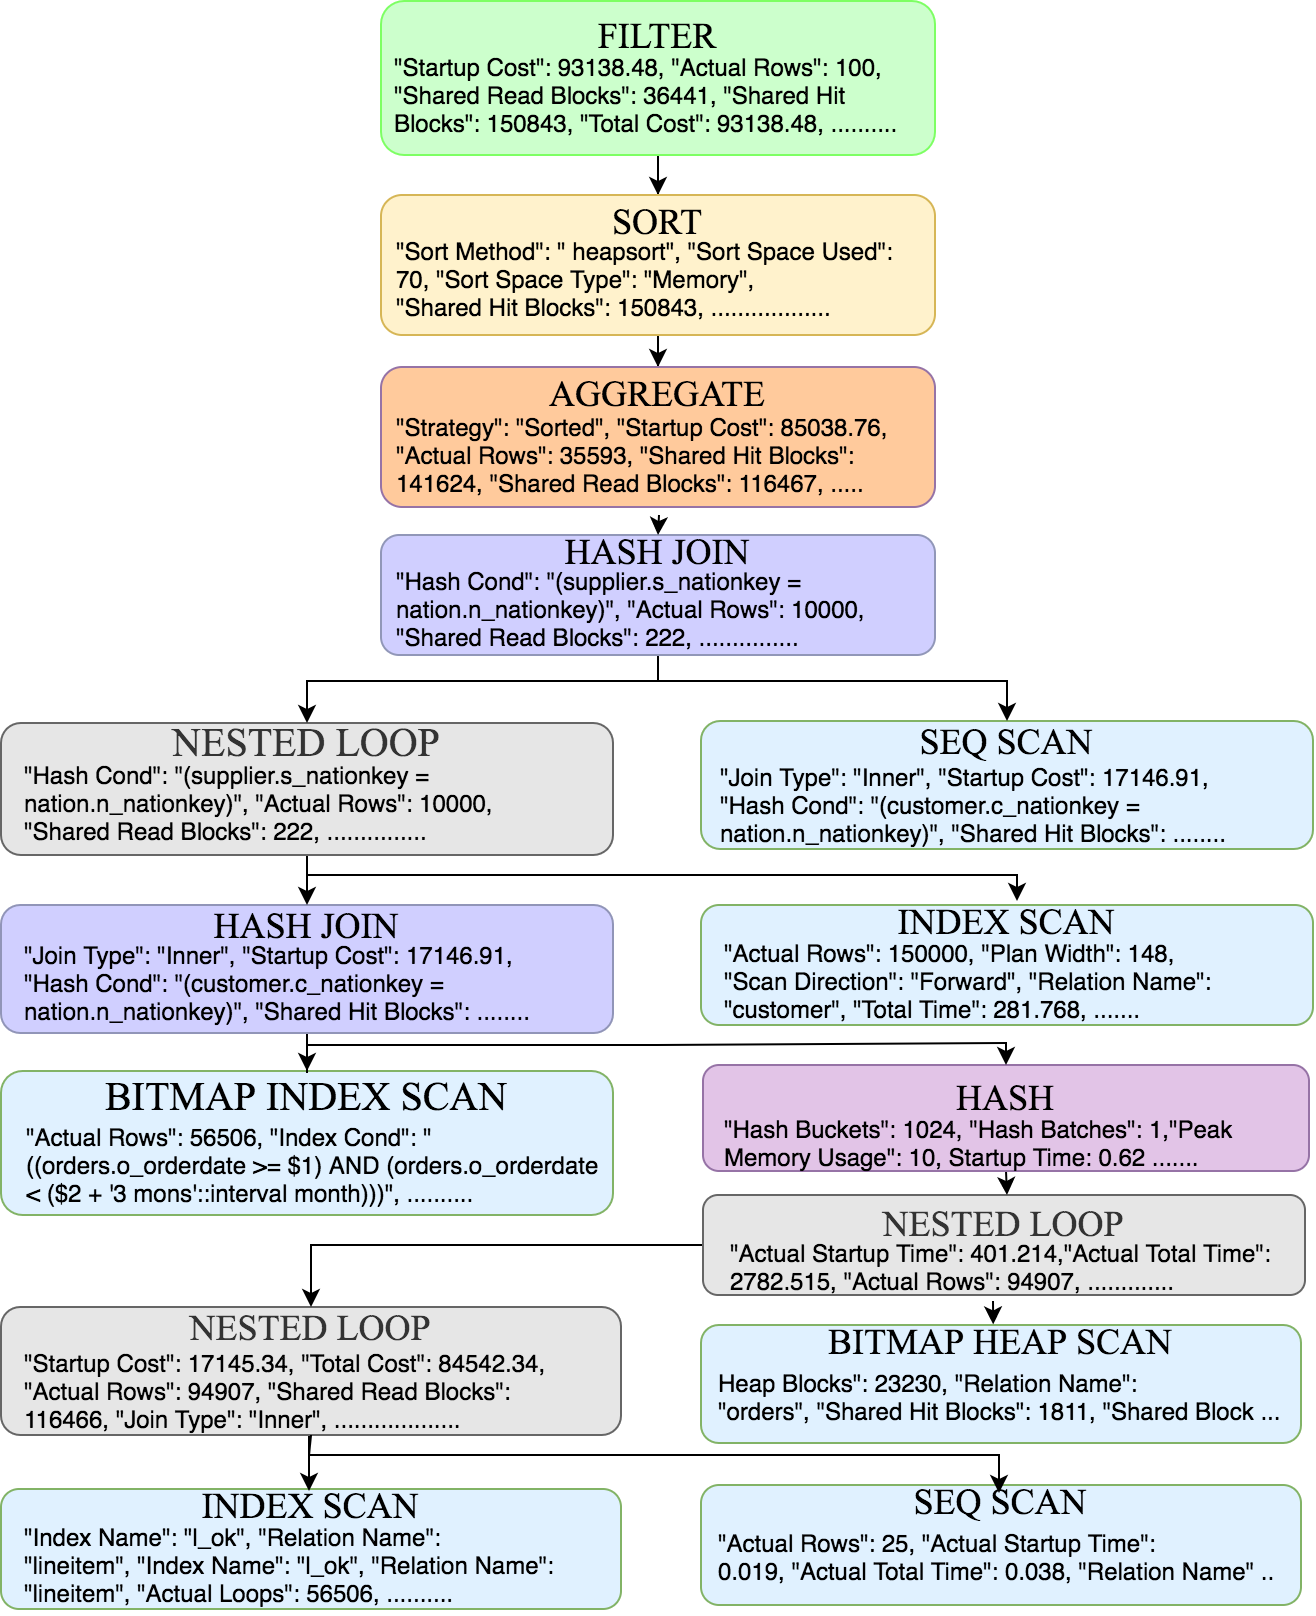
A plan is a tree structure with heterogeneous functional operator nodes like Seq Scan, Index Scan, Bitmap Heap Scan, Nested Loop, Hash Join, Aggregate, Sort, Filter etc. Each operator node contains a set of execution properties. We present an example of a plan in Figure 1 of query Q5 from the TPC-H benchmark with operator types. All operators have a set of common properties, and in addition, a few contain specific properties based on their functions. These operator properties carry valuable information about their execution. Based on the functions of each operator, we grouped all operators into five exclusive groups, i.e., Scan, Join, Aggregate, Join and Others. In Table 1, we lay out the properties common to all groups as ’All’ and the properties exclusive to Scan, Join, Sort, and Aggregate operators. These operator properties are used for computational performance representation of the plan. Please note that we do not use properties like Total Cost, Actual Total Time, Actual Startup Cost because we use them as labels in our prediction tasks. We describe it in §3.2.
For any plan as input to our Structural Encoder and Computational Encoder, the models outputs the structural embedding and the computational performance embedding , respectively. These embeddings are used by downstream models for different fine-tuning tasks.
2.2 Deep Neural Networks (DNNs)
DNNs are widely used computational frameworks for many AI applications. DNNs are layers of neuron thoughtfully structured that performs a weighted sum computation of the input values at each neuron. A structure of DNNs or model is also an instance of a machine learning algorithm that learns patterns from data by inferencing and then readjusting weights to minimize error. DNNs are very efficient in reducing high dimensional data into low dimensional code or features [13]. DNN hardly requires feature engineering and can learn complex relations among multiple features. In our paper, we are specifically interested in the entity representation learning capability of DNNs. Moreover, we focus our attention on Autoencoder (an Encoder-Decoder approach) for learning the structural representation model. A particular kind of Autoencoder called Denoising Autoencoder can capture robust generalized features from original data [32]. We applied an advanced feature-based encoding and learning technique inspired by natural language models. Recent applications of encoder architectures on language models are very successful in capturing structural and statistical properties [8, 34]. Query plans are structurally complex, and properties of plan operators are implicitly correlated. Hence, we adapted the autoencoder approach in our representation models. For the computational performance representation, we used a supervised learning approach learning features contributing to multiple metrics for operators.
2.3 Challenges and Mitigation Strategies
Traditional machine learning approaches encode entities into a fixed-length features before feeding them into any model for prediction tasks. We provide a consolidated set of challenges we face while performing workload characterization with plan encoders because of heterogeneous nature, diverse shape, and varying depth of plans.
-
•
Query Independence: Each query is unique and independent. Even if the queries are from the same benchmark or workload, they are seldom similar in structural and computational complexity. Unlike other entity embedding where contextual appearances of entities play a pivotal importance (such as word embedding), in workload contextual or temporal appearance of queries are not related.
-
•
Diverse Query Structure: The structure of query plans is represented as a tree of functional operator nodes, e.g., scan, join, sort etc. It is a non-trivial task to represent a tree structure containing attribute features at every node.
-
•
Modeling Computational Complexity: Each query has a specific demand for computational resources based on their functional operations. Moreover, the resource demand of each functional operator is different. An open question arises whether to implement an operator-level model or a single primary model for encoding.
-
•
Data Dependence: In databases, the generation of query plans from a query depends on many factors, such as index availability, statistical information on data. A complete query plan can only capture basic information about underlying data. It arises a question whether it is enough or we need to incorporate more information.
-
•
Encoding Multiple Properties: Database plans contain interrelated properties and information that give hints about query performance and their execution metrics such as latency and throughput. It is a challenge to unify and discover complex correlation among the properties and features explicitly obtained from plans.
-
•
Domain Adaptation: The encoder models trained on a set of workloads are likely to encounter a different unseen workload in the prediction phase. It is a challenge to adapt to a new workload setting quickly (with less training data) using the prior pretrained weights of the models.
We adopted specific strategies in our approach to address the above challenges. We purposefully design a feature-based query plan encoder for learning the individual characteristics from different query plans. For modeling the performance complexity, we incorporate meta-information (e.g., data distribution, selectivity, cardinality) of database tables and attributes used in queries providing a detailed picture of the data access pattern.
In our approach, it is a not trivial attempt to incorporate all the relevant meta-information and capture relevant features in our plan performance representation. Still, it is reasonable to assume that if we can incorporate all the required information to the encoders, then we might be able to learn the influencing factors contributes to evaluation metrics of query plans. After all, the query optimizers are universally designed logical components that generate query plans. The encoders producing distributed representation of query plans can facilitate many downstream tasks and enhance the performance of core components. It encourages us to keep the encoder as general as possible and capture the correlation among properties well enough in the query plan representation. With a data-driven approach, we aim to create a pretrained encoder model that learns from large and diverse datasets to learn plan features. In ideal scenario, we want pretrained encoders to quickly adapt new domain with less dataset, expediting domain transfer.
3 Query Plan Representation
In this section, we present our Structure Encoder and Computational Performance Encoder for plans. Each node in the tree is an instance of a functional operator with multiple properties, and nodes are ordered and connected via unlabeled edges depicting the dependence relation. For structural representation, we mainly study the operator type of each node and leaving the performance-related properties for computational performance representation in §3.2. When sketching our encoders, we realize keeping the structure, and computational performance representation independent increases the modularity in design, which also enables downstream tasks to choose and weigh each representations independently in their model. It also helps us in evaluating the structure and performance encoders separately.
For both Structure Encoder and Computational Encoder, we hope that our pretrained model can be easily adapted to new applications. Hence, we study both of them on a two-stage framework: pretraining and finetuning. In this section, we mainly introduce the pretraining tasks and model architectures for them. Then we outline our finetuning evaluation in §3.3.
3.1 Structure Encoder
Earlier, we have mentioned about the heterogeneity of operators in plans. We now try to give a clear picture of the diverse types of operators plans can possess. Same functional operators can use different strategies to fulfill their operations. There are multiple types of Scan operators like Sequential Scan, Index Scan, Bitmap Heap Scan, etc. Again, the same strategy often used in multiple functional operators, like, Hash Join and Hash Aggregate uses Hash strategy. We organized each type of operator into three sub-level type as taxonomy of operators. The top-level Level 1, mostly suggest the functional property such as Sort, Insert, Union, Scan, Join, etc. Level 2 and Level 3 are grouped based on mutually exclusive strategy types such as Hash, Index, Heap, etc. Table 2 shows all three levels of operator sub-type for defining a real operator. We define all operator with three sub-type as Level 1-Level 2-Level 3. For example, operator Bitmap Heap Scan and Left Merge Join is represented as Scan-Heap-Bitmap and Join-Merge-Left, respectively. All those operaters types forms the tree structure as shown in Figure 1, we need to find a way to encode the tree. Notice that workload analysis based on similar query plans can help DBAs in optimal utilization of database resources, e.g., buffers and configuration, by utilizing historical experiences from other databases. Furthermore, encoders enables clustering of similar-featured queries learned from a large set of queries without actually sharing any private/sensitive query information. Inspired by this goal, we propose a plan-pair similarity regression task to guide the structural representation learning.
3.1.1 Plan-pair Similarity Regression
To measure the similarity between two plans, we adopt a widely used graph similarity metric in natual language representation domain: Smatch [5]. It caculates the degree of overlap between two graph structures, which is defined as the maximum F1-score obtainable via a one-to-one matching of each node in two graph. Hence it is value from 0 to 1, 0 means totally different, while 1 means exact the same. In this task, we treat the optimal Smatch score as the similiary of two plans. The Smatch score between two tree-structure plans can be computed by graph macthing optimization algorithm, such as Interger Linear Programming (ILP) or Hill-climbing methods. After we get the Smatch scores of each plan-pair , this can easily form a large dataset with Smatch score as the similarity supervision. Based on thss large dataset, we propose that pretraining our structure encoder with a task of predicting the Smatch score of each plan pair. Results on the downstream similarity tasks or other applications also shows that the structure encoder pretrained from this task can be easily finetuned on new application or new domain.
| Level | Operator Sub-types |
|---|---|
| Level 1 | Aggregate, Append, Count, Delete, Enum, Gather, Aggregate (Group, GroupAggregate), Hash, Insert, Intersect, Join (Nested Loop), Limit, LockRows, Loop, ModifyTable, Network, Result, Scan, Sequence, Set(SetOp), Sort, Union, Unique, Update, Window, WindowAgg, Materialize |
| Level 2 | And, CTE, Except, Exists, Foreign, Hash, Heap, Index, IndexOnly, LoopHash, Merge, Or, Query, Quick, Seq, SetOp, Subquery, Table, WorkTable |
| Level 3 | Anti, Bitmap, Full, Left, Parallel, Partial, Partition, Right, Semi, XN |
3.1.2 Model Architecture
In this paper, by linearizing the tree structure into a sequence of nodes, we can transform the tree-encoding problem into a sequence encoding problem, which has been well studied in many areas, such as natural language processing, time serials analysis.
Tree Traversal
When linearize the tree into node sequence. We use the root first traversaling, but adding hierarchical brackets for each non-terminal nodes in the tree. Because the bracket keeps more structural information of the original plan structure, which shows less ambiguity than simple BFS and DFS strategies. The output of this strategy(DFS-Bracket) for our running example in Figure 1 as shown in 3. We always sort the children nodes by typename, so that the linearization of a tree is deterministic.
| Strategy | Node Sequence |
|---|---|
| DFS Bracket | (Filter–, (Sort–, (Aggregate–, (Join-Hash-, (Loop–Nested, (Join-Hash-, (Hash–, (Loop–Nested, (Loop–Nested, Scan-Index-, Scan-Seq-) Scan-Heap-Bitmap) ) Scan-Index-Bitmap) Scan-Index-) Scan-Seq-)))) |
Self-attentive Encoder Layer.
After we transform a tree-structure plan into a sequence of normalized node types, various language modeling architectures can be reused to learn encoding for the linearized plan.
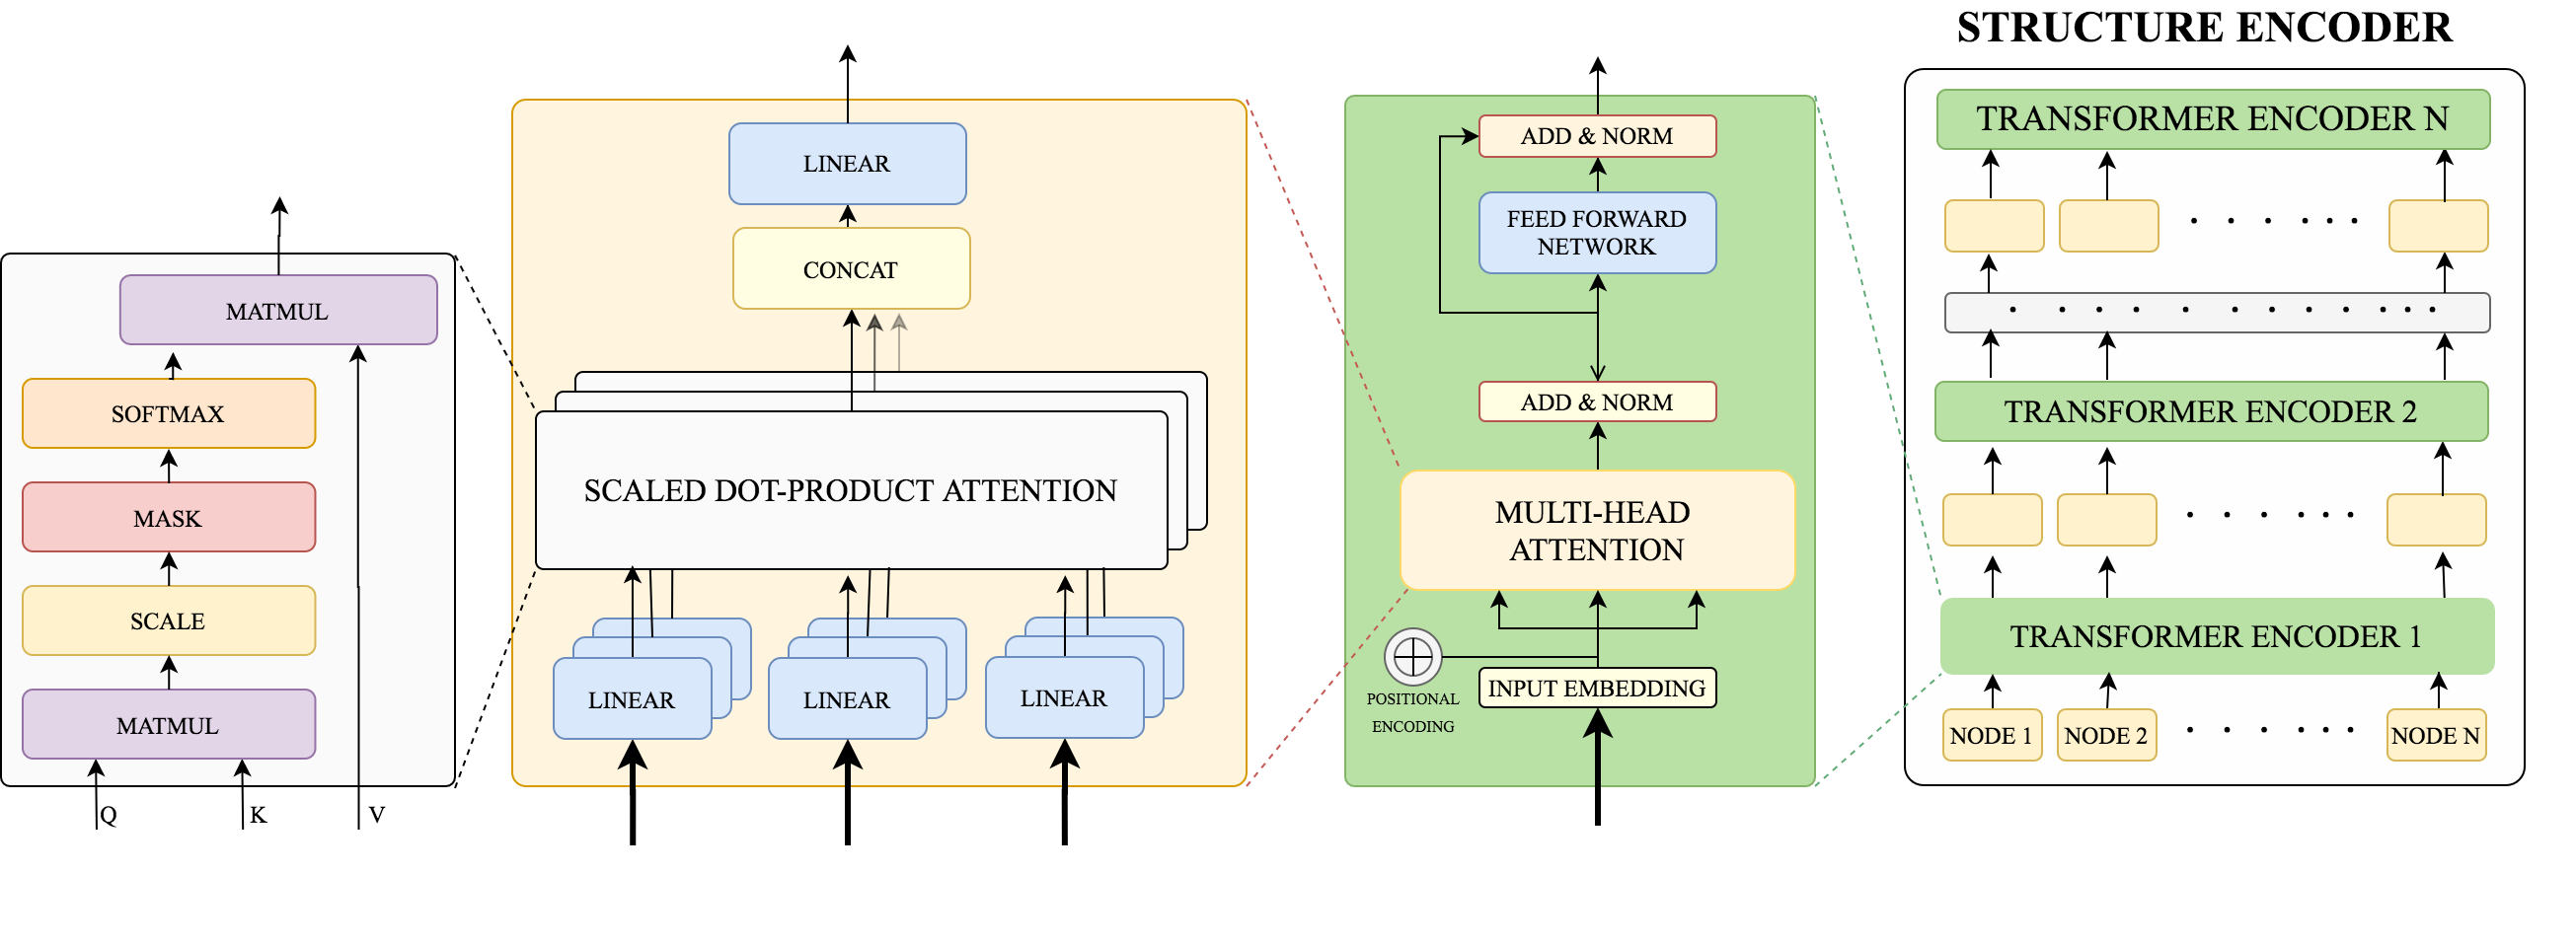
Inspired by the success of attention mechanism in NLP, we employ the multi-head, multi-hop attention mechanism used in Transformer networks [31] pictorially presented in Figure 2. As before, due to space constraints, we refer the reader to the original work for details. We will use the notation from the original paper here. These matrices represent a query, key, and value, respectively. The multi-head attention is defined as:
| (1) |
The ’s refer to projection matrices for the three inputs, and the final projects the concatenated heads into a single vector, and is scaling factor where is the dimension of and . means concatenating the encoding attended by multiple heads.
The choices of the query, key and value defines the attention mechanism. In our work, we use self-attention, defined by setting all three matrices to , is the input encoding of the th self-attentive layer, which is corresponding the encoding of the th node in the linearized version, as described above.
Input Embedding Layer
In the st layer, is the input embedding of those operator nodes. As mentioned above, for every operator node in the plan, we represent its input embedding as a concatenation of embedding for its three subtypes. Notice that in the DFS-bracket tree traversal, besides the regular nodes, open and close bracket are also treated as nodes with three subtypes, which are “BR_OPEN-NIL-NIL” and “BR_CLOSE-NIL-NIL” for open and close bracket nodes, respectively. When we use the self-attentive encoder, as the transformer usage in BERT, we also add CLS node at the beginning and SEP node at the end of the linearized nodes. They are also denoted as 3 subtypes as “CLS-NIL-NIL” and “SEP-NIL-NIL”. Hence, in Table 2 Level 1 node, we actually add four extra special subtypes: “BR_OPEN”, “BR_CLOSE”, “CLS”, “SEP”.
Matching Layer
The output of the transformer encoder is a sequence of vector for each nodes, we use the output encoding of ’CLS’ node as the encoding of the plan , because it aggregates the weighted sum of all other nodes in the self-attentive layer. We denote the plan encoding for as . After encoding the plan-pair into vectors , then we use a matching layer to compute the similarity as
where denotes the sigmoid activation function, , means concatenating the four vectors.111Other match function exists, e.g. bilinear similarity , . However, we found that this contanated matching similarity can largely reduce the parameters size from to and achieve better performance
3.2 Computational Performance Encoder
In this section, we present our computational performance encoder, describing the pretraining task to supervise the encoder learning, and our proposed model architectures and the thoughts behind it.
3.2.1 Performance Attribute Prediction
The properties mentioned in Table 1 for each type of broadly classified operators in a plan gives an ample hint on its computational demand. These properties are either derived from complex logical inferences by plan optimizers or real output from the query execution. In previous works [9, 18, 10], we notice the use of Total Cost, Total Time, Startup Time properties as a measure of performance. We strongly agree with previous research works on using the properties above-mentioned as measures of computational performance. Moreover, in our encoder, we use these attributes as labels for prediction with an attempt to encode the underlying features. We use properties explicitly mentioned in nodes (an instance of an operator in a plan), meta-information from databases, and configuration settings of the database to predict these labels. In the process of learning the labels, we learn the implicit features as embedding with our computational performance encoder.
| Features Type | Feature Attributes |
|---|---|
| Meta Features | relname, attname, reltuples, relpages, relfilenode, relam, n_distinct, distinct_values, selectivity, avg_width, correlation |
| DB Settings | bgwriter_delay, shared_buffers, bgwriter_lru_maxpages, wal_buffers, random_page_cost, bgwriter_lru_multiplier, checkpoint_completion_target, checkpoint_timeout, cpu_tuple_cost, max_stack_depth, deadlock_timeout, default_statistics_target, work_mem effective_cache_size, effective_io_concurrency, join_collapse_limit, from_collapse_limit, maintenance_work_mem |
We first create encoders, each for (i) Scan (ii) Join (iii) Sort (iv) Aggregate functional operators, these four operators are the most frequently used in query plans. The nodes with operator type Hash Join, Merge Join, Nested Loop, Left/Right/ Inner/Outer Merge Join, Nested Loop is mapped to Join; similarly Seq Scan, Index Scan, Heap Scan, Bitmap Heap Scan etc. are Scan nodes. From the properties of each node, we also extract the relation names and attribute names of which it is accessing the data from node properties such as Relation Name, Hash/Join/Merge/Index Condition, Filter, Output. We map them with the refreshed meta-information collected from the database. In Table 4, we show the meta-information attributes we use as input to the model used by the node. This information can be easily extracted from system tables of database system like PostgreSQL [25]. In case of multiple relations used we sum up the attribute values and then use them as input features.
We also use a set of database configuration setting values of the running database as input features to the model. These configuration settings are selected based on their importance in for performance tuning as described in [30, 23].
Altogether, we have three types of input features,
To further clarify, the input features into a model are node properties along with associated properties mentioned earlier. For example, if a plan has three nodes of same operator type, say Scan, then we have three input data , , , for the scan operator model. Besides, we create another input data with the summation of the three node features of the plan for the predicting the cumulative label metrics, i.e., Total Time or Total Cost for the plan.
3.2.2 Model Architecture.
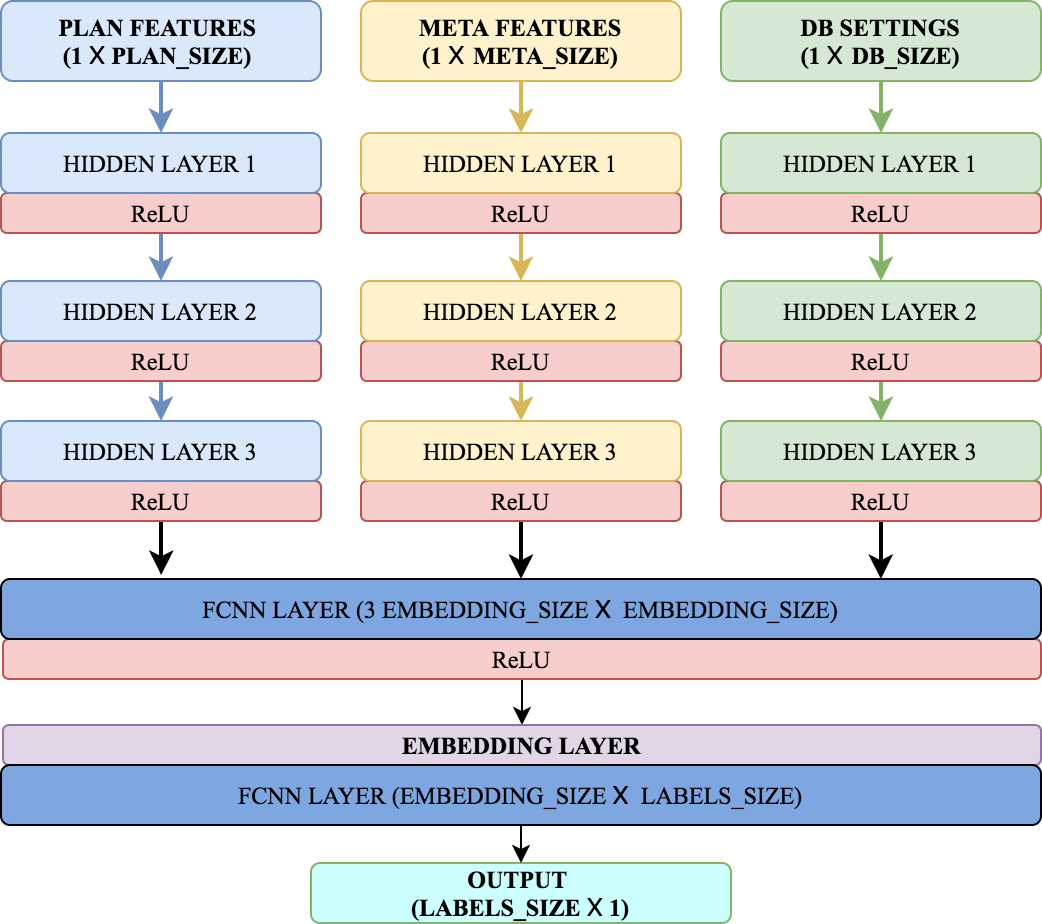
We now present the deep neural network (DNN) architecture of the encoder with a pictorial representation in Figure 3. It is a three-column DNN on the top each for Plan features, Meta features, and DB features, respectively, with another fully-connected NN layer merging the three parts and producing the embedding layer. The last fully-connected NN component takes the output of the embedding layer to predict the metric labels i.e., Total Cost, Total Time, Startup Time. Also, each NN layer is followed by a activation function layer of ReLU (Rectified Linear Unit), Sigmoid or Tanh functions. We create multiple instance of this supervised regression model each for a type of functional operator as mentioned earlier.
A NN layer can efficiently represent or capture complex relations among input features by applying an affine transformation of the input. With multiple feed-forward NN layer, a recursive affine transformation and non-linear activation functions are applied to the input features to produce an output. The difference between the desired output and the predicted output is calculated based on some metric functions dubbed as loss. A gradient descent based technique is applied to tweak the weights on each layer used to perform the affine transformation minimizing the loss. It allows the model to learn non-linear and polynomial order complex functions, automatically identifying the relevant features.
One of the key insights while architecting the model is that the three-column multilayered feature approach on Plan, Meta, and DB features, respectively, allows the model to find correlation among the same type of features first. Then transformed weighted features from each part can correlate effectively. As a preliminary attempt, we train an alternate model with a standard (single-column) DNN with all the input features together. In §6.2, we provide a comparative study to evaluate both the models.
3.2.3 Joint Training
A general rule of thumb for any model is that the distribution of predicted data remains the same as training data. But, in our case, the data distributions change with new workload. When the model learns from a single or small workload benchmark, the model overfits and cannot generate a general model. With the assumption that if enough information on the data distribution is used for training the model, the model can learn the factors governing the performance metrics for each operator (Scan, Join, Sort, Aggregate, etc.). Also, the fact that a general query plan optimizer (which is a logical component) uses the same statistical information we use as input to our model encourages us. The trick is to learn a generalized pretrained model that can adapt to an unseen workload with small data from the new domain. Hence, the pretrained models should utilize already learned parameters to adapt with the new workload.
We utilize a joint training approach for training the encoders. We train each operator model on multiple workloads on different data distributions and multiple database configuration settings. In joint training approach, we perform multiple metric tasks, each task optimizes for each label, i.e. Total Cost, Total Time and Startup Time. The difference in each of these models is the last NN-layer, which uses the embedding layer as input. Since the top level of the model remains unchanged, the weights are naturally tweaked to learn features based on multiple tasks.
We evaluate our performance encoder models on two criteria, (i) the model uses less data from a new domain to adapt, and (ii) the model error on validation and test data converges. We provide a detailed evaluation results on our pretrained computational performance encoder in §5.
3.3 Finetuning Evaluation
Given the above pretraining for learning structure and computational performance encoders, we hope that our learned model can be easily used in other unseen applications. We conduct two groups of finetuning evaluation for them:
Domain Adaptation.
For both the structure encoder and computational encoder, they are trained from a source distribution on plan-pair similarity regression and performance attribution prediction tasks. Domain Adaptation aims at that these models can be easily finetuned on a different target data distribution. Hence, we finetuning them on different benchmark workloads on the same tasks, such as TPC-H and TPC-DS , and Spatial benchmarks. For plan-pair similarity regression task, we generate a collection of plan pairs for each new benchmark, and then calculating the Smatch scores for evaluation. For the performance attribute prediction task, we collect the new dataset by running workloads on different database configurations. More details about those datasets is introduced in 5.1, and the results on domain adaptation for each encoder are shown in §6.
Transfer Learning to New Tasks
Besides the ability of domain adaptation, we also define two new tasks to evaluate whether our pretrained plan encoder can be easily used for other tasks rather than our pretraining task in §4.
4 Downstream Tasks
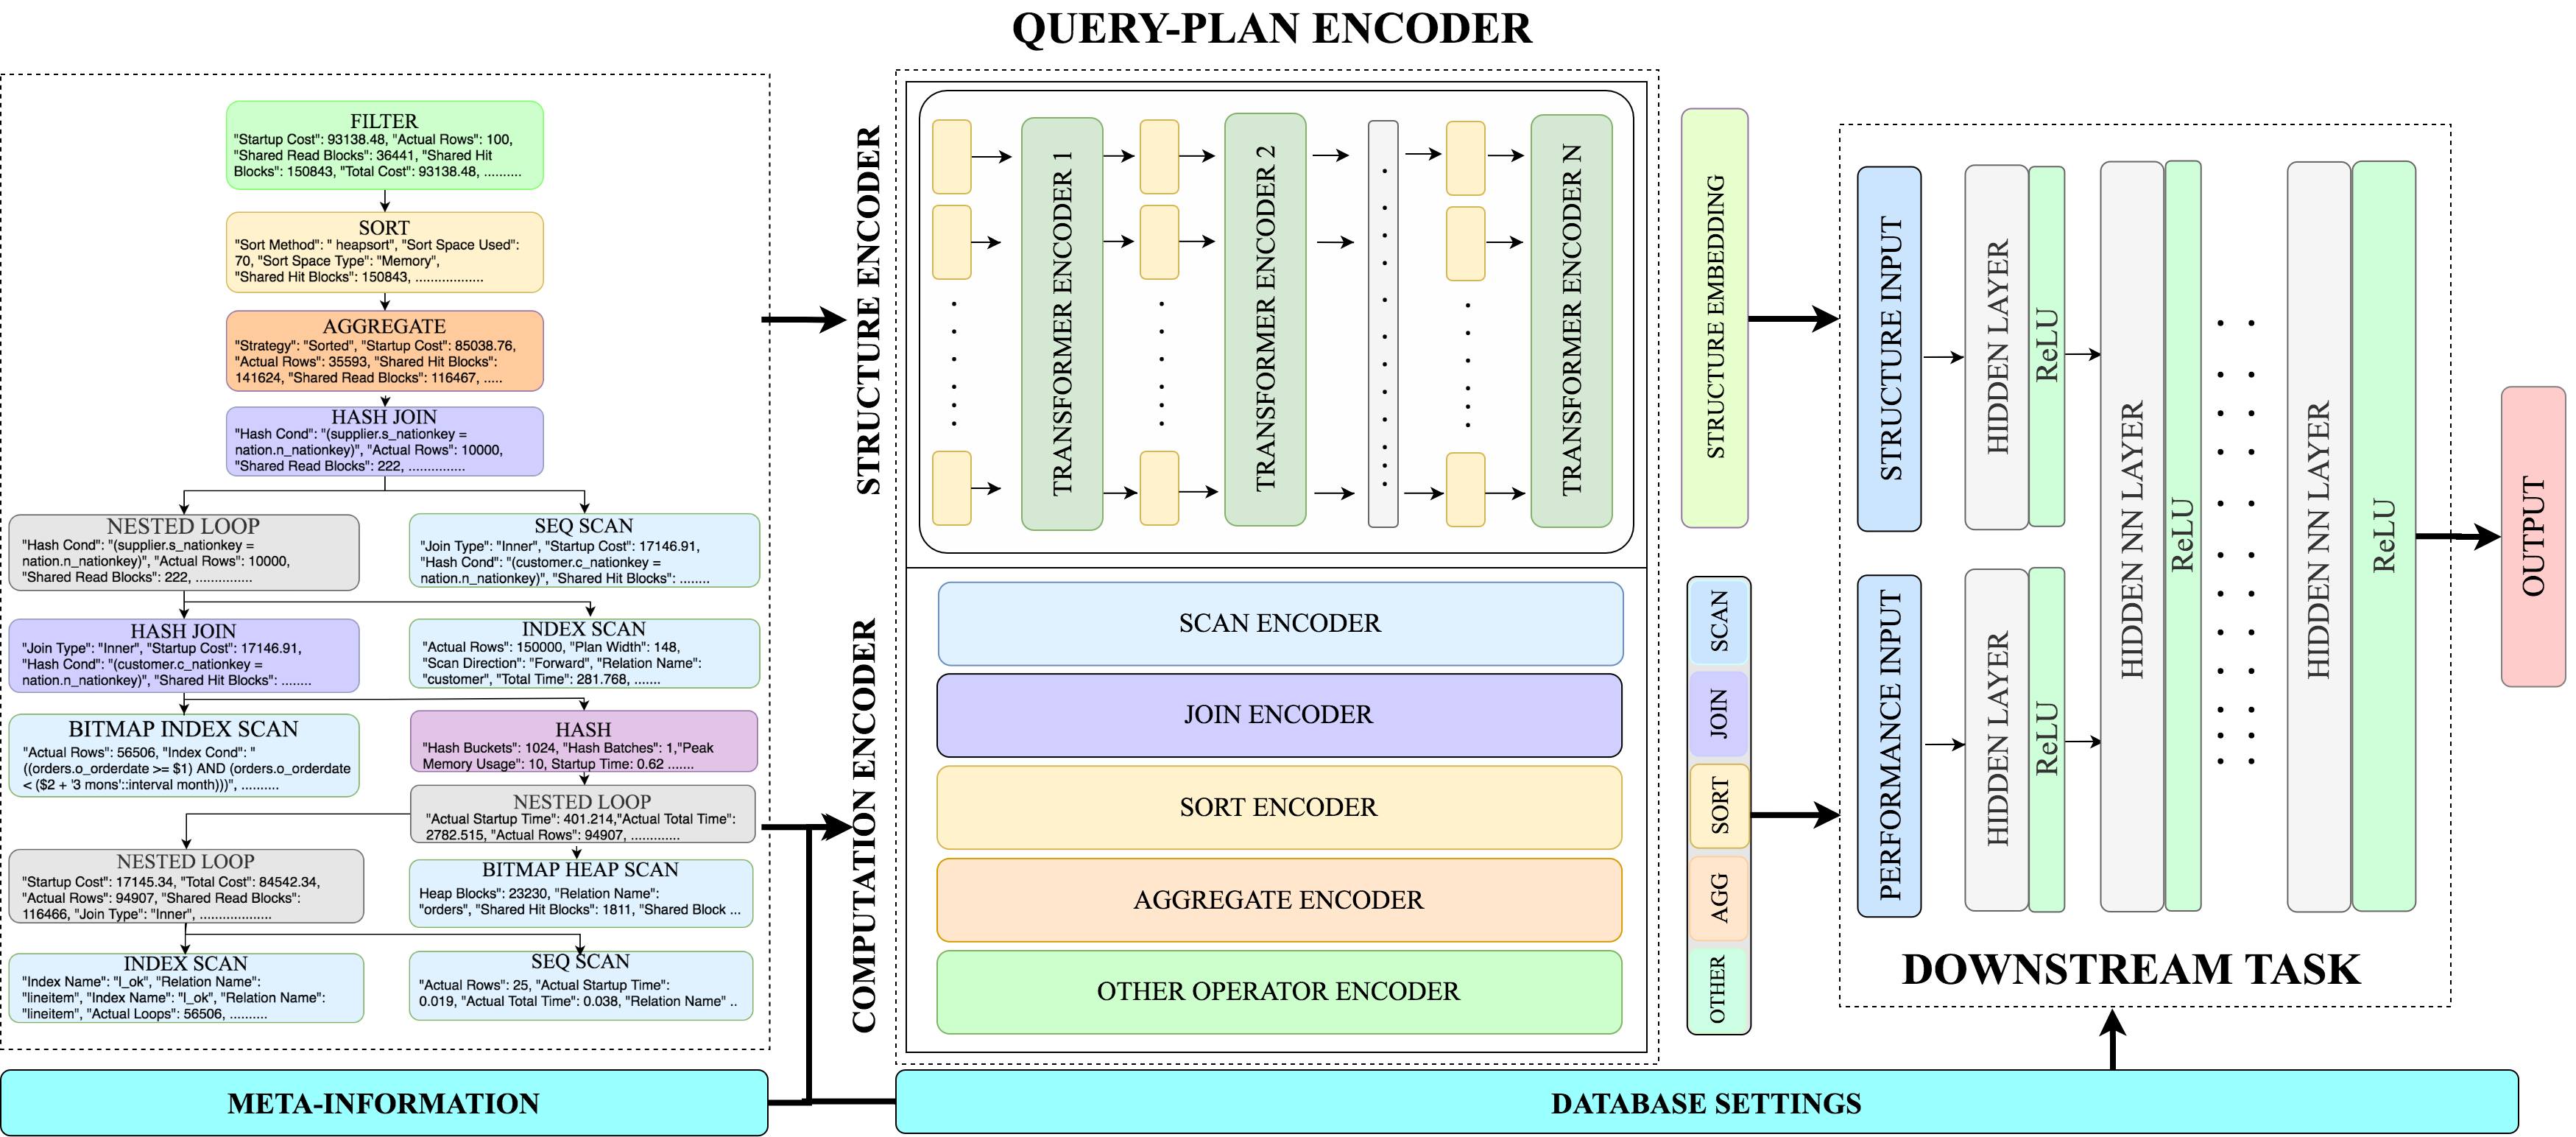
In this section, we show two downstream tasks that use our proposed plan structure and performance encoders. We present a bird-eye view architecture of the model common to our downstream tasks in Figure 4. For a given query plan input, meta information of database, and database configuration, the plan encoders (structure and performance encoder) produce respective representations as output. This output is then fed to the downstream task-specific model. It is to note that for generating the computational performance representation, we group plan nodes based on the type of functional operator and then pass it to the corresponding performance encoder to obtain representation.
The downstream task model is a standard multilayer-DNN taking three inputs, (a) structure embedding,(b) computational performance embedding, and (c) the database settings. The properties of database settings are real numbers. They can have an arbitrarily large value, which hinders learning a better model. We overcome the problem by scaling each database settings with logarithmic function and use them as added features along with the real numbers. Furthermore, we added a flexible design of reshaping the dimension of structure or performance representation in the downstream task model for obtaining better accuracy.
4.1 Query Latency Prediction
The first downstream task is a real-world task of predicting query latency for an input query plan on a given database knob configuration settings utilizing our plan encoders. Formally, we define the query latency prediction problem as follows.
Problem 1 (Query Latency Prediction:)
Given a query plan , meta-features of the database, and a database configuration settings , the model predicts the latency of the query.
For generating the training data for latency model, we created an automated workload running scripts222https://github.com/debjyoti385/workload_scripts that runs on cloud server instances and uploads executed plans along with the meta-features and database settings to our data repository. The script generates a new database configuration and configures the database automatically for each run. These new database configuration are generated based on the Latin Hypercube Sampling method [2, 19] for the properties mentioned in Table 4. This method for generating database setting has been earlier used by Duan et al. and Aken et al. [30, 11].
4.2 Query Classification
One of the aims of workload characterization is to learn the features of similar queries to classify and cluster them, thus providing an opportunity for obtaining database instance optimality. This task also validates the efficient representation of similar queries from our encoders by projecting them closely in latent dimensions. Besides the latency prediction task, we also conduct experiments on query template prediction task with our pretrained plan structure and performance encoders. We formally define the problem statement as follows.
Problem 2 (Query Classification:)
Given a query plan , meta-features of the database, and a database configuration settings , the model predicts the predefined class for the query plan based on feature similarities.
We conduct this experimental task with join order benchmark [15] containing 113 interesting query templates and 33 clusters of similar query templates. Due to cardinality of the database tables and query predicates, the query plans generated from the query optimizers can differ from one another. It also makes the classification task challenging to cluster the query features accordingly. Note that we include the performance encoder in classification tasks as queries even with similar plan structure can differ in performance features. We present detail of this experiment and the role of individual encoders in § 5.3.
5 Experiments and Results
In this section we first describe the datasets we used in our experiments. We then present evaluation methods with experimental results for latency prediction and query template classification tasks.
5.1 Datasets
Crowdsourced Plan Dataset.
We collected this dataset containing PostgreSQL queries along with its execution plans from a crowdsourced website333https://explain.depesz.com[7]. We used this dataset for pretraining our structure encoder model. After pruning the plans with more than 200 nodes, we generate 57430/2871/2871 plan-pairs for training/dev/test, and then caculate the Smatch score as their similarity score.
Industry Standard Benchmarks.
Spatial Benchmark.
Spatial queries are notorious for hogging resources and needs a proper database configuration for optimal performance. PostGIS, the spatial and geographic objects extension for PostgreSQL admits the configuration tuning requirement based on workload type in their documentation [23]. We use the two following spatial benchmarks in our experiments.
Jackpine: Jackpine [24] benchmark contains diverse spatial queries on spatial join with multipolygons, lines, points and combination of them. We revised444https://github.com/debjyoti385/jackpine the original benchmark with recently available shape datafiles, PostGIS extension and also made it publicly available.
Open Street Map (OSM): The Open Street Map(OSM) workload has spatial overlap, distance and routing queries. This dataset is created555https://github.com/debjyoti385/osm_benchmark with inspiration from work [3]. Due to sparsity, it is difficult to understand the underlying data distribution, which makes it an inviting benchmark for experiment. We used OSM map of New York and Los Angeles county.
Join Order Benchmark.
It contains 113 different queries, which can be grouped into 33 clusters due the the similar SQL queries with different join orders. We run those queries on different database configurations and then collect the 16229 diffrent plans. We split that into 13505, 1362, 1362 as training, dev and test respectively.
5.2 Results on Query Latency Prediction
We first evaluate our query latency prediction model with multiple experiments to project an overall effectiveness of using our plan encoders. We used pretrained structure and performance plan encoders trained on Crowdsourced dataset and multiple TPC-H, TPC-DS workloads, respectively. A detailed analysis of our pretrained encoders is given in §6.1 and 6.2.
Ablation Studies.
(a) Spatial Benchmark: We first present an ablation study on individual queries. The aim of this study is to measure the error in relative to the variability of query latency. For initial training of the latency prediction model, we used plans from spatial benchmark [24, 21, 4] executed on 120 different database configurations. The trained model then predicts query latency for spatial queries on different database configuration. To prepare our test datasets, we ran each benchmark 50 times with very different database configuration settings.
Database Setting Unit Median 95th Percentile 5th percentile bgwriter_delay ms 4,860.00 9,421.05 456.00 bgwriter_lru_maxpages integer 515.00 958.05 55.00 checkpoint_timeout ms 300.00 540.00 60.00 deadlock_timeout ms 300,000.00 540,000.00 26,000.00 default_statistics_target integer 4,827.50 9,563.00 454.85 effective_cache_size bytes 1,048,576.00 1,966,080.00 131,072.00 effective_io_concurrency integer 52.00 96.00 6.00 maintenance_work_mem bytes 7,340,032.00 15,728,640.00 876,953.60 max_stack_depth integer 3,072.00 5,120.00 417.95 random_page_cost number 5,028.60 9,507.39 560.40 shared_buffers bytes 2,097,152.00 3,932,160.00 131,072.00 wal_buffers bytes 130,624.00 131,072.00 12,416.00 work_mem bytes 15,728,640.00 31,457,280.00 1,048,576.00
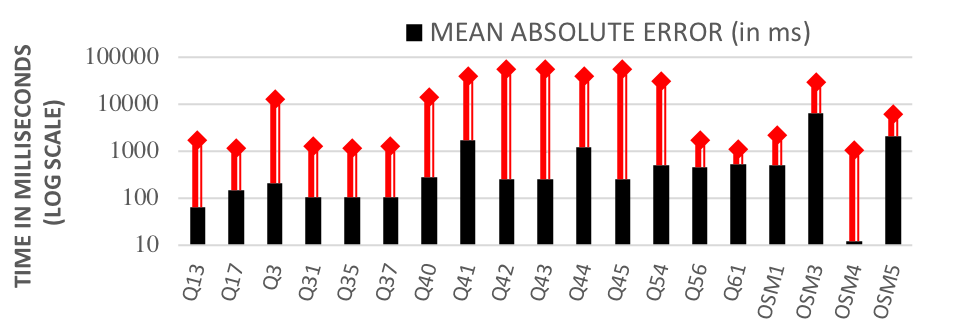
Figure 5 shows the query latency statistics of query templates with median query latency greater than 500 milliseconds from spatial benchmark; Jackpine (with prefix Q) and OSM benchmark (with prefix OSM). The blue bars in the chart shows the median of the query latency for all the query execution with different database settings. The orange line shows the variability of the query latency due to change of database settings. The bottom point of the orange line represents the 5th percentile, and the highest point marks the 95th percentile of query latency. We present a complimentary Figure 6 along with Figure 5 that pictorially shows the mean absolute error for all the query templates from the spatial benchmark. The red line is the measure of time difference between 95th percentile and 5th percentile of a query latency in milliseconds, depicting the extent of the variability for the particular query. To note, vertical axes on both figures i.e. Figure 5 and 6 are presented on a logarithmic scale with milliseconds as unit. It shows that at least 68% of the queries have MAE less than 10% of variability, and 90% of the queries have MAE less than 30% of variability.
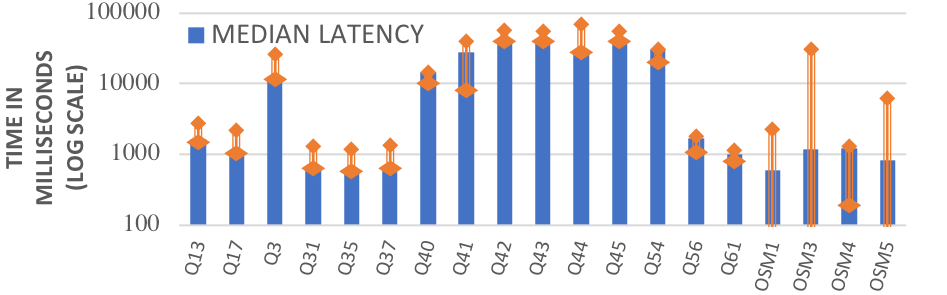
Query latency prediction on spatial benchmark is challenging because of the sparse geospatial data distribution from two areas contributing towards large variability. Furthermore, the performance of spatial queries are easily affected by database configurations. Significantly less mean absolute error from the latency prediction model shows that pretrained encoders helped the model.
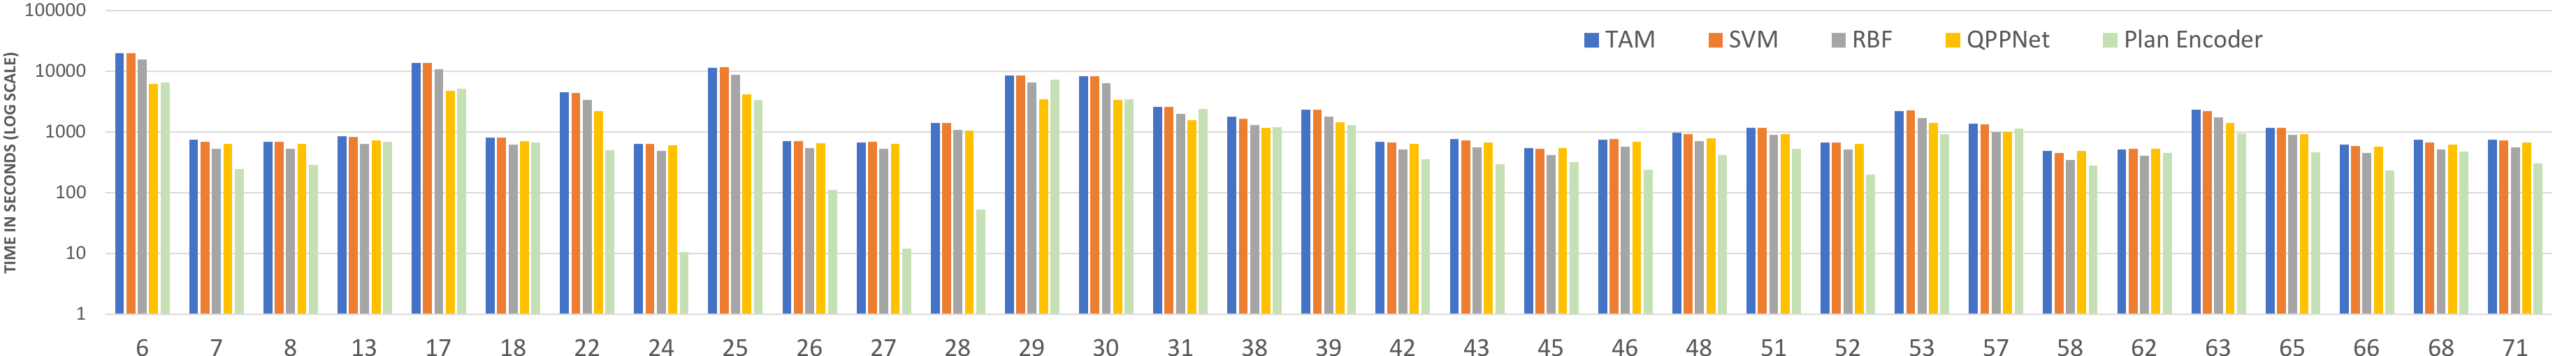
(b) TPC-DS 100 Benchmark: In this experiment, we compare our latency model with state-of-the-art latency prediction models for each query template from TPC-DS benchmark for a scale factor of 100 (i.e. 100 GB). A recent study by Marcus et al.[18] shows TPC-DS query ablation study with TAM [33], SVM [1], RBF [17] and QPP Net [18]. It is to note that we used the same TPC-DS plan dataset used by the study [18], and we split of our dataset in 80:20 ratio for use as training and test data. In Figure 7 and 8, we show a comparative study of our latency model with other approaches on mean absolute error (MAE) for each TPC-DS query template.
Figure 7 shows all the query templates where our latency model with plan encoders performed better than the majority of the baseline approaches. 23 out of 33 query templates produced at least 25% less error than the best baseline for respective query templates.
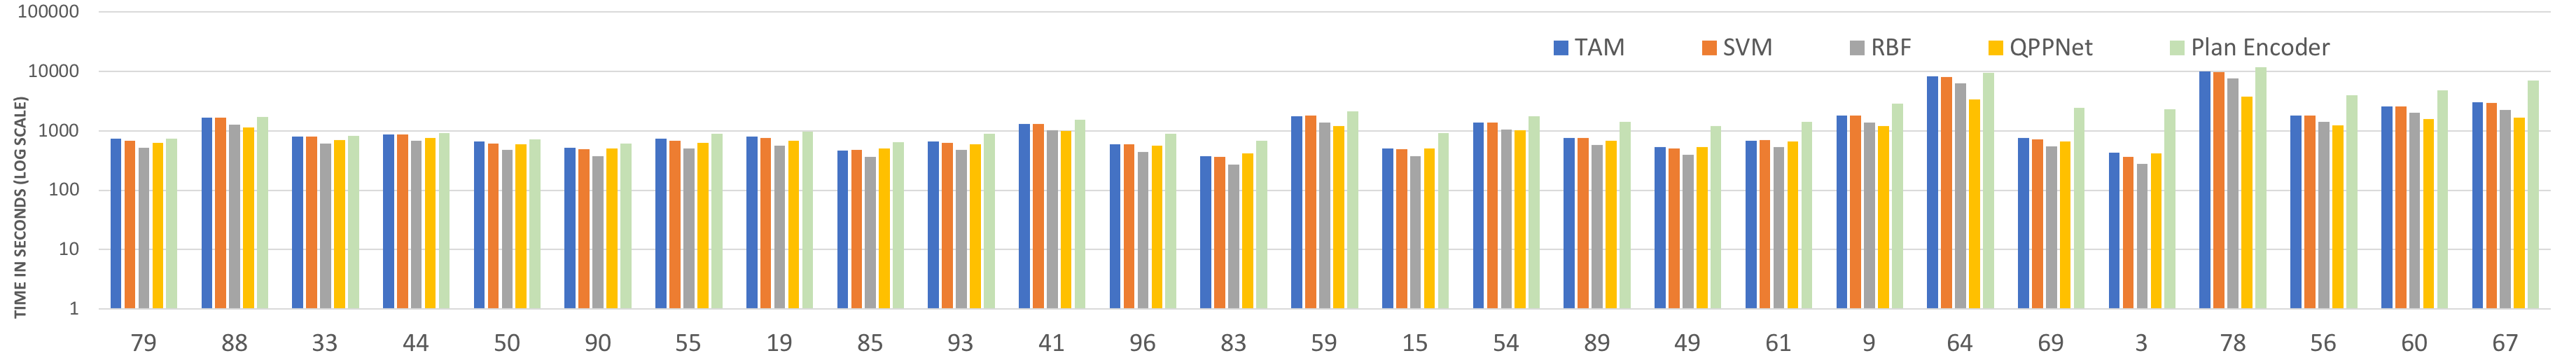
In Figure 8, we present all the query templates where our latency model could not perform better than the baselines. 12 out of 27 query templates achieved a mean error of less than 25% of the baseline. 21 out of 27 templates have errors less than twice of the baseline. We noticed that for some query templates, there is a large gap in latency prediction for non-indexed versions of the queries from the indexed version of the queries. We could not collect enough metadata information for this particular dataset on indexed columns to fully replicate the database condition and then to use it in our performance plan encoder. We used metadata information for non-indexed database configuration for TPC-DS with scale factor 100 in our plan encoder for this prediction. Thus from the experiments, it shows that our initial approach of plan encoders can be used for latency prediction strategies.
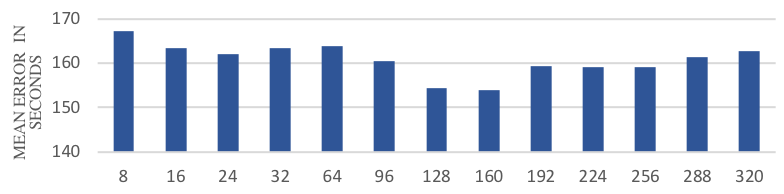
Discussion on Structure Encoder Size: We performed an experiment to find the optimal size of the structure encoder to be used in the latency model. In latency prediction, we find using only structure encoder yields error 5 times of the latency model with only performance encoder. We designed an experiment to show the influence of structure encoder on the latency prediction model by varying the input embedding size from structure encoder and keeping the performance embedding size fixed to 300. We trained the latency model with TPC-DS scale factor 10 dataset and tested it on 5 different test batch of TPC-DS dataset. In Figure 9, we report the average of the mean absolute error from 5 test dataset and found that embedding size of 128 and 160 performed relatively well. It signifies that adding structure can help latency prediction by a small amount with a suitable structure embedding size. This confirms that features from performance encoder are dominant and have relatively low importance of structure features in latency prediction task.
5.3 Results on Query Classification
As described in §4.2, our experiments are conducted on join-order benchmark, we fuse our pretrained structure encoder and performance encoder to classify a plan into a template id. Noticed that in the join order benchmark, there are 113 query templates and 33 clusters. We hope our classifier can consistently predict both the cluster id and template id. For example, when predicting a plan with ground truth template id 11a. It means the ground truth cluster id is 11. In this cluster, we also have another three template id 11b, 11c and 11d. We sum up all 4 scores of those 4 template id in a cluster as the score for predicting the cluster id as 11. Then we add another cross entropy score for the clustering prediction as a regularizer of our template id cross entropy. Adding this regularizer largely improves the performance of our model. Besides that, in this task, we found adding a batch normalization layer when fusing our structure and performance encoder as inputs is essential, which normalizes them into the same scale. To understand how structure and performance encoder performs in the task, we conduct ablation studies for using structure-only, performance-only and both in our experiments. The results in Table LABEL:table:rst_query_classication show structure encoder plays in the main role of this task. Without it, the performance-only performs very bad. What’s more, adding the performance encoder can boost the performance by 5.72 points on the test set. We also noticed that using both structure and performance only generalize better on unseen test set than structure-only or performance-only models. Below the line in the table, Both0.1 and Both0.3 are the models only trained on 0.1 and 0.3 fraction of data, they perform still good even in less amount of data, which indicates that our pretrained encoder help on other new tasks with less data.
| Methods | Dev | Test | ||
| template | cluster | template | cluster | |
| Structure-Only | 0.2452 | 0.4670 | 0.1946 | 0.3847 |
| Performance-Only | 0.1645 | 0.2973 | 0.0977 | 0.1769 |
| Both | 0.2783 | 0.5573 | 0.2518 | 0.4647 |
| Both0.1 | 0.2000 | 0.4927 | 0.151 | 0.334 |
| Both0.3 | 0.2555 | 0.5228 | 0.1843 | 0.3855 |
6 Analysis
6.1 Structure Encoder
As described in §3.1, our structure encoder is pretrained on plan-pair similarity regression task with the transformer encoder. We use a large amount of dataset from the Crowdsourced Plan dataset for pretraining. In this paper, we first prune those extremely large plans with more than 200 nodes. Then randomly select 63172 pairs of plans to form the dataset for our plan-pair regression task and calculating all the smatch scores of those pairs.
Baseline Models
For pretraining tasks, we denote our plan-pair similarity regression task as Transformer-PPSR, and compare it a common self-supervised pretraining tasks: Sparse Autoencoder(Sparse-AE). It learns to compress a input plan into a hidden representation and then decode that representation back into the original plan. Besides that we also conduct a blation study for using LSTM on our PPSR pretraining task, denoted as LSTM-PPSR.
Results on Finetuning
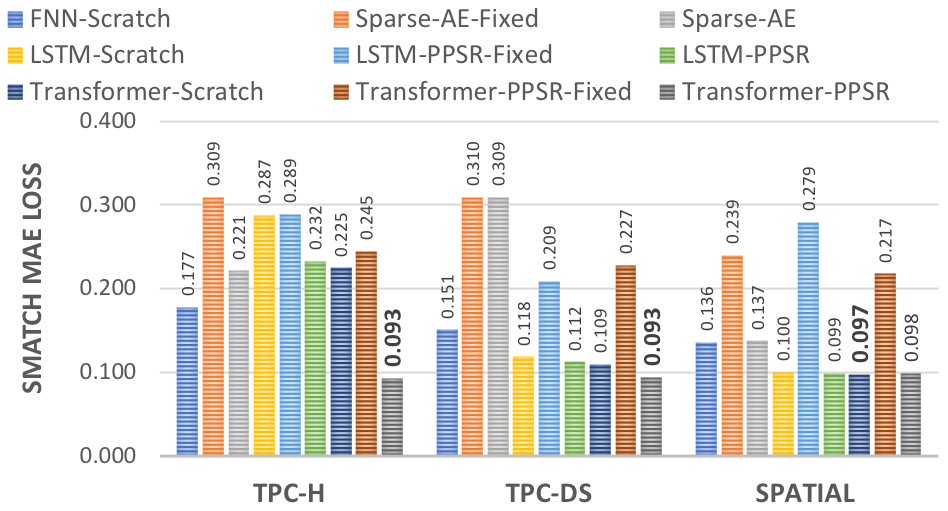
We first pretraining on Crowdsource dataset with 3 pretraining approaches: Sparse AE, LSTM-PPSR, Transformer-PPSR. To investigate its ability for domain adaptation, we first random generate 11126, 55498, 60000 plan-pairs with plans in TPC-H, TPC-DS, and SPATIAL, then creating the training, dev, test splits with a ratio as . We finetuning the pretrained structure encoder on the above new domains. In Figure 10, we show the Mean Absolute Error (MAE) between the predicted smatch score with the true smatch score. All the models in the table are trained from the full dataset. As described above, the methods above the line are training from scratch with FNN, LSTM, Transformer Encoder. The models below the lines are the 3 pretraining methods, and we use each of them as fixed feature or finetuning. ‘Transformer-PPSR-fixed’ means using the output of the pretrained model as fixed features without finetuning, which performs much worse than its finetuning version ‘Transformer-PPSR’. Hence, our models are suitable for finetuning instead of fixed features in this task. Except for the MAE on the spatial dataset, our pretrained model, can significantly reduce the error on both TPC-H and TPC-DS. For spatial dataset, we noticed that both LSTM and Transformer scratch models work very good; using pretraining does not improve.
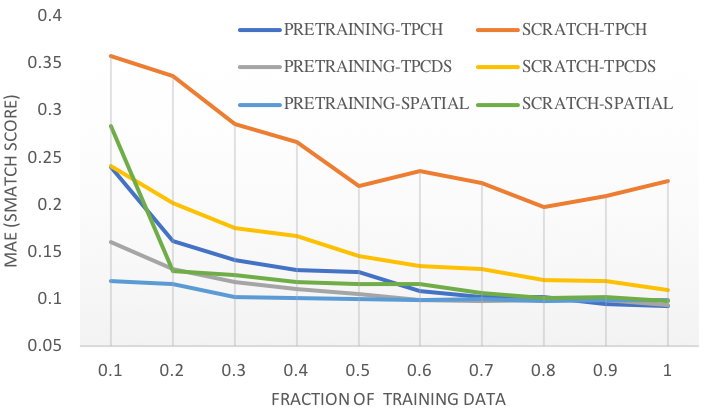
As shown in the Figure 11, we compare pretraining and no-pretraining method with different amount of training data. For all 3 benchmarks, especially TPCH and TPCDS, our pretrained method can achieve small MAE of Smatch score on less amount of data. On spatial data, our pretrained method only slightly better than no-pretraining one.
6.2 Computational Performance Encoder
We now perform local probe on computational performance encoder with a set of experiments evaluating the pretrained encoders for Scan, Join, Sort, and Aggregate operator. For pretraining, we used TPC-H and TPC-DS both with scale factors 1,2,3 and 5 executed on at least 20 different configuration settings randomly generated via Latin Hypercube Sampling method [2, 19].
Pretraining:
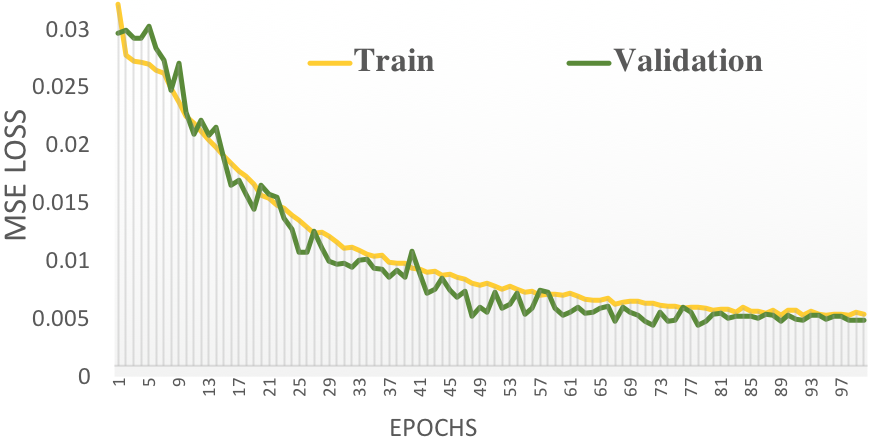
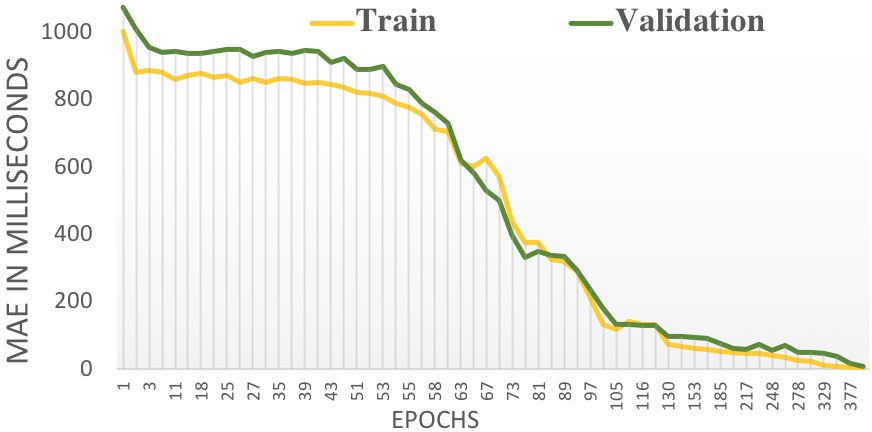
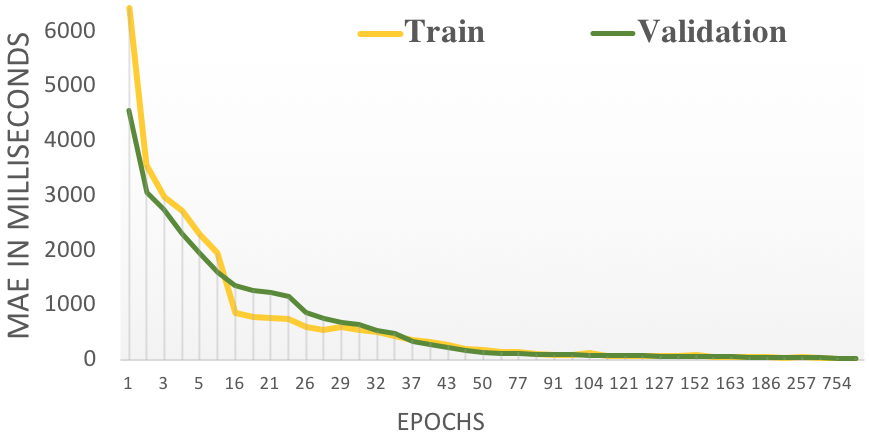
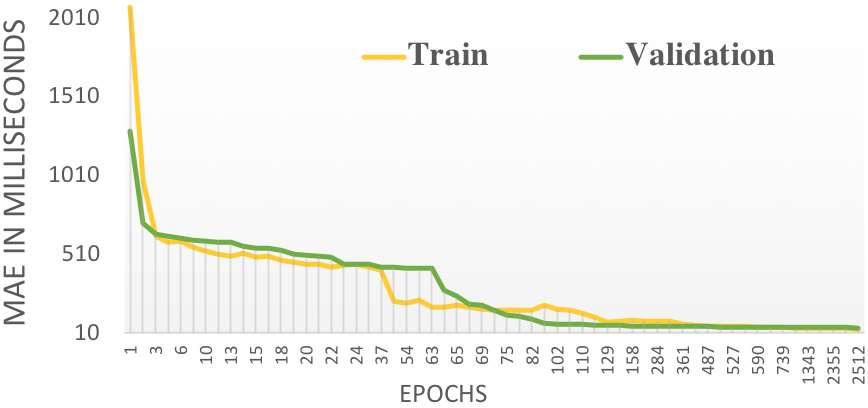
We first illustrate the training procedure and a few learnings from it. We split the dataset into 8:1:1 ratio for train, validation, and test for pretraining of all the four operators. Figure 12 shows the Mean Absolute Error (MAE) on latency (Actual Total Time) label for train, validation, and test data for scan, join, and sort operator. In all the cases along with aggregate (not shown in Figure 12) the train, validation and test MAE converges below 1 second and stays around tens of milliseconds. The MAE on test data is calculated based on the epoch with best validation model so far seen while training. We stop the training when the MAE on validation does not improve more than 5 milliseconds in last 100 epochs. With a 12 GB GPU on a Ubuntu 18.04 operating system, each model takes around 6-8 hours to train.
A key insight on training the models is the best MAE vary based on operators. The best MAE for Scan model on test data is 12 milliseconds, where the validation MAE is 7 milliseconds. In Join model and Sort model the test MAEs reaches a low of 3.42 milliseconds and 44 milliseconds respectively. It is to note that we performed pretraining on all the three labels Actual Total Time, Total Cost and Startup Time but for brevity we reported only Actual Total Time in our figures.
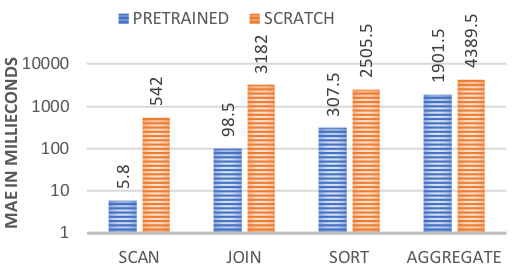
Finetuning with pretrained models.
The goal of having a pretrained model is to expedite the domain adaptability with less data. In many cases, obtaining adequate training data is challenging and time-consuming. In this set of experiments, we perform finetuning tasks on a new dataset, of TPC-DS with scale factors 8 (SF-8). We also performed the same experiment on spatial dataset which shows similar result. Due to space constraints we could not add the result on spatial dataset.
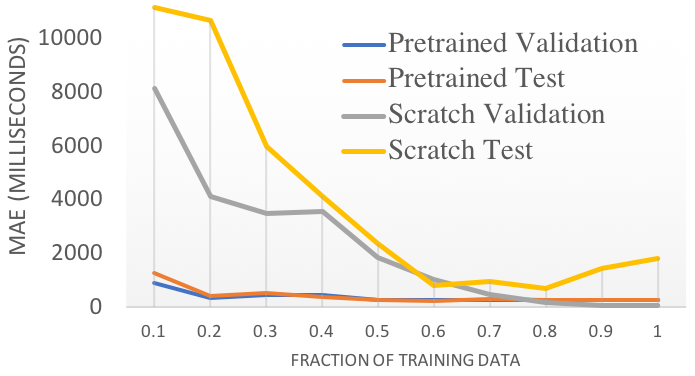
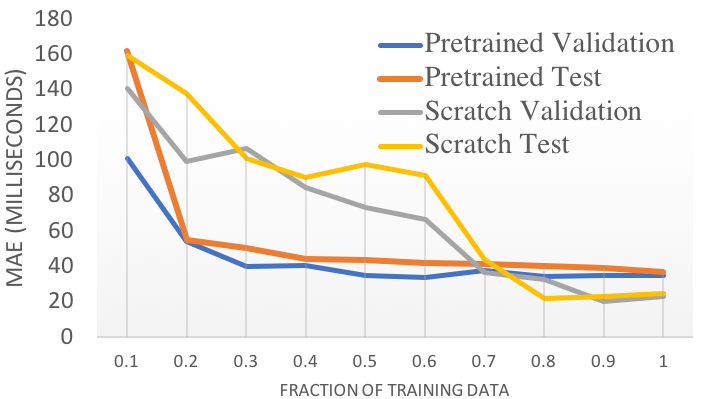
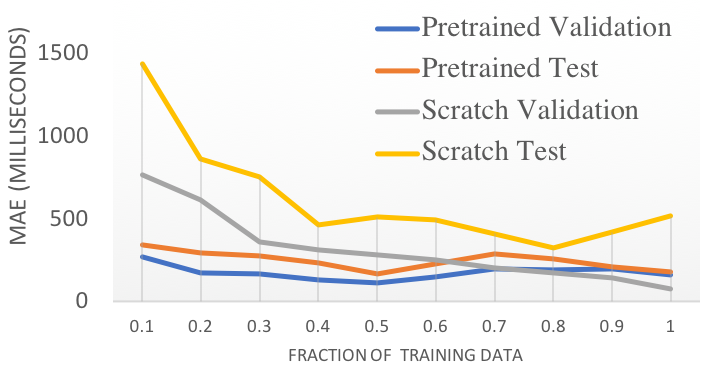
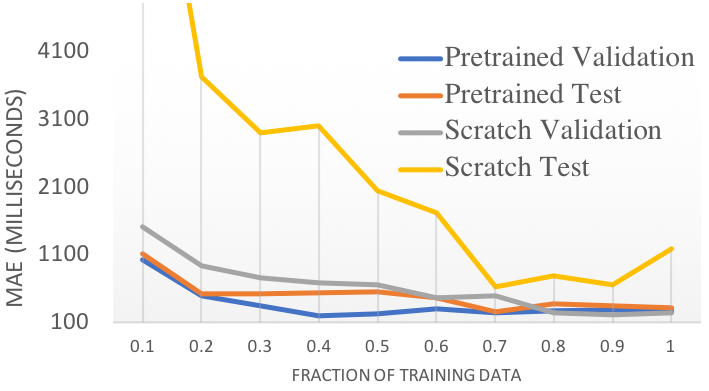
To show the effectiveness of pretraining models over scratch or non-pretrained model, we orchestrated a comparative experiment where the performance of models trained on fractions of training data. We limit the full training dataset to randomly chosen 2000 plans and test dataset to 500 plans for both TPC-DS and Spatial datasets. We run each model for 100 epochs which takes around than 10 minutes to train. In all the line charts from Figure 13, we notice that as the amount of training data increases, the MAE decreases on all the models, but the validation MAEs of scratch models is only comparable with the pretrained models when trained with 0.5 to 0.7 fractions of training data. The critical observation is that pretrained test seldom improves beyond 0.3 fractions of training data for our workloads.
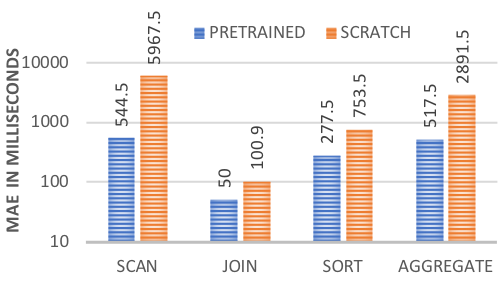
To make the clear distinction between pretrained and scratch models, we show the MAE on test dataset for each operator and dataset with 0.3 fractions of training data in Figure 14 for TPC-DS SF-8 and Spatial workloads. We report the test MAE for the best validation model obtained in 100 epochs. In all the cases, the pretrained model beats the scratch model by a considerable margin. Conclusively, it confirms that our pretrained encoders are useful and adapt to the new workloads quickly.
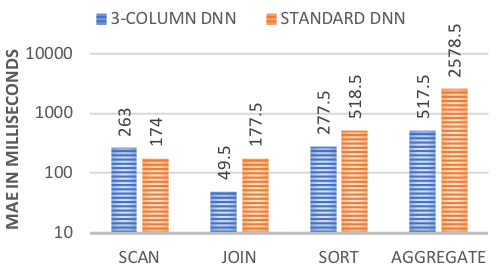
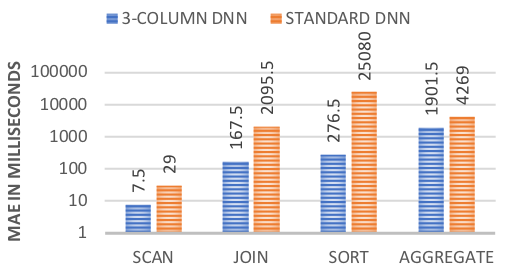
Multi-column vs Standard DNN
In this experiment, we perform a comparative evaluation between our three-column DNN and a standard (single-column) DNN for the performance encoder. Similar to the previous finetuning experiment, we pretrained both the models with same workloads. After that, we finetuned each model with 0.3 fraction of training data from TPC-DS SF-8 and Spatial workloads independently to obtain multiple evaluation models. Figure 15(a) and 15(b) shows the Mean Absolute Error(MAE) obtained from the three-column DNN and the standard DNN models for an unseen TPC-DS SF-8 and Spatial benchmark dataset, respectively. With the TPC-DS workload, Figure 15(a) shows MAE for the three-column DNN model is better than standard DNN for all the operators except the scan operator. Whereas, the MAE for three-column DNN is significantly less than standard DNN for spatial workload. It suggests that keeping the performance features () independent for the first few layers helps the model. In the single-column standard model, different types of features might get intertwined in the early stage of the model, impeding its learnability.
In summary, our experiments present the effectiveness of plan encoders in learning characteristics of query plans with latency prediction task and multiple local probes on individual encoders. The results suggest the necessity of pretrained models to feature and understand unseen queries. Other database core systems certainly can leverage the plan encoders for to increase their effectiveness and achieve instance optimality.
7 Related works
Workload characterization.
There exists a number of research work that uses data-driven analysis on query plans and its features to comprehend workload characteristic [12, 1, 9, 18, 17]. Early research works [12, 17, 35], focuses on feature engineering with data mining techniques like k-NN[6] on high-dimensional features. The initial works show the importance of feature engineering, which encourages follow up research works using neural networks for workload related prediction tasks (metrics, resource demands, indexing, etc.) [18, 9, 10, 16].
All these methods learn models from input features of query plans for a specific task. In our paper, we show an approach to learn pretrained query plan encoders that can be used for many downstream tasks. Currently database researches are proposing prepackaged AI learned models for core-components of databases [14, 30]. Our work on query plan encoders bridges the gap between query input and prediction tasks.
Database tuning is an interesting problem to achieve instance optimality and closely relates to query performance prediction tasks. An earlier work, Ituned [27] uses a feature-based approach for tuning database. Recently published work, QTune [16] uses query plans and reinforcement learning for tuning databases. In both the approaches, query plans are important. An attempt of ours to create a pretrained encoder for query plans is relevant to database tuning and other similar tasks. We show its relevancy with a latency prediction over a different configuration and different data. An earlier work by Popescu et al. [22] shows it is feasible to accomplish performance prediction tasks on new data distribution for the same query. One of the significant contributions of our pretrained encoders is the adaptability of the models with new query and data.
8 Conclusion
In this work, we study a method of featurizing database workloads with AI based encoders that helps in understanding database queries under structural and performance properties. We followed a pretrained encoder based approach for our models that learns weights from diverse training dataset and then use the learned model in downstream tasks like query latency prediction. We perfomed multiple probes on structural encoder and performance plan encoders, to prove their learning capability and efficacy. We also present an in-depth ablation study on query latency prediction for multiple benchmark workload proving the usefulness of workload characterization with plan encoders. Our approach of studying database workloads with pretrained encoder models paves a new direction in this field.
Acknowledgement
We would also like to show our gratitude to Hubert Lubaczewski for providing us access to the crowdsourced plan dataset.
References
- [1] M. Akdere, U. Çetintemel, M. Riondato, E. Upfal, and S. B. Zdonik. Learning-based query performance modeling and prediction. In 2012 IEEE 28th International Conference on Data Engineering, pages 390–401. IEEE, 2012.
- [2] P. Audze and V. Eglājs. New approach to the design of multifactor experiments. problems of dynamics and strengths. 35. Zinatne Publishing House, pages 104–107, 1977.
- [3] B. Baas. Nosql spatial–neo4j versus postgis. Master’s thesis, 2012.
- [4] A.-L. Barabasi. The origin of bursts and heavy tails in human dynamics. Nature, 435(7039):207–211, 2005.
- [5] S. Cai and K. Knight. Smatch: an evaluation metric for semantic feature structures. In Proceedings of the 51st Annual Meeting of the Association for Computational Linguistics (Volume 2: Short Papers), pages 748–752, 2013.
- [6] T. Cover and P. Hart. Nearest neighbor pattern classification. IEEE transactions on information theory, 13(1):21–27, 1967.
- [7] E. Depesz. Postgresql’s explain analyze made readable, 2019. [Online; accessed 16-Dec-2019].
- [8] J. Devlin, M.-W. Chang, K. Lee, and K. Toutanova. Bert: Pre-training of deep bidirectional transformers for language understanding. arXiv preprint arXiv:1810.04805, 2018.
- [9] B. Ding, S. Das, R. Marcus, W. Wu, S. Chaudhuri, and V. R. Narasayya. Ai meets ai: Leveraging query executions to improve index recommendations. In Proceedings of the 2019 International Conference on Management of Data, pages 1241–1258, 2019.
- [10] B. Ding, S. Das, W. Wu, S. Chaudhuri, and V. Narasayya. Plan stitch: Harnessing the best of many plans. Proceedings of the VLDB Endowment, 11(10):1123–1136, 2018.
- [11] S. Duan, V. Thummala, and S. Babu. Tuning database configuration parameters with ituned. Proceedings of the VLDB Endowment, 2(1):1246–1257, 2009.
- [12] A. Ganapathi, H. Kuno, U. Dayal, J. L. Wiener, A. Fox, M. Jordan, and D. Patterson. Predicting multiple metrics for queries: Better decisions enabled by machine learning. In 2009 IEEE 25th International Conference on Data Engineering, pages 592–603. IEEE, 2009.
- [13] G. E. Hinton and R. R. Salakhutdinov. Reducing the dimensionality of data with neural networks. science, 313(5786):504–507, 2006.
- [14] T. Kraska, M. Alizadeh, A. Beutel, E. H. Chi, J. Ding, A. Kristo, G. Leclerc, S. Madden, H. Mao, and V. Nathan. Sagedb: A learned database system. 2019.
- [15] V. Leis, A. Gubichev, A. Mirchev, P. Boncz, A. Kemper, and T. Neumann. How good are query optimizers, really? Proceedings of the VLDB Endowment, 9(3):204–215, 2015.
- [16] G. Li, X. Zhou, S. Li, and B. Gao. Qtune: A query-aware database tuning system with deep reinforcement learning. Proceedings of the VLDB Endowment, 12(12):2118–2130, 2019.
- [17] J. Li, A. C. König, V. Narasayya, and S. Chaudhuri. Robust estimation of resource consumption for sql queries using statistical techniques. Proceedings of the VLDB Endowment, 5(11):1555–1566, 2012.
- [18] R. Marcus and O. Papaemmanouil. Plan-structured deep neural network models for query performance prediction. arXiv preprint arXiv:1902.00132, 2019.
- [19] M. D. McKay, R. J. Beckman, and W. J. Conover. A comparison of three methods for selecting values of input variables in the analysis of output from a computer code. Technometrics, 42(1):55–61, 2000.
- [20] T. Mikolov, I. Sutskever, K. Chen, G. S. Corrado, and J. Dean. Distributed representations of words and phrases and their compositionality. In Advances in neural information processing systems, pages 3111–3119, 2013.
- [21] OpenStreetMap contributors. Planet dump retrieved from https://planet.osm.org . https://www.openstreetmap.org, 2017.
- [22] A. D. Popescu, V. Ercegovac, A. Balmin, M. Branco, and A. Ailamaki. Same queries, different data: Can we predict runtime performance? In 2012 IEEE 28th International Conference on Data Engineering Workshops, pages 275–280. IEEE, 2012.
- [23] PostGIS. Spatial and geographic objects for postgresql, 2019. [Online; accessed 16-Dec-2019].
- [24] S. Ray, B. Simion, and A. D. Brown. Jackpine: A benchmark to evaluate spatial database performance. In 2011 IEEE 27th International Conference on Data Engineering, pages 1139–1150. IEEE, 2011.
- [25] M. Stonebraker, L. A. Rowe, and M. Hirohama. The implementation of postgres. IEEE transactions on knowledge and data engineering, 2(1):125–142, 1990.
- [26] J. Tan, T. Zhang, F. Li, J. Chen, Q. Zheng, P. Zhang, H. Qiao, Y. Shi, W. Cao, and R. Zhang. ibtune: individualized buffer tuning for large-scale cloud databases. Proceedings of the VLDB Endowment, 12(10):1221–1234, 2019.
- [27] V. Thummala and S. Babu. ituned: a tool for configuring and visualizing database parameters. In Proceedings of the 2010 ACM SIGMOD International Conference on Management of data, pages 1231–1234. ACM, 2010.
- [28] T. B. H. S. S. v2.17.3. Tpc benchmark h: Standard specification v2.17.3.
- [29] T. B. D. S. S. v2.6.0. Tpc benchmark ds: Standard specification v2.6.0.
- [30] D. Van Aken, A. Pavlo, G. J. Gordon, and B. Zhang. Automatic database management system tuning through large-scale machine learning. In Proceedings of the 2017 ACM International Conference on Management of Data, pages 1009–1024. ACM, 2017.
- [31] A. Vaswani, N. Shazeer, N. Parmar, J. Uszkoreit, L. Jones, A. N. Gomez, Ł. Kaiser, and I. Polosukhin. Attention is all you need. In Advances in neural information processing systems, pages 5998–6008, 2017.
- [32] P. Vincent, H. Larochelle, Y. Bengio, and P.-A. Manzagol. Extracting and composing robust features with denoising autoencoders. In Proceedings of the 25th international conference on Machine learning, pages 1096–1103. ACM, 2008.
- [33] W. Wu, Y. Chi, S. Zhu, J. Tatemura, H. Hacigümüs, and J. F. Naughton. Predicting query execution time: Are optimizer cost models really unusable? In 2013 IEEE 29th International Conference on Data Engineering (ICDE), pages 1081–1092. IEEE, 2013.
- [34] Z. Yang, Z. Dai, Y. Yang, J. Carbonell, R. Salakhutdinov, and Q. V. Le. Xlnet: Generalized autoregressive pretraining for language understanding. arXiv preprint arXiv:1906.08237, 2019.
- [35] Y. Zhu, J. Liu, M. Guo, Y. Bao, W. Ma, Z. Liu, K. Song, and Y. Yang. Bestconfig: tapping the performance potential of systems via automatic configuration tuning. In Proceedings of the 2017 Symposium on Cloud Computing, pages 338–350. ACM, 2017.