Selecting accreted populations: metallicity, elemental abundances, and ages of the Gaia-Sausage-Enceladus and Sequoia populations
Abstract
Identifying stars found in the Milky Way as having formed in situ or accreted can be a complex and uncertain undertaking. We use Gaia kinematics and APOGEE elemental abundances to select stars belonging to the Gaia-Sausage-Enceladus (GSE) and Sequoia accretion events. These samples are used to characterize the GSE and Sequoia population metallicity distribution functions, elemental abundance patterns, age distributions, and progenitor masses. We find that the GSE population has a mean [Fe/H] and a mean age of Gyr. GSE has a single sequence in [Mg/Fe] vs [Fe/H] consistent with the onset of SN Ia Fe contributions and uniformly low [Al/Fe] of dex. The derived properties of the Sequoia population are strongly dependent on the kinematic selection. We argue the selection with the least contamination is and . This results in a mean [Fe/H] and a mean age of Gyr. The Sequoia population has a complex elemental abundance distribution with mainly high [Mg/Fe] stars. We use the GSE [Al/Fe] vs [Mg/H] abundance distribution to inform a chemically-based selection of accreted stars, which is used to remove possible contaminant stars from the GSE and Sequoia samples.
keywords:
The Galaxy: halo, abundances, formation, kinematics and dynamics, stellar content1 Introduction
The halo of the Milky Way is known to host several accreted stellar populations. Recent estimates find that as much as of the stellar halo mass originates in accreted galaxies (Mackereth & Bovy, 2020; Naidu et al., 2020). The fraction of accreted matter in the halo depends on the Galactocentric radius. Accreted stars can be identified in several ways. Many accreted stellar populations can be identified in phase-space (e.g. Koppelman et al., 2019; Naidu et al., 2021). Elemental abundance patterns can also be used to identify accreted populations because stars born together have similar abundance patterns (see Freeman & Bland-Hawthorn, 2002; Nissen & Schuster, 2010; Hayes et al., 2018). In addition, local dwarf galaxies are known to have elemental abundance patterns that are distinct from those found in the Milky Way (Venn et al. 2004; Tolstoy, Hill & Tosi 2009). Pre-Gaia efforts to identify accreted stars were limited to stellar populations that had experienced minimal disruption and could therefore be visually associated either in phase-space or on the sky (Helmi et al., 1999; Belokurov et al., 2006). However, elemental abundance measurements of nearby dwarf stars with halo kinematics suggested a significant accreted population was present (Nissen & Schuster, 2010). Identifying and characterizing these accreted populations and their progenitor galaxies provides a glimpse of the Milky Way’s history and give constraints for the assembly history of galaxies (e.g. McConnachie et al., 2009; Cooper et al., 2010; Deason et al., 2013).
With the astrometric measurements of over a billion stars from the Gaia mission (Gaia Collaboration et al., 2018a) has come the discovery of the Gaia-Sausage-Enceladus (GSE) accretion event (Belokurov et al., 2018; Helmi et al., 2018) as well as several other accreted populations (see Koppelman et al., 2019; Naidu et al., 2020; Kruijssen et al., 2020; Malhan et al., 2021), including the Sequoia accretion event identified by Myeong et al. (2019). Significant efforts have been made to characterize these accreted populations, primarily using kinematic selections, and their progenitor galaxies. In this paper, we focus on characterizing the kinematic properties and elemental abundance patterns of the GSE and Sequoia populations in order to determine the mass of the progenitors and the age of their stellar populations with the aim to further our understanding of the Milky Way’s assembly history.
The GSE population has been the focus of many studies since its discovery, however, there remains some uncertainty about how best to select population members and therefore its properties, such as mean metallicity, remain uncertain. Belokurov et al. (2018) identified an elongated kinematic structure narrowly centered around zero velocity in the azimuthal direction with a large range of velocities in the radial direction that is considered a signature of the accreted population. Helmi et al. (2018) identified a general overdensity of stars with low to retrograde angular momentum and high orbital energy, which also have an [/Fe] abundance pattern consistent with an accreted origin and a mean metallicity of dex. Koppelman et al. (2019) identified several distinct populations in the retrograde halo using a clustering algorithm and constrained GSE members to , finding a metallicity distribution in agreement with Helmi et al. (2018). Feuillet et al. (2020) defined a GSE selection based on stellar metallicities and found stars with and high radial action have a narrow metallicity distribution function centered at [Fe/H] , suggestive of a single population. Conroy et al. (2019) found highly radial halo stars have a mean [Fe/H] , in agreement with the kinematics and metallicity found by Feuillet et al. (2020). Many studies of subsamples of halo stars that likely include, but are not selected to be exclusively, GSE stars find mean metallicities between and dex (Haywood et al. 2018; Hayes et al. 2018; Sahlholdt, Casagrande & Feltzing 2019; Gallart et al. 2019; Conroy et al. 2019; Mackereth et al. 2019; Amarante, Smith & Boeche 2020). Naidu et al. (2020) detailed several of the stellar structures now known in the halo, including the GSE population, which they limited to high eccentricity stars and found the metallicity distribution function to be well fit by a simple chemical evolution model with a mean [Fe/H] , also in agreement with Feuillet et al. (2020).
The mass of the GSE progenitor has been estimated using several methods. Belokurov et al. (2018) used cosmological simulations to constrain the virial mass to be less than M⊙. Mackereth et al. (2019) constrained the stellar mass to be M⊙ by comparing dynamics and elemental abundances of accreted stars identified in APOGEE with EAGLE simulations. Mackereth & Bovy (2020) refined this estimate to be M⊙ for GSE using an analytical model of the Milky Way and APOGEE data. Mass estimates using mass-metallicity relations (Feuillet et al., 2020; Kruijssen et al., 2020; Naidu et al., 2020) or chemical evolution modeling (Helmi et al., 2018; Fernández-Alvar et al., 2018; Vincenzo et al., 2019) range from to M⊙ for the stellar mass of GSE.
Myeong et al. (2019) found that several of the metal-poor, retrograde, halo globular clusters are likely accreted from a single progenitor, which they name the Sequoia. They find the Sequoia population has a mean [Fe/H] of dex. Matsuno, Aoki & Suda (2019) find a similar metallicity for high energy retrograde stars, [Fe/H] . Monty et al. (2020) found kinematic evidence for two groups within the Sequoia population, which combined have a metallicity distribution that agrees with Myeong et al. (2019). Naidu et al. (2020) found that the high energy, retrograde stars typically assigned to Sequoia have three peaks in the MDF, which they assigned to three different populations, Arjuna, Sequoia, and I’itoi, and argued that the most metal-rich population may be a retrograde tail of GSE.
The stellar mass of the Sequoia progenitor is estimated to be approximately an order of magnitude lower than that of GSE. Myeong et al. (2019) estimated the Sequoia mass to be M⊙ using the mass-metallicity-redshift relation of Ma et al. (2016). Kruijssen et al. (2020) estimated the Sequoia progenitor to be M⊙ using a neutral network to compare cosmological simulations with the distribution of globular clusters associated with various accreted populations. By assuming a relation between halo mass and total number of globular clusters, Forbes (2020) also estimate a stellar mass of M⊙ for the Sequoia.
The age of the GSE and Sequoia populations has not been robustly measured. The age of the blue sequence of the dual halo sequence (Gaia Collaboration et al., 2018b) has been estimated using isochrone fitting to be older than Gyr (Gallart et al., 2019; Sahlholdt et al., 2019). The accreted halo has been estimated to be older than Gyr by Bonaca et al. (2020) and older than Gyr by Das, Hawkins & Jofré (2020). Di Matteo et al. (2019) found that halo stars in APOGEE with low-[Mg/Fe] and kinematic similarities to the GSE population have ages of Gyr. In a sample of stars with asteroseismic measurements, Montalbán et al. (2021) find seven stars with low-[Mg/Fe] and high eccentricity, consistent with the GSE population, which have a mean age of Gyr. The GSE and Sequoia progenitors are estimated to have first formed and Gyr ago, respectively, by Forbes (2020) using the age-metallicity relation of globular clusters associated with each population. Vincenzo et al. (2019) modeled the chemical evolution of GSE and predicted the mean stellar age to be Gyr.
While it is hoped that strong chemical tagging, as described in Bland-Hawthorn, Krumholz & Freeman (2010), can be used to identify stars that formed in the same cluster with extremely high-precision elemental abundance measurements, weak chemical tagging has already been used with current spectroscopic surveys to identify stars that formed at the same Galactocentric radius or in the same type of stellar system (e.g. Minchev et al., 2018; Hasselquist et al., 2019). Elemental abundance measurements of stars in local dwarf galaxies show that these systems are chemically distinct from Milky Way disc stars and often from other low-mass systems (e.g. Shetrone et al., 2003; Venn et al., 2004; Tolstoy et al., 2009; Hasselquist et al., 2017; Nidever et al., 2020).
Certain elements have been found to have more diagnostic power than others when searching for accreted stars. Elemental abundance measurements in stars belonging to nearby or recently accreted dwarf galaxies can provide a prediction of the possible elemental abundance patterns expected in accreted stellar populations as compared to the Milky Way stellar populations. The nearby Magellanic Clouds have been found to be deficient in -elements relative with the Milky Way (Lapenna et al., 2012; Mucciarelli et al., 2014; Nidever et al., 2020). Hasselquist et al. (2017) found the recently accreted Sagittarius dwarf spheroidal galaxy to be deficient in 14 elements relative to the Milky Way using APOGEE data and confirmed these elemental abundance patterns are also present in stars belonging to the Sagittarius stream in follow-up work (Hasselquist et al., 2019).
A population of stars belonging to the halo with low -element and [Ni/Fe] abundances has been explored as a possible accreted population (see Nissen & Schuster, 2010) and found to be deficient not only in -elements and Ni, but also in C+N and Al by Hayes et al. (2018). Das et al. (2020) used the [Mg/Mn] vs [Al/Fe] chemical plane as suggested by Hawkins et al. (2015) to select likely accreted stars from the Milky Way halo using APOGEE DR14 data. They found these accreted stars to be between and Gyr old. The patterns of neutron capture elements of stars in nearby dwarf galaxies are known to be distinct from the main Milky Way stellar populations (e.g. Tolstoy et al., 2009; Reichert et al., 2020). However, neutron capture elements are not available for a majority of the APOGEE dataset, which is used in this study (see exceptions in Hasselquist et al., 2016; Cunha et al., 2017).
A few studies have now inspected the elemental abundances of stars belonging to the GSE and Sequoia populations. Myeong et al. (2019) found the two populations to have lower Mg and Al abundances than the Milky Way, and to be distinct from each other. Samples of low [Mg/Fe], [Al/Fe] halo stars (such as those found by Nissen & Schuster, 2010; Hayes et al., 2018; Hasselquist et al., 2019) probably contain stars belonging to GSE, Sequoia, or both.
In this paper, we use the kinematics and elemental abundances of stars observed with Gaia and APOGEE to determine selection criteria for the GSE and Sequoia populations (§3). With these samples we characterize the metallicity, elemental abundances, and age distribution of both populations (§4) and further refine their selection (§5). We discuss our findings and their implications in §6.
2 Data
In this study we use data from the Gaia Data Release 2 (Gaia DR2) (Gaia Collaboration et al., 2018a) and the APOGEE survey (Majewski et al., 2017) Data Release 16 (DR16 Ahumada et al., 2019; Jönsson et al., 2020). All stars are required to have parallax measurement relative uncertainties . We are interested in selecting stars in various kinematic spaces, therefore we define two datasets for our analyses: 1) stars in the Gaia DR2 Radial Velocity Spectrometer (RVS) catalogue and 2) a crossmatch between APOGEE DR16 and Gaia DR2.
Radial velocity measurements and distance estimates are needed for each sample to calculate kinematic properties. The Gaia DR2 RVS sample provides the larger dataset with full kinematic measurements down to . For this dataset we use the Gaia DR2 RVS radial velocity measurements (Cropper et al., 2018), distances from Schönrich, McMillan & Eyer (2019), and Gaia DR2 astrometry. The APOGEE DR16 + Gaia DR2 sample provides a smaller sample for which detailed elemental abundances are available down to , which roughly corresponds to for the giant stars used in this study. For this dataset we use the APOGEE radial velocity measurements, distances from Bailer-Jones et al. (2018), and Gaia DR2 astrometry. The full space velocities, actions, and orbital energies were calculated by us with galpy using the ‘MWPotential2014’ Galactic potential (Bovy & Rix, 2013; Bovy, 2015). Our study uses velocity in Galactocentric cylindrical coordinates, tangential velocity (), radial velocity (), and velocity in the direction (). We also make use of the integrals of motion, focusing on angular momentum in the direction (), radial action (), and total orbit energy ().
Additional quality selection criteria are needed for the APOGEE DR16 + Gaia DR2 sample to select stars with the highest precision in the elemental abundance measurements (see Jönsson et al., 2020). In particular, we limit our study to giant stars in order to avoid stars forming the [Mg/Fe] ‘belly’ noted by Jönsson et al. (2020). We also remove stars with any STARFLAG or ASPCAPFLAG flags set, which indicate possible issues with the data reduction and spectral analysis (Jönsson et al., 2020). The quality cuts imposed are listed in Table 1. In addition to these quality cuts, we also remove stars in fields targeted for known clusters or accreted populations. This is done on each of the GSE and Sequoia kinematically selected samples. Examples of removed fields include those focused on Sagittarius and the Magellanic Clouds. A full list of the fields removed from the final dataset is give in Table 3. Although cluster members could in principle be removed from the RVS sample as well, only subgiants are used to determine age and our RVS sample is too bright to contain subgiant cluster members, see Section 4.3.2.
3 Membership Criteria and Metallicity Distribution Functions
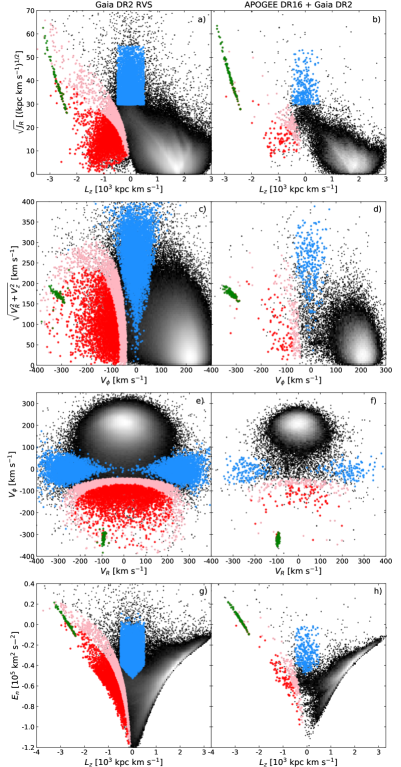
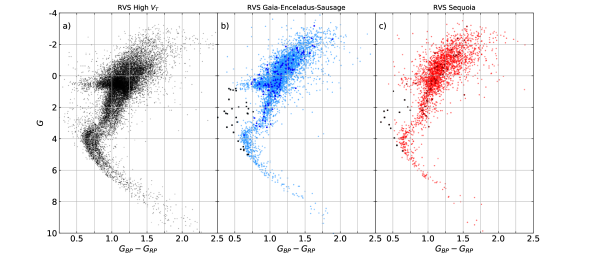
The possible GSE and Sequoia member stars are selected kinematically and some refinement in selection is done based on elemental abundances. Figure 1 shows the kinematic distributions of the full Gaia DR2 RVS (left) and APOGEE DR16 + Gaia DR2 (right) samples in four different spaces: a, b) vs , c, d) vs , e, f) vs , and g, h) vs .
The majority of stars have disc-like kinematics (motions dominated by rotational velocity in the prograde direction), but both samples extend to high , high , and highly retrograde orbits, regions where accreted populations are most apparent. The stars selected as GSE are shown in blue and the Sequoia candidate members identified in this work are shown as red and pink points, see Section 3.2. Details of the selection criteria are described below and summarized in Table 2. In both the Gaia DR2 RVS and APOGEE DR16 + Gaia DR2 data, the globular cluster NGC 3201 is striking as the highly retrograde, high energy overdensity shown in green. This cluster has been associated with the Sequoia population by Myeong et al. (2019) using actions and energy.
| Property | Value |
|---|---|
| SNR | |
| STARFLAG | |
| ASPCAPFLAG | |
-
•
Note. — Selection criteria for stars from the APOGEE DR16 + Gaia DR2 sample, see Section 2.
3.1 Identifying GSE Members
The GSE stars were selected using angular momentum () and radial action (), Figure 1 a and b, following the ‘clean’ GSE selection from Feuillet et al. (2020). Using SkyMapper [Fe/H] (Casagrande et al., 2019) crossmatched with Gaia DR2 RVS, Feuillet et al. (2020) found that stars with (kpc km s and kpc km s-1 present the least-contaminated sample of kinematically selected GSE stars based on the [Fe/H] distribution. With the order of magnitude larger Gaia DR2 RVS only sample, an extension of the GSE structure at higher is apparent. These stars were not present in the Feuillet et al. (2020) study because the SkyMapper sample was limited to parallax uncertainties less than . Using the high APOGEE DR16 + Gaia DR2 stars, we confirm that the [Fe/H] distribution of these stars is consistent with the main GSE population. We therefore extend our selection of GSE stars from both the Gaia DR2 RVS and APOGEE DR16 + Gaia DR2 datasets to (kpc km s.
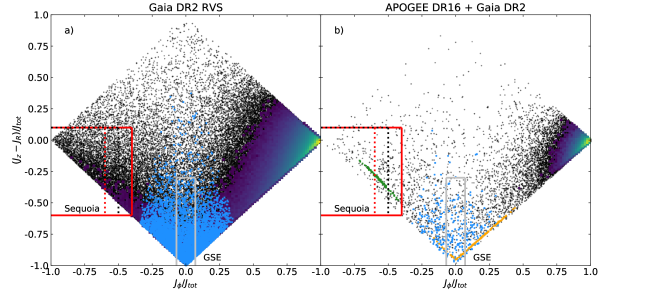
Myeong et al. (2019) provide a GSE selection in the so-called action space map, which uses on the horizontal axis and on the vertical axis, see Figure 2. We find that while GSE stars selected following the prescription in Myeong et al. (2019) do overlap in all kinematic spaces with the stars selected using the Feuillet et al. (2020) criteria, neither is a subset of the other. The Feuillet et al. (2020) selection is more extended in , while Myeong et al. (2019) selects stars with lower and . Figure 2 shows the GSE stars selected in the current work as blue points while the Myeong et al. (2019) ‘Sausage’ selection is much narrower, as indicated by the grey lines. We find that GSE stars selected from the APOGEE DR16 + Gaia DR2 sample using the Myeong et al. (2019) criteria have a mean [Fe/H] that is dex higher than when selected using Feuillet et al. (2020) criteria. This is apparent in Figure 3 b.
A second cluster streak can be seen along the bottom right side of panel b in Figure 2 overlapping with the GSE points, and is also identifiable in several panels of Figure 1. This is the globular cluster M4, which has a mean [Fe/H] of based on APOGEE metallicity and has not been associated with GSE.
Our final GSE sample selected from the Gaia DR2 RVS sample contains 5478 stars and our APOGEE DR16 + Gaia DR2 sample of the GSE contains 323 stars before possible cluster stars are removed and 299 stars without stars in cluster fields. Kinematic selection criteria are given in Table 2. We explore the abundance trends and ages of the GSE samples in Sections 4 and 5.
| Population | Source | Selection | N Stars | |||
|---|---|---|---|---|---|---|
| APOGEE | RVS | |||||
| GSE | This work | 299 | 5478 | |||
| Feuillet et al. (2020) | 292 | 5271 | ||||
| Myeong et al. (2019) | 312 | 4994 | ||||
| Sequoia | This work | 244 | 6379 | |||
| Myeong et al. (2019) | 155 | 4293 | ||||
| Sequoia 06 | This work | 79 | 2790 | |||
-
•
Note. — Numbers of stars given for the APOGEE DR16 + Gaia DR2 samples have stars in certain fields removed, as listed in Table 3.
3.2 Finding the Sequoia
To select Sequoia stars, we follow Myeong et al. (2019) and use the action space map. In this space, Myeong et al. (2019) select Sequoia stars as and (black dotted lines in Figure 2). In Figure 2, NGC 3201 is easily identifiable in the Sequoia selection region of the APOGEE DR16 + Gaia DR2 data as an overdensity streak. Cluster members, identified in APOGEE DR16 + Gaia DR2 using [Fe/H] and kinematics, are shown as green points and extend beyond the Myeong et al. (2019) selection region. We therefore test different Sequoia selection limits in . Our main Sequoia selection extends to in order to include all NGC 3201 member stars. This selection is indicated by the solid red lines in Figure 2 and plotted as the red + pink points in Figure 1. An alternative, more conservative Sequoia selection, which is limited to , is indicated by the dotted red lines in Figure 2 and the red points in Figure 1. We refer to the sample selected in this way as Sequoia 06, see Table 2. We evaluate these selection limits using the MDFs and abundance distributions, see discussion in Section 4.
The final Sequoia and Sequoia 06 samples selected from the Gaia DR2 RVS catalogue contain 6379 and 2790 stars, respectively. The APOGEE DR16 + Gaia DR2 samples of the Sequoia and Sequoia 06 contain 372 and 116 stars, respectively, before possible cluster stars are removed and 244 and 79 stars, respectively, without stars in cluster fields. We explore the abundance trends and ages of the Sequoia and Sequoia 06 samples in Sections 4 and 5.
4 Characterizing Gaia-Sausage-Enceladus and Sequoia
4.1 Metallicity Distribution Functions
4.1.1 GSE
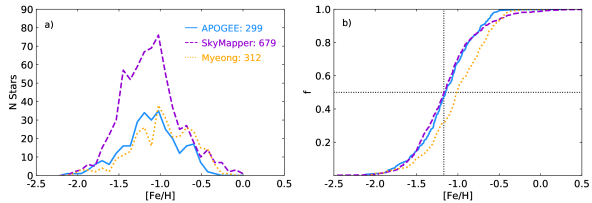
Figure 3 compares the MDF of the GSE stars selected from APOGEE DR16 + Gaia DR2 (blue) with the MDF found by Feuillet et al. (2020) using SkyMapper photometric metallicities (purple). In Figure 3 b, which shows the cumulative MDF (CDF), the dotted lines indicate the 50% cumulative fraction and the median [Fe/H] of the SkyMapper sample, dex. The APOGEE DR16 + Gaia DR2 median [Fe/H] is almost exactly the same as the one found using SkyMapper data. The MDF shapes are also very similar, the main difference being that the SkyMapper MDF has a metal-rich tail while the APOGEE DR16 + Gaia DR2 MDF has a metal-rich secondary peak around [Fe/H] . The Myeong et al. (2019) GSE selection applied to APOGEE (yellow) also has a metal-rich peak, however, both of these metal-rich peaks are within the Poisson noise of their distributions. The agreement serves as a good validation of both the SkyMapper metallicities and the GSE selection criteria of Feuillet et al. (2020).
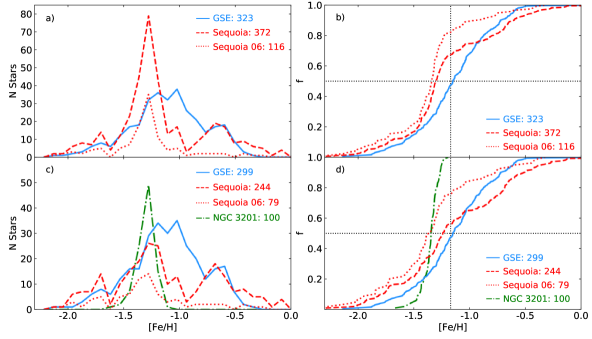
Figure 4 shows the MDF and CDF of GSE stars in blue using APOGEE DR16 + Gaia DR2 [Fe/H]. The top panels (a, b) show the kinematically selected APOGEE DR16 + Gaia DR2 GSE sample with only the quality selection criteria imposed (Table 1), but no stars removed based on the APOGEE ‘FIELD’ parameter (Table 3). This distribution is used when determining the GSE population age from the Gaia DR2 RVS sample, see Section 4.3.2. The bottom panels (c, d) show the APOGEE DR16 + Gaia DR2 GSE sample with stars in select fields removed, as described in Section 2. We find that GSE has a mean [Fe/H] of dex in both cases. The metal-rich peak is also present in Figure 4 a and c although 24 stars have been removed in Figure 4 c.
4.1.2 Sequoia
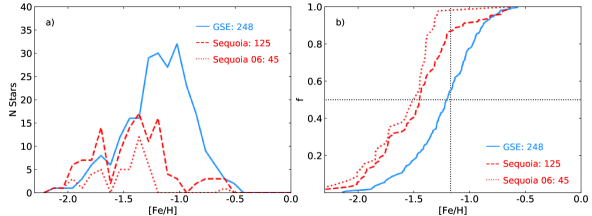
Figure 4 shows the MDF and CDF of Sequoia stars in red. Figure 4 a and b show the kinematically selected APOGEE DR16 + Gaia DR2 Sequoia and Sequoia 06 samples with only the quality selection criteria imposed (Table 1), but no stars removed based on the APOGEE ‘FIELD’ parameter (Table 3). Figure 4 c and d show the APOGEE DR16 + Gaia DR2 Sequoia and Sequoia 06 samples with stars in select fields removed, as described in Section 2. NGC 3201 cluster members are shown separately in green. The alternative Sequoia selection, Sequoia 06, is shown by the dotted red lines. We find that Sequoia has a mean/median [Fe/H] of dex when NGC 3201 is included and dex without it. In both cases, a metal-rich secondary peak is present around [Fe/H] and a tertiary metal-poor peak around [Fe/H] , however, this metal-poor peak is within the Poisson noise. When NCG 3201 is not included in the main Sequoia sample, the main peak is consistent with the very narrow peak of NGC 3201, which has a mean [Fe/H] of dex and a standard deviation of dex.
The Sequoia 06 selection has a mean [Fe/H] of dex both with and without NGC 3201. The main peak of the Sequoia and Sequoia 06 samples are consistent. There is no peak at dex in the Sequoia 06 sample, although metal-rich starts are present in small numbers, but the dex peak is present. In both the Sequoia and Sequoia 06 samples, the metal-rich contribution is particularly striking in the CDFs after the sharp increase around [Fe/H] .
4.1.3 Comparisons
Using APOGEE DR14 data, Myeong et al. (2019) found that GSE and Sequoia have different [Fe/H] distributions. We visit this finding with a larger sample from APOGEE DR16 + Gaia DR2. For our samples, the main peak of the GSE MDF is broader and more metal-rich than the main peak of the Sequoia MDF. However, the range of metallicities covered by the Sequoia sample is slightly larger than the GSE sample, extending to both higher and lower [Fe/H].
Both have a secondary metal-rich peak around [Fe/H] , which is not present in the more restricted Sequoia 06 sample. The similarity of this peak between GSE and Sequoia suggests the stars comprising the peak may be in situ Milky Way stars such as kinematically heated thick disc stars. In addition, many of the stars contributing to this peak in both GSE and Sequoia have disc-like elemental abundances, see Figure 5 and Section 5. This supports Sequoia 06 as the cleaner sample of Sequoia stars as the metal-rich (likely in situ) peak is not present.
4.2 Elemental Abundances
Distinct accreted populations can often be identified by their elemental abundance patterns. Many studies have shown that the elemental abundance patterns of accreted populations in the Milky Way are different from the main in situ population’s elemental abundances (e.g. McWilliam, Wallerstein & Mottini 2013; Hasselquist et al. 2017; Das et al. 2020; Hayes et al. 2018) and local dwarf galaxies are known to have distinct elemental abundance patterns (see Reichert et al., 2020). This is thought to be caused primarily by different star formation rates, however, there could be other contributing factors such as variations in the initial mass function (e.g. Carlin et al., 2018). In addition to having different peak [Fe/H], Myeong et al. (2019) also conclude that GSE and Sequoia have distinct elemental abundance patterns in [Mg/Fe] and [Al/Fe].
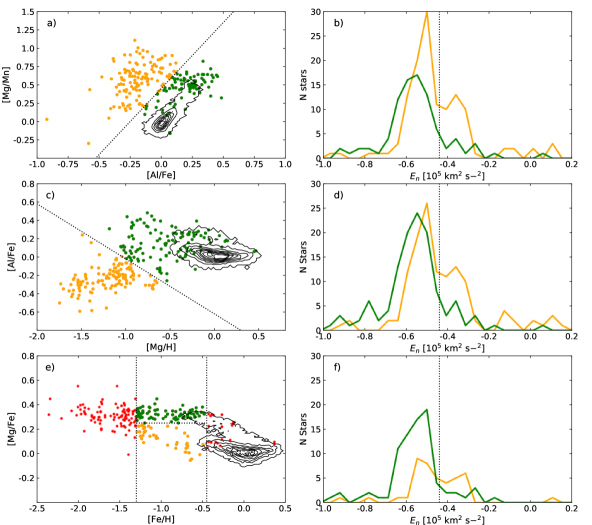
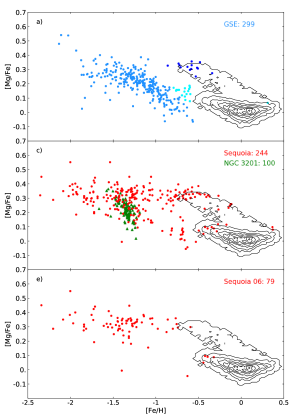
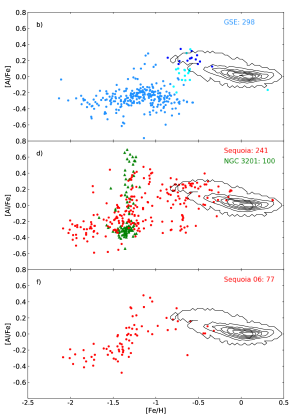
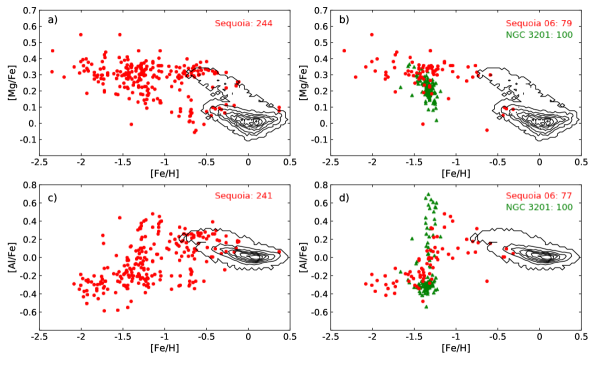
Figure 5 shows [Mg/Fe] and [Al/Fe] abundance distributions as a function of [Fe/H] for GSE (blue), Sequoia (red), and NGC 3201 (green) using APOGEE DR16 + Gaia DR2. For reference, the black contours show the distribution of solar neighborhood ( , ) APOGEE DR16 + Gaia DR2 giant stars meeting with same quality criteria as the GSE and Sequoia samples, see Section 2.
4.2.1 GSE
The GSE population lies mainly along a single narrow track in [Mg/Fe] vs [Fe/H] (Figure 5 a), with a ‘knee’ at [Fe/H] and a metal-poor plateau at [Mg/Fe] . Some stars are present at high [Mg/Fe] and high [Fe/H], highlighted in darker blue, and are consistent with the high-[Mg/Fe] disc distribution. Other possible in situ stars are highlighted in lighter blue and are consistent with the metal-poor end of the low-[Mg/Fe] disc. Together, these disc-like stars contribute to the dex peak in the GSE MDF that was suggested to comprise in situ stars, see Section 4.1.3. Both subsamples are also indicated in panel b and have high [Al/Fe], consistent with the Milky Way disc populations.
The [Al/Fe] of most of the GSE stars is much lower than the Milky Way disc, at [Al/Fe] , consistent with GSE in Myeong et al. (2019) and that of other known accreted populations (e.g. Sagittarius, Hasselquist et al., 2017). The distribution is approximately flat in [Al/Fe] vs [Fe/H] (Figure 5 b) with a slight peak in [Al/Fe] around [Fe/H] . Some stars have higher [Al/Fe] abundance ratios. In particular, some stars at [Fe/H] have an [Al/Fe] consistent with the Milky Way disc distributions. As indicated in Figure 5, these stars also have [Mg/Fe] values consistent with the MW disc populations. The difference in abundance at the metal-rich end is larger in [Al/Fe] than in [Mg/Fe], particularly for the low-[Mg/Fe] stars, suggesting that Al may be a better diagnostic of accreted origins in individual stars.
4.2.2 Sequoia
Figure 5 c and d show the main Sequoia selection while Figure 5 e and f show the Sequoia 06 selection. The Sequoia stars appear to follow multiple tracks in [Mg/Fe] vs [Fe/H], one high [Mg/Fe] track consistent with the canonical halo/thick disc track and a less populated lower [Mg/Fe] track similar to the track followed by GSE. The dual tracks suggest there are multiple populations contributing to the Sequoia sample selected here. NGC 3201 (shown in green triangles) sits at the metal-poor end of the Sequoia lower [Mg/Fe] sequence, slightly below the majority of the Sequoia stars in [Mg/Fe].
The Sequoia 06 distribution lies mainly along the high-Mg track, but still has a few stars along the low-Mg track. Comparing the abundance distributions of these two Sequoia selections, we find that the more conservative Sequoia 06 selection produces a distribution that more closely resembles a single population, especially in comparison with the low apparent contamination of the GSE distribution. The high-Mg track resembles the elemental abundance pattern seen generally in the Milky halo and the [Mg/Fe] trend predicted by chemical evolution models of the Milky Way (e.g. Romano et al., 2010; Andrews et al., 2017). However, we note the large variations in abundance trend predictions of chemical evolution models resulting in small changes to the model assumptions such as star formation rate or theoretical yields (see Matteucci, 2021, for a review). While chemical evolution models have been made to fit observations of dwarf galaxies and GSE (e.g. Vincenzo et al., 2019), these efforts are intended to constrain the properties of the progenitor galaxy, not provide predictions of the elemental abundance trends of low-mass systems.
Similarly to the [Mg/Fe] distribution, the Sequoia stars have an [Al/Fe] vs [Fe/H] distribution suggestive of multiple populations contributing, a low-[Al/Fe] population and a high-[Al/Fe] population. The low [Al/Fe] sequence extends to lower [Fe/H], while the high [Al/Fe] stars are consistent with the Milky Way disc populations and extend to higher [Fe/H]. The Sequoia 06 selection does not have the low [Al/Fe] extension at higher [Fe/H] and also has few stars overlapping with the main disc distribution. NCG 3201 has an extended [Al/Fe] distribution ( dex), consistent with known abundance patterns in globular clusters (e.g. Mészáros et al., 2020). Most of the stars, considered to be the first generation stars, have Al abundances lower than the Sequoia stars at the same [Fe/H].
From the MDFs as well as the [Mg/Fe] and [Al/Fe] abundance distributions of the two Sequoia selections we examined, we conclude that the Sequoia 06 selection, although much smaller, provides a sample that has significantly less contamination. As a clean sample is crucial to determining the true Sequoia abundance patterns, we continue our analysis using the Sequoia 06 selection. The stars with [Fe/H] to with low [Mg/Fe] and low [Al/Fe] that are removed using the Sequoia 06 selection have abundance patterns consistent with GSE. These stars could be a retrograde extension of GSE, suggesting that the GSE stars occupy a large range of kinematic space. It is also conceivable that an elemental abundance gradient within Sequoia at the time of infall could result in a trend in [Al/Fe] with , causing the change in abundance distribution with a different kinematic selection.
As the Sequoia is usually characterized as a high energy population, we explore possible differences in the orbital energy distribution of the two [Mg/Fe] branches seen in the Sequoia distribution in Appendix C. We find that the low [Mg/Fe] branch has an excess of high energy stars compared to the high [Mg/Fe] branch. However, we do not find that a Sequoia sample selected using orbital energy results in elemental abundances that are obviously better than the Sequoia 06 selection. We therefore continue our analysis using Sequoia 06 and present the high energy Sequoia distributions in Figures 14 and 15.
4.3 Ages of GSE and Sequoia
4.3.1 CMD Inspection
The samples selected from the Gaia DR2 RVS catalog are large and contain full population sequences, including subgiant stars, which can be seen in the color-magnitude diagrams (CMDs) in Figure 6. For the Sequoia population we use the Sequoia 06 selection, which Figure 5 suggests contains less contamination from in situ Milky Way stars. Figure 6 a shows the high tangential velocity ( km s-1) stars in Gaia DR2 RVS, corresponding to the selection by Gaia Collaboration et al. (2018b) that demonstrated the dual nature of such a sample. We find that while the Sequoia 06 sequence is slightly redder than the GSE sequence, both are consistent with the blue sequence of the high sample, which has been found to be more metal poor than the red sequence and likely mainly composed of accreted stars (e.g. Haywood et al., 2018; Sahlholdt et al., 2019; Gallart et al., 2019).
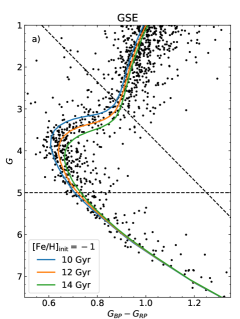
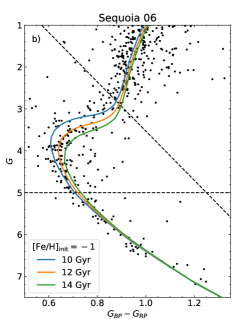
The CMDs based on the Gaia DR2 RVS data allow for age estimates using isochrone fitting. We correct the Gaia magnitudes for extinction using reddening estimates, , from the Stilism project (Lallement et al., 2019) and the mean extinction coefficients for the Gaia passbands given by Casagrande & VandenBerg (2018). Initial population age information can be gained from Figure 7, which focuses on the subgiant region of GSE and Sequoia 06. PARSEC isochrones (Bressan et al., 2012) of initial [Fe/H] are shown for , , and Gyr. The majority of stars in the turn off and subgiant region of GSE are consistent with an age of Gyr. The majority of Sequoia 06 stars in the turn off and subgiant region are consistent with an age of Gyr.
4.3.2 Age Calculations
For a more robust age analysis, PARSEC isochrones are fitted to the -band magnitude, color, and parallax in order to obtain two-dimensional (age-metallicity) probability density functions (PDFs) for all stars following Howes et al. (2019). For this analysis we assume a Salpeter initial mass function (Salpeter, 1955) as the prior on mass. This is done for both the GSE and Sequoia 06 Gaia DR2 RVS samples separately selecting only stars around the turnoff of the CMD (indicated by the dashed lines in Figure 7).
Since we do not have metallicity information for the full Gaia DR2 RVS sample, we make the assumption that the metallicity distributions for the Gaia DR2 RVS GSE and Sequoia 06 samples are the same as those of the corresponding APOGEE DR16 + Gaia DR2 samples for the same kinematic selection. In the Gaia DR2 RVS sample, no attempt has been made to remove stars belonging to clusters as was done with the APOGEE DR16 + Gaia DR2 sample, described in Section 2. The [Fe/H] distributions assumed are the ones shown in panel a of Figure 4. To include the assumed metallicity, we marginalize the metallicity in each individual age-metallicity PDF with a metallicity distribution prior as shown below.
| (1) |
where is the 2D PDF from isochrone fitting and ([M/H]) is the metallicity prior.
The metallicity used in this prior is adjusted to account for the -enhancement of the GSE and Sequoia populations according to Salaris, Chieffi & Straniero (1993),
| (2) |
where [Mg/Fe] from APOGEE is used as the -abundance. This gives for each star an age PDF from which individual ages can be estimated, in this case we use the mode of the distribution. The uncertainties in the individual age estimates range from , with a mode of .
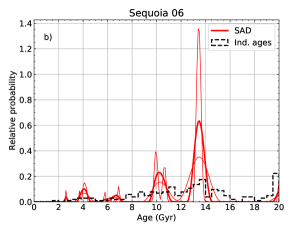
In addition to the individual ages, we estimate the sample age distribution (SAD) for each of the GSE and Sequoia 06 samples, using the method of Sahlholdt & Lindegren (2021) to combine the age PDFs. The SAD, , is calculated by minimising the negative log-likelihood given by
| (3) |
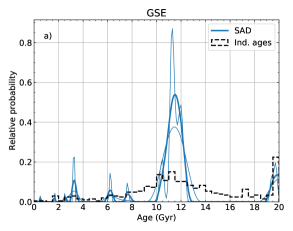
where the second term determines the smoothness of the solution. The smoothing is regulated in strength by the parameter and Gyr is the resolution in age. Both the individual age distribution and the SAD are shown in Figure 8. The SAD is shown for a fiducial value of and for (no smoothing) and to illustrate that the existence and positions of the main peaks are independent of this choice.
We find the GSE stars have an age between and Gyr and the age distribution shows a single peak in both individual ages and the SAD. For Sequoia 06, the stars are found to have a slightly wider, and on average older, distribution. The SAD shows two peaks, one between and Gyr and the other between and Gyr. These two peaks are most likely associated with in situ stars and stars from the actual Sequoia population, respectively. The relative contribution of the younger peak is consistent with the in situ contamination expected from the elemental abundance distributions, see Figures 5 and 9. If true, this indicates that the Sequoia population is slightly older than the GSE population as suggested by Kruijssen et al. (2020). However, we lack the individual metallicities of the Gaia DR2 RVS samples in order to firmly establish a connection between the age peaks and the different populations (accreted or formed in situ). In any case, the ages confirm that both the GSE and Sequoia populations are old which supports the hypothesis that they could have been accreted some time Gyr ago.
Besides the main peaks in the SADs, both GSE and Sequoia have smaller peaks at the oldest age, Gyr, as well as several younger peaks, less than Gyr. The Gyr peak is caused by the isochrone grid edge and is a known feature of age distributions determined using a finite grid of isochrones. The young peaks are likely not all due to uncertainties in the age determinations, but represent the presence of younger stars in the samples (see Sahlholdt & Lindegren, 2021, for a detailed assessment of the SAD method). In both samples, of the stars have young ages. These could be young stars in the accreted populations or young Milky Way stars. In either case blue straggler stars are the most likely candidate as indicated by the color and magnitude of stars with individual age estimates less than Gyr, see Figure 6. Casagrande (2020) find the blue straggler fraction in the Milky Way halo, selected as high stars, to be . If close binaries are progenitor of blue stragglers, this is consistent with the increasing fraction of close binaries when moving from metal rich to metal poor stars Moe et al. (2019). Although the young -rich stars seen in the Milky Way disc are not thought to be entirely due to blue straggler stars (Martig et al., 2015; Chiappini et al., 2015), Martig et al. (2015) find the young -rich stars comprise approximately of their sample. The kinematics of the young stars do not allow us to distinguish between an accreted or in situ origin. We also do not have elemental abundances for these Gaia DR2 RVS stars, therefore their origin is unknown at this time, although [Mg/Fe] or [Al/Fe] measurements would shed light on this.
5 Accreted Populations
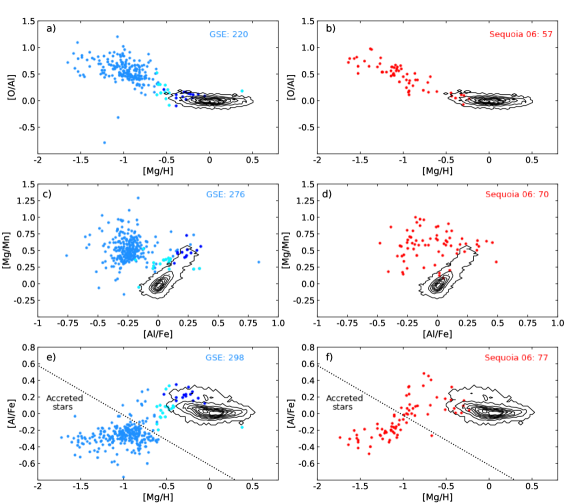
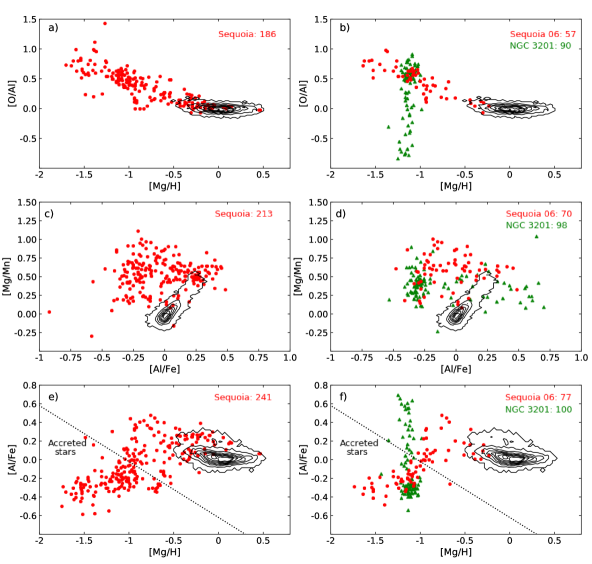
As noted in Section 4, the difference between true GSE and Sequoia stars and the possible in situ contaminant stars is larger in Al abundance than in Mg. Figure 9 shows the abundance distribution of the GSE and Sequoia 06 samples in three different abundance spaces that were found empirically to have significant separation of accreted and Milky Way populations. These abundance spaces are [O/Al] vs [Mg/H] (Figure 9 a, b), [Mg/Mn] vs [Al/Fe] (Figure 9 c, d), and [Al/Fe] vs [Mg/H] (Figure 9 e, f). As in Figure 5, GSE stars consistent with the high- and low-[Mg/Fe] sequences of the Milky Way disc are shown in dark and light blue, respectively. In Figure 9, the Sequoia 06 selection is shown, while the abundance distributions of the broader Sequoia selection can be seen in Appendix B.
GSE stars are significantly separated from the Milky Way disc populations in the [Mg/Mn] vs [Al/Fe] space. They are tightly clustered at high [Mg/Mn] and low [Al/Fe], consistent with the ‘blob’ of likely accreted stars discussed in Das et al. (2020) and consistent with Hawkins et al. (2015). There are again some stars with abundances consistent with the Milky Way disc populations. The distribution of GSE stars in [Al/Fe] vs [Mg/H] is similar to the distribution in [Al/Fe] vs [Fe/H]. The main population lies at low [Al/Fe] across a dex range of [Mg/H]. There are high [Al/Fe] stars at high [Mg/H] that appear to be separate from the main population. There a small gap between these groups of stars in [Al/Fe] vs [Mg/H], indicated by the dotted black line in panel e of Figure 9. We chose this as our separation criteria between accreted and in situ stars because of the more distinct separation and the larger number of stars with both Al and Mg measurements (as compared with the smaller number of stars with Mn or O measurements).
The Sequoia 06 stars follow a similar pattern to GSE in [O/Al] vs [Mg/H], overlapping with the disc distribution at high Mg. However, Sequoia 06 is not tightly clustered in [Mg/Mn] vs [Al/Fe] space. As also seen in the [Al/Fe] vs [Mg/H] distribution, Sequoia have a scattered distribution rather than a distinct overdensity. The Sequoia 06 distribution in [Al/Fe] vs [Mg/H] also shows a sequence with little scatter. Unlike GSE, the Sequoia 06 samples does not show an obvious separation in abundance between accreted and in situ stars. The dotted black line is the same in panels e and f of Figure 9.
For this study we chose to use the same elemental abundance-based selection criteria for accreted stars that was derived from the GSE sample and apply it to the Sequoia 06 sample. The abundance patterns of Sequoia depend heavily on the kinematic selection (see Sequoia versus Sequoia 06 samples, Figure 5), therefore we apply the line defined with the GSE sample and discuss possible repercussions in Section 6.
Figure 10 shows the MDF and CDF of GSE and Sequoia using only stars with [Al/Fe] and [Mg/H] consistent with an accreted origin as indicated in Figure 9. Using this selection, GSE has a mean/median [Fe/H] of dex and Sequoia 06 has a mean/median [Fe/H] of dex. The GSE distribution is slightly more metal-poor than in Figure 4 and has lost the secondary peak at [Fe/H] . The main peak of the Sequoia 06 sample is more metal-poor than the mean of NGC 3201. Only one star remains at high metallicity, consistent with no peak, but the metal-poor peak retains a few more stars. The Sequoia 06 sample only has 45 stars remaining. Figure 10 also shows the broader Sequoia sample after the chemically accreted constraint has been applied (red dashed line), which contains 125 stars and has a distribution consistent with Sequoia 06.
6 Discussion
We present MDFs, elemental abundance distributions, and age distributions of the GSE and Sequoia accreted populations using APOGEE DR16 and Gaia DR2 data. We find that the kinematically selected GSE population has a [Fe/H] peak around dex and a clean sequence in [Mg/Fe] and [Al/Fe]. In [Mg/Fe] vs [Fe/H], the GSE population shows the classic ‘-knee’ around [Fe/H] , with a high-[Mg/Fe] plateau at dex. The [Al/Fe] vs [Fe/H] sequence is fairly flat at [Al/Fe] , with a possible bump in [Al/Fe] at [Fe/H] . The GSE population is also strongly clumped in [Mg/Mn] vs [Al/Fe], as observed for accreted stars by Das et al. (2020).
We find that the GSE population is consistent with being uniformly old, with a strong peak in age between and Gyr. This is in agreement with the mean age of Gyr found by Montalbán et al. (2021) using seven stars with asteroseismic measurements. It is slightly younger (but still consistent within the typical age uncertainties of old stars) than the mean age measured for the blue sequence of the dual halo (Gallart et al., 2019; Sahlholdt et al., 2019) and the accreted halo stars identified by Di Matteo et al. (2019), all of which likely contain GSE stars, in addition to other possible accreted populations. Vincenzo et al. (2019) fit a chemical evolution model to GSE members selected by Helmi et al. (2018) from APOGEE and find the [/Fe] vs [Fe/H] distribution and MDF are fit well by a model with a stellar mass of M⊙ and a median age of Gyr.
A few stars are present that likely do not belong to the GSE population but could be heated Milky Way disc or in situ halo stars. Figures 5 and 9 highlight these stars, as selected in [Mg/Fe] vs [Fe/H] space, in all abundance spaces. With the exception of two low-[Mg/Fe] stars in Figure 9 c, these Milky Way stars have elemental abundances consistent with the disc populations.
The [Al/Fe] vs [Mg/H] distribution of GSE has small gap between the low-[Al/Fe], low-[Mg/H] stars and the high-[Al/Fe], high-[Mg/H] stars. We use this gap to define a chemical separation of accreted and in situ stars. Applying this additional selection criteria to the GSE sample, we find a single peak in the MDF at [Fe/H] , see Figure 10.
In addition to the possible Milky Way stars identified in [Mg/Fe] vs [Fe/H], there are also some high-[Al/Fe], low-[Fe/H], low-[Mg/H] stars that are not consistent with the main GSE population. As the high [Al/Fe] values at low [Fe/H] are similar to the distribution of NGC 3201, we investigate a possible globular cluster origin of the stars. However, we do not find that these stars have a narrow MDF or an elemental abundance pattern similar to NGC 3201 in other abundance spaces. In particular, the [O/Al] vs [Mg/H] distribution of the high-[Al/Fe], low-[Fe/H] GSE stars is consistent with the rest of the GSE sample. This is not the case for NGC 3201, as can be seen in Figure 13. Additionally, the high-[Al/Fe], low-[Fe/H] GSE stars do not clump in any kinematic space investigated in this work. They are, however, all on retrograde orbits, which suggests they may be a low-[Fe/H] extension of the Milky Way disc.
The Sequoia kinematic selections produce a more complex population. The MDF has a primary peak at [Fe/H] and a secondary peak at [Fe/H] . The elemental abundance distributions of the larger Sequoia selection show two sequences in both [Mg/Fe] vs [Fe/H] and [Al/Fe] vs [Fe/H], consistent with the Sequoia G1 and G2 populations found by Monty et al. (2020). One sequence is consistent with the GSE population and one resembles a metal-poor extension of the thick disc. Our more conservative Sequoia 06 selection contains primarily the low [Fe/H], high [Mg/Fe], low [Al/Fe] stars, but still contains some stars consistent with both sequences in the larger Sequoia selection. The Sequoia 06 population is also old with a primary peak in age between and Gyr, and a secondary peak between and Gyr.
Koppelman et al. (2019) suggest Sequoia may not be a separate dwarf population due to its large extent in and low [Fe/H]. Instead they argue that the Myeong et al. (2019) Sequoia selection may comprise a different accreted population at low called Thamnos as well as a retrograde, low [Fe/H] extension of GSE at higher . Based on APOGEE DR16 elemental abundances, we find that some Sequoia stars have [Mg/Fe] and [Al/Fe] consistent with a low [Fe/H] extension of GSE. This suggests an -metallicity gradient in the GSE debris and a radial metallicity gradient in the GSE progenitor, as modeled by Naidu et al. (2021). This interpretation is also supported by the difference in the elemental abundance patterns between our Sequoia and Sequoia 06 selections, see Figure 5. The Sequoia selection extends farther towards GSE in kinematic space than Sequoia 06 and also includes more stars with elemental abundances consistent with the GSE population.
Naidu et al. (2020) consider the highly retrograde halo to host Thamnos at low and three accreted populations at high , Sequoia, Arjuna, and I’itoi. Using metallicities from the H3 survey (Conroy et al., 2019), Naidu et al. (2020) find Sequoia has a mean [Fe/H] of dex, while Arjuna, which contains most of the retrograde high stars, peaks around dex and I’itoi peaks below dex. These MDF peaks are not consistent with our Figure 4, although we do find three peaks. The dex peak in Naidu et al. (2020) is consistent with the low [Fe/H] of Sequoia found by studies using small numbers of high resolution spectra (Monty et al., 2020; Aguado et al., 2021) and LAMOST (Matsuno et al., 2019). If we reinterpret the Sequoia 06 MDF in Figure 4 to match the Naidu et al. (2020) populations, we would associate the main peak at [Fe/H] = with Arjuna and the metal-poor peak at [Fe/H] = with Sequoia. This interpretation would suggest that APOGEE DR16 + Gaia DR2 contains very few Sequoia stars and no I’itoi stars. Naidu et al. (2021) argue that Arjuna is the retrograde debris of GSE, however, we find that the stars contained within the main Fe peak of our Sequoia 06 selection (and most of the Sequoia selection) have a higher [Mg/Fe] than the GSE stars. If we consider the Sequoia selection, instead of Sequoia 06, we find stars at [Fe/H] with [Mg/Fe] and [Al/Fe] consistent with the GSE distribution. These stars could comprise the retrograde GSE/Arjuna stars described in Naidu et al. (2021). It is difficult to separate possible GSE stars from true Sequoia stars below [Fe/H] of .
6.1 Masses
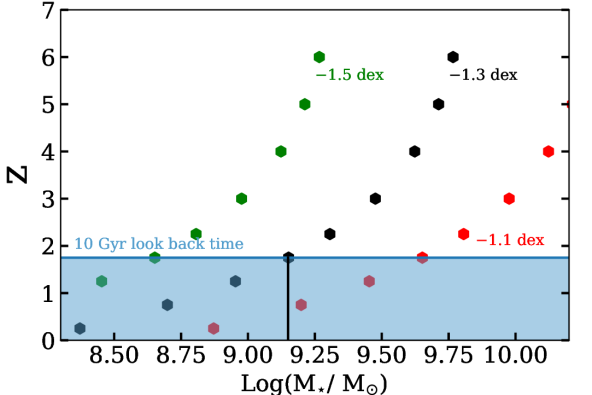
Following the method of Feuillet et al. (2020), which uses the mass-metallicity-redshift relation of Ma et al. (2016) to estimate the progenitor mass of GSE, we estimate the progenitor mass of the Sequoia. As the [Fe/H] of GSE found here is generally consistent with that of Feuillet et al. (2020), we do not modify the progenitor mass estimate for GSE. The dex lower [Fe/H] of the chemically selected GSE members does not change the mass estimate from that estimated in Feuillet et al. (2020) within the uncertainties of the [Fe/H] measurements and the mass-metallicity relation. This suggests that mass estimates in the literature based on the metallicity of GSE samples with possible in situ contamination could also be overestimated.
Figure 11 shows the redshift versus the progenitor mass relation for [Fe/H] dex. If we assume the Sequoia progenitor was accreted around , Gyr ago, and has [Fe/H] , then the mass is estimated to be M⊙. If the true [Fe/H] of Sequoia is much lower, as suggested in Section 5 where the chemically accreted selection is applied, then the progenitor mass could have been as low as M⊙. A smaller mass is supported in Kruijssen et al. (2020), Myeong et al. (2019), and Forbes (2020). A smaller mass is also consistent with a Sequoia metallicity of dex if it was accreted later, such as as suggested by Kruijssen et al. (2020).
6.2 NGC 3201
NGC 3201 is a globular cluster on a retrograde and highly eccentric orbit, designated a ‘young halo’ cluster by Mackey & van den Bergh (2005) and estimated to be Gyr by Muñoz, Geisler & Villanova (2013). Myeong et al. (2019) tentatively associate the cluster with the Sequoia accreted population based on metallicity and orbital properties, while Massari, Koppelman & Helmi (2019) and Kruijssen et al. (2020) find the progenitor to be either GSE or Sequoia. Several other works associate NGC 3201 with the Gjöll Stream found in Gaia DR2 (Ibata, Malhan & Martin, 2019) based on full orbital modelling (Riley & Strigari, 2020; Palau & Miralda-Escudé, 2020) and elemental abundance analysis (Hansen et al., 2020). These later works conclude that the cluster is likely the source of the stream, however, a possible connection with the Sequoia progenitor is not discussed.
The mean metallicity of NGC 3201 is a bit uncertain in the literature. Many studies find a very narrow range of [Fe/H] at around dex (e.g. Carretta et al., 2009; Muñoz et al., 2013; Simmerer et al., 2013; Mucciarelli et al., 2015; Magurno et al., 2018). However, Mészáros et al. (2020) found a higher metallicity, dex, with a scatter in [Fe/H] of dex using APOGEE DR16 data.
We find the mean [Fe/H] of NGC 3201 members within the Sequoia selection to be dex with a standard deviation of dex, similar to that found by Mészáros et al. (2020) also using APOGEE DR16 data. This metallicity is consistent with the Sequoia population, see Figure 4. Whether the individual elemental abundances are also consistent with the Sequoia population is a bit more complex, Figures 5, 12, and 13.
NGC 3201 has a large range of [Al/Fe] abundance ratios consistent with the Mg-Al anti-correlations common to globular clusters (Mészáros et al., 2020). The Sequoia population also has a rise in [Al/Fe] at the same metallicity as NGC 3201. It is unclear whether the spread in the Sequoia population is due to cluster stars not assigned as members, contamination from in situ Milky Way stars, or an enrichment in Al within Sequoia field stars. The low [Al/Fe] clump in NGC 3201, designated as the first generation (see Mészáros et al. (2020) for more details), lies just below the Sequoia 06 sequence in [Mg/Fe] and [Al/Fe], see Figures 12 and 13. The full NGC 3201 sample also lies lower in [Mg/Mn] than the Sequoia 06 sample. The second generation stars of NGC 3201, which agree with some Sequoia stars in [Al/Fe] vs [Fe/H], do not agree with the Sequoia 06 [Al/Fe] vs [Mg/H] behavior, shown in Figure 13 f, or the Sequoia [O/Al] vs [Mg/H] behavior, Figure 13 a. This suggests that there are no stripped NGC 3201 members in the Sequoia field population within the kinematic selection.
Although there are many complexities to account for, we find several inconsistencies in the elemental abundance patterns of NGC 3201 and the Sequoia population.
6.3 Aluminum as a Diagnostic Element
Empirically, Al has been found to be depleted in stellar populations of likely accreted populations (Hayes et al., 2018), known accreted populations like GSE and Sequoia (this work), and the recently accreted dwarf galaxy Sagittarius (Hasselquist et al., 2017, 2019). However, the cause of the low [Al/Fe] abundances in these low-mass systems is not well-understood. From theoretical models of stellar nucleosynthesis (e.g. Woosley, Heger & Weaver, 2002), Al is thought to be produced primarily in Type II supernovae with a metallicity dependence. This has been confirmed observationally in the Milky Way disc populations (Weinberg et al., 2019). In the GSE sample, we see that [Al/Fe] stays flat with increasing [Fe/H] in the same regime where [Mg/Fe] decreases, see Figure 5 a and b. Unless the Al production increases with increased metallicity at a similar rate to the dilution of Type II supernovae ejecta by Type Ia supernovae, there must be another parameter in the low-mass systems that is causing [Al/Fe] to remain low as [Fe/H] increases and [Mg/Fe] decreases.
Although Al appears to be a promising diagnostic element for probing stellar populations of low-mass systems, some consideration of the effects caused by an analysis assuming local thermodynamic equilibrium (LTE) is necessary. Nordlander & Lind (2017) found that the Al abundance recovered with an analysis assume LTE can differ by up to dex from a non-LTE analysis, depending on the metallicity, effective temperature, and surface gravity of the star in question as well as the specific Al line measured. The NIR lines have a relatively small difference () in measured [Al/Fe] in giant stars with [Fe/H] between and and low [Al/Fe]. We find no dependence of [Al/Fe] on effective temperature or surface gravity within the GSE, Sequoia, or Milky Way disc samples. In addition, our APOGEE samples cover a similar range in stellar parameters, as demonstrated in Figure 6, therefore any non-LTE correction applied to the Al abundances would affect all samples in the same way and the relative abundance patterns would remain. We therefore conclude that our results are not significantly biased by non-LTE effects.
7 Conclusions
In this work, we find that the kinematically selected GSE population has Mg and Al abundances consistent with a single accreted system that rapidly formed stars between and Gyr ago. This population has a mean metallicity of dex. The kinematic selection contains a small number of in situ Milky Way stars identified by their elemental abundances, specifically the in situ stars have [Mg/Fe] and [Al/Fe] higher than the main GSE population at a given metallicity, consistent with the elemental abundance patterns of the local Milky Way disc. Blue stragglers stars are present within the sample, but cannot be assigned to GSE or the in situ population given the data used.
The kinematically selected Sequoia population is more complex than GSE. The Mg and Al abundances are indicative of multiple stellar populations occupying the region of the action space map selected, likely consisting of in situ Milky Way stars, accreted stars, and the globular cluster NGC 3201. We present two kinematic selections of the Sequoia, and a third high energy selection in Appendix C. After removal of NGC 3201 members, all selections have signatures of both accreted and in situ populations. The majority of stars in the Sequoia sample formed between and Gyr ago, but a smaller second group of stars is seen with a mean age of around Gyr. The Gyr peak is likely comprised of in situ stars. As in the GSE sample, there are blue stragglers present in the Sequoia sample.
Sequoia has Mg and Al abundances similar to GSE below [Fe/H] , but with larger scatter. Above [Fe/H] , the abundance pattern of the Sequoia sample depends on the specific kinematic selection. The larger Sequoia sample diverges in both [Mg/Fe] and [Al/Fe], while the Sequoia 06 sample contains mainly high [Mg/Fe] and high [Al/Fe] stars. We conclude that the stars most likely to represent the Sequoia population have a mean metallicity between and dex, depending on the level of contaminant removal applied, and the stars with [Fe/H] are unlikely to be Sequoia members. The small number of Sequoia candidate members makes a robust characterization of the population difficult. However, we conclude that a significant fraction of the stars selected using the action space map are not members, suggesting caution should be used when selecting a box in this space.
To make progress in the efforts to identify and characterize accreted populations found in the Milky Way, we need observations for orders of magnitude more stars in the halo from which elemental abundances can be measured. With high-resolution spectroscopic observations of tens of millions of stars expected in the near future from the WHT Enhanced Area Velocity Explorer (WEAVE, Dalton et al., 2018, 2020), the fifth iteration of the Sloan Digital Sky Survey (SDSS-V, Kollmeier et al., 2017), and the 4-metre Multi-Object Spectroscopic Telescope (4MOST, de Jong et al., 2019), the prospects are good. Importantly, these surveys will provide high precision elemental abundance measurements, including Mg and Al, for not only Milky Way halo stars, but also stars in nearby dwarf galaxies. These homogeneous datasets, can be used to better understand the chemical evolution history of accreted populations and examine connections with present-day local dwarf galaxies.
The Dark Energy Spectroscopic Instrument (DESI, DESI Collaboration et al., 2016a, b) will, in addition to a large number of galaxies, also observe faint stars in the Milky Way (Allende Prieto et al., 2020). As the stars are faint, , and the survey focuses on high Galactic latitudes, || , a fair number of halo stars will be captured amongst the 8 million targets in this survey. The spectrographs in DESI have a resolution ranging from about 2000 at the blue end (360 nm) of the blue arm to 5000 at the red end (980 nm) of the red arm (Martini et al., 2018; DESI Collaboration et al., 2016b, and https://www.desi.lbl.gov/spectrograph/). For stellar work this is excellent resolution to obtain radial velocities, but studies performed as preparatory work for WEAVE and 4MOST, as well as the application of the Payne to the stellar spectra of LAMOST (Xiang et al., 2019) show that more than just radial velocities and a measure of metallicity can be retrieved from such spectra. In particular a measure of Mg as well as Al should be possible to retrieve. Given that DESI focuses on halo areas and goes deep, the impact on the study of the accreted halo should be significant.
Acknowledgements
We thank the anonymous referee for their thoughtful and constructive comments. D.K.F., S.F. and C.L.S. were supported by the grant 2016-03412 from the Swedish Research Council. LC is the recipient of the ARC Future Fellowship FT160100402. Parts of this research were conducted by the ARC Centre of Excellence ASTRO 3D, through project number CE170100013.
This work has made use of data from the European Space Agency (ESA) mission Gaia (https://www.cosmos.esa.int/gaia), processed by the Gaia Data Processing and Analysis Consortium (DPAC, https://www.cosmos.esa.int/web/gaia/dpac/consortium). Funding for the DPAC has been provided by national institutions, in particular the institutions participating in the Gaia Multilateral Agreement.
This work uses the following Python packages: galpy, which can be accessed here: http://github.com/jobovy/galpy, Astropy (Astropy Collaboration et al., 2013, 2018).
Data Availability
The data underlying this article are available in Gaia Data Release 2 (DOI: 10.1051/0004-6361/201833051) and Sloan Digital Sky Survey Data Release 16 (DOI: 10.3847/1538-4365/ab929e). The datasets were derived from sources in the public domain: https://gea.esac.esa.int/archive/ and https://www.sdss.org/dr16.
References
- Aguado et al. (2021) Aguado D. S., et al., 2021, ApJ, 908, L8
- Ahumada et al. (2019) Ahumada R., et al., 2019, arXiv e-prints, p. arXiv:1912.02905
- Allende Prieto et al. (2020) Allende Prieto C., et al., 2020, Research Notes of the American Astronomical Society, 4, 188
- Amarante et al. (2020) Amarante J. A. S., Smith M. C., Boeche C., 2020, MNRAS, 492, 3816
- Andrews et al. (2017) Andrews B. H., Weinberg D. H., Schönrich R., Johnson J. A., 2017, ApJ, 835, 224
- Astropy Collaboration et al. (2013) Astropy Collaboration et al., 2013, A&A, 558, A33
- Astropy Collaboration et al. (2018) Astropy Collaboration et al., 2018, AJ, 156, 123
- Bailer-Jones et al. (2018) Bailer-Jones C. A. L., Rybizki J., Fouesneau M., Mantelet G., Andrae R., 2018, AJ, 156, 58
- Belokurov et al. (2006) Belokurov V., et al., 2006, ApJ, 642, L137
- Belokurov et al. (2018) Belokurov V., Erkal D., Evans N. W., Koposov S. E., Deason A. J., 2018, MNRAS, 478, 611
- Bland-Hawthorn et al. (2010) Bland-Hawthorn J., Krumholz M. R., Freeman K., 2010, ApJ, 713, 166
- Bonaca et al. (2020) Bonaca A., et al., 2020, ApJ, 897, L18
- Bovy (2015) Bovy J., 2015, ApJS, 216, 29
- Bovy & Rix (2013) Bovy J., Rix H.-W., 2013, ApJ, 779, 115
- Bressan et al. (2012) Bressan A., Marigo P., Girardi L., Salasnich B., Dal Cero C., Rubele S., Nanni A., 2012, MNRAS, 427, 127
- Carlin et al. (2018) Carlin J. L., Sheffield A. A., Cunha K., Smith V. V., 2018, ApJ, 859, L10
- Carretta et al. (2009) Carretta E., Bragaglia A., Gratton R., D’Orazi V., Lucatello S., 2009, A&A, 508, 695
- Casagrande (2020) Casagrande L., 2020, ApJ, 896, 26
- Casagrande & VandenBerg (2018) Casagrande L., VandenBerg D. A., 2018, MNRAS, 479, L102
- Casagrande et al. (2019) Casagrande L., Wolf C., Mackey A. D., Nordland er T., Yong D., Bessell M., 2019, MNRAS, 482, 2770
- Chiappini et al. (2015) Chiappini C., et al., 2015, A&A, 576, L12
- Conroy et al. (2019) Conroy C., et al., 2019, ApJ, 883, 107
- Cooper et al. (2010) Cooper A. P., et al., 2010, MNRAS, 406, 744
- Cropper et al. (2018) Cropper M., et al., 2018, A&A, 616, A5
- Cunha et al. (2017) Cunha K., et al., 2017, ApJ, 844, 145
- DESI Collaboration et al. (2016a) DESI Collaboration et al., 2016a, arXiv e-prints, p. arXiv:1611.00036
- DESI Collaboration et al. (2016b) DESI Collaboration et al., 2016b, arXiv e-prints, p. arXiv:1611.00037
- Dalton et al. (2018) Dalton G., et al., 2018, in Evans C. J., Simard L., Takami H., eds, Society of Photo-Optical Instrumentation Engineers (SPIE) Conference Series Vol. 10702, Ground-based and Airborne Instrumentation for Astronomy VII. p. 107021B, doi:10.1117/12.2312031
- Dalton et al. (2020) Dalton G., et al., 2020, in Society of Photo-Optical Instrumentation Engineers (SPIE) Conference Series. p. 1144714, doi:10.1117/12.2561067
- Das et al. (2020) Das P., Hawkins K., Jofré P., 2020, MNRAS, 493, 5195
- Deason et al. (2013) Deason A. J., Belokurov V., Evans N. W., Johnston K. V., 2013, ApJ, 763, 113
- Di Matteo et al. (2019) Di Matteo P., Haywood M., Lehnert M. D., Katz D., Khoperskov S., Snaith O. N., Gómez A., Robichon N., 2019, A&A, 632, A4
- Fernández-Alvar et al. (2018) Fernández-Alvar E., et al., 2018, ApJ, 852, 50
- Feuillet et al. (2020) Feuillet D. K., Feltzing S., Sahlholdt C. L., Casagrande L., 2020, MNRAS, 497, 109
- Forbes (2020) Forbes D. A., 2020, MNRAS, 493, 847
- Freeman & Bland-Hawthorn (2002) Freeman K., Bland-Hawthorn J., 2002, ARA&A, 40, 487
- Gaia Collaboration et al. (2018a) Gaia Collaboration et al., 2018a, A&A, 616, A1
- Gaia Collaboration et al. (2018b) Gaia Collaboration et al., 2018b, A&A, 616, A10
- Gallart et al. (2019) Gallart C., Bernard E. J., Brook C. B., Ruiz-Lara T., Cassisi S., Hill V., Monelli M., 2019, Nature Astronomy, 3, 932
- Hansen et al. (2020) Hansen T. T., Riley A. H., Strigari L. E., Marshall J. L., Ferguson P. S., Zepeda J., Sneden C., 2020, ApJ, 901, 23
- Hasselquist et al. (2016) Hasselquist S., et al., 2016, ApJ, 833, 81
- Hasselquist et al. (2017) Hasselquist S., et al., 2017, ApJ, 845, 162
- Hasselquist et al. (2019) Hasselquist S., et al., 2019, ApJ, 872, 58
- Hawkins et al. (2015) Hawkins K., Jofré P., Masseron T., Gilmore G., 2015, MNRAS, 453, 758
- Hayes et al. (2018) Hayes C. R., et al., 2018, ApJ, 852, 49
- Haywood et al. (2018) Haywood M., Di Matteo P., Lehnert M. D., Snaith O., Khoperskov S., Gómez A., 2018, ApJ, 863, 113
- Helmi et al. (1999) Helmi A., White S. D. M., de Zeeuw P. T., Zhao H., 1999, Nature, 402, 53
- Helmi et al. (2018) Helmi A., Babusiaux C., Koppelman H. H., Massari D., Veljanoski J., Brown A. G. A., 2018, Nature, 563, 85
- Howes et al. (2019) Howes L. M., Lindegren L., Feltzing S., Church R. P., Bensby T., 2019, A&A, 622, A27
- Ibata et al. (2019) Ibata R. A., Malhan K., Martin N. F., 2019, ApJ, 872, 152
- Jönsson et al. (2020) Jönsson H., et al., 2020, AJ, 160, 120
- Kollmeier et al. (2017) Kollmeier J. A., et al., 2017, arXiv e-prints, p. arXiv:1711.03234
- Koppelman et al. (2019) Koppelman H. H., Helmi A., Massari D., Price-Whelan A. M., Starkenburg T. K., 2019, A&A, 631, L9
- Kruijssen et al. (2020) Kruijssen J. M. D., et al., 2020, MNRAS, 498, 2472
- Lallement et al. (2019) Lallement R., Babusiaux C., Vergely J. L., Katz D., Arenou F., Valette B., Hottier C., Capitanio L., 2019, A&A, 625, A135
- Lapenna et al. (2012) Lapenna E., Mucciarelli A., Origlia L., Ferraro F. R., 2012, ApJ, 761, 33
- Ma et al. (2016) Ma X., Hopkins P. F., Faucher-Giguère C.-A., Zolman N., Muratov A. L., Kereš D., Quataert E., 2016, MNRAS, 456, 2140
- Mackereth & Bovy (2020) Mackereth J. T., Bovy J., 2020, MNRAS, 492, 3631
- Mackereth et al. (2019) Mackereth J. T., et al., 2019, MNRAS, 482, 3426
- Mackey & van den Bergh (2005) Mackey A. D., van den Bergh S., 2005, MNRAS, 360, 631
- Magurno et al. (2018) Magurno D., et al., 2018, ApJ, 864, 57
- Majewski et al. (2017) Majewski S. R., et al., 2017, AJ, 154, 94
- Malhan et al. (2021) Malhan K., Yuan Z., Ibata R., Arentsen A., Bellazzini M., Martin N. F., 2021, arXiv e-prints, p. arXiv:2104.09523
- Martig et al. (2015) Martig M., et al., 2015, MNRAS, 451, 2230
- Martini et al. (2018) Martini P., et al., 2018, in Evans C. J., Simard L., Takami H., eds, Society of Photo-Optical Instrumentation Engineers (SPIE) Conference Series Vol. 10702, Ground-based and Airborne Instrumentation for Astronomy VII. p. 107021F (arXiv:1807.09287), doi:10.1117/12.2313063
- Massari et al. (2019) Massari D., Koppelman H. H., Helmi A., 2019, A&A, 630, L4
- Matsuno et al. (2019) Matsuno T., Aoki W., Suda T., 2019, ApJ, 874, L35
- Matteucci (2021) Matteucci F., 2021, arXiv e-prints, p. arXiv:2106.13145
- McConnachie et al. (2009) McConnachie A. W., et al., 2009, Nature, 461, 66
- McWilliam et al. (2013) McWilliam A., Wallerstein G., Mottini M., 2013, ApJ, 778, 149
- Mészáros et al. (2020) Mészáros S., et al., 2020, MNRAS, 492, 1641
- Minchev et al. (2018) Minchev I., et al., 2018, MNRAS, 481, 1645
- Moe et al. (2019) Moe M., Kratter K. M., Badenes C., 2019, ApJ, 875, 61
- Montalbán et al. (2021) Montalbán J., et al., 2021, Nature Astronomy, 5, 640
- Monty et al. (2020) Monty S., Venn K. A., Lane J. M. M., Lokhorst D., Yong D., 2020, MNRAS, 497, 1236
- Muñoz et al. (2013) Muñoz C., Geisler D., Villanova S., 2013, MNRAS, 433, 2006
- Mucciarelli et al. (2014) Mucciarelli A., Dalessandro E., Ferraro F. R., Origlia L., Lanzoni B., 2014, ApJ, 793, L6
- Mucciarelli et al. (2015) Mucciarelli A., Lapenna E., Massari D., Ferraro F. R., Lanzoni B., 2015, ApJ, 801, 69
- Myeong et al. (2019) Myeong G. C., Vasiliev E., Iorio G., Evans N. W., Belokurov V., 2019, MNRAS, 488, 1235
- Naidu et al. (2020) Naidu R. P., Conroy C., Bonaca A., Johnson B. D., Ting Y.-S., Caldwell N., Zaritsky D., Cargile P. A., 2020, ApJ, 901, 48
- Naidu et al. (2021) Naidu R. P., et al., 2021, arXiv e-prints, p. arXiv:2103.03251
- Nidever et al. (2020) Nidever D. L., et al., 2020, ApJ, 895, 88
- Nissen & Schuster (2010) Nissen P. E., Schuster W. J., 2010, A&A, 511, L10
- Nordlander & Lind (2017) Nordlander T., Lind K., 2017, A&A, 607, A75
- Palau & Miralda-Escudé (2020) Palau C. G., Miralda-Escudé J., 2020, arXiv e-prints, p. arXiv:2010.14381
- Reichert et al. (2020) Reichert M., Hansen C. J., Hanke M., Skúladóttir Á., Arcones A., Grebel E. K., 2020, A&A, 641, A127
- Riley & Strigari (2020) Riley A. H., Strigari L. E., 2020, MNRAS, 494, 983
- Romano et al. (2010) Romano D., Karakas A. I., Tosi M., Matteucci F., 2010, A&A, 522, A32
- Sahlholdt & Lindegren (2021) Sahlholdt C. L., Lindegren L., 2021, MNRAS, 502, 845
- Sahlholdt et al. (2019) Sahlholdt C. L., Casagrande L., Feltzing S., 2019, ApJ, 881, L10
- Salaris et al. (1993) Salaris M., Chieffi A., Straniero O., 1993, ApJ, 414, 580
- Salpeter (1955) Salpeter E. E., 1955, ApJ, 121, 161
- Schönrich et al. (2019) Schönrich R., McMillan P., Eyer L., 2019, MNRAS, 487, 3568
- Shetrone et al. (2003) Shetrone M., Venn K. A., Tolstoy E., Primas F., Hill V., Kaufer A., 2003, AJ, 125, 684
- Simmerer et al. (2013) Simmerer J., Ivans I. I., Filler D., Francois P., Charbonnel C., Monier R., James G., 2013, ApJ, 764, L7
- Tolstoy et al. (2009) Tolstoy E., Hill V., Tosi M., 2009, ARA&A, 47, 371
- Venn et al. (2004) Venn K. A., Irwin M., Shetrone M. D., Tout C. A., Hill V., Tolstoy E., 2004, AJ, 128, 1177
- Vincenzo et al. (2019) Vincenzo F., Spitoni E., Calura F., Matteucci F., Silva Aguirre V., Miglio A., Cescutti G., 2019, MNRAS, 487, L47
- Weinberg et al. (2019) Weinberg D. H., et al., 2019, ApJ, 874, 102
- Woosley et al. (2002) Woosley S. E., Heger A., Weaver T. A., 2002, Reviews of Modern Physics, 74, 1015
- Xiang et al. (2019) Xiang M., et al., 2019, ApJS, 245, 34
- de Jong et al. (2019) de Jong R. S., et al., 2019, The Messenger, 175, 3
Appendix A APOGEE Fields Removed
A list of fields removed from the final APOGEE samples in order to avoid bias from known clusters or accreted populations. The APOGEE targeting parameter ‘FIELD’ was used.
IC342_MGA |
PAL5-2 |
N1851 |
N5634SGR2 |
LMC17 |
M10 |
N2204 |
N6229 |
LMC7 |
M107 |
N2243-S |
SGR1 |
ORIONB-B |
M13 |
N2808 |
SMC5 |
ORPHAN-1 |
M3 |
NGC3201 |
TAUL1536 |
ORPHAN-3 |
M4 |
NGC3201RRL |
TRIAND-2 |
ORPHAN-5 |
M55 |
N4147 |
TRIAND-3 |
Omegacen |
M92 |
N5466 |
moving_groups |
PAL5-1 |
N1333 |
-
•
Note. — Strings corresponding to the APOGEE parameters ‘FIELD’.
Appendix B Alternate Sequoia Selection
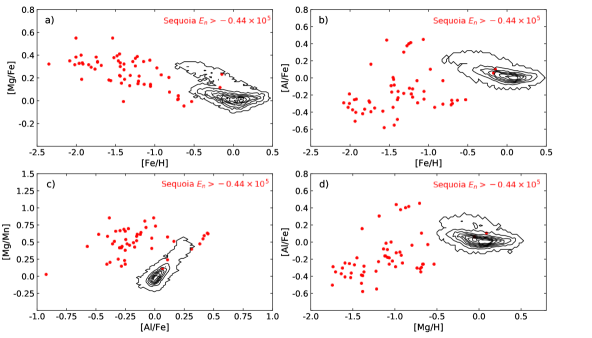
This appendix presents the abundance distributions of Sequoia stars when selected using the criteria and . The resulting sample is much larger, but the abundance distributions are more scattered and appear to contain multiple stellar populations.
The first generation stars in NGC 3201 are consistent with the majority of Sequoia stars, but the second generation stars differ from the Sequoia stars with most in these abundance spaces. There are Sequoia stars with high [Al/Fe] at [Fe/H] (Figure 12 c) that are removed in the Sequoia 06 selection, but consistent with the NCG 3201 [Al/Fe] (Figure 12 d). This suggests there could be stars not selected as NGC 3201 members, but still within the Sequoia kinematic selection. However, these stars are not consistent with the second generation NGC 3201 stars in other element. While NGC 3201 has a single [Mg/H] abundance and a range of [O/Al], Figure 13 b, the Sequoia stars follow a sequence of decreasing [O/Al] with increasing [Mg/H], Figure 13 a. This suggests that the Sequoia stars with high [Al/Fe] at [Fe/H] are not dissolved cluster stars, but likely contaminant Milky Way stars.
The [Mg/Mn] vs [Al/Fe] (Figure 13 c) and [Al/Fe] vs [Mg/H] (Figure 13 e) abundance distributions show a large number of stars in the Sequoia selection that have elemental abundances consistent with the Milky Way disc populations.
Appendix C High Energy Sequoia Selection
Previous studies typically characterize the Sequoia population as having high orbital energy (e.g. Myeong et al., 2019; Naidu et al., 2020) while the Thamnos accreted populations occupy the low orbital energy, retrograde kinematic space (e.g. Koppelman et al., 2019; Naidu et al., 2020). As seen in Figure 1 g and h, our selection of Sequoia, although based on the Myeong et al. (2019) criteria in the action space map, results in a sample with a large range of orbital energies. This sample also results in a distribution of [Mg/Fe] vs [Fe/H] with both a high- and low-Mg branch, see Figure 5. Here we investigate potential differences in the orbital energy distributions of Sequoia stars in different elemental abundance regimes.
Figure 14 shows the orbital energy distributions (b, d, and f) of subsamples of Sequoia selected as chemically accreted (yellow) and chemically in situ (green) in the [Mg/Mn] vs [Al/Fe] (a), [Al/Fe] vs [Mg/H] (c), and [Mg/Fe] vs [Fe/H] (e) distributions. The edges of the selection regions are indicated by the black dotted line. The corresponding energy histograms show that although the two subsamples have a similar peak energy, the chemically accreted subsamples (yellow) have an excess of high energy stars. This high energy excess is present in all three elemental abundance spaces investigated.
Assuming Sequoia is in fact a high energy population, we define an energy limit for Sequoia members ( km2 s-2) based on the minimum between the main energy peak and the high energy excess in the yellow histograms. Figure 15 show the distribution of this high energy Sequoia sample in four elemental abundance spaces. As compared to the full Sequoia and Sequoia 06 distributions, see Figures 12 and 13, the high energy Sequoia do not show as much evidence of two populations as the full Sequoia selection (i.e. ), however, the comparison with the Sequoia 06 sample is less clear.
The [Mg/Fe] vs [Fe/H] distribution of the high energy Sequoia is consistent with a single low-Mg sequence, while the Sequoia 06 distribution retains evidence of multiple sequences. The [Al/Fe] vs [Fe/H] and [Al/Fe] vs [Mg/H] distributions of Sequoia 06 suggest a single population sequence, while the high energy Sequoia distributions have a second high-Al sequence. The [Mg/Mn] vs [Al/Fe] distributions of the Sequoia 06 and high energy Sequoia selections are similarly scattered and both shown signs of in situ contamination.
Although we do not use an energy selection in our main analysis, we find this exercise results in an interesting suggestion of multiple populations being present within the action space map selection of the Sequoia. The chemically accreted samples in Figure 14 all have a primary peak at low energy, only slightly higher than the energy peak of the chemically in situ samples. This bimodality of the chemically accreted samples suggests either 1) there is another, low energy accreted population, such as Thamnos, occupying the sample region of the action space map as Sequoia, 2) Sequoia has a bimodal energy distribution, or 3) there is a significant contribution of in situ stars to the regions of elemental abundance space thought to comprise accreted populations.