Improving MP2 band gaps with low-scaling approximations to EOM-CCSD
Abstract
Despite its reasonable accuracy for ground-state properties of semiconductors and insulators, second-order Møller-Plesset perturbation theory (MP2) significantly underestimates band gaps. Here, we evaluate the band gap predictions of partitioned equation-of-motion MP2 (P-EOM-MP2), which is a second-order approximation to equation-of-motion coupled-cluster theory with single and double excitations. On a test set of elemental and binary semiconductors and insulators, we find that P-EOM-MP2 overestimates band gaps by 0.3 eV on average, which can be compared to the underestimation by 0.6 eV on average exhibited by the G0W0 approximation with a PBE reference. We show that P-EOM-MP2, when interpreted as a Green’s function-based theory, has a self-energy that includes all first- and second-order diagrams and a few third-order diagrams. We find that the GW approximation performs better for materials with small gaps and P-EOM-MP2 performs better for materials with large gaps, which we attribute to their superior treatment of screening and exchange, respectively.
Second-order Møller-Plesset perturbation theory (MP2) is the simplest ab initio treatment of dynamical electron correlation. Its low cost makes it especially attractive for large systems including periodic solids. Although periodic MP2 has been found to perform reasonably well for the description of ground-state properties Ayala, Kudin, and Scuseria (2001); Hirata et al. (2004); Hirata and Shimazaki (2009); Marsman et al. (2009); Grüneis, Marsman, and Kresse (2010); Maschio et al. (2010); Usvyat et al. (2010); Katouda and Nagase (2010); Göltl et al. (2012); Del Ben, Hutter, and VandeVondele (2012, 2013); McClain et al. (2017), its performance is less satisfactory for charged excitation energies and band gaps Grüneis, Marsman, and Kresse (2010); Iskakov et al. (2019). For example, in Ref. Grüneis, Marsman, and Kresse, 2010, MP2 was applied to thirteen semiconductors and insulators and exhibited average errors of 0.5% for lattice constants, 4.1% for bulk moduli, and 0.23 eV for cohesive energies, but predicted negative band gaps for materials that are known to be semiconducting, such as silicon and silicon carbide. This unsatisfactory performance was attributed to the lack of screening in finite-order perturbation theory. Indeed, the GW approximation Hedin (1965); Strinati, Mattausch, and Hanke (1982); Hybertsen and Louie (1986) and equation-of-motion coupled-cluster theory Monkhorst (1977); Nooijen and Snijders (1993); Stanton and Gauss (1994); Nooijen and Bartlett (1995); Lange and Berkelbach (2018) describe excitation energies with infinite-order perturbation theory and predict accurate band gaps of semiconductors Hybertsen and Louie (1986); van Schilfgaarde, Kotani, and Faleev (2006); McClain et al. (2017), albeit with a computational cost that is higher than that of MP2.
Here, we study the performance of a second-order approximation to equation-of-motion coupled-cluster theory with single and double excitations (EOM-CCSD), first presented in Refs. Nooijen and Snijders, 1995; Gwaltney, Nooijen, and Bartlett, 1996. Despite making sequential second-order approximations, the method will be seen to be equivalent to the use of a self-energy containing all second-order diagrams and a few third-order diagrams.
Consider the Møller-Plesset partitioning of the many-body Hamiltonian, leading to the Hartree-Fock (HF) orbitals with orbital energies ; as usual, we denote the orbitals occupied in the HF determinant by , those unoccupied by , and general orbitals by . The self-energy evaluated to second-order in perturbation theory is
| (1) |
where the antisymmetrized two-electron integrals are defined by , with
| (2) |
and is a combined space and spin variable. Unlike the GW approximation, the MP2 self-energy has exact second-order exchange and is therefore free of self-screening error.
An alternative theory can be obtained by a second-order approximation to EOM-CCSD, leading to a method originally referred to as EOM-MBPT(2) Nooijen and Snijders (1995) or EOM-CCSD(2) Stanton and Gauss (1995). In this method, the ground-state CCSD amplitudes are approximated by their MP2 values, avoiding the expensive iterative solution of the CCSD amplitude equations. In this work, we consider the additional approximation of partitioning the EOM Hamiltonian into single and double excitation spaces and perturbatively treating the latter. Under this approximation, the large double excitation block of the similarity-transformed Hamiltonian is a diagonal matrix of orbital energy differences. This method has been referred to as DSO-GF Nooijen and Snijders (1995) and P-EOM-MBPT(2) Gwaltney, Nooijen, and Bartlett (1996); Goings et al. (2014); because we always use a Hartree-Fock reference, we will refer to the method as P-EOM-MP2.
Unlike typical Green’s function techniques, the EOM approach yields ionization potentials (IPs) and electron affinities (EAs) from separate eigenvalue calculations. In practice, these eigenvalues are found iteratively using the Davidson algorithm. As shown by Nooijen and Snijders Nooijen and Snijders (1995), the P-EOM-MP2 IPs can equivalently be obtained from the self-consistent eigenvalues of a matrix with elements , where
| (3) |
and likewise for the EAs. The above matrix is clearly similar to the MP2 self-energy matrix (1), except for three differences. The first difference is the neglected coupling between the particle and hole spaces. Within the common diagonal approximation to the self-energy, this coupling is irrelevant and we have numerically confirmed that it is a negligible difference in this work. The second difference is the perturbative replacement of in one of the two terms. When this replacement is done in the MP2 self-energy, we find that it makes the results slightly worse and is thus not responsible for the improvement to be shown in the P-EOM-MP2 band gaps (vide infra).
The third and most important difference is the presence of the intermediate
| (4) |
where the antisymmetrization operator is and
| (5) |
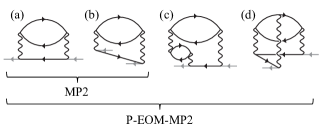
Viewed in terms of the similarity-transformed Hamiltonian , the first term in Eq. (3) reflects a renormalization of the one-body interactions due to ground-state correlation and the presence of in the second term reflects a renormalization of the two-body interactions, i.e. it is a screened Coulomb interaction. Alternatively, the intermediate can be understood as the inclusion of a few third-order self-energy diagrams, with a perturbative evaluation of the frequency denominator. In Fig. 1, we show the time-ordered self-energy diagrams included in the MP2 and P-EOM-MP2 Green’s functions beyond first-order (i.e. beyond Hartree-Fock).
Assuming occupied orbitals and virtual orbitals with , then the more expensive electron affinity EOM-CCSD (EA-EOM-CCSD) has an iterative cost due to ground-state CCSD and an iterative cost per eigenvalue for excited-state matrix-vector multiplication. The P-EOM-MP2 method reduces the above to a non-iterative cost due to ground-state MP2 (ignoring the integral transformation) and an iterative cost per eigenvalue due to excited-state matrix-vector multiplication. This significant cost reduction makes P-EOM-MP2 an attractive approach for complex materials. (Strictly speaking, P-EOM-MP2 has a non-iterative step due to the formation of the intermediate (4), but this is typically not the most time-consuming step. If necessary, the one-time intermediate construction can be avoided but results in an iterative cost.)
We have applied the above two theories to the calculation of the minimum band gaps of eleven simple, three-dimensional semiconductors and insulators. Seven have a diamond/zinc-blende crystal structure: Si, SiC, GaP, BP, GaN, C, BN; two have a rock-salt crystal structure: MgO and LiF; and two have a face-center cubic crystal structure: Ar and Ne. Calculations were done with periodic boundary conditions using the PySCF software package Sun et al. (2017a, 2020). All calculations were done without pseudopotentials using the all-electron cc-pVTZ basis set except for Ne and Ar, which used the aug-cc-pVTZ basis set. Calculations using larger basis sets (not shown) suggest that our results are close to the basis set limit, consistent with analogous results obtained with the GW approximation Zhu and Chan (2021). Two-electron integrals were calculated by periodic Gaussian density fitting Sun et al. (2017b) using JKFIT auxiliary basis sets Weigend (2002).
For charged excitation energies, finite-size effects are large McClain et al. (2017); Yang et al. (2020). Here, we have included one Madelung constant correction to the occupied orbital energies and another to the final IPs. The former correction has no impact in wavefunction-based theories such as EOM-CCSD, but does have an impact in finite-order perturbation theories (similar to the differing behaviors of ground-state CCSD and MP2); the latter correction is familiar from periodic calculations of charged systems and can be given a many-body interpretation on the basis of the excited-state structure factor Yang et al. (2020). We have performed calculations with -points sampled uniformly in the Brillouin zone. Band gaps were then extrapolated to the thermodynamic limit assuming an finite-size error. Other treatments of finite-size effects are possible, but all are expected to exhibit finite-size errors with the same scaling.
| Material | (Å) | Reference | MP2 | P-EOM-MP2 | G0W0@PBE | ||||
|---|---|---|---|---|---|---|---|---|---|
| Expt. | el-ph | Error | Error | Error | |||||
| Si | |||||||||
| SiC | |||||||||
| GaP | |||||||||
| BP | |||||||||
| GaN | |||||||||
| C | |||||||||
| BN | |||||||||
| MgO | |||||||||
| Ar | |||||||||
| LiF | |||||||||
| Ne | |||||||||
| MSE (eV) | |||||||||
| MUE (eV) | |||||||||
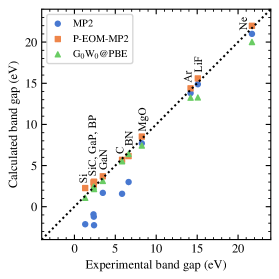
In Fig. 2, we compare the minimum band gaps obtained by MP2, P-EOM-MP2, and the GW approximation to experimental values at 300 K. Because the calculations do not account for vibrational effects, we have adjusted the experimental values according to calculated electron-phonon renormalizations from the literature Miglio et al. (2020); Antonius et al. (2015) based on the Allen-Heine-Cardona framework Allen and Heine (1976); Allen and Cardona (1981); Giustino, Louie, and Cohen (2010). We only include the zero-point renormalization for all materials except LiF, which has a sizable thermal contribution to the renormalization at 300 K Monserrat (2016); for the other materials, this latter contribution is relatively small. Lattice expansion is already accounted for because our lattice constants are experimental 300 K values. Precise numbers and crystal geometries are given in Tab. 1. We note that experimental band gaps and calculated electron-phonon renormalizations vary throughout the literature.
Consistent with Ref. Grüneis, Marsman, and Kresse, 2010, we find that MP2 systematically underestimates the band gap and predicts negative band gaps for Si, GaP, BP, and SiC (our MP2 band gaps are similar to those of Ref. Grüneis, Marsman, and Kresse, 2010, but some differ by as much as 0.5 eV, which we attribute to differences in the treatment of core electrons, basis set effects, finite-size effects). Remarkably, the P-EOM-MP2 band gaps are a significant improvement and show good agreement for all materials. The mean signed error (MSE) is eV and the mean unsigned error (MUE) is 0.40 eV. The largest signed error is for Si ( eV), which has the smallest gap of all materials considered.
In Fig. 2 and Tab. 1, we also compare results to those calculated by the G0W0 approximation with a PBE reference. For all materials except LiF, we compare to all-electron, full-frequency calculations by Zhu and Chan Zhu and Chan (2021), which were performed with PySCF using identical treatments of core electrons and identical Gaussian basis sets. The result for LiF is from Ref. Shishkin, Marsman, and Kresse, 2007. Remarkably, the P-EOM-MP2 and GW approximation perform similarly well, despite their underlying physical differences. Roughly speaking, the GW approximation performs better for materials with the smallest gaps while P-EOM-MP2 performs better for those with the largest gaps. The largest errors for the GW approximation are for the large-gap insulators, whose band gaps are underestimated by about 1 eV or more, which we attribute to the use of a PBE starting point and the absence of second-order exchange. For the GW approximation, the MSE is eV and the MUE is eV.
We performed additional calculations to estimate the effect of the various diagrams included in the P-EOM-MP2 self-energy shown in Fig. 1. The HF band gap is always much too large and the direct second-order diagrams yield a large negative correction, which is largely responsible for the performance exhibited by MP2. Consistent with Ref. Grüneis, Marsman, and Kresse, 2010, we find that the second-order exchange diagrams make a small contribution ( eV) for small-gap materials but a larger contribution ( eV) for large-gap materials. This can be attributed to the more localized nature of the electronic states in large-gap insulators. The screening diagram in Fig. 1(c) makes a large contribution (1 eV or more) for all materials and is most responsible for the significant improvement of P-EOM-MP2 over MP2. The final diagram in Fig. 1(d), a vertex correction beyond the GW approximation, typically raises the gap by about eV.
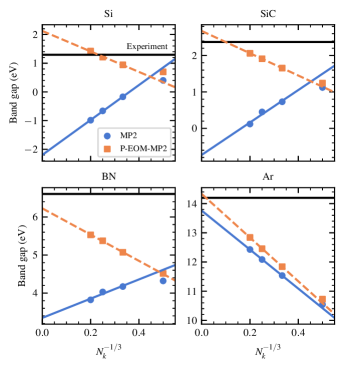
In Fig. 3, we show the convergence of the band gap towards the thermodynamic limit for four of the materials considered here. As mentioned earlier, the finite-size error is large and must be removed by extrapolation. Interestingly, although MP2 and P-EOM-MP2 give similar band gaps for small -point meshes, they exhibit very different convergence to the thermodynamic limit. This difference is largest for materials with small band gaps. We attribute this behavior to our use of Madelung constant corrections in the HF orbital energies. These corrections cause the HF gap to converge to the thermodynamic limit from above, such that the systems with smaller -point meshes are more weakly correlated and the importance of third-order diagrams in the self-energy is diminished. On approach to the thermodynamic limit, the system becomes more strongly correlated and the results of the two methods deviate.
In conclusion, we have shown that the P-EOM-MP2 approach, a second-order approximation to EOM-CCSD, yields solid-state band gaps that are a significant improvement over those predicted by MP2. The success of P-EOM-MP2 contradicts the conventional wisdom that infinite-order screening is necessary for quantitative accuracy in band gap prediction. Rather, P-EOM-MP2 represents an affordable balance of low-order screening and exchange, yielding semiquantitative accuracy for materials with a wide range of band gaps. By starting from Hartree-Fock theory and including antisymmetrization in all interaction vertices, the method is completely ab initio and free of self-interaction and self-screening errors. We note that P-EOM-MP2 is very similar to CC2 Christiansen, Koch, and Jørgensen (1995) and we therefore expect similar performance from the latter, which also includes some amount of orbital relaxation. Although P-EOM-MP2 has been found to perform well for three-dimensional materials, it will be interesting to apply it to low-dimensional semiconductors, where screening is more complicated.
Acknowledgements.
This work was supported in part by the National Science Foundation under Grant No. CHE-1848369. M.F.L. was supported in part by the National Science Foundation Graduate Research Fellowship Grant DGE-1746045. We acknowledge computing resources from Columbia University’s Shared Research Computing Facility project, which is supported by NIH Research Facility Improvement Grant 1G20RR030893-01, and associated funds from the New York State Empire State Development, Division of Science Technology and Innovation (NYSTAR) Contract C090171, both awarded April 15, 2010. We also acknowledge computing resources from the Flatiron Institute. The Flatiron Institute is a division of the Simons Foundation.References
- Ayala, Kudin, and Scuseria (2001) P. Y. Ayala, K. N. Kudin, and G. E. Scuseria, J. Chem. Phys. 115, 9698 (2001).
- Hirata et al. (2004) S. Hirata, R. Podeszwa, M. Tobita, and R. J. Bartlett, J. Chem. Phys. 120, 2581 (2004).
- Hirata and Shimazaki (2009) S. Hirata and T. Shimazaki, Phys. Rev. B 80, 085118 (2009).
- Marsman et al. (2009) M. Marsman, A. Grüneis, J. Paier, and G. Kresse, J. Chem. Phys. 130, 184103 (2009).
- Grüneis, Marsman, and Kresse (2010) A. Grüneis, M. Marsman, and G. Kresse, J. Chem. Phys. 133, 074107 (2010).
- Maschio et al. (2010) L. Maschio, D. Usvyat, M. Schütz, and B. Civalleri, J. Chem. Phys. 132, 134706 (2010).
- Usvyat et al. (2010) D. Usvyat, L. Maschio, C. Pisani, and M. Schütz, Z. Phys. Chem. 224, 441 (2010).
- Katouda and Nagase (2010) M. Katouda and S. Nagase, J. Chem. Phys. 133, 184103 (2010).
- Göltl et al. (2012) F. Göltl, A. Grüneis, T. Bučko, and J. Hafner, J. Chem. Phys. 137, 114111 (2012).
- Del Ben, Hutter, and VandeVondele (2012) M. Del Ben, J. Hutter, and J. VandeVondele, J. Chem. Theory Comput. 8, 4177 (2012).
- Del Ben, Hutter, and VandeVondele (2013) M. Del Ben, J. Hutter, and J. VandeVondele, J. Chem. Theory Comput. 9, 2654 (2013).
- McClain et al. (2017) J. McClain, Q. Sun, G. K.-L. Chan, and T. C. Berkelbach, J. Chem. Theory Comput. 13, 1209 (2017).
- Iskakov et al. (2019) S. Iskakov, A. A. Rusakov, D. Zgid, and E. Gull, Phys. Rev. B 100, 085112 (2019).
- Hedin (1965) L. Hedin, Phys. Rev. 139, A796 (1965).
- Strinati, Mattausch, and Hanke (1982) G. Strinati, H. J. Mattausch, and W. Hanke, Phys. Rev. B 25, 2867 (1982).
- Hybertsen and Louie (1986) M. S. Hybertsen and S. G. Louie, Phys. Rev. B 34, 5390 (1986).
- Monkhorst (1977) H. J. Monkhorst, Int. J. Quantum Chem. 12, 421 (1977).
- Nooijen and Snijders (1993) M. Nooijen and J. G. Snijders, Int. J. Quantum Chem. 48, 15 (1993).
- Stanton and Gauss (1994) J. F. Stanton and J. Gauss, J. Chem. Phys. 101, 8938 (1994).
- Nooijen and Bartlett (1995) M. Nooijen and R. J. Bartlett, J. Chem. Phys. 102, 3629 (1995).
- Lange and Berkelbach (2018) M. F. Lange and T. C. Berkelbach, J. Chem. Theory Comput. 14, 4224 (2018).
- van Schilfgaarde, Kotani, and Faleev (2006) M. van Schilfgaarde, T. Kotani, and S. Faleev, Phys. Rev. Lett. 96, 226402 (2006).
- Nooijen and Snijders (1995) M. Nooijen and J. G. Snijders, J. Chem. Phys. 102, 1681 (1995).
- Gwaltney, Nooijen, and Bartlett (1996) S. R. Gwaltney, M. Nooijen, and R. J. Bartlett, Chem. Phys. Lett. 248, 189 (1996).
- Stanton and Gauss (1995) J. F. Stanton and J. Gauss, J. Chem. Phys. 103, 1064 (1995).
- Goings et al. (2014) J. J. Goings, M. Caricato, M. J. Frisch, and X. Li, J. Chem. Phys. 141, 164116 (2014).
- Sun et al. (2017a) Q. Sun, T. C. Berkelbach, N. S. Blunt, G. H. Booth, S. Guo, Z. Li, J. Liu, J. D. McClain, E. R. Sayfutyarova, S. Sharma, S. Wouters, and G. K.-L. Chan, WIREs Comput. Mol. Sci. 8, e1340 (2017a).
- Sun et al. (2020) Q. Sun, X. Zhang, S. Banerjee, P. Bao, M. Barbry, N. S. Blunt, N. A. Bogdanov, G. H. Booth, J. Chen, Z.-H. Cui, J. J. Eriksen, Y. Gao, S. Guo, J. Hermann, M. R. Hermes, K. Koh, P. Koval, S. Lehtola, Z. Li, J. Liu, N. Mardirossian, J. D. McClain, M. Motta, B. Mussard, H. Q. Pham, A. Pulkin, W. Purwanto, P. J. Robinson, E. Ronca, E. R. Sayfutyarova, M. Scheurer, H. F. Schurkus, J. E. T. Smith, C. Sun, S.-N. Sun, S. Upadhyay, L. K. Wagner, X. Wang, A. White, J. D. Whitfield, M. J. Williamson, S. Wouters, J. Yang, J. M. Yu, T. Zhu, T. C. Berkelbach, S. Sharma, A. Y. Sokolov, and G. K.-L. Chan, J. Chem. Phys. 153, 024109 (2020).
- Zhu and Chan (2021) T. Zhu and G. K.-L. Chan, J. Chem. Theory Comput. 17, 727 (2021).
- Sun et al. (2017b) Q. Sun, T. C. Berkelbach, J. D. McClain, and G. K.-L. Chan, J. Chem. Phys. 147, 164119 (2017b).
- Weigend (2002) F. Weigend, Phys. Chem. Chem. Phys. 4, 4285 (2002).
- Yang et al. (2020) Y. Yang, V. Gorelov, C. Pierleoni, D. M. Ceperley, and M. Holzmann, Phys. Rev. B 101, 085115 (2020).
- Madelung (2004) O. Madelung, Semiconductors: Data Handbook (2004).
- Chiang et al. (1989) T. Chiang, K. Frank, H. Fruend, A. Goldmann, F. J. Himpsel, U. Karlsson, R. Lecky, and W. Schneider, Electronic Structure of Solids: Photoemission Spectra and Related Data (Springer, 1989).
- Schwentner et al. (1975) N. Schwentner, F. J. Himpsel, V. Saile, M. Skibowski, W. Steinmann, and E. E. Koch, Phys. Rev. Lett. 34, 528 (1975).
- Miglio et al. (2020) A. Miglio, V. Brousseau-Couture, E. Godbout, G. Antonius, Y.-H. Chan, S. G. Louie, M. Côté, M. Giantomassi, and X. Gonze, npj Comput. Mater. 6, 167 (2020).
- Antonius et al. (2015) G. Antonius, S. Poncé, E. Lantagne-Hurtubise, G. Auclair, X. Gonze, and M. Côté, Phys. Rev. B 92, 085137 (2015).
- Monserrat (2016) B. Monserrat, Phys. Rev. B 93, 100301(R) (2016).
- Shishkin, Marsman, and Kresse (2007) M. Shishkin, M. Marsman, and G. Kresse, Phys. Rev. Lett. 99, 246403 (2007).
- Allen and Heine (1976) P. B. Allen and V. Heine, J. Phys. C 9, 2305 (1976).
- Allen and Cardona (1981) P. B. Allen and M. Cardona, Phys. Rev. B 23, 1495 (1981).
- Giustino, Louie, and Cohen (2010) F. Giustino, S. G. Louie, and M. L. Cohen, Phys. Rev. Lett. 105, 265501 (2010).
- Christiansen, Koch, and Jørgensen (1995) O. Christiansen, H. Koch, and P. Jørgensen, Chem. Phys. Lett. 243, 409 (1995).