The physical properties and the evolution of the interacting system AM 1204-292
Abstract
We investigate the interaction effects in the stellar and gas kinematics, stellar population and ionized gas properties in the interacting galaxy pair AM 1209-292, composed by NGC 4105 and NGC 4106. The data consist of long-slit spectra in the range of Å. The massive E3 galaxy NGC 4105 presents a flat stellar velocity profile, while the ionized gas is in strong rotation, suggesting external origin. Its companion, NGC 4106, shows asymmetries in the radial velocity field, likely due to the interaction. The dynamics of the interacting pair was modelled using P-Gadget3 TreePM/SPH code, from which we show that the system has just passed the first perigalacticum, which triggered an outbreak of star formation, currently at full maximum. We characterized the stellar population properties using the stellar population synthesis code STARLIGHT and, on average, both galaxies are predominantly composed of old stellar populations. NGC 4105 has a slightly negative age gradient, comparable to that of the most massive elliptical galaxies, but a steeper metallicity gradient. The SB0 galaxy NGC 4106 presents smaller radial variations in both age and metallicity in comparison with intermediate mass early-type galaxies. These gradients have not been disturbed by the interaction since the star formation happened very recently and was not extensive in mass. Electron density estimates for the pair are systematically higher than those obtained in isolated galaxies. The central O/H abundances were obtained from photoionization models in combination with emission line ratios, which resulted in and for NGC 4105 and NGC 4106, respectively.
keywords:
galaxies: groups: general, galaxies: stellar content, galaxies: abundances, galaxies: kinematics and dynamics, galaxies: formation.1 Introduction
Interacting pairs of galaxies are excellent laboratories to study different aspects of the galaxy evolution, such as the morphological transformation, the induced star formation, and the fueling of a central supermassive black hole (lighting an active nucleus) (e.g., Fernandes de Mello, 1995; De Mello et al., 1995, 1996; Longhetti et al., 2000; Focardi et al., 2008; Rogers et al., 2009). Besides, the study of binary galaxies at different interaction stages can provide important constraints about the hierarchical scenario of galaxy formation and evolution. The relatively small velocities of a close encounter in a gravitationally coupled pair of galaxies of comparable masses/sizes make the mutual interaction strong enough inside each galaxy. Numerous studies have reported that a close encounter between the two galaxies modify the mutual gravitational fields (Toomre & Toomre, 1972). A close encounter can create new substructures in the gas, dust, and star spatial distributions, such as warps or bars, tidal tails, plumes, and bridges, pulled out by tidal forces during the gravitational interaction (e.g., Mendes de Oliveira & Hickson, 1994; Rodrigues et al., 1999; Barnes, 2002; Renaud, 2010; Presotto et al., 2010; Drzazga et al., 2011).
Mixed pairs of galaxies have components spanning different morphologies, such as an elliptical (early-type galaxy) and a spiral (late-type galaxy). This kind of galaxy pair becomes particularly more interesting because they represent good sites for investigating in detail those physical processes induced by close interactions (e.g., Fernandes de Mello, 1995; De Mello et al., 1995, 1996). The Catalogue of Southern Peculiar Galaxies and Associations by Arp and Madore (Arp et al., 1987) became a pioneer compilation of galaxy pairs, in which a lot of mixed pairs can be found.
The dynamics of galaxy interactions can be studied through numerical simulations, including the stellar and gaseous components besides the dark matter as primary ingredients. For instance, Moreno et al. (2015) embarked on a systematic study of 75 simulations of galaxies in major mergers. They report that star formation is more elevated in the center than the ones on the outskirts of interacting galaxies, and concluded that these trends are most prominent in the smaller companion galaxies with strongly aligned disc spin orientations. Another example is the numerical simulations by Torrey et al. (2012) that showed that the nuclear metallicity evolution is a perfect competition between the metal-poor gas inflows and enrichment due to the star formation (or feedback from star formation and active galactic nuclei (AGN) activity).
Mutual interaction between galaxies may enhance star formation (e.g., Larson & Tinsley, 1978; Woods & Geller, 2007; Krabbe et al., 2008; Patton et al., 2013; Knapen et al., 2015). However, the environment might not play a determinant role in the formation and evolution of (very) massive early-type galaxies (e.g., Xu et al., 2010; Bait et al., 2017; Yadav & Chen, 2018).
The star formation enhancements are accompanied by other events such as perturbations in the radial velocity field and dilution of the metallicity gradient. This is consistent with results obtained in chemical abundances and mass-metallicity relation (Sánchez et al., 2013), which show that interaction-induced flows of low metallicity gas from the outer parts of the disk of a galaxy can decrease the metallicity in the inner regions and modify the radial abundance gradients (e.g., Kewley et al., 2010; Rosa et al., 2014; Sánchez et al., 2014; Muñoz-Elgueta et al., 2018). We can not exclude the possibility that the inflow of low-metallicity gas would be considered as the principal source that affects the nuclear metallicity of interacting galaxies. Although there is evidence for a dilution in the central gas metallicity produced by interactions, a few interactions may also be able to enhance it (e.g. Barrera-Ballesteros et al., 2015), observationally seen by redder optical colours (e.g., Darg et al., 2010; Patton et al., 2011), for instance.
Strong interactions in close pairs may produce an in-homogeneity in the interstellar medium shown as a wide variation of the electron density (e.g., Krabbe et al., 2014; Roche et al., 2015). Formation of bars induced by the perturbation from the companion is also observed (e.g., Méndez-Abreu et al., 2012; Alonso et al., 2018).
Active galactic nuclei can also be produced, fueled by the infall of gas from the galaxy outskirts towards the central region, or even from a late-type galaxy to its companion (e.g., Eliche-Moral et al., 2011; Ellison et al., 2011; Satyapal et al., 2014; Donley et al., 2018). The gravitational interactions, as well as the tidal effects, can provide fuel to a supermassive black hole in the center of the galaxy (nucleus), leading to a connection between star formation and black hole activity (Trouille et al., 2011; Silverman et al., 2011). The activity of the nucleus provides energy to the interstellar medium and can even smooth the star formation (Croton et al., 2006; Di Matteo et al., 2008; Henriques et al., 2019). However, Weaver et al. (2018) who investigated the effects of galaxy merger throughout the interaction sequence in NGC 7252 (nearest major-merger galaxy remnants), revealing the extent of ongoing star formation and recent star formation history. These authors also found a large ionized gas cloud previously discovered kpc south of the nucleus, which may be associated with a low-ionization nuclear emission-line region (LINER). Therefore, it is of great significance to study the properties of ionized gas in the circumnuclear region and AGN connected with interacting galaxies in order to evidence the relationship between the active galactic nucleus and gravitational interaction.
This paper presents a detailed study for the interacting system AM 1204-292, where the physical properties of the ionized gas, the characteristics of the stellar population, and the nuclear activity are linked with the process of the interaction between the galaxies and the destiny of this system is uncovered.
| ID | Morphology [1] | log | (B-V) | Re [3] | MA [2,4,5] | i [2,5] | others designations | |
|---|---|---|---|---|---|---|---|---|
| AM 1204-292 | () | (mag) | (kpc) | (∘) | (∘) | |||
| NGC 4105 | E3 | 10.86 | 0.99 | 10.26 | 136.4 | 54.7 | ESO440-054 | |
| NGC 4106 | SB(s)0+ | 10.75 | 1.01 | 3.47 | 91 | 50 | ESO440-056 |
| galaxy ID | PA (∘) | Exposure time (s) | (Å) |
|---|---|---|---|
| NGC 4105 | 46.4 | 31200 | 3000-7050 |
| NGC 4106 | 161 | 31200 | 3000-7050 |
| NGC 4105/06 | 118 | 21200 | 3000-7050 |
AM 1204-292 is pair of galaxies with mixed morphology components, containing the very luminous elliptical galaxy NGC 4105 (according to the Third Reference Catalogue of Bright Galaxies De Vaucouleurs et al., 1991, hereafter RC3), but classified as S0 in the Revised Shapley Ames Catalog of Bright Galaxies (Sandage & Tammann (1981), hereafter RSA) and NGC 4106, a (diffuse) lenticular barred galaxy with extended tidal arms produced by the interaction (Koprolin & Zeilinger, 2000). It was classified in RC3 as SB0(s)+, and as SB0/a in RSA (tides).
The galaxies are separated by a projected distance of 9.6 Kpc and a difference in the radial velocities of 274 km s-1. There is visual evidence for one tidal arm in NGC 4106 that expands towards the primary galaxy in the south direction, and its counterpart tidal arm/tail heading to the opposite direction. On the other side, NGC 4105 does not show clear signs of perturbation. The spectra of both galaxies are dominated by prominent absorption features (Donzelli & Pastoriza, 2000) and some emission lines, such as [O II]3727 Å (Longhetti et al., 1998) and [N II]6584 Å (Caon et al., 2000). Moreover, Longhetti et al. (1998) found evidence from the line-strength indices that these galaxies experienced recent star formation episodes. Both galaxies are also fairly red with (BV) color index very similar to (Reduzzi & Rampazzo, 1996). The X-ray luminosity of NGC 4105 is L erg s-1 (0.5 – 2.0 keV), and NGC 4106 is L erg s-1 (Grützbauch et al., 2007). Besides, Grützbauch et al. (2009) found dusty features in the central region and modeled the brightness distribution, concluding that it presents a disky outer structure.
The paper is organized as follows. In Section 2, we describe the observations and data reduction. The stellar and gas kinematics in each individual galaxy are presented in Section 3. The N-Body + SPH simulations built to reproduce the interaction between the two galaxies and to uncover the destiny of this system are explored in Section 4. We present in Section 5 the procedure employed to perform the stellar population synthesis and the respective results to estimate the age distribution of the stellar populations. In Section 6, we analyze the results about the ionized gas properties, centering on electron density and oxygen abundance. Finally, we summarize our conclusions in Section 7.
2 Observations and data reduction
In Table 1 some general characteristics of the galaxy pair are listed, such as: identification, morphology, absolute -band magnitude, effective radius Re (isophotal radius that contains half of the total flux of the component), major axis direction (MA), and the inclination angle (i) of each galaxy. The projected linear separation between the galaxy nuclei on the sky plane is about 9.6 kpc (adopting (Wright, 2006), and the average distance of the galaxy pair of 28.6 Mpc).
The current study is based on long slit spectroscopic observations carried out on 2017 March 04th with the Goodman High Throughput Spectrograph (GTHS) attached to the 4.10m SOAR telescope (Cerro Pachon, Chile). Spectra with the single long slit mask were acquired in the range 3000-7050 Å with a grating of 400 lines mm-1 (M1 mode) and a slit of 1.03 arcsec width, providing an average spectral resolution of 5.5 Å in the region 3800-6800 Å, a spectral sampling of 1 Å px-1, and a spatial scale of 0.15 ″ px-1. The estimate of the spectral resolution was based on the broadening of He-Ar lines in the wavelength calibration spectra and cross correlations between the stellar template spectra (representing = 132 km s-1). The atmospheric seeing was about 1 ″, and we also noted some cirrus clouds along the observations.
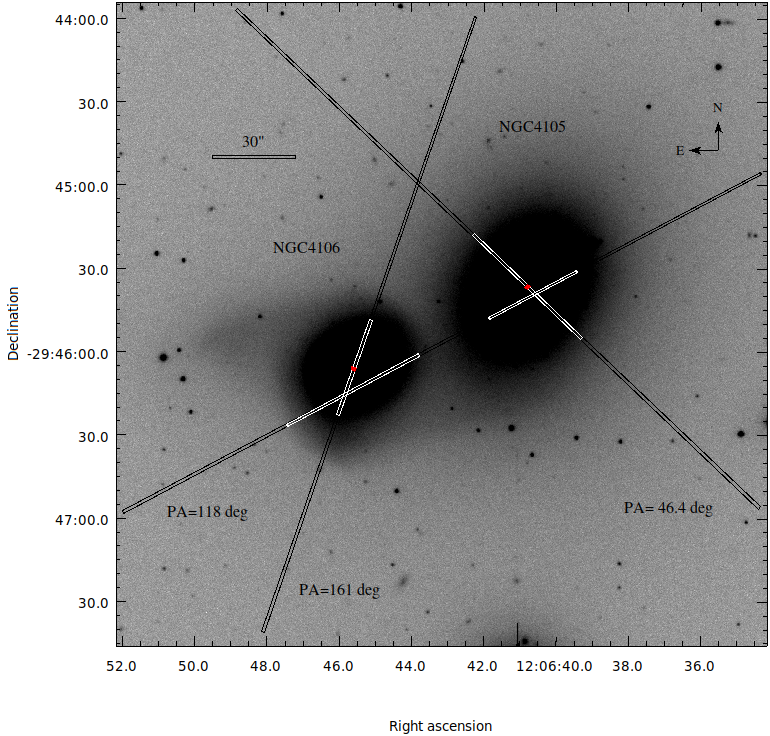
The long slit spectra of the galaxy pair AM 1204-292 were taken at three different position angles (PA) in order to observe the central regions and the principal-axes. PA is crossing the disc of NGC 4105, nearby the semi-major axis, and NGC 4106, but not in their centers. The minor photometric axis of the elliptical galaxy NGC 4105 was observed with PA = 46.4∘. The slit at PA crossed the center of NGC 4106 and the southern tidal arm that extends toward NGC 4105.
Multiple spectra were taken at the same slit position to increase the signal to noise ratio, and the exposure times were limited to 1200 seconds to minimize the effects of spurious cosmic rays. The slit positions are shown in Fig. 1, superimposed on the optical image of the pair. The journal of observations is listed in Table 2.
The spectroscopic data have been reduced with the IRAF111Image Reduction and Analysis Facility, published by National Optical Astronomical Observatory ( NOAO), operated by AURA, Inc, under agreement with NFS. package. The standard spectroscopic reduction procedure has been applied: image trimming, bias subtraction, flat field correction, sky background subtraction, cosmic rays removal, one-dimensional spectrum extraction, and wavelength and flux calibrations. Each one-dimensional spectrum comprises the flux contained in an aperture of 1.03 0.9 ″, which at a distance to the par corresponds to nearly 142 127.5 pc. The galactocentric radial coordinates to the positions of each aperture extracted from the slits were corrected taking into account the inclination angles of each galaxy (given in Table 1), in order to make radial plots of quantities of interest.


3 Kinematics
3.1 Stellar Kinematics
The stellar radial velocity and line-of-sight velocity dispersion for each aperture were estimated from the cross correlation method of its absorption line spectrum against a set of stellar template spectra. The radial velocity was reduced to a heliocentric frame of reference , as usual. The rotation curve and the radial profile on the slit directions have been estimated for each galaxy to characterize the dynamical system.
We adopted the Radial Velocity Analysis package of Smithsonian Astrophysical Observatory ( RVSAO Kurtz & Mink, 1998), from IRAF package to measure the radial velocity and velocity dispersion. Spectra of K giant stars (collected under the same instrumental setup of the galaxy pair observations) were used as reference for the cross correlations since optical spectra of evolved ETGs are dominated by them. The observed K giants are HD 120452, HD 132345, and HD 136028. Their heliocentric radial velocities are from Duflot et al. (1995) catalogue. The best stellar template from the cross correlation of nuclear aperture spectrum is assumed as a single template for all aperture spectra of each galaxy. The spectral range of cross correlations is 3800 – 6800Å, and the Fourier filters are those suggested by Tonry & Davis (1979). A second order polynomial function is employed to fit half height of the cross correlation peak for estimating its full width at half maximum (FWHM).
The observed radial velocity is simply read from the position of correlation peak, and its correspondent error is directly given by (3/8)(FWHM/(1+)), where is the height of the correlation peak divided by the amplitude of a sinusoidal noise for the correlation function (Kurtz & Mink, 1998). The velocity dispersion of each galaxy aperture spectrum has been estimated as a function of FWHM through a third order polynomial fit. To establish the relation between and FWHM, we convoluted all three template spectra took at March 4th night by different Gaussians, representing from 50 up to 500 km s-1 with steps of 50 km s-1. Cross correlations between the broadened template spectra and the respective observed stellar spectrum provide the and the FWHM. Errors in velocity dispersions were estimated artificially adding Poisson noise in the broadened spectra of a stellar template.
The radial velocities after subtraction of the systemic velocities, the velocity dispersion , and the spatial profiles of the 5735 continuum flux across the observed slit positions are shown in Fig. 2 (no geometric correction was applied due to the inclination of the galaxy plane relative to the plane of the sky). These galaxies are separated by a 1.15 arcmin in projection, corresponding to 9.6 kpc and a difference in radial velocities of km s-1. These values are very similar to those found by Kim et al. (2012).
NGC 4105. No signs of rotation were detected for the stellar component over both slit directions observed for this elliptical galaxy (see Fig. 2). On the PA we can observe a U-shaped symmetry in the radial velocity, with values reaching and km s-1 at kpc (SW) and kpc (NE), respectively, and no tendency to decline. In Section 4, we present the velocity map of a simulation that describes quite well the dynamics of this pair. We will then come back to this point. For PA the radial velocity and the velocity dispersion are approximately homogeneous along the radius, with a slight decline towards the SE side, reaching a maximum value of km s-1 at kpc, probably due to the interaction. We considered the heliocentric velocity of NGC 4105 being a radial velocity measured in the continuum peak along the slit position at PA, that is, v km s-1.
Samurović & Danziger (2005) investigated the dark matter in early-type galaxies from dynamical modelling and found that the velocities are not anti-symmetric due to the interaction with the companion. These authors also found that the velocity dispersion decreases from the central values of km s-1, in agreement with our results.
NGC 4106. This galaxy shows a nearly symmetrical rotation velocity curve across both slit directions. For the slit position crossing the nucleus, PA, a heliocentric velocity of km s-1 and a maximum value of the rotation velocity of km s-1, was found. One side of the curve at kpc towards the southeast of slit position PA presents oscillations in the flat region of the curve of the order of 30 km s-1, where originates the tidal arm. The most symmetrical, less-scattered, and smooth curve was derived using the slit position at PA. Both sides of the curve display regions with fluctuations of about 20 km s-1. One kpc towards the northwest and another at kpc towards the SE. The maximum rotation velocity is km s-1 at kpc.
The radially symmetric velocity dispersion profile obtained by us along both directions (PA and PA) are in good agreement with the results previously obtained by Longhetti et al. (1998).
Hence, we predict that NGC 4106 galaxy shows a fairly significant rotational symmetry. For this reason, we adopted a very simple approximation for the observed velocity distribution. Specifically, assuming circular orbits in a plane that are characterized by its inclination relative to the plane of the sky () and the position angle (PA) of the line of nodes . It results in an observed radial circular velocity at a position (R,) in the plane of the sky given by Bertola et al. (1991):
| (1) |
where R is the radius in the plane of the galaxy, Vs is the systemic velocity, and V0 and Rc are defined as amplitude parameters and shape of the curve.
The inclination of NGC 4106 with respect to the plane of the sky, estimated as , was determined by the observed axial ratio taken from Herrera-Endoqui et al. (2015). The position angle of the line of nodes, = 91∘, was also taken from the same reference. From the fitting of the radial velocity observed for NGC 4106 (PA), shown in the bottom panel of Fig. 2, we obtain a deprojected velocity amplitude of km s-1. Supposing that the mass in a certain radius is given by , using the amplitude of this fit, the dynamical mass of the S0 galaxy is about up to a radius of 3.64 kpc.


3.2 Gaseous Kinematics
The gaseous radial velocity in NGC 4105 and NGC 4106 was determined using the task EMSAO (Mink & Wyatt, 1995) implemented in the RVSAO package (Kurtz & Mink, 1998). This program finds emission lines in a spectrum and computes the observed centre, yielding individual radial velocity and error for each line and combining them into a single radial velocity. The program was successful at finding the emission lines [O II]3727Å and [N II]6584Å. The errors are estimated from the uncertainty in the dispersion function in Angstroms and in fit to the center of the Gaussian. The velocity dispersion and their error were calculated as a function of FWHM, measured using the SPLOT task from IRAF. The FHWM uncertainty is estimated from the Poisson error. The velocity dispersion was corrected by the instrumental broadening (), where (/2.352) / and = + . We assumed the radial velocity of the central aperture of each galaxy as the heliocentric velocity.
The radial velocity and velocity dispersion profiles of each observed slit positions are shown in Fig. 3. The number of kinematic measurements of the gaseous component is smaller than the stellar one, reaching only the central kpc of galaxies.
As can be seen in the top panel of Fig. 3, NGC 4105 does not show a U-shaped radial velocity profile along PA = 46.4∘, like that observed for the stellar kinematics. Gas velocity dispersions on this slit are lower than that of the stars, but the profile is similar, with a peak in the nuclear region and descending wings for both sides. The radial velocity profile across PA = 118∘ shows a clear rotational pattern, very different from the almost flat profile of the stellar component, considering our error bars (see Fig. 2). It should be noted that the slit did not cross the center of the galaxy. The behavior of ionized gas velocity profiles in both directions is very different from that of the stellar profiles, i.e., ionized gas and stars do not share the same dynamics.
The gaseous and stellar kinematics in NGC 4105 was previously studied by Caon et al. (2000), using long-slit spectroscopy and a similar methodology to ours. They observed with the slit positioned at PA = 156∘, different than our slit position and also not coincident with the photometric major axis position angle (see Tab.1, PA = 136.4∘). Caon et al. (2000) also verified that the gas velocity curve shows a strong rotation pattern with peak velocities above 200 km s-1. Their stellar velocities show a quite symmetric profile with positive velocities towards the NW direction and negative to the SE ( km s-1 for both sides), which they interpret as rotation. Based on it, they argue that the ionized gas in NGC 4105 is counter-rotating with respect to the stars, is of external origin, is not in equilibrium, and was acquired recently, also affecting stellar kinematics. In the stellar velocity profile of our PA slit position, we also observed counter-rotation (with a slightly lower velocity range). But our simulation fails to reproduce that. We show in Section 4 that the origin of this gas is not the current companion galaxy, as can be inferred from our simulation, in which no gas is transferred from NGC 4106 to NGC 4105.
We argue that the stellar velocity profile obtained by Caon et al. (2000) may reflect the transfer of orbital angular momentum to the outermost stars of NGC 4105 during the close encounter, in contrast to a pre-existing rotation.
In NGC 4106, the radially symmetric velocity profile across the slits reach a maximum velocity of km s-1 at kpc over PA. The velocity dispersion profiles at both slits are very steeper than that of the stellar profiles, and nearly symmetrical up to 1.2 kpc, with a central value of km s-1 for PA and km s-1 in the central aperture of PA.
The HI gas masses for the galaxies were measured by Bottinelli & Gouguenheim (1979), who found M⊙ for NGC 4105 and M⊙ for NGC 4106.
4 N-Body + SPH simulations
Numerical simulations were carried out in order to reconstruct the interaction history between the galaxies NGC 4105 and NGC 4106. The simulations were performed using the TreePM/SPH code P-GADGET3, an updated and significantly extended version of GADGET-2 (Springel, 2005), where the dark matter and stars are followed by collision less particles and gravity is calculated in a tree-code. The gas is treated through Smoothed Particle Hydrodynamics (SPH, Springel & Hernquist, 2002), with star formation process, radiative cooling and feedback, and sub-grid star formation model as defined in Springel & Hernquist (2003), from which we used the same parameters.
4.1 Initial conditions for the simulation
Based on the observational data presented here and elsewhere, we began to construct the initial conditions for our simulations. In the case of AM 1204-292, the collision is between an elliptical galaxy (NGC 4105) and a S0 galaxy (NGC 4106).
The total stellar mass of both galaxies were derived through the mass-to-light ratios resulting from stellar population synthesis (see Sect. 5). We correct the slit stellar mass obtained from STARLIGHT to total stellar mass by scaling the total and slit luminosity in the B-band. The total B-band luminosity was taken from the ESO-LV catalogue and are L L⊙ and L L⊙ for NGC 4105 and NGC 4106, respectively. Then, the stellar masses are and , for NGC 4105 and NGC 4106 respectively.
| Phys. Units∗ | |
| NGC 4105 model (Elliptical) | |
| Number of particles in halo | 700,000 |
| 155 kpc | |
| 155 km s-1 | |
| 23.4 kpc | |
| Halo mass | |
| Number of particles in stellar disk | 200,000 |
| Disk mass | |
| Disk radial scale length | 3.2 kpc |
| Disk vertical scale thickness | 0.63 kpc |
| Number of particles in gas disk | 200,000 |
| Gas disk mass | |
| Gas disk radial scale length | 3.2 kpc |
| Gas disk vertical scale thickness | 0.035 kpc |
| Number of particles in spherical stellar component | 300,000 |
| Spherical component mass | |
| Spherical component radial scale length | 4.77 kpc |
| Total mass of the model | |
| Total barionic mass of the model | |
4.2 NGC 4105 model
The elliptical galaxy was modeled by two spheroidal Hernquist (1990) components, one for the stars, other for the dark matter halo:
| (2) |
where is the total mass and is the radial scale length of each component. Two models have were constructed: (i) The first one has a spherical stellar component within a concentric spherical dark matter halo to test the hypothesis that the gas present in this galaxy was stolen from NGC 4106 during the collision, as will be discussed in section 4.4; (ii) Stellar and gaseous disks were added to the second model, with exponential density profiles:
| (3) |
where , and are the stellar or gaseous disk mass, radial scale length and vertical scale length, respectively.
We start setting up our galaxy model by the values of the mass. The stellar mass is presented in the previous section. For the halo model, we took typical parameters for elliptical galaxies. The first guess for the total mass (dark plus barionic) was obtained using equation 4.249b from Binney & Tremaine (2008), based on the scalar Virial theorem. The velocity dispersion is presented in Section 3.1 (Fig. 2), from the PA , which gave us a mass of M⊙. The radial velocity curves are also used as observational beacons. During the construction of the model galaxy, we should find a good set of parameters that are committed to observational data, and still produce a dynamically stable model. The final value of the total mass is a little higher: M⊙, as the stellar mass.
All galaxy models in the present paper were set following the prescription given by Springel (2005). Spheroidal halo and bulge follow the Hernquist (1990) profile (eq. 2), while the gas and stellar disks have an exponential density profile (eq. 3). The parameters of the final model are given in Table LABEL:tab:model_par_4105.
4.3 NGC 4106 model
For NGC 4106, the S0 type galaxy, we started with the stellar mass derived from the M/L ratio obtained from the stellar population synthesis (see Sect. 4.1, and 5. For each model generated, we compare the rotation curve with the stellar radial velocity curves obtained from longslit spectroscopy (Fig. 2). The slit position PA crosses the galaxy through its nucleus, in a direction close to the galaxy minor axis (at PA ), so that no rotation is detected. The other one, at PA , is close to the major axis direction (at PA ), but does not cross the galactic center. Both radial velocity curves were corrected to estimate the rotation curve of the galaxy, as explained in Section 3.1. Then we generated a set of S0-like galaxy models, constructed with a bulge and a halo given by Hernquist (1990) spheroids (Eq. 2) and an exponential disk (Eq. 3). We plotted the corresponding rotation curve over the observed one and choose the one that best reproduces the mean observed rotation curve and is dynamically stable (i.e., it survives with its mass distribution nearly unaltered in a 1 Gyr run). It was not a fit procedure. The parameters of the final NGC 4106 model are also given in Table LABEL:tab:model_par_4106.
| Phys. Units∗ | |
| NGC 4106 model (S0) | |
| Number of particles in halo | 500,000 |
| 160 kpc | |
| 160 km s-1 | |
| 32.35 kpc | |
| Halo mass | |
| Number of particles in stellar disk | 450,000 |
| Disk mass | |
| Disk radial scale length | 2.8 kpc |
| Disk vertical scale thickness | 0.56 kpc |
| Number of particles in gas disk | 200,000 |
| Gas disk mass | |
| Gas disk radial scale length | 2.8 kpc |
| Gas disk vertical scale thickness | 0.56 kpc |
| Number of particles in bulge | 50,000 |
| Bulge mass | |
| Bulge radial scale length | 0.56 kpc |
| Total mass of the model | |
| Total barionic mass of the model | |
Each galaxy model was evolved in isolation for 3 Gyr to test stability and to allow its numerical relaxation.
| Phys. Units∗ | |
| NGC 4106 model (S0) | |
| Eccentricity | 0.9 |
| Pericenter distance | 5.7 kpc |
| Present distance | 17.7 kpc |
| -329 km s-1 | |
| Pericenter vector direction∗ | (0.004, 0.961, -0.275) |
| Orbital plane normal vector direction∗∗ | (0.356, -0.871, -0.338) |
| Present day position vector∗ | (-8.8, -4.2, -14.8) kpc |
| Present day velocity vector∗ | (-792, -91, -329) km s-1 |
| Initial galaxy separation | 1.0 Mpc |
Notes:
∗Vector components defined in a Cartesian reference frame (X, Y, Z) centered on NGC 4105, with X to the North, Y to the West, and Z in the line of sight direction, with positive values towards the observer.
∗∗The orbital plane normal vector is the direction of the orbital angular momentum (reference frame defined as in ∗).
4.4 The orbit
In order to find the orbit followed by both galaxies, we wrote a code that takes as input parameters the distance to the galaxy pair, the positions of the galaxies projected in the sky plane, the radial velocities of their mass centers. Then the algorithm calculates orbits that may lead to the present state of the system. Many thousands of orbits are presented. Then we identify families of orbits and select those that, by morphological and kinematic constraints, are suitable to take the system to its present state. Then, a large series of low resolution test simulations were run, out of which, 6 best cases were chosen and ran in higher resolution. Orbital parameters are presented in Table LABEL:tab:model_par.
The simulation starts 1 Gyr before perigalacticum, with the galaxies at an initial distance of 1 Mpc. In this initial configuration, dark matter halos are far enough from each other, so the dynamical damage caused by the sudden presence of the other galaxy model is negligible. Galaxy models were evolved in isolation for 1 Gyr, before being stacked together for the collision run.
A whole set of simulations was performed using a simple elliptical galaxy model for NGC 4105 (spherical model with dark matter and stars), with the gaseous content of the pair entirely placed in the NGC 4106 model. Remember that both galaxies have a similar amount of H I gas, as stated at the end of Section 3.2. Despite being very successful in several aspects (reproduction of morphology, kinematics, consistent evolution of the star formation rate, etc …), the model failed in one respect: there was no gas transfer from NGC 4106 to NGC 4105. From this result, we can be sure that, as already suggested by Caon et al. (2000), the gas present in NGC 4105 is pre-existing, and must have been captured in a previous event.
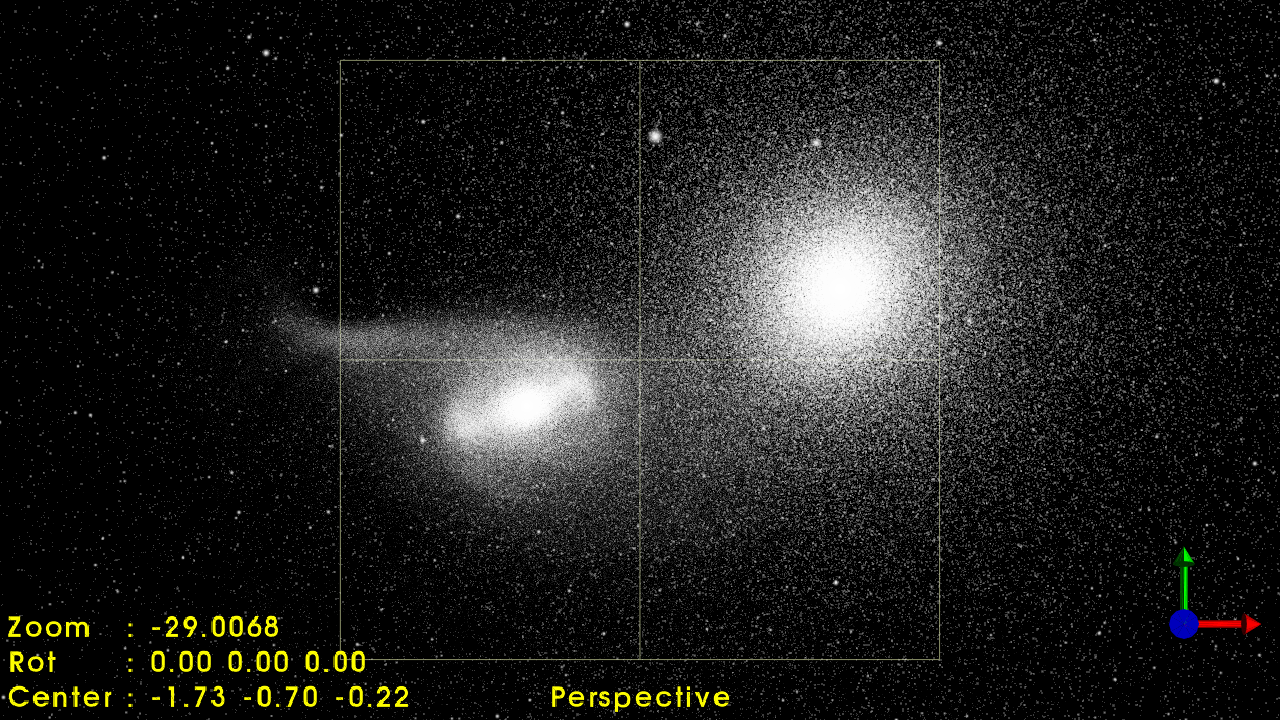
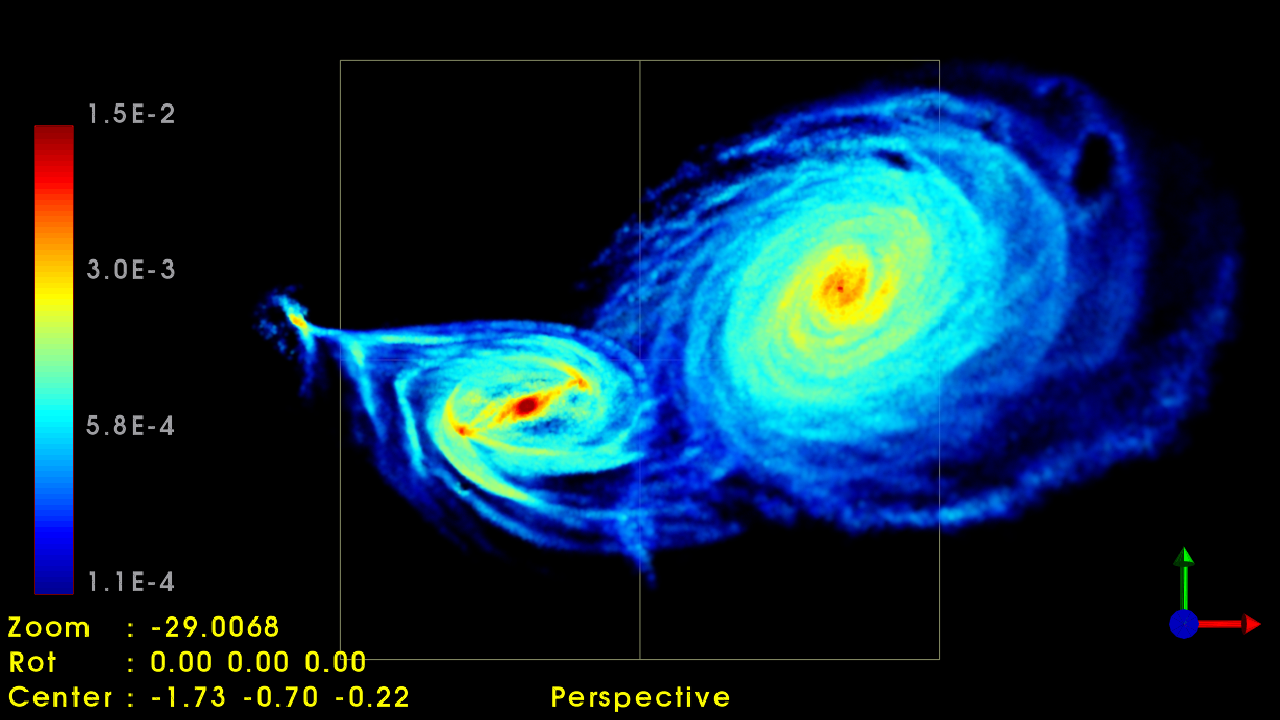
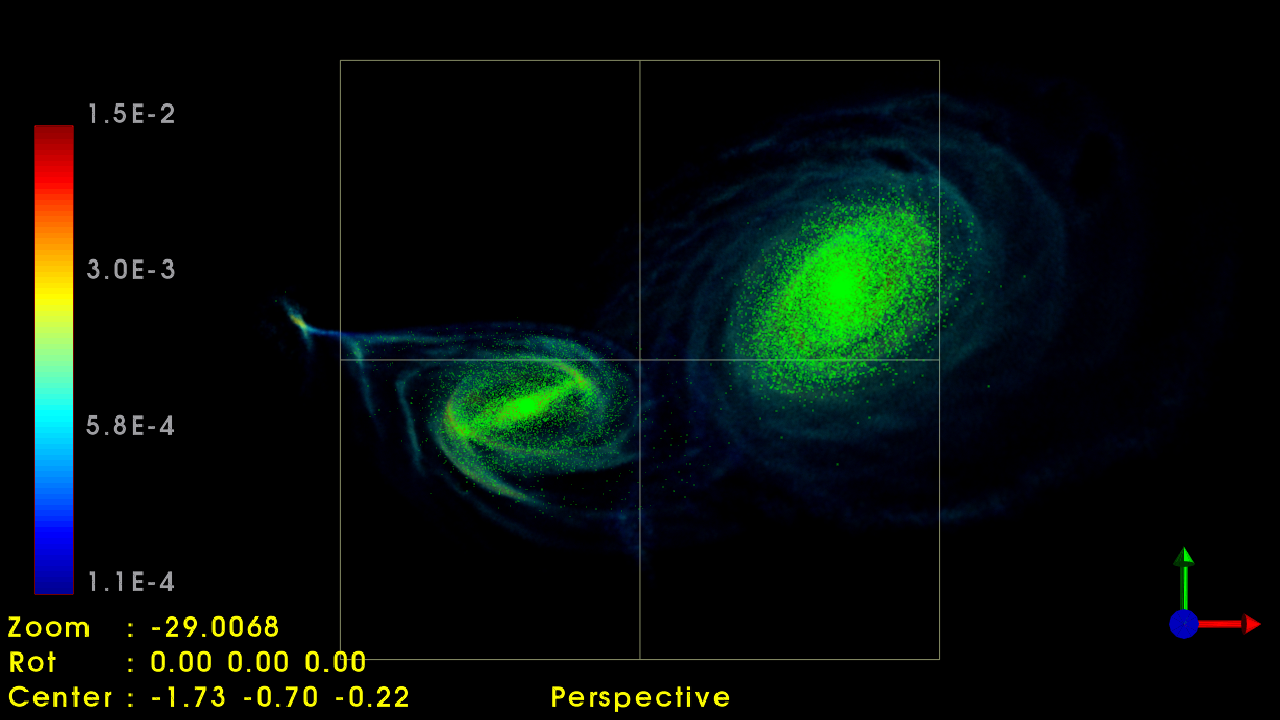
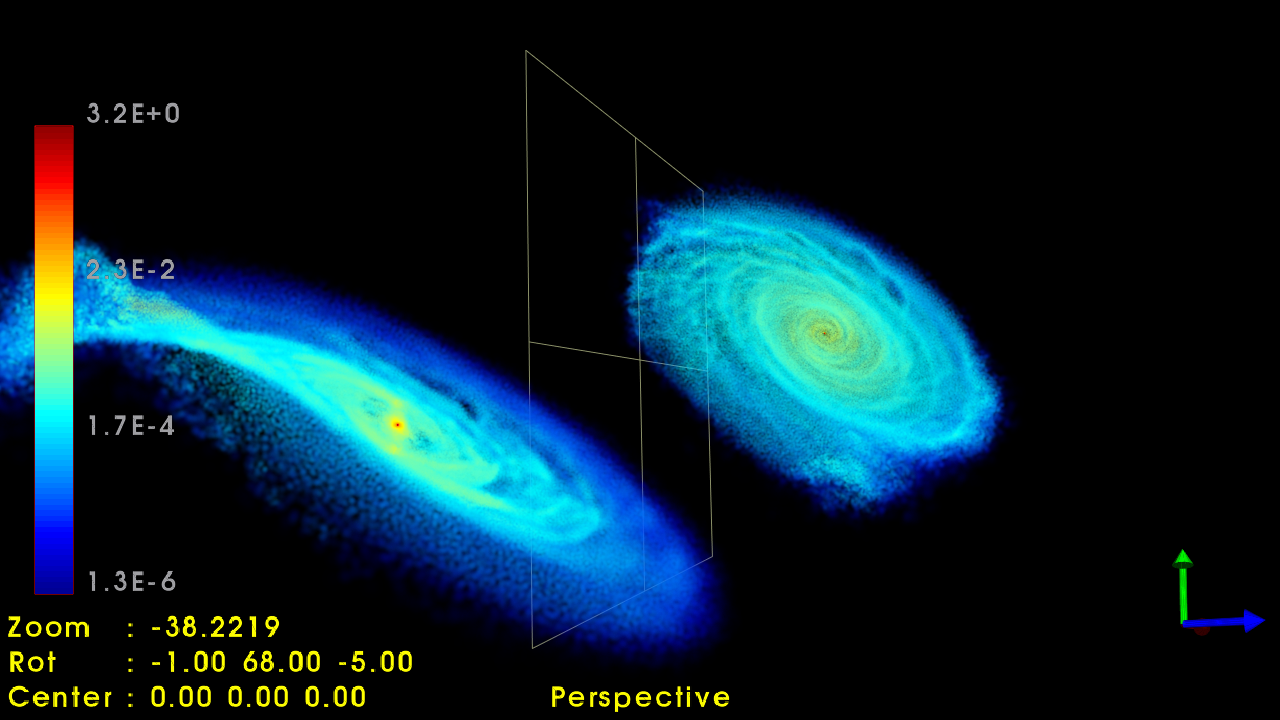
Then, the second set of simulations was run with stellar and gaseous disks placed added to the NGC 4105 model. It makes sense in view of the results by Grützbauch et al. (2009), who found dusty features in the central region and modeled the brightness distribution, concluding that it presents a disky outer structure. The subtraction of their model showed a central bar-like structure. From the best fit simulation out of this set, we present in Fig. 4 different renderings of the snapshots that reproduces the current situation of the system, 14.2 Myr after perigalacticum. The main morphological features, such as the general shape and the tidal arms, are well reproduced by the simulation. In the last panel of Fig. 4 we show the gas disks from a viewpoint different than our line of sight. The disks are completely disconnected, with no bridges, connecting tails or stream between them, showing that no gas is transferred from one galaxy to the other.
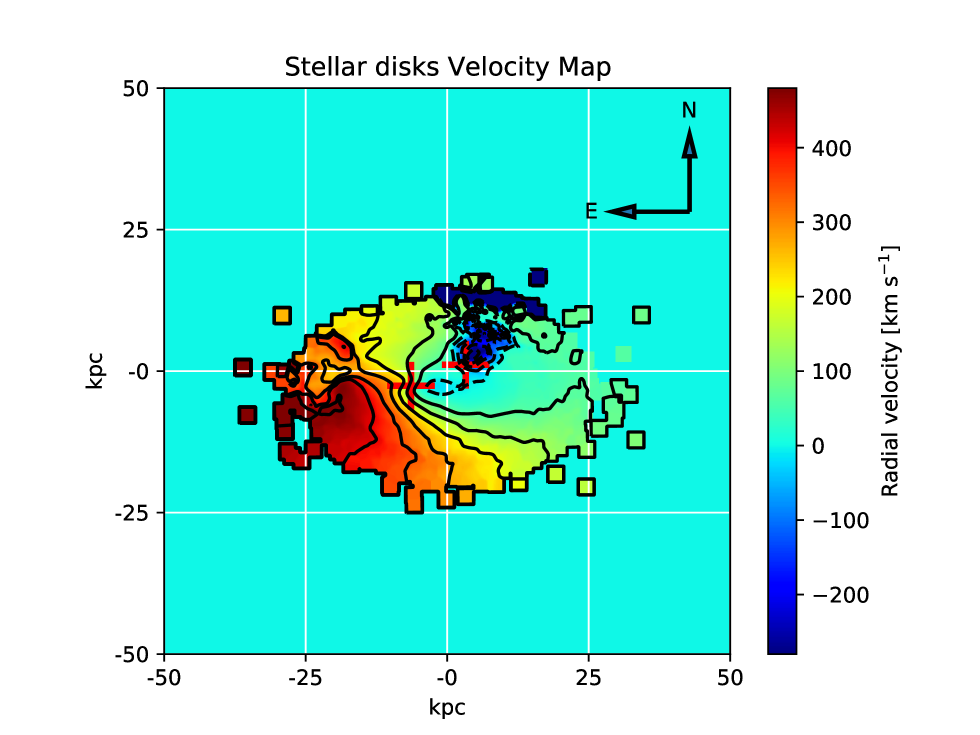
The velocity distribution, measured by long slit spectroscopy, can also be compared directly to the velocity map extracted from the simulation at the current system state. It is presented in Fig. 5, where only the stellar disks are shown.
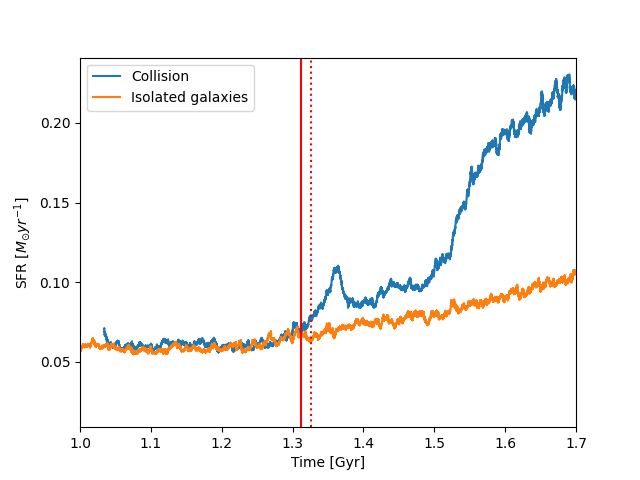
Fig. 6 shows the time evolution around perigalacticum (at 1.311 Gyr after the beginning of the simulation) of the star formation rate (SFR) during the simulation. Note that just after perigalacticum, a sudden peak in SFR occurs, as expected. We plotted in orange the SFR evolution of the isolated models to show that the peak is due to the collision. At the moment, the system is undergoing an outbreak of star formation. In Section 5 we present a stellar population synthesis, from which we detect, in some apertures, and for both galaxies, the presence of a few percent of the young stellar population. The star formation rate peaks near 60 Myr after perigalacticum, with an SFR of 0.12 M.
Regarding the radial velocity distribution (Fig. 5), it also corresponds nicely with the observed velocities over the slit positions. If we take the velocity profile along PA from the velocity map, we will have a beautiful U-shaped profile, unlike what happens along the line that connects the nuclei of the galaxies.
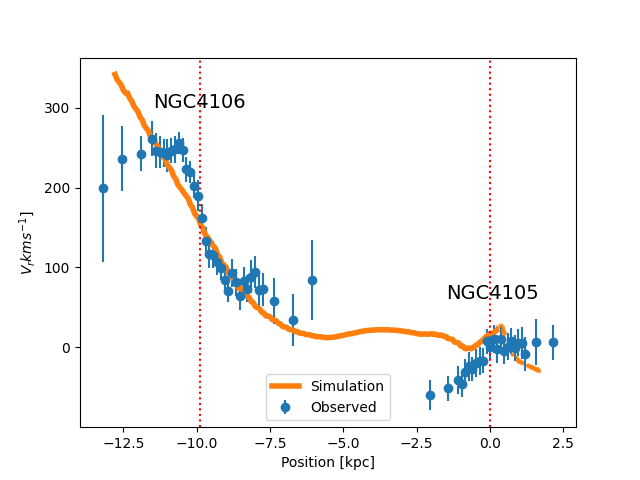
The velocity profile along the PA= is presented in Fig. 7. The overall shape of the velocity profile taken from the simulation is in good agreement with the observed one. At the left end of the graph, which corresponds to the SE side of the slit, the velocity in the simulation keeps rising to values above 300 km s-1, while the observed profile becomes flat at km s-1. This is due to the details on that part of the simulated galaxy that develops a prominent bar, stronger than that on NGC 4106. On the other side, the velocity profile in the NGC 4105 section is quite strange, with a low velocity tail in the direction of its companion galaxy. It is clear that a simulation can hardly reproduce the observations in a very high degree of detail. Both simulations and observations have limiting factors that affect the data. The objective here is to study the dynamics in general lines.
5 Stellar populations synthesis
To compute the stellar population contribution on the galaxy pair, we utilized the STARLIGHT stellar population synthesis code (Cid Fernandes et al., 2005). Full details on the code and methodology are discussed in Cid Fernandes et al. (2004, 2005); Mateus et al. (2006); Cid Fernandes et al. (2007); Asari et al. (2007). Briefly, the code fits the observed spectrum (Oλ) in terms of the overlap of simple stellar population synthesis models (SSPs) with a wide range of ages and metallicities. In this code, we adopt the empirical stellar spectral library by Bruzual & Charlot (2003). The library includes spectra with a spectral resolution of 3 Å (FWHM) over a wavelength range Å under a sampling of Å. We also adopted the Padova 1994 tracks, and an initial mass function (IMF) by Chabrier (2003) for stars of masses between 0.1 and 100 M⊙.
The basic equation of the synthetic spectrum solved by the STARLIGHT is given by:
| (4) |
where M is the synthetic flux at that rest-frame wavelength; is the population vector; ,λ is the reddened spectrum of the SSP model that is flux normalized at Å; 10 is the extinction term; represents the convolution operator; G denotes a Gaussian distribution along the line of sight centered at velocity and with a star velocity dispersion ; The population vector denote the percentage contribution of the SSPs at weighted by flux, being expressed in terms of age and metallicity (, ). The population vector can also be expressed as a function of the SSP mass fractional contribution and is designed by the vector .
The goodness-of-fit between observed and synthetic spectra is derived from an algorithm that finds the results for the minimum value of (). The intrinsic reddening is modeled by the code as due to the light scattering by dust, adopting the extinction law of Cardelli et al. (1989). The SSPs considered in this work take into account 15 ages (, , , , , , , , , , , , , and Gyr), three metallicities ( = , , and ), summing it up N SSP components.
We combined the individual components in age bins following the prescription of Cid Fernandes et al. (2005) as young stellar population, or ( yr); intermediate stellar population, or (1 yr), and old stellar population or ( yr). These components are employed to construct the SSPs with their flux () and mass () fractional contributions.
Another important point is that the STARLIGHT code usually not provide the uncertainties of the resulting parameters. However, we estimated the uncertainties of the average parameters as a function of the spectrum quality indicated by signal to noise ratio (SNR) variations. For this, we applied 20 levels of random flux perturbations over the central spectrum of each slit position observed, and calculated the percentage differences between the new estimates and standard ones. These percentage differences were scaled to the other apertures of the slit according to the SNR of the spectrum considered. We considered only spectra with a good quality signal-to-noise of the continuum (at least 10).

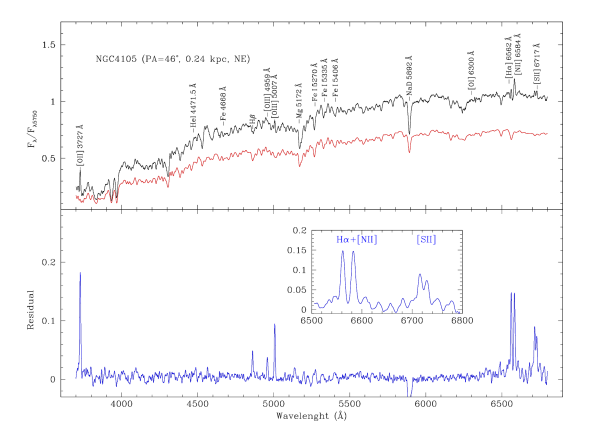
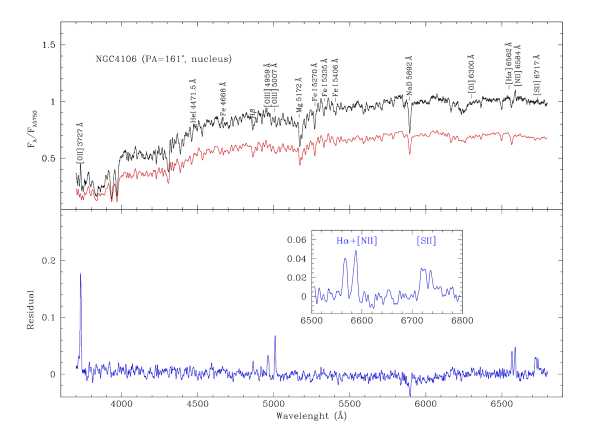
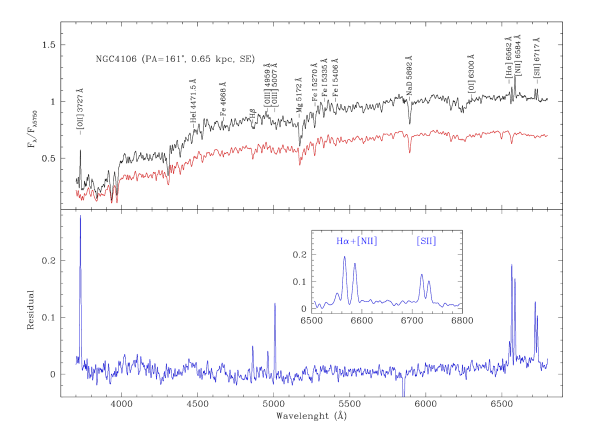
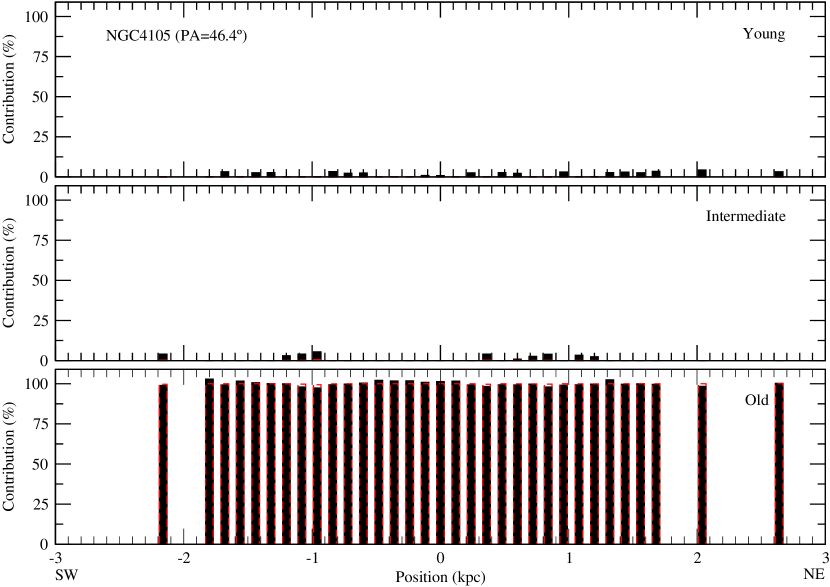
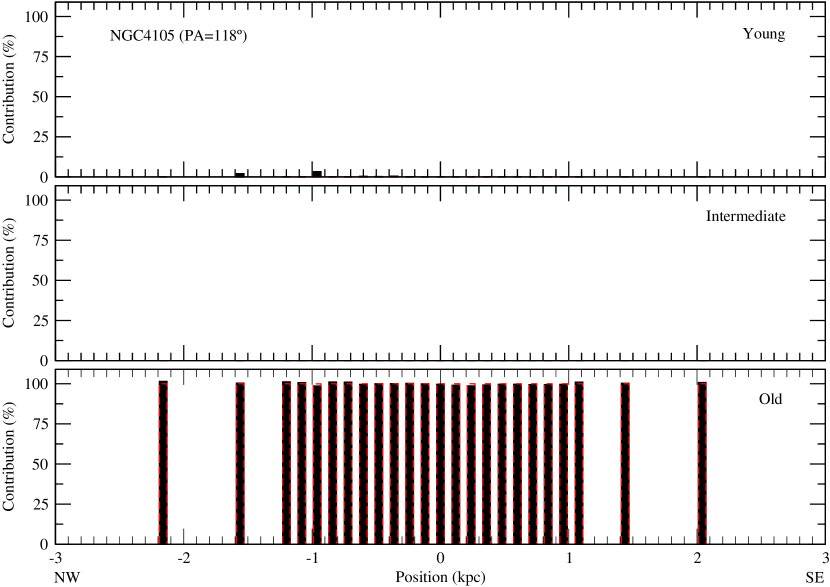
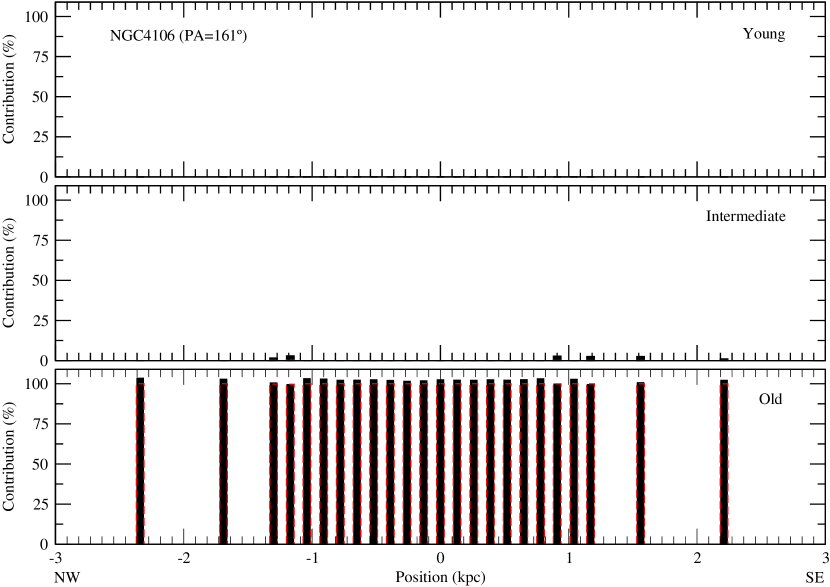
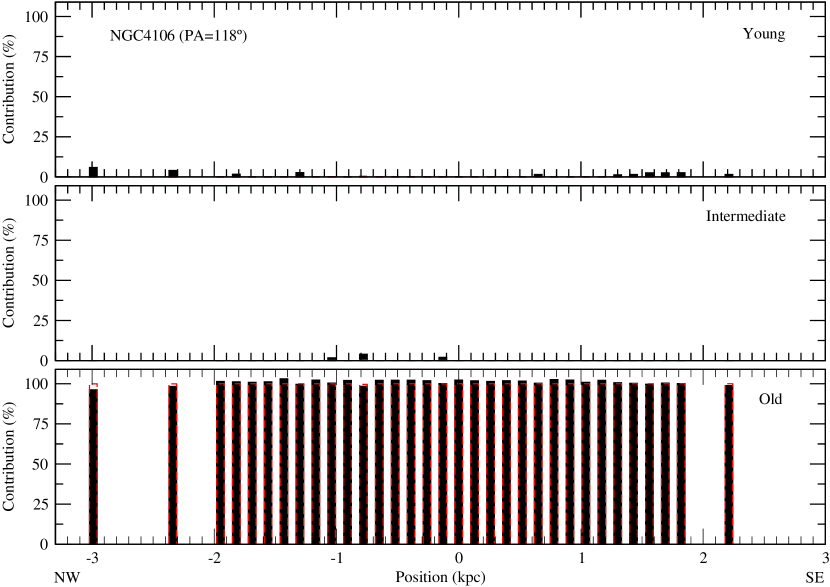
In Fig. 8 we present some examples of the results of the spectral synthesis fitting for the central and outskirt regions of NGC 4105 and NGC 4106. The results of stellar population synthesis for the individual spatial bins across the slit positions are shown in Fig. 9, stated as the fractional contribution of each base element weighted by flux and mass. It can be noted that the spatial distributions of stellar populations are homogeneous across all slit positions. NGC 4106 is a kind of lenticular galaxy, so we would expect to find a light-weighted stellar age a few billion years younger than in the elliptical galaxy NGC 4105. From the simulation, the maximum fraction of young stellar population ( Myr) in NGC 4105 would be 3.8%. What we actually found for both galaxies was that the stellar population in both galaxies is predominantly composed by the old component in light, as well as in mass, and a very small fraction (up to 5 percent) of young and intermediate population, very close to the detection threshold of the stellar population synthesis method.
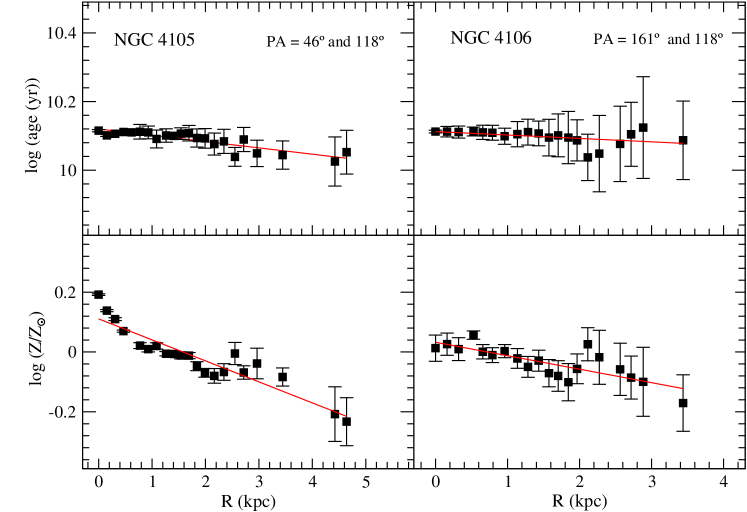
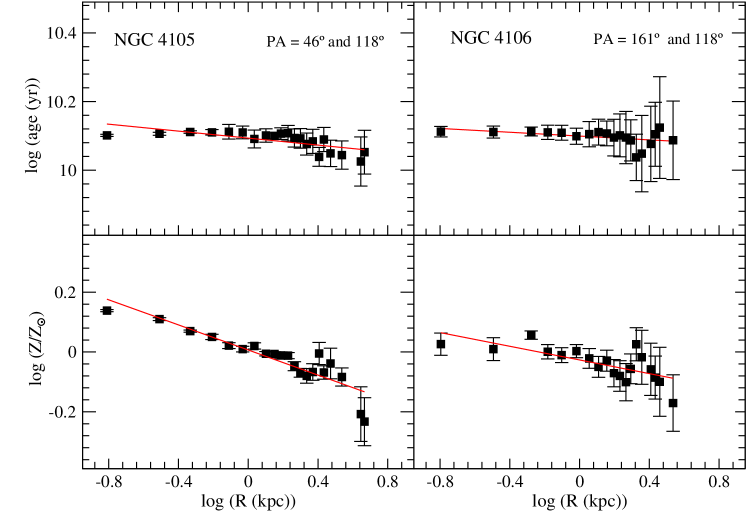
We show, in Fig. 10, the light-weighted means of stellar age and metallicity as a function of the linear distance towards the nucleus in each observed galaxy (expressed in kpc). The age (in Gyr) is presented in the logarithm scale and the metallicity Z in the logarithm scale normalized to the solar value, i.e. log () = [Z], for which to be consistent with the adopted SSPs grid. The stellar population synthesis has extracted light-weighted stellar age and metallicity on two distinct projected directions of each galaxy, across which we have also measured the stellar kinematics (see Subsection 3.1). The stellar population properties have been derived from a set of aperture spectra along radial distances up to almost 0.5 Re in the case of NGC 4105, and up to around 1 Re for NGC 4106. NGC 4105 is morphologically classified as a E3 galaxy and NGC 4106 as a SB(s)0+ galaxy, i.e. a lenticular barred galaxy. Specifically for NGC 4106, our kinematics observations have shown that the slit direction at PA = 118o is more aligned to a stellar rotating disc than one at PA = 161o, on which the maximum line-of-sight rotational velocity is km s-1 and km s-1 respectively (see Fig. 2). The other galaxy, the elliptical NGC 4105, does not exhibit any stellar rotating disc. Since the radial variations of both stellar properties are indistinguishable across both directions in each observed galaxy, we have aggregated them all for each object into a single dataset in order to estimate representative radial gradients of light-weighted stellar age and metallicity. The stellar properties derived for different apertures at each side of the radial profile across two distinct projected directions were averaged in the case they correspond to the same nuclear distance within 1 arcsec, otherwise, the apertures are individually considered. The radial distances of all apertures towards the galaxy nucleus were corrected by the inclination angle of the reference plane of each correspondent galaxy.
In the case of NGC 4105 (a massive E3 galaxy), we have measured, up to a nuclear distance of about 4.6 kpc (i.e., up to around 0.45 Re), a slightly negative gradient in age (/ = dex kpc-1 and / = ) and a very sharp negative metallicity gradient (/ = dex kpc-1 and / = ). Whilst the variation in stellar age is very small (i.e., from nearly 13 Gyr in the nucleus down to around 11 Gyr at about 0.5 Re), the metallicity deeply decreases from about [Z] = +0.1 dex in the nucleus down to nearly [Z] = -0.2 dex at about 0.5 Re.
In the case of NGC 4106 (an intermediate mass lenticular galaxy), we have measured nearly up to 3.4 kpc along the nuclear distance (i.e., up to about 1 Re) a null gradient in age (/ = dex kpc-1, / = ) and a negative metallicity gradient (/ = dex kpc-1 and / = ). Whilst the stellar age is constant around 12.6 Gyr inside 1 Re (0.6 Gyr), the metallicity decreases from around the solar value in the nucleus (+0.03 dex indeed) down to nearly [Z] = -0.1 dex at about 1 Re (-0.12 dex indeed) that closely corresponds to one third of the whole metallicity variation on a two times greater normalized radial distance in comparison against NGC 4105.
Negative gradients in stellar age and metallicity with different intensities are observed in massive early-type galaxies (especially ellipticals) (Sánchez et al., 2012; González Delgado et al., 2015; Zibetti et al., 2020), such that older metal-richer stars are found within the innermost regions of the galaxy and the relatively younger and metal-poorer stars in the outskirt ones, as a result of a long two-phase process (Oser et al., 2010). The initial phase occurs at high redshift and builds up the main body of the elliptical with stellar populations passively evolving afterwards. In the second phase lasting billions of years, minor/major dry mergers make the main body progressively bigger and redder. An extended relatively younger stellar envelope with relatively smaller metallicity than the nuclear region is also formed (Obreja et al., 2013; Huang et al., 2016). Very recently, Zibetti et al. (2020) investigated and compiled the spatial distribution of the light-weighted mean stellar age and metallicity inside extended galactic regions (i.e., up to 2 Re) in a wide variety of nearby ETGs (48 E’s and 21 S0’s extracted from the CALIFA integral field spectroscopic survey). They found that the age profiles typically follow a U-shaped variation in the plane log(age(Gyr))-Re with a minimum around 0.4 Re, asymptotically increasing outwards beyond 1.5 Re and increasing towards the nucleus. The greater the within 1 Re () is, the smaller the depth of the minimum and the central increment are, i.e., flatter the age gradient is. The metallicity gradients are found universally negative and strong such that the metallicity flattens out moving towards larger radial distances (about -0.3 dex per 1 Re within 1 Re). They analysed the metallicity profiles over the plane -. They state that a possible qualitative interpretation for their observations is a two-phase scenario for the formation of ETGs.
In comparison with the age and metallicity radial gradients investigated by Zibetti et al. (2020) in the most massive elliptical galaxies (i.e., 210 km s-1), NGC 4105 exhibits, within the central region up to 0.5 Re, a comparable change in age and a greater variation in metallicity. In the case of NGC 4106, this SB0 galaxy presents, within the central region up to 1 Re, smaller variations in both age and metallicity in comparison against ETGs with intermediate mass (i.e., 170 210 km s-1). According to E’s against S0’s, Zibetti et al. (2020) found that they all have U-shaped radial profiles in age, which are dislocated to smaller ages for S0’s by around 1.6 Gyr, and comparable metallicity gradients within 0.5 Re that become distinct between 0.5 and 1 Re (steeper in E’s).
Since the nearest approximation between the galaxies seems to have happened only 30 Myr ago, we suppose the gradients of age and metallicity in both galaxies have not been yet substantially modified by the interaction in course. Both galaxies might have preserved their intrinsic stellar population spatial distributions according to their particular mass assembly histories. In fact, Kobayashi (2004) stated that the merging histories of elliptical galaxies could, in principle, be extracted from the observed metallicity gradients in the local Universe galaxies. Kobayashi (2004) obtained that there is no correlation between metallicity gradient and galaxy mass based on a variety of chemodynamical simulations of elliptical galaxies (GRAPE-SPH code). An average gradient in metallicity that Kobayashi (2004) compiled was / = -0.3 (0.2 as dispersion). Kobayashi (2004) also concluded that E galaxies that hypothetically would have been formed through a monolithic process would have steeper gradients, while E galaxies that undergo major mergers would have shallower gradients.
The stellar population synthesis has provided small flux contributions of young and intermediate age populations (respectively, with age Myr and 100 Myr age Gyr) in both galaxies, i.e., up to about 6 per cent, which is very close to the detection limit of the stellar population synthesis applied through the STARLIGHT code. Therefore, these very small contributions did not represent any significant perturbation on the age and metallicity radial gradients. However, Grützbauch et al. (2007) argue that NGC 4106 shows a value for the H+K (Ca II) line-strength index larger than 1.3, i.e., larger than the maximum value attainable in post star-burst models (with both solar and supersolar metallicity), which suggests the presence of H in emission, considered a good indicator of recent star formation. The detection of [O II]3727, 3729 emission in the nucleus of NGC 4105 is also suggestive of a recent star formation episode.
On the one hand, in strongly interacting galaxies, in which there was some reservoir of cold gas to form new stars during a long period of time, the metallicity gradient becomes significantly flatter than the ones observed in isolated galaxies, as shown for instance by Krabbe et al. (2008); Kewley et al. (2010); Krabbe et al. (2011); Bresolin et al. (2009); Rosa et al. (2014). The shallow metallicity gradients found in strongly interacting galaxies could be explained as the interaction-induced gas flows from the outer parts to the centre of each component (Toomre & Toomre, 1972; Dalcanton, 2007). On the other hand, the observed galaxy pair under a strong interaction too, taking into account that the galaxies likely had a single encounter in a few tens of million years ago and there was no great available amount of cold gas, none significant star formation was actually induced inside both components by the mutual interaction.
6 Ionized gas properties
The presence of emission lines are not unique to star forming galaxies, but may also appear in early-type galaxies (e.g., Macchetto et al., 1996; Caon et al., 2000; Rosa et al., 2018; Diniz et al., 2018). Several studies have shown that line emission is prevalent in more than 50% of passive red galaxies (Phillips et al., 1986; Goudfrooij et al., 1994; Yan et al., 2006; Capetti & Baldi, 2011), and many of the early-type emission line galaxies show characteristic spectra of a LINER (Heckman, 1980). As can be seen in Fig. 8, after the subtraction of the modelled stellar spectrum from the observed one, the pure nebular spectra in both galaxies present pronounced emission lines, that are: [O II]3727, H, [O II]4959,5007, [N II]6548,6584, H, and [S II]6716,6731. In fact, previous studies have already detected some emission lines the elliptical galaxy NGC 4105. For example, for NGC 4105 Longhetti et al. (1998) detected [O II]3727, and Caon et al. (2000) measured [N II]6584.
The line intensities were determined from fitting Gaussian profiles on the pure emission spectra, using the SPLOT task in the NOAO.ONEDSPEC package of IRAF. The associated error with each line flux was given as , where the and are the continuum and Poisson error on the line flux, respectively. We corrected the observed line intensities for the effect of interstellar extinction. This was performed comparing the observed H/H ratio with the theoretical value of from Pengelly (1964), for an electron temperature of 10 000 K. The starburst extinction law of Calzetti et al. (1994) was adopted.
6.1 Electron density
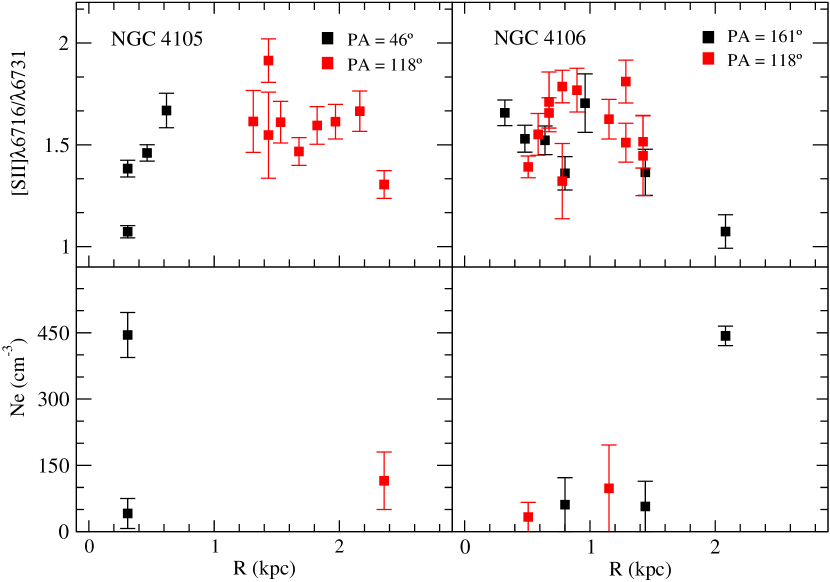
We have determined the electron density () from the observed [S II]Å ratio, using TEMDEN routine of the NEBULAR package of the STSDAS/IRAF, assuming an electron temperature of K, since the lines sensitive to temperature were not observed in both galaxies. It is important to note that some regions in both galaxies present [S II] ratio near the low-density limit, and therefore, the electron densities for these areas cannot be estimated.
The radial profiles of [S II] line ratio and are plotted in Fig. 11 as a function of the linear radial distance for NGC 4105 and NGC 4106. The values of electron density obtained for both galaxies are in the range of . These estimations are in agreement with those obtained by Krabbe et al. (2014) and Mora et al. (2019) for H II regions of interacting galaxies, which are systematically higher than those derived for isolated galaxies of , as previously estimated by Krabbe et al. (2014).
6.2 Oxygen Abundance
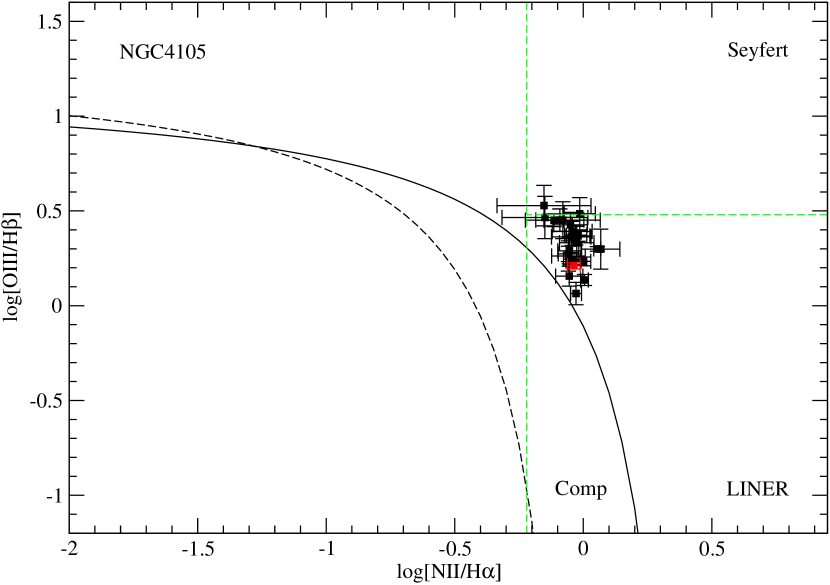
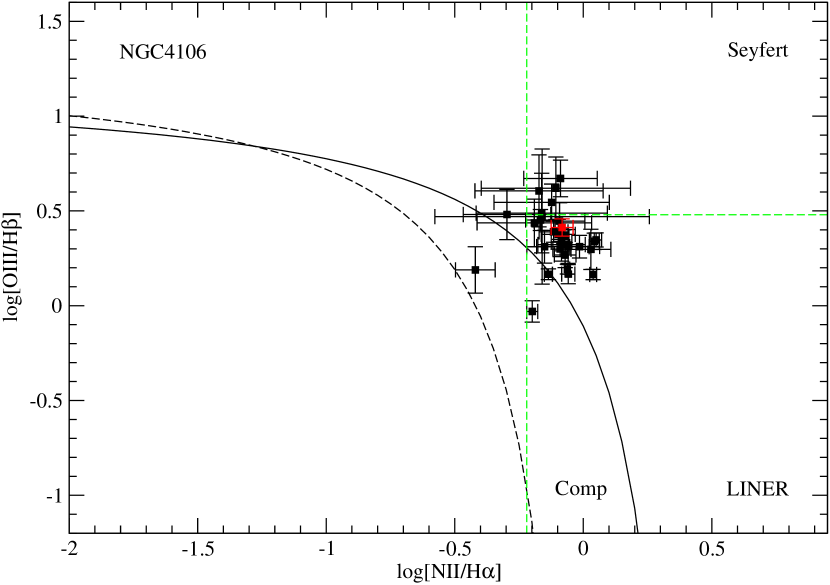
The identification of the dominant ionization source for the emitting gas across the galaxy is essential to determine the chemical abundance correctly. The elliptical galaxy, NGC 4105, is classified as a LINER galaxy by Mauch & Sadler (2007) and Véron-Cetty & Véron (2010), and NGC 4106 does not have a classification in the literature. Therefore, with the goal of confirming the ionization source of NGC 4105 and to classify NGC 4106, we used the versus diagnostic diagram proposed by Baldwin et al. (1981), and commonly known as BPT diagram. This diagram is used to distinguish objects ionized by massive stars (SF), AGN, and LINER natures. In our case, we can not use the versus because the [S II]6716,6731 emission lines presented a very low S/N in the central regions of the galaxies.
Fig. 12 present the BPT diagram for the regions measured along the different slit positions of AM 1204-292. We can note that all regions of NGC 4105 present emission like LINER, in agreement with the findings of (De Vaucouleurs et al., 1991). NGC 4106 shows extended LINER-type emission in their disc, as well as their nuclei.
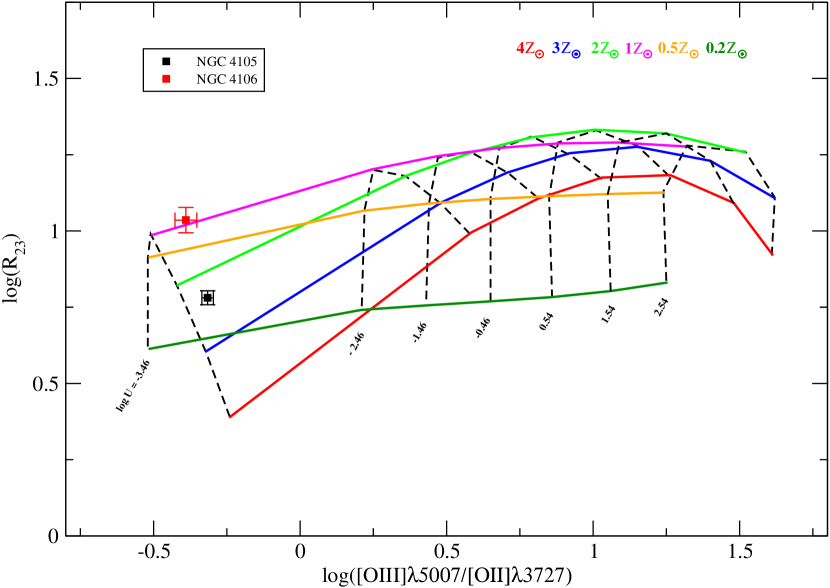
The accurate determination of the metallicity is critically dependent on the emission lines sensitive to the electron temperature, which are not detected in the spectra of the objects. Therefore, to estimate the oxygen abundance of the gas phase in the nuclear regions of each galaxy, indirect methods that use relatively strong emission lines easily observed in AGNs or SFs and/or photoionization models should be applied. The most common method used for estimating the oxygen abundance use the =([O II]3727+[O III]4959,5007)/H parameter initially proposed Pagel et al. (1979). We used the indicator to estimate the metallicity in the nuclear regions of both galaxies, comparing the observed values with a grid of photoionization models from the code CLOUDY code (Ferland et al., 2017).
The grids were built following the same methodology presented in Dors et al. (2014, 2017). We created theoretical models based on power laws of the form , where was assumed to be equal to , which is representative value for AGNs (Zamorani et al., 1981; Miller et al., 2011), with metallicities of and, ionization parameter and, and a fixed electron density value of 500 cm-3. The solar oxygen abundance of is taken from Allende Prieto et al. (2001).
Fig. 13 shows the vs. [O III]/[O II] diagram, with the observed values superposed in the computed models. Black and red squares correspond to the nuclear aperture in NGC 4105 and NGC 4106, respectively. The central O/H abundances to each object were obtained by linear interpolation from the model grid, which resulted in and for NGC 4105 and NGC 4106, respectively. We compared the metallicities obtained from the gas and stellar phase and verified that for NGC 4106 the is the same, that is, , and for NGC 4105, the metallicity in the stellar phase () is slightly lower than that obtained from the gas , about 30%.
7 Conclusions
With the present paper, we aimed at understanding the effects of the interaction in the stellar and gas kinematics, stellar populations and ionized gas properties in the strongly interacting system pair AM 1209-292. Long-slit spectra in the range Å were obtained with the Goodman High Throughput Spectrograph attached to the m SOAR telescope. The main results are the following:
-
1.
No signs of rotation were detected in the stellar components over both slit directions observed for NGC 4105. As for gas, the kinematics show a clear pattern of rotation for PA=, that is, gas and stars do not share the same kinematics. We can deduce from this that the ionized gas in NGC 4105 is of external origin and that it must have been incorporated into the galaxy recently. However, it was not the result of the ongoing interaction with NGC 4106, as the modeling of the system dynamics indicates. In contrast, NGC 4106 shows nearly symmetrical rotation curves across both slit directions, and a dynamical mass of was calculated from the V0 = 1386 km s-1 at a radius of 3.64 kpc.
-
2.
We also perform a set of N-body numerical simulations of the encounter between both components using P-Gadget3 TreePM/SPH code. It was found that the perigalacticum would have occurred about 14.2 Myr ago. At this point, the system is undergoing an outbreak of star formation. In addition, our models successfully reproduce some important observational features of the system.
-
3.
The contribution of the stellar components in relation to the optical flux at Å for both galaxies is dominated by old ( yr) population, with a not negligible contribution of an intermediate population and a small amount of young population.
-
4.
The electron density estimates for the pair AM 1204-292 are systematically higher than those derived for isolated galaxies in the literature. Some regions of NGC 4106 and NGC 4105 galaxies show an increment of towards the outskirt and in the close central region, respectively.
-
5.
We observe a LINER-like line ratio in all regions of NGC 4105. While NGC 4106 shows extended LINER-type emission in the disc, as well as their nuclei.
-
6.
The central O/H abundances to NGC 4105 and NGC 4106 were obtained by linear interpolation from a model grid and intensity of emission lines, which resulted in and for NGC 4105 and NGC 4106, respectively.
-
7.
We compared the metallicities obtained from the gas and stellar phase and verified that for NGC 4106 the is the same, that is, , and for NGC 4105, the metallicity in the stellar phase () is slightly lower than that obtained from the gas , about 30%.
In summary, the current work has contributed to the understanding of how the mutual dynamic perturbation in a strongly interacting galaxy pair can disturb the global morphology of each galaxy, the stellar and gas kinematics, the physic-chemical properties of the gaseous component, and the stellar formation inside each one of the galaxies. The AGN phenomenon can also be intensified by encounters between galaxies containing gas in some amount, having been investigated in this work as well. Curiously, the system contains galaxies of different morphological types (and with distinct masses too), such that one object could have been wrongly classified as a spiral galaxy due to the formation of a double tidal stellar tail during the interaction as proposed by us, which has easily been misinterpreted as a spiral arm. This kind of observational study on a detailed characterization of both stellar and gaseous components, when confronted with a set of N-body numerical simulations for the encounter, has provided a lot of interesting results about the formation and evolution of interacting galaxies in very low density environments like nearby galaxy pairs and sparse groups.
Acknowledgements
D. A. Rosa is grateful for the scholarship from CAPES and CNPq foundations for the PCI/MCTIC/INPE posdoc fellowship (process 300082/2016-9). I. Rodrigues and A. Krabbe thank the Brazilian foundation CNPq/MCTIC (grants number 313489/2018-1 and 311331/2017-3, respectively). A. Krabbe thanks FAPESP (grant number 2016/21532-9). Numerical simulations were run on the Hypercubo HPC cluster at IP&D-UNIVAP (FINEP 01.10.0661-00, FAPESP 2011/13250-0, FAPESP 2013/17247-9 and FAPESP 2014/10489-0). We all acknowledge the usage of the HyperLeda database (http://leda.univ-lyon1.fr). This research made use of the NASA/IPAC Extragalactic Database (NED), which is operated by the Jet Propulsion Laboratory, California Institute of Technology, under contract with the National Aeronautics and Space Administration. IRAF is written and supported by the National Optical Astronomy Observatories (NOAO) in Tucson, Arizona. NOAO is operated by the Association of Universities for Research in Astronomy (AURA), Inc. under cooperative agreement with the National Science Foundation. We would like to thank Louis Ho, Zhao-Yu Li, and the CGS team for kindly providing the image in the band of AM 1204-292.
Data Availability
The data underlying this article will be shared on reasonable request to the corresponding author.
References
- Allende Prieto et al. (2001) Allende Prieto C., Lambert D. L., Asplund M., 2001, ApJ, 556, L63
- Alonso et al. (2018) Alonso S., Coldwell G., Duplancic F., Mesa V., Lambas D. G., 2018, A&A, 618, A149
- Arp et al. (1987) Arp H., Madore B., Roberton W., 1987, A Catalogue of Southern Peculiar Galaxies and Associations. A Catalogue of Southern Peculiar Galaxies and Associations 2 Volume Hardback Set, Cambridge University Press, https://books.google.com.br/books?id=TnzvAAAAMAAJ
- Asari et al. (2007) Asari N. V., Cid Fernandes R., Stasińska G., Torres-Papaqui J. P., Mateus A., Sodré L., Schoenell W., Gomes J. M., 2007, MNRAS, 381, 263
- Bait et al. (2017) Bait O., Barway S., Wadadekar Y., 2017, MNRAS, 471, 2687
- Baldwin et al. (1981) Baldwin J. A., Phillips M. M., Terlevich R., 1981, PASP, 93, 5
- Barnes (2002) Barnes J. E., 2002, MNRAS, 333, 481
- Barrera-Ballesteros et al. (2015) Barrera-Ballesteros J. K., et al., 2015, A&A, 579, A45
- Bertola et al. (1991) Bertola F., Bettoni D., Danziger J., Sadler E., Sparke L., de Zeeuw T., 1991, ApJ, 373, 369
- Binney & Tremaine (2008) Binney J., Tremaine S., 2008, Galactic Dynamics: Second Edition. Princeton University Press
- Bottinelli & Gouguenheim (1979) Bottinelli L., Gouguenheim L., 1979, A&A, 74, 172
- Bresolin et al. (2009) Bresolin F., Ryan-Weber E., Kennicutt R. C., Goddard Q., 2009, ApJ, 695, 580
- Bruzual & Charlot (2003) Bruzual G., Charlot S., 2003, MNRAS, 344, 1000
- Calzetti et al. (1994) Calzetti D., Kinney A. L., Storchi-Bergmann T., 1994, ApJ, 429, 582
- Caon et al. (2000) Caon N., Macchetto D., Pastoriza M., 2000, ApJS, 127, 39
- Capaccioli et al. (2015) Capaccioli M., et al., 2015, A&A, 581, A10
- Capetti & Baldi (2011) Capetti A., Baldi R. D., 2011, A&A, 529, A126
- Cardelli et al. (1989) Cardelli J. A., Clayton G. C., Mathis J. S., 1989, ApJ, 345, 245
- Chabrier (2003) Chabrier G., 2003, Publications of the Astronomical Society of the Pacific, 115, 763–795
- Cid Fernandes et al. (2004) Cid Fernandes R., Gu Q., Melnick J., Terlevich E., Terlevich R., Kunth D., Rodrigues Lacerda R., Joguet B., 2004, MNRAS, 355, 273
- Cid Fernandes et al. (2005) Cid Fernandes R., Mateus A., Sodré L., Stasińska G., Gomes J. M., 2005, MNRAS, 358, 363
- Cid Fernandes et al. (2007) Cid Fernandes R., Asari N. V., Sodré L., Stasińska G., Mateus A., Torres-Papaqui J. P., Schoenell W., 2007, MNRAS, 375, L16
- Croton et al. (2006) Croton D. J., et al., 2006, MNRAS, 365, 11
- Dalcanton (2007) Dalcanton J. J., 2007, ApJ, 658, 941
- Darg et al. (2010) Darg D. W., et al., 2010, MNRAS, 401, 1552
- De Mello et al. (1995) De Mello D. F., Keel W. C., Sulentic J. W., Rampazzo R., Bica E., White R. E. I., 1995, A&A, 297, 331
- De Mello et al. (1996) De Mello D. F., Sulentic J. W., de Souza R. E., Reduzzi L., Rampazzo R., 1996, A&A, 308, 387
- De Vaucouleurs et al. (1991) De Vaucouleurs G., de Vaucouleurs A., Corwin Jr. H. G., Buta R. J., Paturel G., Fouque P., 1991, Sky & Telesc., 82, 621
- Di Matteo et al. (2008) Di Matteo P., Bournaud F., Martig M., Combes F., Melchior A.-L., Semelin B., 2008, A&A, 492, 31
- Diniz et al. (2018) Diniz M. R., Riffel R. A., Dors O. L., 2018, Research Notes of the American Astronomical Society, 2, 3
- Donley et al. (2018) Donley J. L., et al., 2018, ApJ, 853, 63
- Donzelli & Pastoriza (2000) Donzelli C. J., Pastoriza M. G., 2000, AJ, 120, 189
- Dors et al. (2014) Dors O. L., Cardaci M. V., Hägele G. F., Krabbe Â. C., 2014, MNRAS, 443, 1291
- Dors et al. (2017) Dors Jr. O. L., Arellano-Córdova K. Z., Cardaci M. V., Hägele G. F., 2017, MNRAS, 468, L113
- Drzazga et al. (2011) Drzazga R. T., Chyży K. T., Jurusik W., Wiórkiewicz K., 2011, A&A, 533, A22
- Duflot et al. (1995) Duflot M., Fehrenbach C., Mannone C., Burnage R., Genty V., 1995, A&AS, 110, 177
- Eliche-Moral et al. (2011) Eliche-Moral M. C., González-García A. C., Balcells M., Aguerri J. A. L., Gallego J., Zamorano J., Prieto M., 2011, A&A, 533, A104
- Ellison et al. (2011) Ellison S. L., Patton D. R., Mendel J. T., Scudder J. M., 2011, MNRAS, 418, 2043
- Ferland et al. (2017) Ferland G. J., et al., 2017, Rev. Mex. Astron. Astrofis., 53, 385
- Fernandes de Mello (1995) Fernandes de Mello D., 1995, PASP, 107, 1129
- Focardi et al. (2008) Focardi P., Zitelli V., Marinoni S., 2008, A&A, 484, 655
- González Delgado et al. (2015) González Delgado R. M., et al., 2015, A&A, 581, A103
- Goudfrooij et al. (1994) Goudfrooij P., Hansen L., Jorgensen H. E., Norgaard-Nielsen H. U., 1994, A&AS, 105, 341
- Grützbauch et al. (2007) Grützbauch R., Trinchieri G., Rampazzo R., Held E. V., Rizzi L., Sulentic J. W., Zeilinger W. W., 2007, AJ, 133, 220
- Grützbauch et al. (2009) Grützbauch R., Zeilinger W. W., Rampazzo R., Held E. V., Sulentic J. W., Trinchieri G., 2009, A&A, 502, 473
- Heckman (1980) Heckman T. M., 1980, A&A, 500, 187
- Henriques et al. (2019) Henriques B. M. B., White S. D. M., Lilly S. J., Bell E. F., Bluck A. F. L., Terrazas B. A., 2019, MNRAS, 485, 3446
- Hernquist (1990) Hernquist L., 1990, ApJ, 356, 359
- Herrera-Endoqui et al. (2015) Herrera-Endoqui M., Díaz-García S., Laurikainen E., Salo H., 2015, A&A, 582, A86
- Ho et al. (1997) Ho L. C., Filippenko A. V., Sargent W. L. W., 1997, ApJS, 112, 315
- Ho et al. (2011) Ho L. C., Li Z.-Y., Barth A. J., Seigar M. S., Peng C. Y., 2011, ApJS, 197, 21
- Huang et al. (2016) Huang S., Ho L. C., Peng C. Y., Li Z.-Y., Barth A. J., 2016, ApJ, 821, 114
- Kauffmann et al. (2003) Kauffmann G., et al., 2003, MNRAS, 346, 1055
- Kewley et al. (2001) Kewley L. J., Dopita M. A., Sutherland R. S., Heisler C. A., Trevena J., 2001, ApJ, 556, 121
- Kewley et al. (2010) Kewley L. J., Rupke D., Zahid H. J., Geller M. J., Barton E. J., 2010, ApJ, 721, L48
- Kim et al. (2012) Kim T., et al., 2012, ApJ, 753, 43
- Knapen et al. (2015) Knapen J. H., Cisternas M., Querejeta M., 2015, MNRAS, 454, 1742
- Kobayashi (2004) Kobayashi C., 2004, MNRAS, 347, 740
- Koprolin & Zeilinger (2000) Koprolin W., Zeilinger W. W., 2000, A&AS, 145, 71
- Krabbe et al. (2008) Krabbe A. C., Pastoriza M. G., Winge C., Rodrigues I., Ferreiro D. L., 2008, MNRAS, 389, 1593
- Krabbe et al. (2011) Krabbe A. C., Pastoriza M. G., Winge C., Rodrigues I., Dors O. L., Ferreiro D. L., 2011, MNRAS, 416, 38
- Krabbe et al. (2014) Krabbe A. C., Rosa D. A., Dors O. L., Pastoriza M. G., Winge C., Hägele G. F., Cardaci M. V., Rodrigues I., 2014, MNRAS, 437, 1155
- Kurtz & Mink (1998) Kurtz M. J., Mink D. J., 1998, PASP, 110, 934
- Larson & Tinsley (1978) Larson R. B., Tinsley B. M., 1978, ApJ, 219, 46
- Li et al. (2011) Li Z.-Y., Ho L. C., Barth A. J., Peng C. Y., 2011, ApJS, 197, 22
- Longhetti et al. (1998) Longhetti M., Rampazzo R., Bressan A., Chiosi C., 1998, A&AS, 130, 267
- Longhetti et al. (2000) Longhetti M., Bressan A., Chiosi C., Rampazzo R., 2000, A&A, 353, 917
- Macchetto et al. (1996) Macchetto F., Pastoriza M., Caon N., Sparks W. B., Giavalisco M., Bender R., Capaccioli M., 1996, A&AS, 120, 463
- Makarov et al. (2014) Makarov D., Prugniel P., Terekhova N., Courtois H., Vauglin I., 2014, A&A, 570, A13
- Mateus et al. (2006) Mateus A., Sodré L., Cid Fernandes R., Stasińska G., Schoenell W., Gomes J. M., 2006, MNRAS, 370, 721
- Mauch & Sadler (2007) Mauch T., Sadler E. M., 2007, MNRAS, 375, 931
- Mendes de Oliveira & Hickson (1994) Mendes de Oliveira C., Hickson P., 1994, ApJ, 427, 684
- Méndez-Abreu et al. (2012) Méndez-Abreu J., Sánchez-Janssen R., Aguerri J. A. L., Corsini E. M., Zarattini S., 2012, ApJ, 761, L6
- Miller et al. (2011) Miller B. P., Brandt W. N., Schneider D. P., Gibson R. R., Steffen A. T., Wu J., 2011, ApJ, 726, 20
- Mink & Wyatt (1995) Mink D. J., Wyatt W. F., 1995, in Shaw R. A., Payne H. E., Hayes J. J. E., eds, Astronomical Society of the Pacific Conference Series Vol. 77, Astronomical Data Analysis Software and Systems IV. p. 496
- Mora et al. (2019) Mora M. D., Torres-Flores S., Firpo V., Hernandez-Jimenez J. A., Urrutia-Viscarra F., Mendes de Oliveira C., 2019, MNRAS, 488, 830
- Moreno et al. (2015) Moreno J., Torrey P., Ellison S. L., Patton D. R., Bluck A. F. L., Bansal G., Hernquist L., 2015, MNRAS, 448, 1107
- Muñoz-Elgueta et al. (2018) Muñoz-Elgueta N., Torres-Flores S., Amram P., Hernandez-Jimenez J. A., Urrutia-Viscarra F., Mendes de Oliveira C., Gómez-López J. A., 2018, MNRAS,
- Obreja et al. (2013) Obreja A., Domínguez-Tenreiro R., Brook C., Martínez-Serrano F. J., Doménech-Moral M., Serna A., Mollá M., Stinson G., 2013, ApJ, 763, 26
- Oser et al. (2010) Oser L., Ostriker J. P., Naab T., Johansson P. H., Burkert A., 2010, ApJ, 725, 2312
- Pagel et al. (1979) Pagel B. E. J., Edmunds M. G., Blackwell D. E., Chun M. S., Smith G., 1979, MNRAS, 189, 95
- Patton et al. (2011) Patton D. R., Ellison S. L., Simard L., McConnachie A. W., Mendel J. T., 2011, MNRAS, 412, 591
- Patton et al. (2013) Patton D. R., Torrey P., Ellison S. L., Mendel J. T., Scudder J. M., 2013, MNRAS, 433, L59
- Pengelly (1964) Pengelly R. M., 1964, MNRAS, 127, 145
- Phillips et al. (1986) Phillips M. M., Jenkins C. R., Dopita M. A., Sadler E. M., Binette L., 1986, AJ, 91, 1062
- Presotto et al. (2010) Presotto V., Iovino A., Pompei E., Temporin S., 2010, A&A, 510, A31
- Reduzzi & Rampazzo (1996) Reduzzi L., Rampazzo R., 1996, A&AS, 116, 515
- Renaud (2010) Renaud F., 2010, PhD thesis, PhD Thesis, 281 pages, 121 figures, 2010
- Roche et al. (2015) Roche N., Humphrey A., Gomes J. M., Papaderos P., Lagos P., Sánchez S. F., 2015, MNRAS, 453, 2349
- Rodrigues et al. (1999) Rodrigues I., Dottori H., Brinks E., Mirabel I. F., 1999, AJ, 117, 2695
- Rogers et al. (2009) Rogers B., Ferreras I., Kaviraj S., Pasquali A., Sarzi M., 2009, MNRAS, 399, 2172
- Rosa et al. (2014) Rosa D. A., Dors O. L., Krabbe A. C., Hägele G. F., Cardaci M. V., Pastoriza M. G., Rodrigues I., Winge C., 2014, MNRAS, 444, 2005
- Rosa et al. (2018) Rosa D. A., Milone A. C., Krabbe A. C., Rodrigues I., 2018, Astrophysics and Space Science, 363, 131
- Salo et al. (2015) Salo H., et al., 2015, ApJS, 219, 4
- Samurović & Danziger (2005) Samurović S., Danziger I. J., 2005, MNRAS, 363, 769
- Sánchez et al. (2012) Sánchez S. F., et al., 2012, A&A, 538, A8
- Sánchez et al. (2013) Sánchez S. F., et al., 2013, A&A, 554, A58
- Sánchez et al. (2014) Sánchez S. F., et al., 2014, A&A, 563, A49
- Sandage & Tammann (1981) Sandage A., Tammann G. A., 1981, A Revised Shapley-Ames Catalog of Bright Galaxies. Carnegie Institution of Washington
- Satyapal et al. (2014) Satyapal S., Ellison S. L., McAlpine W., Hickox R. C., Patton D. R., Mendel J. T., 2014, MNRAS, 441, 1297
- Silverman et al. (2011) Silverman J. D., et al., 2011, ApJ, 743, 2
- Springel (2005) Springel V., 2005, MNRAS, 364, 1105
- Springel & Hernquist (2002) Springel V., Hernquist L., 2002, MNRAS, 333, 649
- Springel & Hernquist (2003) Springel V., Hernquist L., 2003, MNRAS, 339, 289
- Tonry & Davis (1979) Tonry J., Davis M., 1979, AJ, 84, 1511
- Toomre & Toomre (1972) Toomre A., Toomre J., 1972, ApJ, 178, 623
- Torrey et al. (2012) Torrey P., Cox T. J., Kewley L., Hernquist L., 2012, ApJ, 746, 108
- Trinchieri & Rampazzo (2001) Trinchieri G., Rampazzo R., 2001, A&A, 374, 454
- Trouille et al. (2011) Trouille L., Barger A. J., Tremonti C., 2011, ApJ, 742, 46
- Véron-Cetty & Véron (2010) Véron-Cetty M.-P., Véron P., 2010, A&A, 518, A10
- Weaver et al. (2018) Weaver J., et al., 2018, A&A, 614, A32
- Woods & Geller (2007) Woods D. F., Geller M. J., 2007, AJ, 134, 527
- Wright (2006) Wright E. L., 2006, PASP, 118, 1711
- Xu et al. (2010) Xu C. K., et al., 2010, ApJ, 713, 330
- Yadav & Chen (2018) Yadav J. K., Chen X., 2018, Journal of Astrophysics and Astronomy, 39, 31
- Yan et al. (2006) Yan R., Newman J. A., Faber S. M., Konidaris N., Koo D., Davis M., 2006, ApJ, 648, 281
- Zamorani et al. (1981) Zamorani G., et al., 1981, ApJ, 245, 357
- Zibetti et al. (2020) Zibetti S., Gallazzi A. R., Hirschmann M., Consolandi G., Falcón-Barroso J., van de Ven G., Lyubenova M., 2020, MNRAS, 491, 3562