The hunt for sub-solar primordial black holes in low mass ratio binaries is open
Abstract
We perform a search for binary black hole mergers with one subsolar mass black hole and a primary component above in the second observing run of LIGO/Virgo. Our analysis therefore extends previous searches into a mass region motivated by the presence of a peak in any broad mass distribution of primordial black holes (PBHs) around coming from the equation of state reduction at the QCD transition. Four candidate events are found passing a false alarm rate (FAR) threshold of 2 per year, although none are statistically significant enough for being clear detections. We first derive model independent limits on the PBH merging rates assuming a null result of the search. Then we confront them to two recent scenarios in which PBHs can constitute up to the totality of the Dark Matter, explain LIGO/Virgo mergers and the possible observation of a stochastic gravitational-wave background by NANOGrav. We find that these models still pass the rate limits and conclude that the analysis of the O3 and O4 observing runs will be decisive to test the hypothesis of a primordial origin of black hole mergers.
Introduction
The first detection of a gravitational wave (GW) event (GW150914) Abbott et al. (2016a) has ushered astronomy into a GW era. Since then more than fourty binary black hole (BBH) mergers Abbott et al. (2020a, b, c, 2017a, 2016b, 2017b, 2017c, 2019a, d, 2016c) have been observed by Advanced LIGO Aasi et al. (2015) and Advanced Virgo Acernese et al. (2015), revealing some intriguing and mostly unexpected properties of BBHs: large masses, low spins, the existence of black holes (BHs) in the low mass gap Abbott et al. (2020b) or in the pair-instability mass gap Abbott et al. (2020a) and with low mass ratios Abbott et al. (2020b). Elucidating the origin of LIGO-Virgo BHs has emerged as an important research topic. One of the most attracting possibilities is that some are primordial black holes (PBHs) Bird et al. (2016); Clesse and García-Bellido (2017); Sasaki et al. (2016).
PBHs may have formed in the early Universe due to the gravitational collapse of large overdensities Zel’dovich and Novikov (1967); Hawking (1971); Carr and Hawking (1974); Chapline (1975), e.g. coming from inflation Carr and Lidsey (1993); Ivanov et al. (1994); Garcia-Bellido et al. (1996); Kim and Lee (1996), and could explain from a fraction to the totality of the dark matter (DM). There exist a series of astrophysical and cosmological limits on their abundance, covering almost all possible masses (see e.g.Carr et al. (2016, 2010) for reviews on PBHs and Carr et al. (2020); Carr and Kuhnel (2020); Green and Kavanagh (2021) for recent developments), as well as possible clues in observations Clesse and García-Bellido (2018); Carr et al. (2021). Those limits and observations are however model dependent, some are debated and today the status of PBHs to explain all the DM and GW observations is still controversial.
Contrary to stellar BHs, there is no physical process preventing the formation of PBHs lighter than the Chandrasekhar mass Chandrasekhar (1931) or in the pair-instability mass gap Rakavy and Shaviv (1967); Fraley (1968). The subsolar and intermediate mass ranges are thus ideal targets to distinguish between stellar and primordial origins. If some of the observed BH mergers are primordial, one can expect a relatively broad mass distribution of PBHs spreading within these interesting regions. In such a case, the known thermal history of the Universe at the QCD epoch unavoidably leads to features in the PBH mass distribution, in particular a peak around the solar-mass and a bump around Byrnes et al. (2018). These features naturally arise from the expected reduction of the equation-of-state at the QCD transition that impacts the overdensity threshold for PBH formation. They could explain the LIGO/Virgo merging rates, in particular the rates associated to the exceptional events GW190521 Abbott et al. (2020a), GW190814 Abbott et al. (2020b) and even GW190425 Abbott et al. (2020e) if its two components are not neutron stars but PBHs from the QCD peak at Carr et al. (2021); Clesse and Garcia-Bellido (2020). Such a peak can explain a series of OGLE microlensing events Wyrzykowski and Mandel (2020) towards the galactic center, due to BHs in the mass gap Carr et al. (2021). If they compose an important DM fraction, these PBHs must have boosted the formation of halos at high redshifts and thereby could explain the unexpected correlations between the infrared and the source-subtracted X-ray backgrounds Kashlinsky (2016). The same effect can be invoked to evade the microlensing limits Carr et al. (2021) – the only relevant ones at this mass – that only apply to a homogeneous PBH distribution in galactic halos. All this provides strong theoretical and observational motivations to extend previous subsolar searches in the first Abbott et al. (2018a) and second Abbott et al. (2019b) observing runs of LIGO/Virgo (referred as O1 and O2) and to search for binaries combining a subsolar black hole and a primary component above , eventually coming from the QCD peak.
In this letter, we perform an extended search on O2 data using a matched filter pipeline, assuming one subsolar component between and and a primary component between and . Our analysis is therefore complementary to previous searches, either restricted to for the primary component Abbott et al. (2018a, 2019b) or considering even lower mass ratios Nitz and Wang (2021a). We derive new model-independent merger rate limits in the plane of the two component masses111When our work was almost completed, an independent search has been released with a similar mass range Nitz and Wang (2021b). Besides providing an independent confirmation of their results, our analysis also reveals a few candidate events and includes new limits for some motivated realisations of the PBH mass function.. Furthermore, whereas previous limits on – defined as the PBH abundance with respect to DM – relied on the merging rates of early PBH binaries from Sasaki et al. (2016), we include the rate suppression due to binary disruption by early forming clusters, matter inhomogeneities and nearby PBHs, put in evidence with N-body simulations Raidal et al. (2019). We consider in addition the merging rate of late PBH binaries formed in clusters. For the PBH mass distribution, two recent realisations are considered, including thermal features and based on a (nearly) scale invariant primordial power spectrum. We argue that the derived limits are relatively conservative and should apply to most other broad mass models. Finally, from the rate predictions in these models, we conclude that searches in the third and fourth observing runs of LIGO/Virgo will be decisive to test the hypothesis of a primordial origin of BBH mergers.
Search
We analyze the O2 public data from single and coincident observation time of the two LIGO detectors, comprising 193 days of analysis time
This search uses the GstLAL-based inspiral pipeline Cannon et al. (2021, 2012); Hanna et al. (2020); Messick et al. (2017); Sachdev et al. (2019); LIGO Scientific Collaboration (2018) with configurations and procedures as outlined in Abbott et al. (2020d). Data from each detector are matched-filtered Cannon et al. (2012); Dhurandhar and Sathyaprakash (1994); Balasubramanian et al. (1996); Owen (1996); Owen and Sathyaprakash (1999); Allen et al. (2012) with an (anti-)aligned low-spin template bank of 195 468 template waveforms modelled with the frequency-domain waveform-approximant, TaylorF2 Blanchet et al. (1995); Poisson (1998); Damour et al. (2001a, b); Buonanno et al. (2009); Mikoczi et al. (2005); Blanchet et al. (2005); Arun et al. (2009); Bohé et al. (2013, 2015); Mishra et al. (2016). Components have primary mass , subsolar mass and spin magnitude . The total masses () and mass ratios () of the search are limited between and , respectively. The template bank construction uses the stochastic method of Refs. Harry et al. (2008); Babak (2008); Harry et al. (2009); Manca and Vallisneri (2010) with a minimal match of . Following Ref. Magee et al. (2018), we perform matched-filtering of the data in the frequency band 45-1024 Hz in order to reduce the computational burden of filtering data.
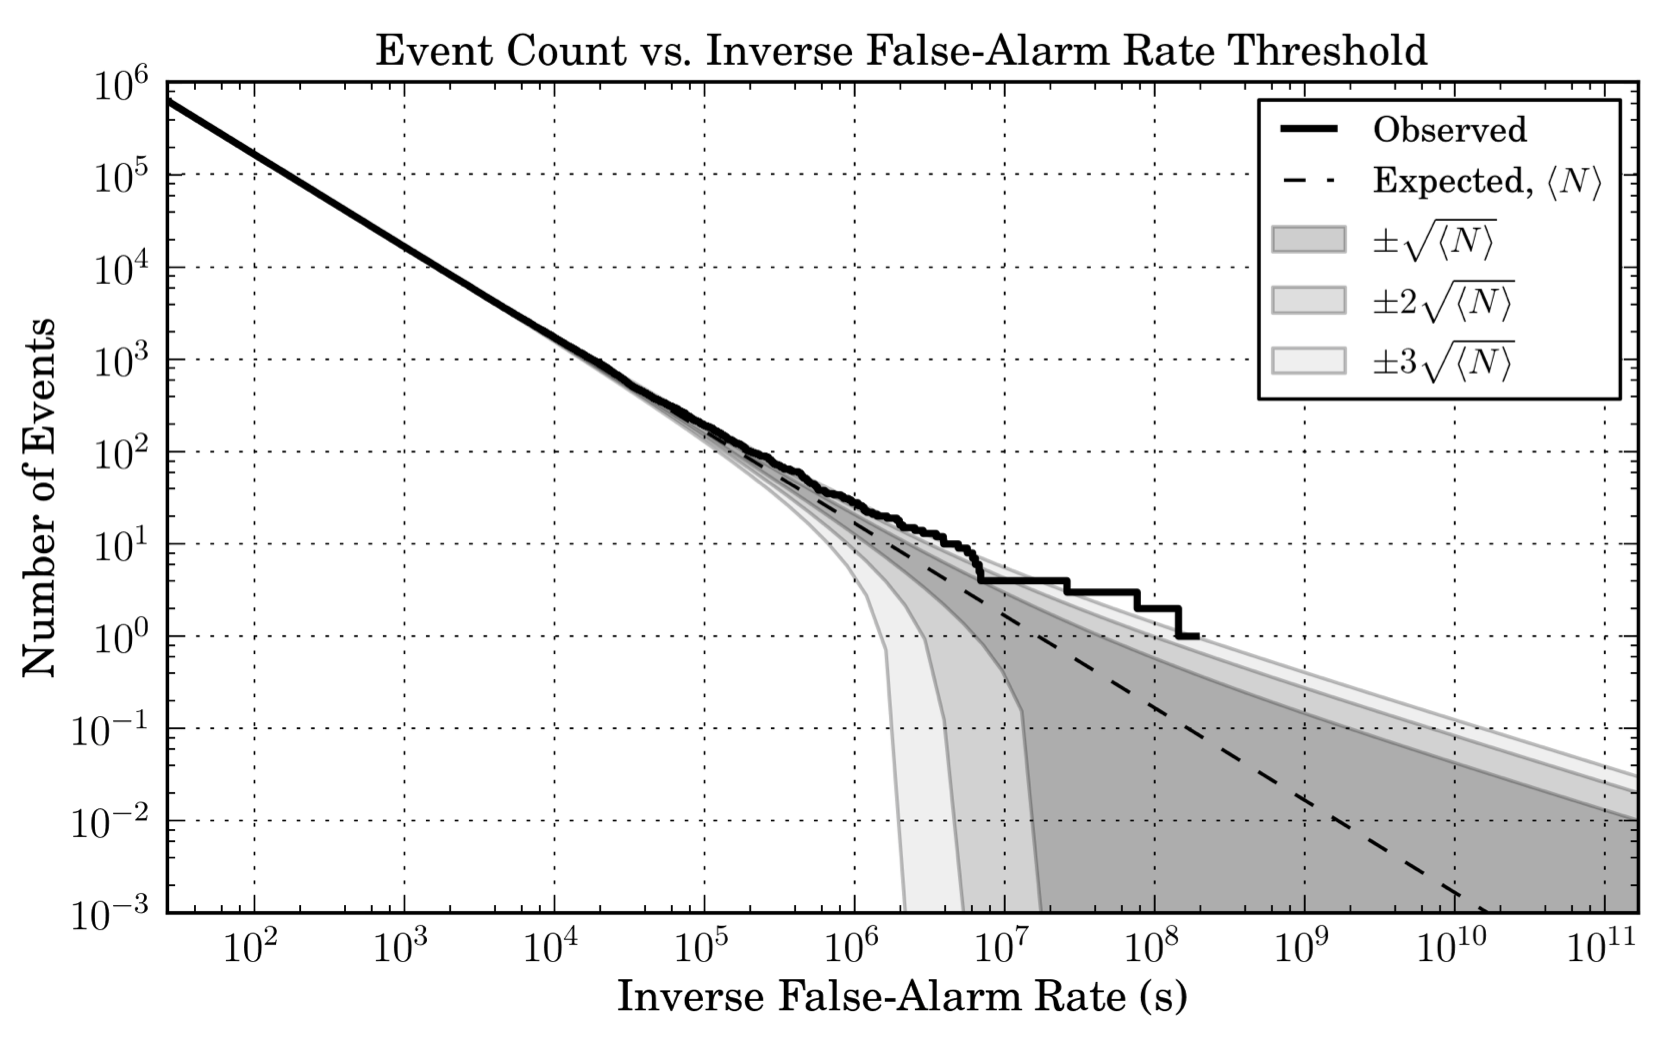
Candidates are ranked using a likelihood-ratio ranking statistic Cannon et al. (2015); Messick et al. (2017); Hanna et al. (2020). Here we note a difference with the GWTC-2 pipeline, for which single-detector candidates were not ranked using iDQ penalties Essick et al. (2020); Godwin et al. (2020). This ranking statistics also provides an algebraic procedure to estimate the significance of each event Cannon et al. (2013); Messick et al. (2017). The significance of an event is expressed in terms of a false alarm rate (FAR), e.g. defined in Section IV.C of Ref. Messick et al. (2017).
Candidate events and merger rate constraints
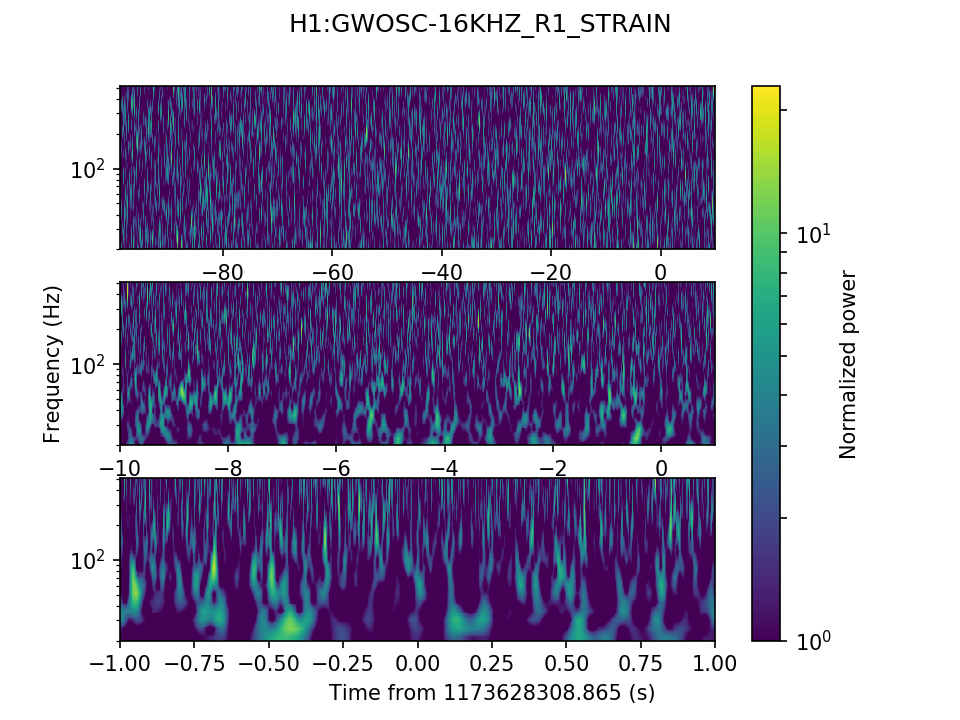
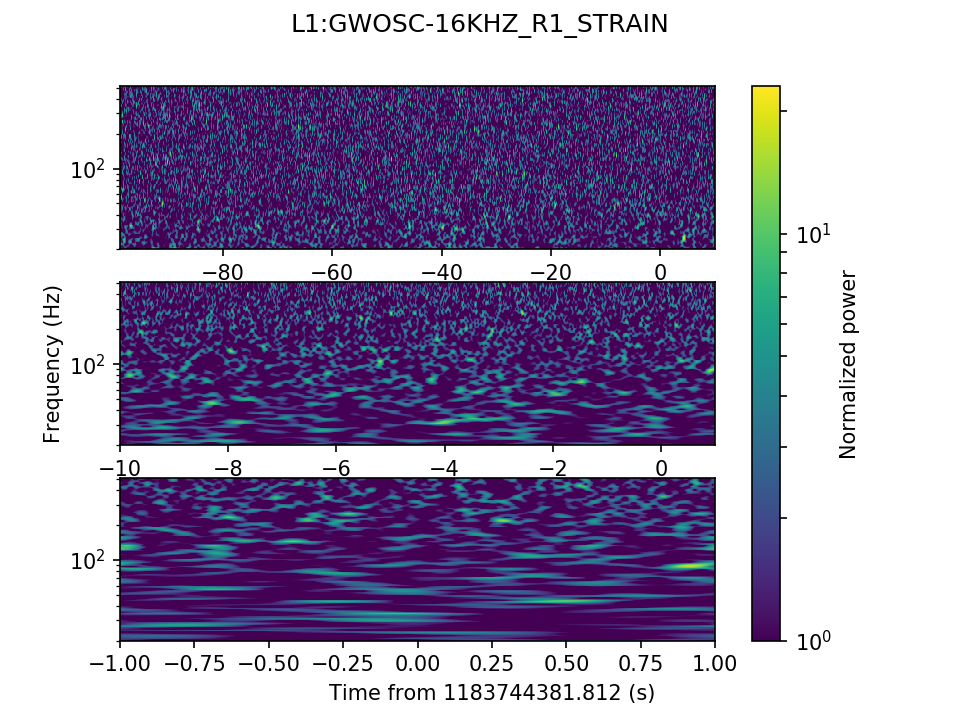
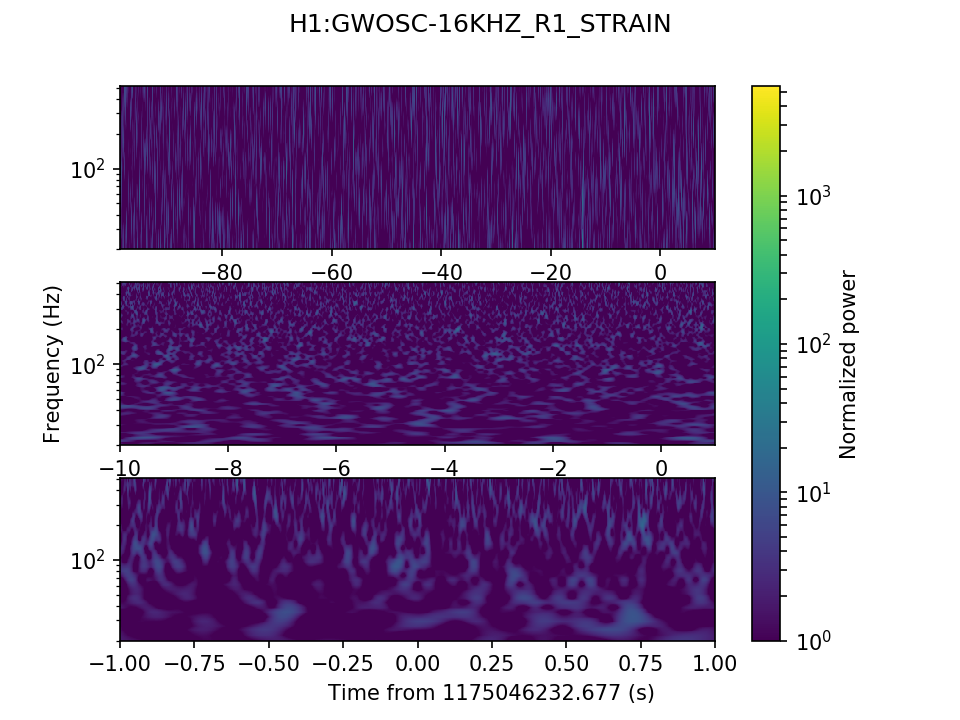
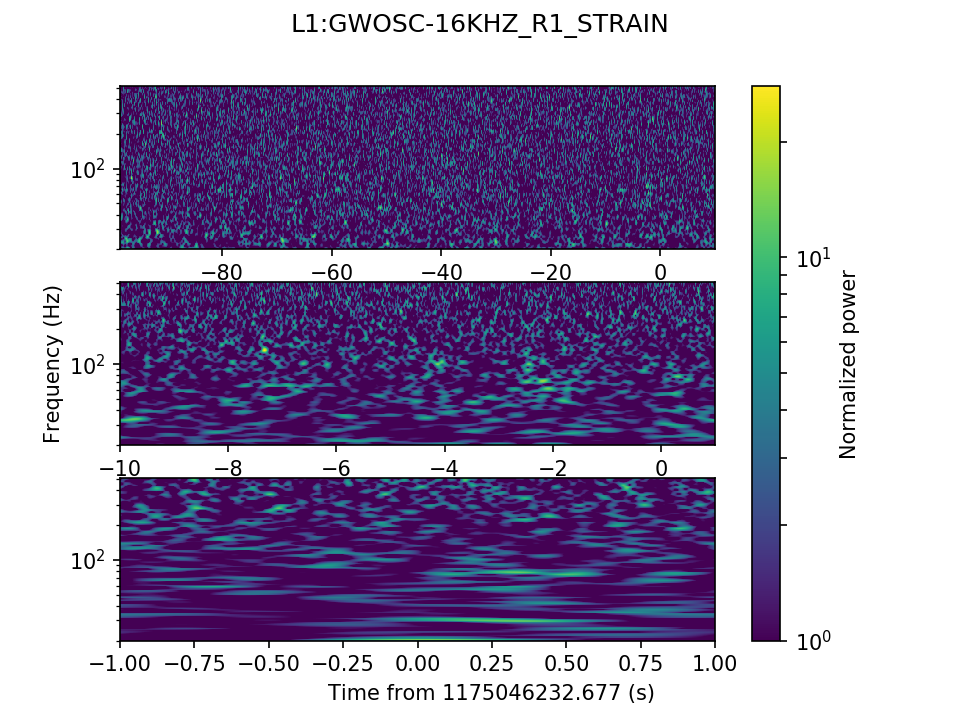
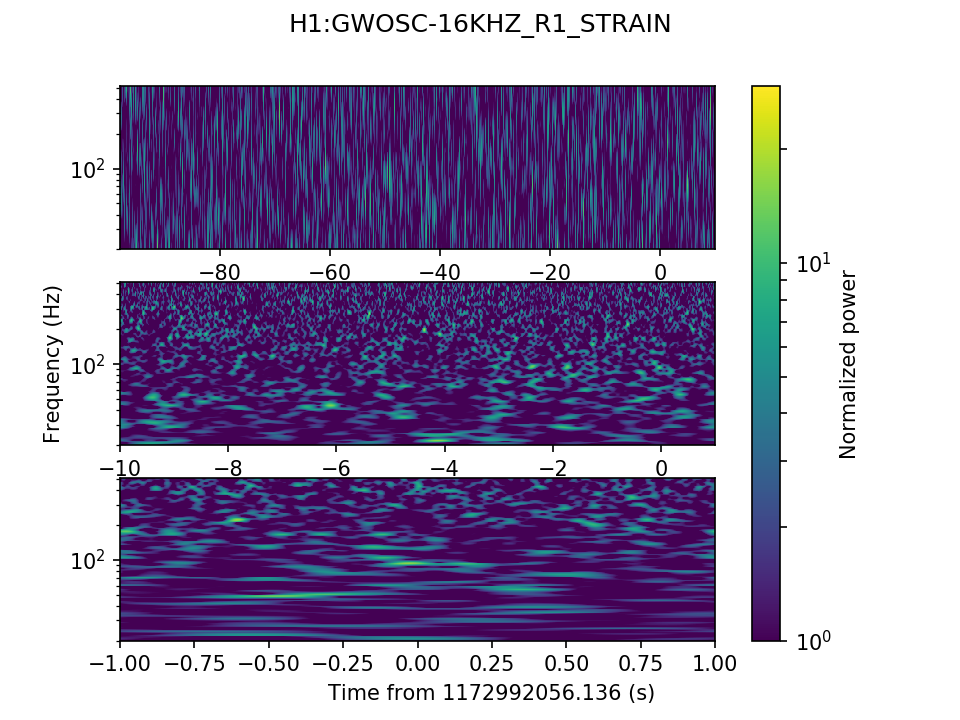
The search results are presented in Fig. 1 and the Table 1 reports the four candidates with a signal-to-noise ratio SNR and a FAR. The spectrograms obtained for different time periods and time-frequency resolutions, after spectral whitening, are provided in Appendix and do not reveal any clear sign of an event. The first two candidates are one detector triggers, but the FAR are the smallest of the four candidates. For the other triggers, the FAR is quite high considering the number of days analyzed and comparing to the FAR of the events reported in Abbott et al. (2019a, 2020d). With these two considerations, it is not clear yet if they can be considered as real gravitational wave events. Future investigations will be needed to decide if those events are due to noise fluctuations or due to real GW sources. For the rest of the paper, we assume a null result of the search.
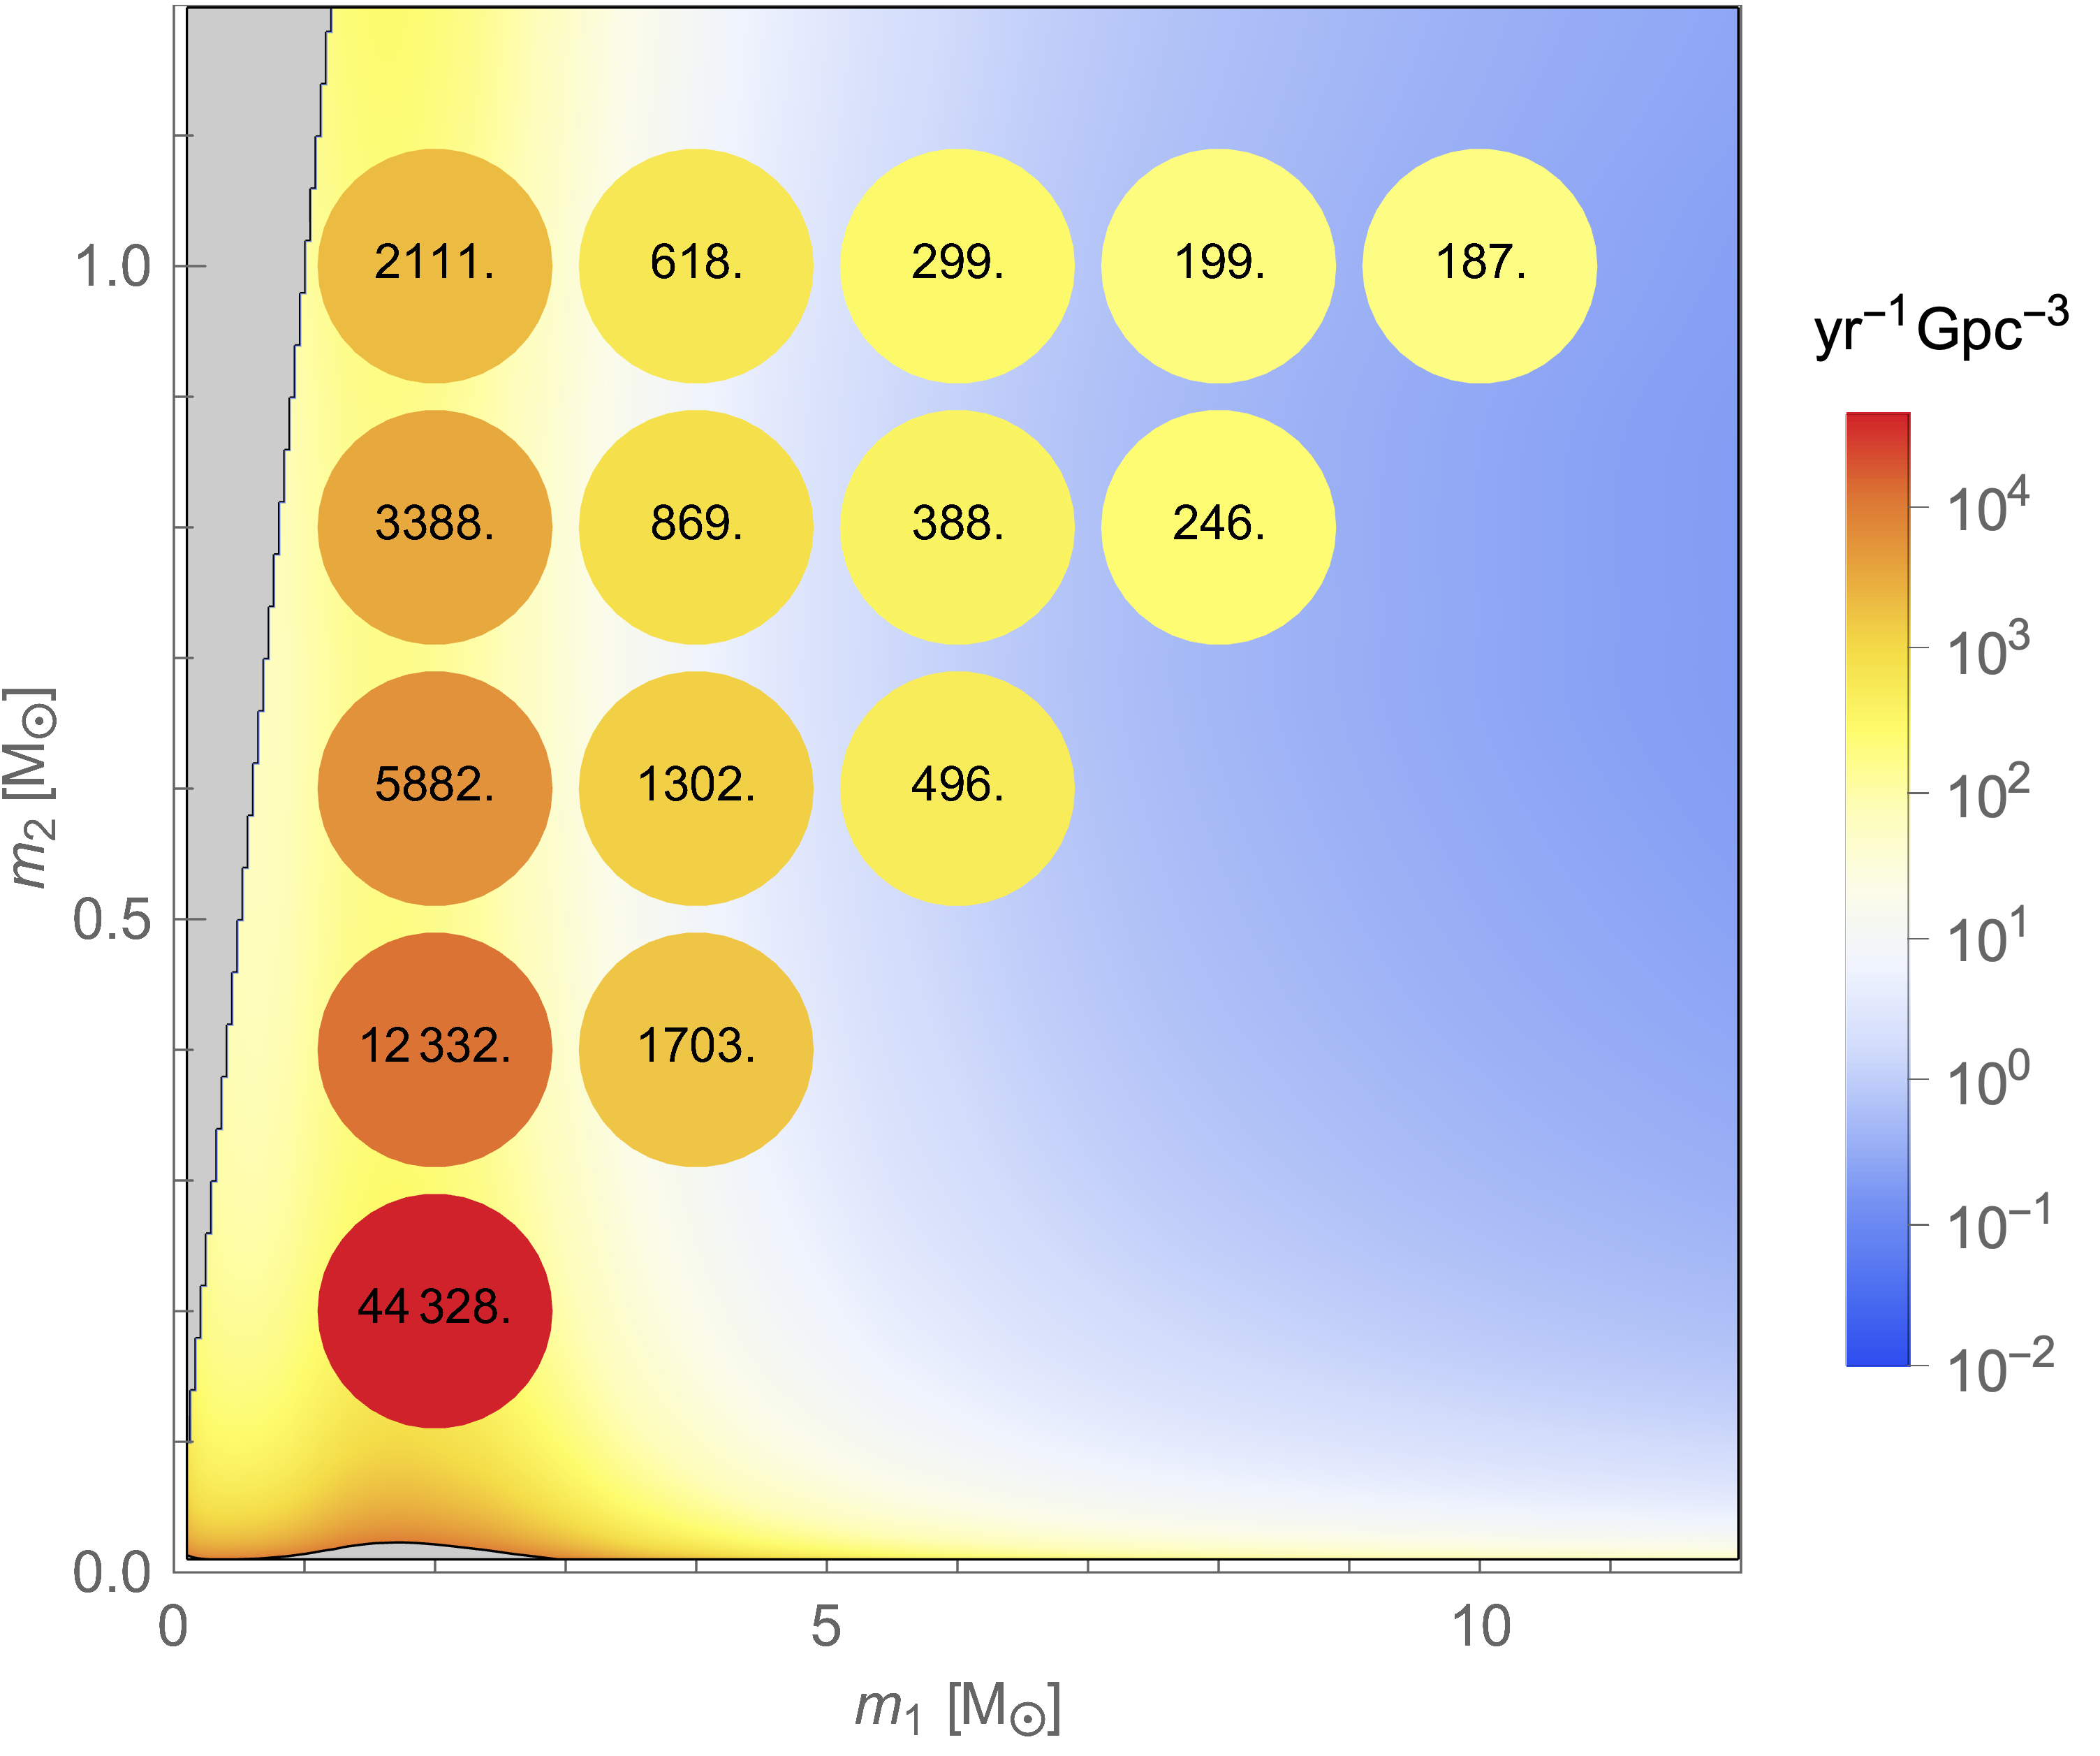
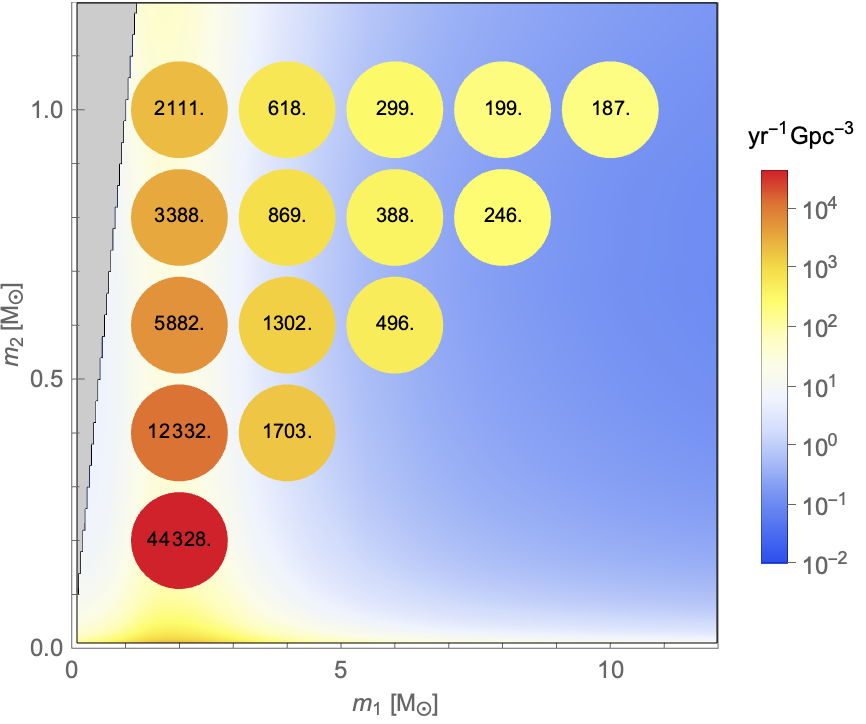
Following Farr et al. (2015); Kapadia et al. (2020), we place upper limits on the rate of mergers of delta-function-like populations of sub-solar mass compact binaries centered on discrete mass values. Assuming that astrophysical and terrestrial triggers occur as independent Poisson processes, we estimate a posterior on the Poisson expected count of sub-solar mass compact binary mergers from triggers produced during dedicated templated searches. We then self-consistently estimate the space-time volume sensitivity of the searches to the delta-function-like populations. The ratio of the Poisson count to the spacetime volume sensitivity gives us our estimate of the rate of mergers. The merging rate limits are presented on Fig. 3 and in a table in Appendix.
| FAR [yr-1] | UTC time | mass 1 | mass 2 | spin1z | spin2z | Network SNR | H1 SNR | L1 SNR | |
|---|---|---|---|---|---|---|---|---|---|
| 0.1674 | 8.457 | 2017-03-15 15:51:30 | 3.062 | 0.9281 | 0.08254 | -0.09841 | 8.527 | 8.527 | - |
| 0.2193 | 8.2 | 2017-07-10 17:52:43 | 2.106 | 0.2759 | 0.08703 | 0.0753 | 8.157 | - | 8.157 |
| 0.4134 | 7.585 | 2017-04-01 01:43:34 | 4.897 | 0.7795 | -0.05488 | -0.04856 | 8.672 | 6.319 | 5.939 |
| 1.2148 | 6.589 | 2017-03-08 07:07:18 | 2.257 | 0.6997 | -0.03655 | -0.04473 | 8.535 | 6.321 | 5.736 |
PBH mass and rate distribution
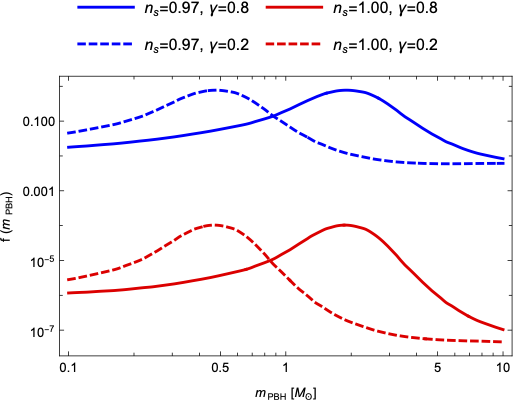
Two recent PBH scenarios with a wide mass distribution have been considered in our analysis. Their common point is that the features arising from the thermal history of the Universe are included in the PBH mass function. In both cases, the large density fluctuations at the origin of PBH formation come from a (almost) scale invariant primordial power spectrum, enhanced compared to cosmological scales, and PBHs constitute up to the totality of DM. But the peak in the PBH distribution lies in different mass regimes, which results from different values of the scalar spectral index on PBH scales.
Mass model 1: Carr et al 2019 Carr et al. (2021), . The primordial power spectrum is almost scale invariant (values of between and are realistic), such that the PBH peak is located at the solar-mass scale and there is no overproduction of PBHs at smaller and larger masses. The model evades the microlensing limits if PBHs are sufficiently clustered, which can naturally arise from the Poisson fluctuations at formation Clesse and Garcia-Bellido (2020).
Mass model 2: De Luca et al. 2020 De Luca et al. (2021), . It assumes a unit scalar spectral index and a cut-off mass around , such that the main peak lies in the asteroid mass scale where there is no significant limit on the PBH abundance. But still a fraction of the DM of order could be explained by stellar-mass PBHs from the QCD transition.
The two density distributions (normalized such that ) are represented on Fig. 2 for two plausible values of the ratio between the PBH and the Hubble horizon masses at formation, and . The first value leads to a peak around motivated by GW190425 and GW190814. The second one is obtained by considering the turnaround scale Byrnes et al. (2018) in the PBH gravitational collapse. These models are further motivated because of the stochastic GW background generated at second order by the overdensities at the origin of PBHs Chen et al. (2020); Vaskonen and Veermäe (2021); De Luca et al. (2021); Kohri and Terada (2021); Clesse et al. (2018), coinciding with the possible NANOGrav observation Arzoumanian et al. (2020). PBH binaries can form through two channels whose associated merging rates are briefly introduced below.
Merging rate of Early Binaries (EB). PBH binaries are formed in the early Universe, between the PBH formation time and the matter-radiation equality. A fraction of them will merge nowadays with a merging rate distribution (per unit logarithmic mass of the two black holes) given by Raidal et al. (2019); Ali-Haïmoud et al. (2017); Gow et al. (2020); Liu et al. (2019); Kocsis et al. (2018); Hütsi et al. (2021); Clesse and Garcia-Bellido (2020)
| (1) | |||||
where and are the two binary component masses. N-body simulations have shown that the original merging rates from Sasaki et al. (2016) are somehow suppressed Raidal et al. (2019), which motivates the introduction of a suppression factor plausibly ranging between and . Our assumption for in relation with previous works of Raidal et al. (2019); Hütsi et al. (2021) is described in Appendix.
Merging rate of Late Binaries (LB). PBH binaries also form by tidal capture in PBH clusters, which gives the following rate distribution Clesse and Garcia-Bellido (2020),
| (2) |
where is an effective scaling factor that incorporates the PBH clustering properties. We consider as a benchmark, following Clesse and Garcia-Bellido (2020), and comprised within 222This range for is obtained when imposing the 90% C.L. rate limits from GW190425 at and with in the mass model 1. for our estimations of uncertainty bands. This value is larger than one may expect from standard halo mass functions Bird et al. (2016) but is realistic if one takes into account the additional clustering due to Poisson fluctuations in the initial PBH separation and the relaxation time of small DM halos Clesse and Garcia-Bellido (2020). For the mass model 2, these rates are subdominant, but for the mass model 1 they compete with the rate of EBs and could also explain the rates of GW190425, GW190814 and GW190521.
Constraints on PBH models
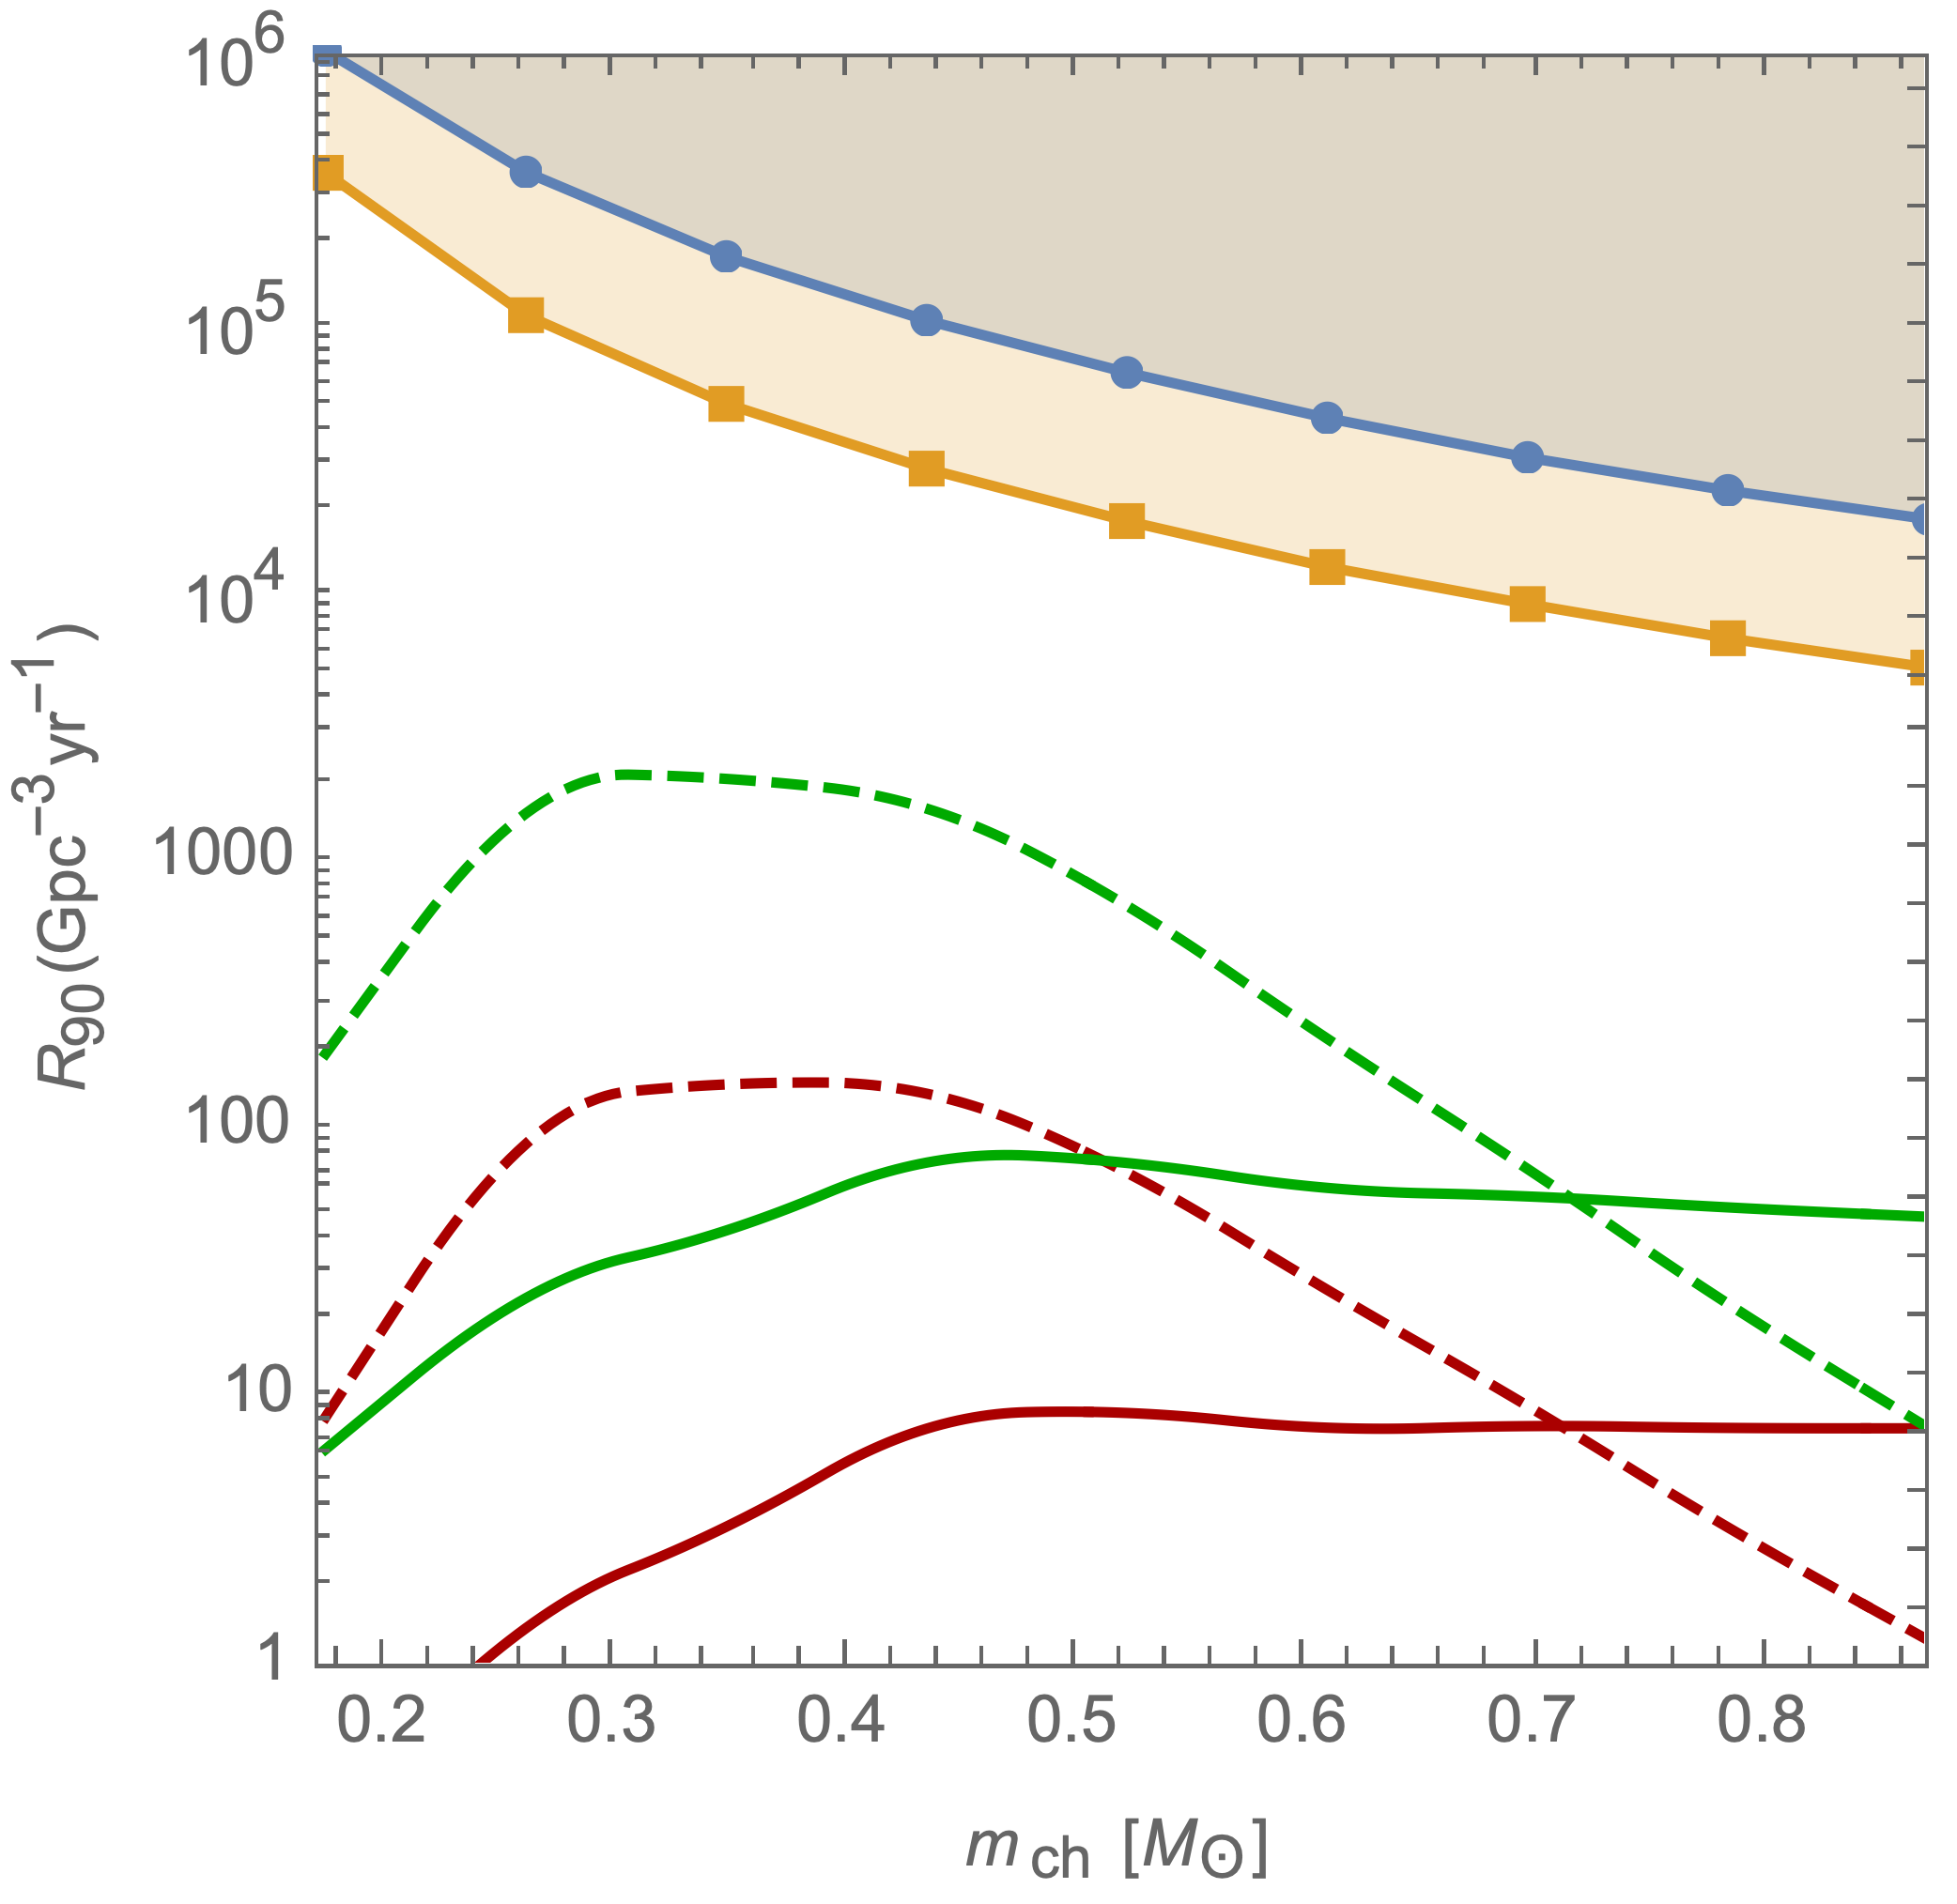
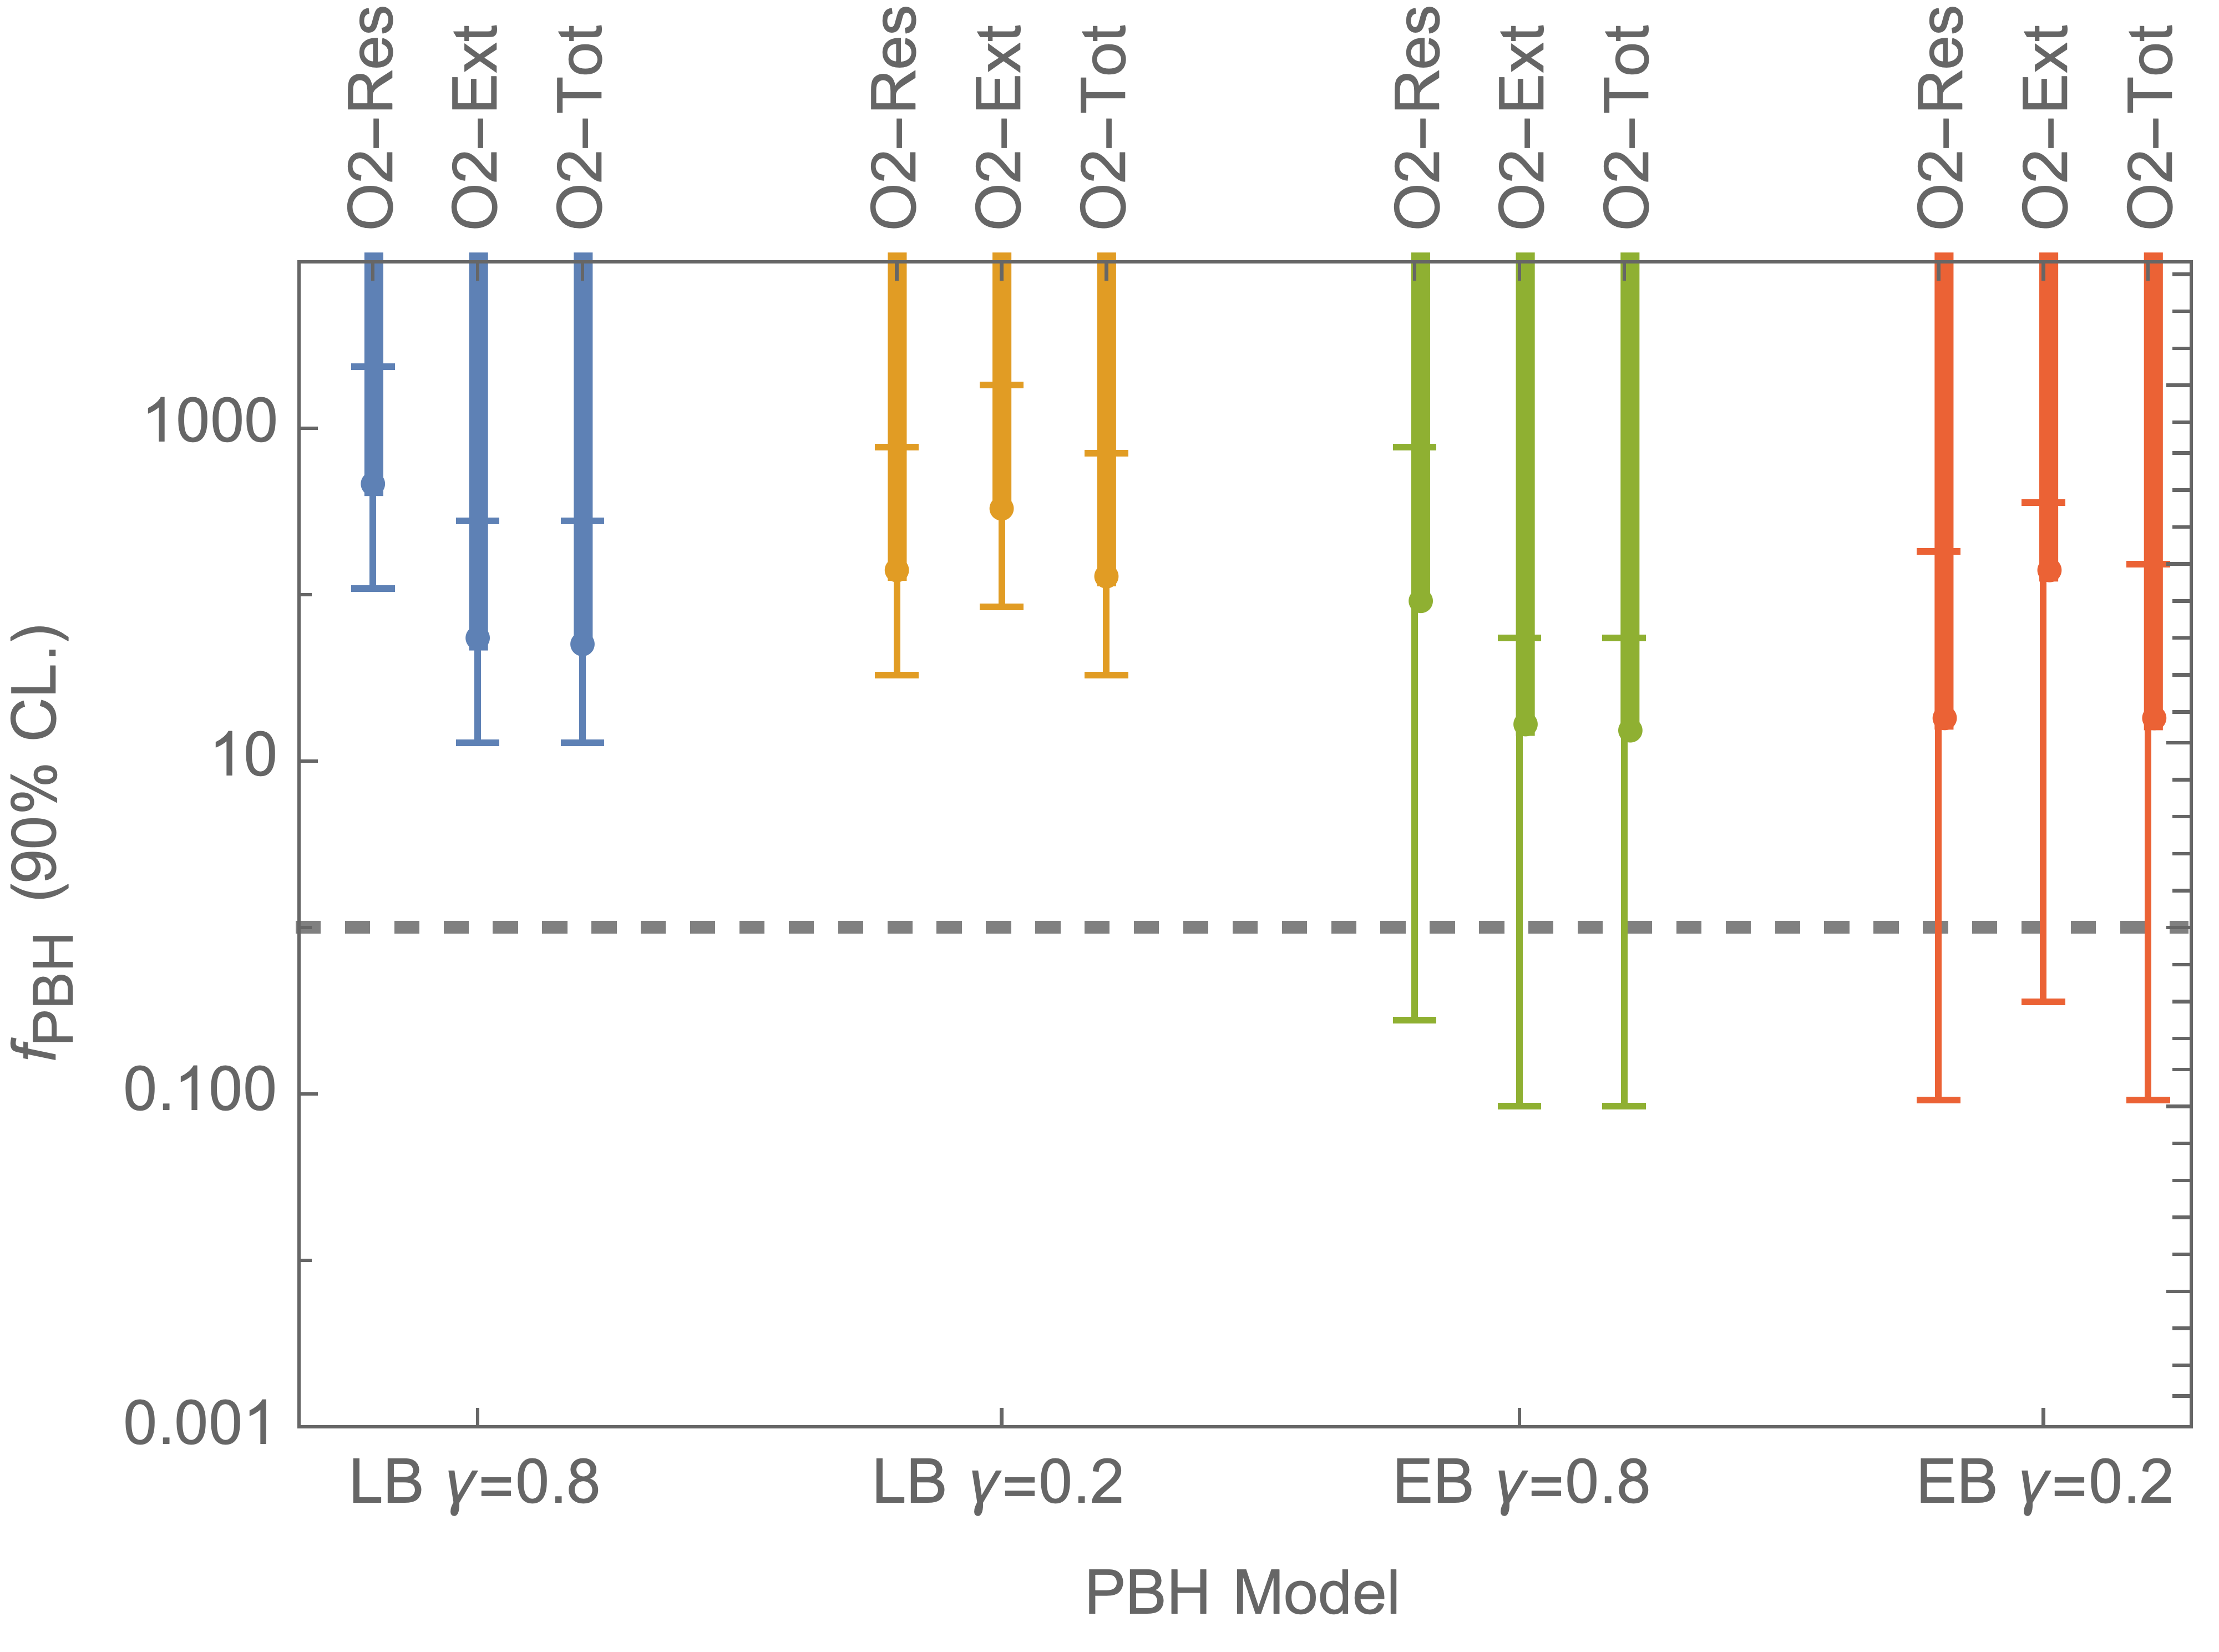
The EB merging rate predictions for the mass model 1, mass bin widths and , and have been represented in Fig. 3 with the corresponding rate limits. The other cases typically lead to lower rates in the mass region probed by the search and a similar figure for LBs is included in the Appendix. We have also calculated the rate predictions in the case , assuming , that are compared to the limits from Abbott et al. (2018a, 2019b) on Fig. 4. In both cases, we find that the subsolar limits do not yet exclude that . Therefore more data will be needed to probe these broad-mass PBH models. Nevertheless, we point out that for EBs the rate predictions are quite close to the current limits. If some candidates were to be real GW events, they could be explained by EBs (but not LBs) given the uncertainties on the rate suppression parameter . A positive detection would therefore help to distinguish between the possible PBH mass distributions and binary formation channels. For each case, we have computed an upper limit on , shown in Fig. 5 with error bars corresponding to the estimated rate uncertainties. For this purpose, we assume a Poissonian distribution of GW events and build a simple function for ,
| (3) | |||||
that combines the () rate limits in all the mass bins of the present search and the limits in the chirp mass bins of the previous O2 search Abbott et al. (2019b). denotes the integrated merger rate per unit logarithmic chirp mass. A more accurate analysis would be to calculate the rate limits from a large number of injections, distributed along and according to the expected rate distribution for each PBH mass model. However this would have been much more computationally expansive. Given the relatively large theoretical uncertainties on the rate limits, this was also beyond the scope of the present paper and is thus left for future work. For , we find that this search greatly improves (by about one order of magnitude) the limits on , compared to previous sub-solar searches. But as expected, the improvement is marginal if the peak of the mass function lies well below , as in the case . For the the mass model 1 and our benchmark modelling of the rates, the combined 90% C.L. limits on lie between and . As a consequence, probing will be possible with an improved detector sensitivity between two and four. Nevertheless, in the mass model 2 where only a tiny fraction of DM is made of subsolar and solar-mass PBHs, subsolar searches are still far from setting an interesting limit, beyond the ranges shown in Figs. 4 and 5. But this model would also hardly explain the rates of GW events at larger mass. Other spectral shapes for the primordial fluctuations (lognormal, broken power-law…) are possible but typically lead to a suppression of low mass ratio binaries compared to a scale-invariant spectrum. Therefore the derived limits are relatively conservative.
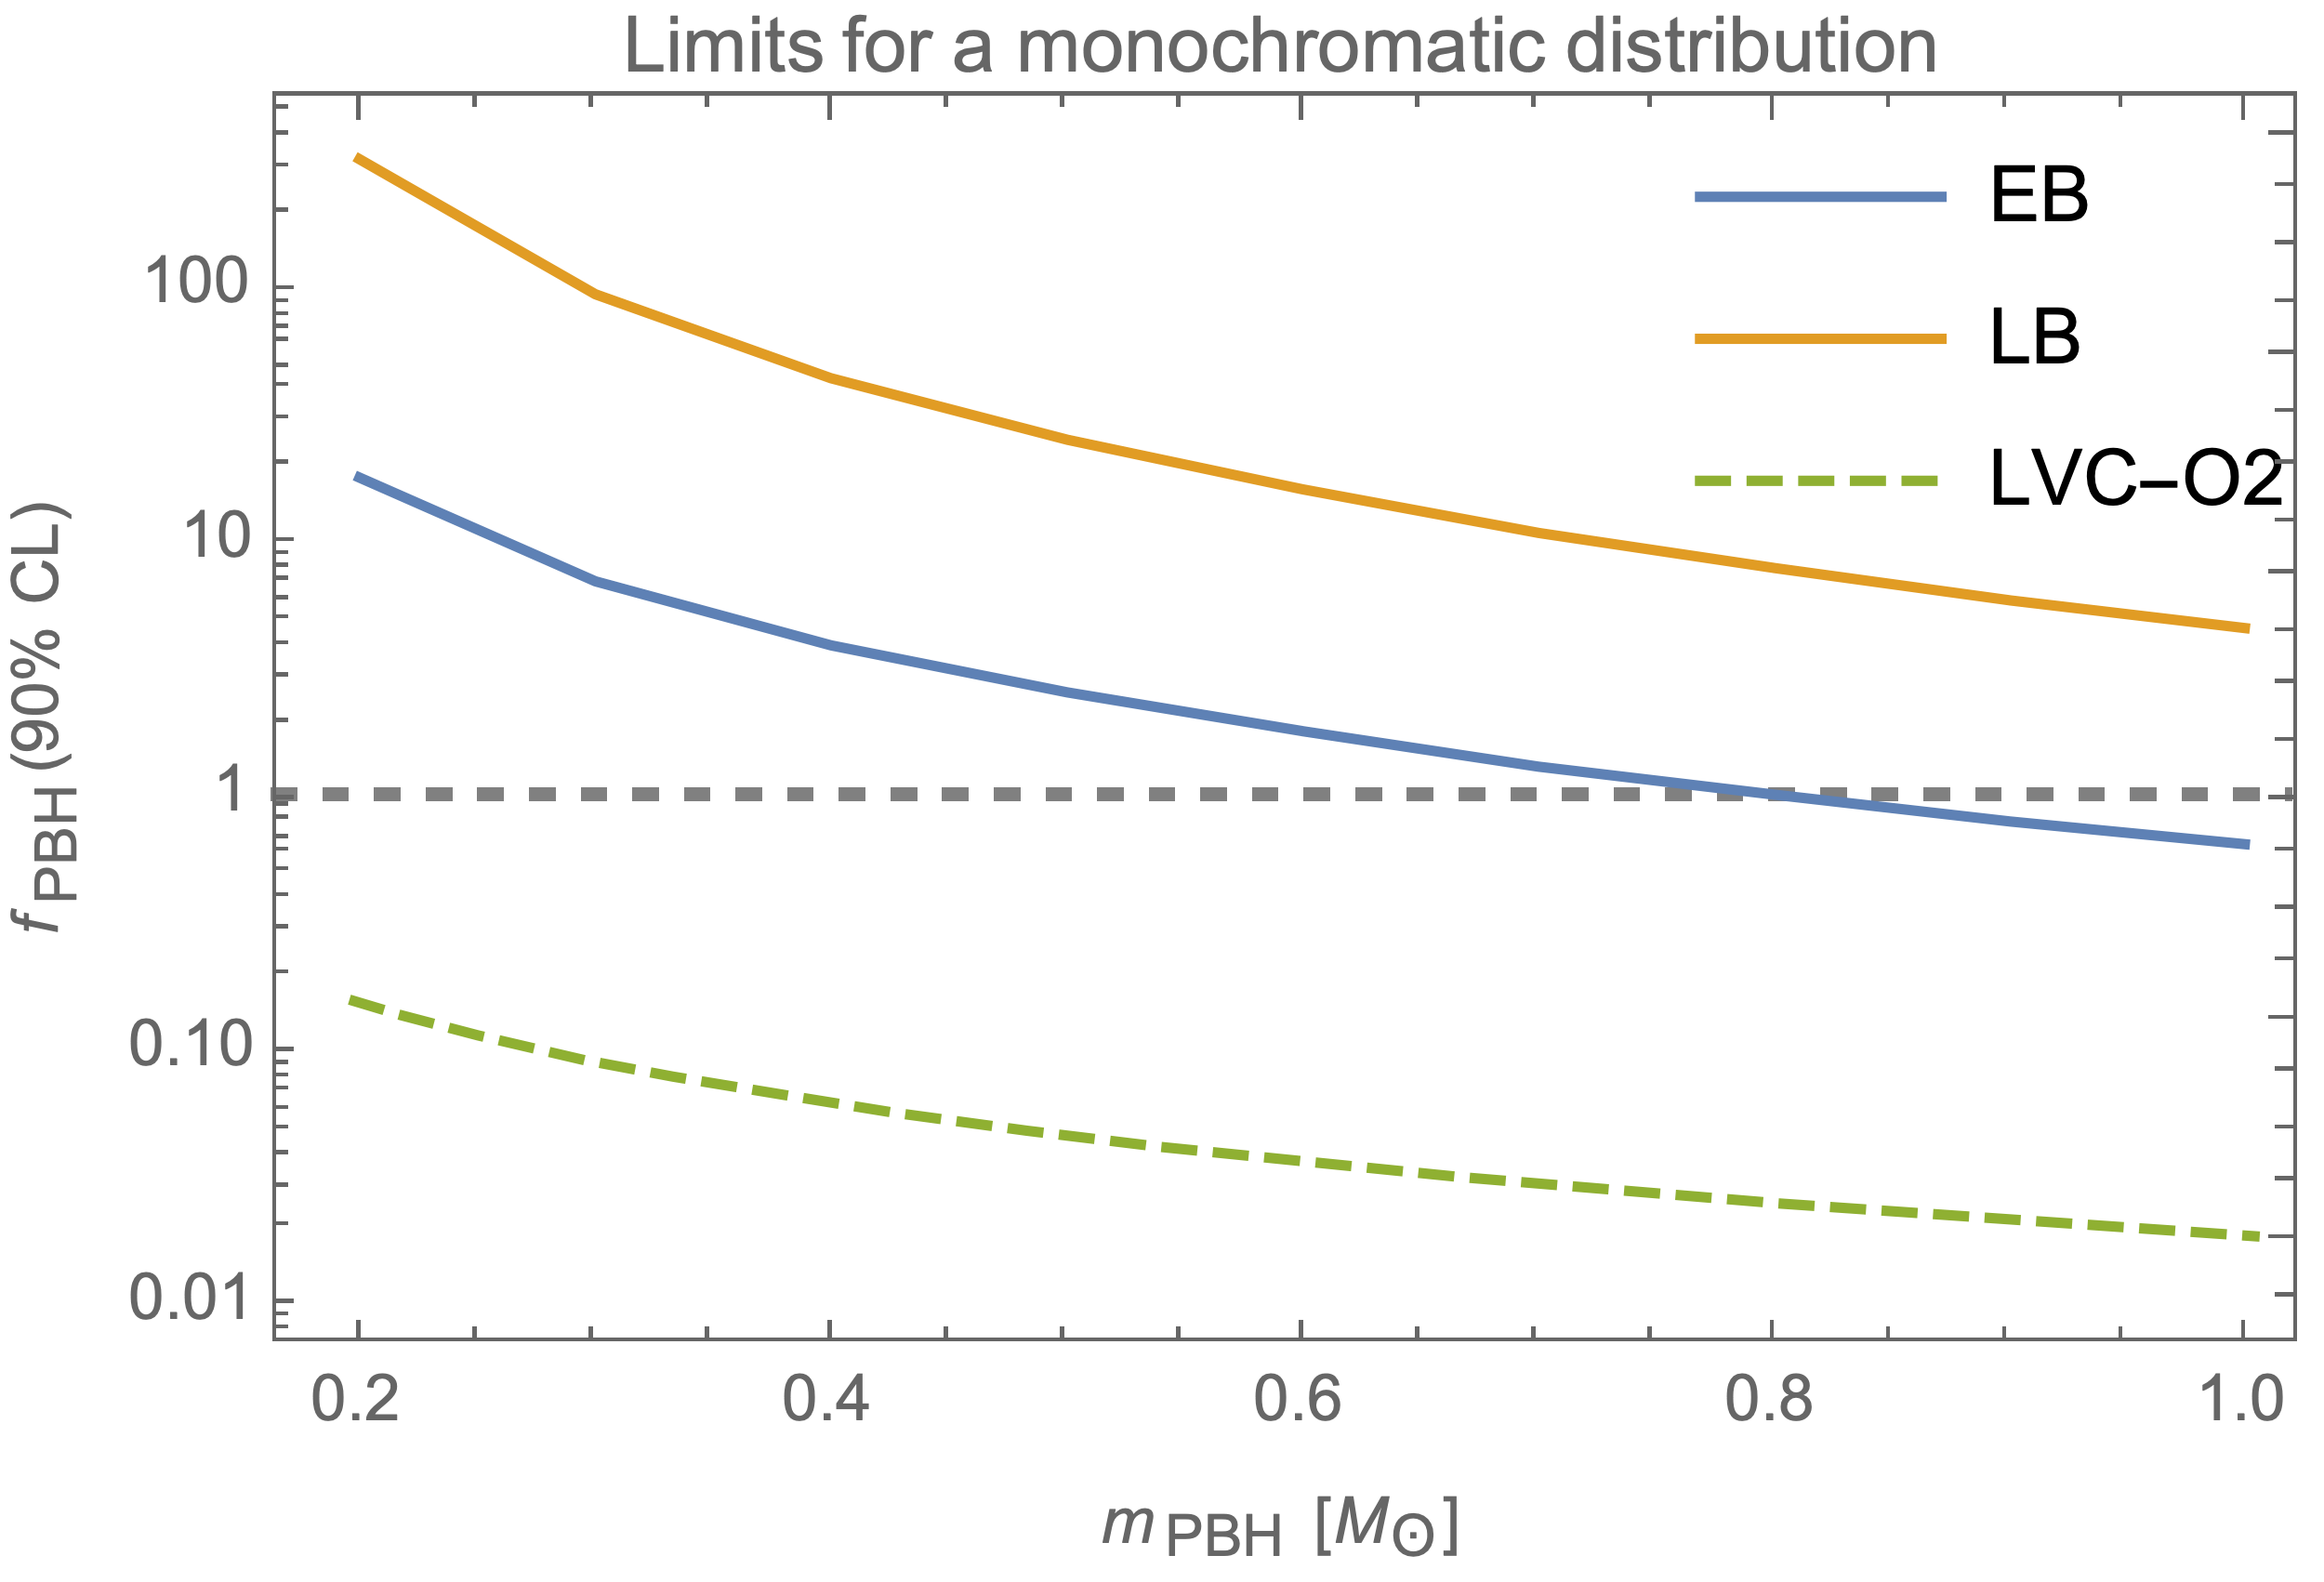
Finally, we have reanalized the O2 limits on for monochromatic mass models in Abbott et al. (2019b) with our merging rate prescriptions. Due to the EB rate suppression, these limits are much less stringent and we find that O2 data do not yet exclude , both for EBs and LBs, as shown in Fig. 7 in Appendix.
Conclusion
Broad-mass PBH models with a peak at the solar-mass scale from the QCD transition have been proposed to explain the DM and at least some GW events. Motivated by these models, an extended search of mergers of subsolar BHs between and in binaries with a primary component between and has been performed on the data from the second observing run (O2) of Advanced LIGO. The search has revealed four candidates (two being single detector triggers) with a total SNR and a FAR , but whose statistical significance is not high enough to claim for a detection. Further investigation (parameter estimations, mass model dependence) is ongoing to clarify their status.
Assuming a null result of the search, new merging rate limits are set in this mass range, shown in Fig. 4, which complement previous limits restricted to for the primary component. When they are confronted to the theoretical predictions for PBH merging rates, we find that they still allow for both early and late binaries (respectively PBH binaries formed before matter-radiation equality and in PBH clusters). This seems to contradict some conclusions of Abbott et al. (2019b) where more stringent limits on were obtained. The main difference comes from the inclusion of the rate suppression of early binaries seen in N-body simulations Raidal et al. (2019). Nevertheless, we emphasize that rate predictions are within the range of the O3 or future O4 and O5 observing runs. Subsolar searches in these data sets should therefore ideally include binaries with low mass ratios.
Ultimately, detecting a subsolar black hole is the best way to distinguish primordial and stellar BHs, which would therefore have groundbreaking implications in cosmology and high-energy physics. The fact that we found a series of candidates might be a first sign of a subsolar BH population, opening their hunt with longer and more sensitive strain time series.
Acknowledgements.
S.C, and K. S. P. are supported by the research program of the Netherlands Organisation for Scientific Research (NWO). G.B. is supported by a FRIA grant from the Belgian fund for research FNRS-F.R.S.. S.C. aknowledges support from the FNRS-F.R.S and the Franqui foundation. This research has made use of data, software and/or web tools obtained from the Gravitational Wave Open Science Center (https://www.gw-openscience.org/ ), a service of LIGO Laboratory, the LIGO Scientific Collaboration and the Virgo Collaboration. LIGO Laboratory and Advanced LIGO are funded by the United States National Science Foundation (NSF) as well as the Science and Technology Facilities Council (STFC) of the United Kingdom, the Max-Planck-Society (MPS), and the State of Niedersachsen/Germany for support of the construction of Advanced LIGO and construction and operation of the GEO600 detector. Additional support for Advanced LIGO was provided by the Australian Research Council. Virgo is funded, through the European Gravitational Observatory (EGO), by the French Centre National de Recherche Scientifique (CNRS), the Italian Istituto Nazionale della Fisica Nucleare (INFN) and the Dutch Nikhef, with contributions by institutions from Belgium, Germany, Greece, Hungary, Ireland, Japan, Monaco, Poland, Portugal, Spain. The authors are grateful for computational resources provided by the LIGO Laboratory and supported by National Science Foundation Grants PHY-0757058 and PHY-0823459.References
- Abbott et al. (2016a) B. P. Abbott et al. (LIGO Scientific, Virgo), Phys. Rev. Lett. 116, 061102 (2016a), arXiv:1602.03837 [gr-qc] .
- Abbott et al. (2020a) R. Abbott et al. (LIGO Scientific, Virgo), Phys. Rev. Lett. 125, 101102 (2020a), arXiv:2009.01075 [gr-qc] .
- Abbott et al. (2020b) R. Abbott et al. (LIGO Scientific, Virgo), Astrophys. J. Lett. 896, L44 (2020b), arXiv:2006.12611 [astro-ph.HE] .
- Abbott et al. (2020c) R. Abbott et al. (LIGO Scientific, Virgo), Phys. Rev. D 102, 043015 (2020c), arXiv:2004.08342 [astro-ph.HE] .
- Abbott et al. (2017a) B. P. Abbott et al. (LIGO Scientific, Virgo), Phys. Rev. Lett. 119, 141101 (2017a), arXiv:1709.09660 [gr-qc] .
- Abbott et al. (2016b) B. P. Abbott et al. (LIGO Scientific, Virgo), Phys. Rev. Lett. 116, 241103 (2016b), arXiv:1606.04855 [gr-qc] .
- Abbott et al. (2017b) B. . P. . Abbott et al. (LIGO Scientific, Virgo), Astrophys. J. 851, L35 (2017b), arXiv:1711.05578 [astro-ph.HE] .
- Abbott et al. (2017c) B. P. Abbott et al. (LIGO Scientific, VIRGO), Phys. Rev. Lett. 118, 221101 (2017c), [Erratum: Phys.Rev.Lett. 121, 129901 (2018)], arXiv:1706.01812 [gr-qc] .
- Abbott et al. (2019a) B. P. Abbott et al. (LIGO Scientific, Virgo), Phys. Rev. X 9, 031040 (2019a), arXiv:1811.12907 [astro-ph.HE] .
- Abbott et al. (2020d) R. Abbott et al. (LIGO Scientific, Virgo), arXiv (2020d), arXiv:2010.14527 [gr-qc] .
- Abbott et al. (2016c) B. P. Abbott et al. (LIGO Scientific, Virgo), Phys. Rev. X 6, 041015 (2016c), [Erratum: Phys.Rev.X 8, 039903 (2018)], arXiv:1606.04856 [gr-qc] .
- Aasi et al. (2015) J. Aasi et al. (LIGO Scientific), Class. Quant. Grav. 32, 074001 (2015), arXiv:1411.4547 [gr-qc] .
- Acernese et al. (2015) F. Acernese et al. (VIRGO), Class. Quant. Grav. 32, 024001 (2015), arXiv:1408.3978 [gr-qc] .
- Bird et al. (2016) S. Bird, I. Cholis, J. B. Muñoz, Y. Ali-Haïmoud, M. Kamionkowski, E. D. Kovetz, A. Raccanelli, and A. G. Riess, Phys. Rev. Lett. 116, 201301 (2016), arXiv:1603.00464 [astro-ph.CO] .
- Clesse and García-Bellido (2017) S. Clesse and J. García-Bellido, Phys. Dark Univ. 15, 142 (2017), arXiv:1603.05234 [astro-ph.CO] .
- Sasaki et al. (2016) M. Sasaki, T. Suyama, T. Tanaka, and S. Yokoyama, Phys. Rev. Lett. 117, 061101 (2016), [Erratum: Phys.Rev.Lett. 121, 059901 (2018)], arXiv:1603.08338 [astro-ph.CO] .
- Zel’dovich and Novikov (1967) Y. B. Zel’dovich and I. D. Novikov, Soviet Astronomy 10, 602 (1967).
- Hawking (1971) S. Hawking, Mon. Not. Roy. Astron. Soc. 152, 75 (1971).
- Carr and Hawking (1974) B. J. Carr and S. W. Hawking, Mon. Not. Roy. Astron. Soc. 168, 399 (1974).
- Chapline (1975) G. F. Chapline, Nature 253, 251 (1975).
- Carr and Lidsey (1993) B. J. Carr and J. E. Lidsey, Phys. Rev. D 48, 543 (1993).
- Ivanov et al. (1994) P. Ivanov, P. Naselsky, and I. Novikov, Phys. Rev. D 50, 7173 (1994).
- Garcia-Bellido et al. (1996) J. Garcia-Bellido, A. D. Linde, and D. Wands, Phys. Rev. D 54, 6040 (1996), arXiv:astro-ph/9605094 .
- Kim and Lee (1996) H. I. Kim and C. H. Lee, Phys. Rev. D 54, 6001 (1996).
- Carr et al. (2016) B. Carr, F. Kuhnel, and M. Sandstad, Phys. Rev. D 94, 083504 (2016), arXiv:1607.06077 [astro-ph.CO] .
- Carr et al. (2010) B. Carr, K. Kohri, Y. Sendouda, and J. Yokoyama, Phys. Rev. D 81, 104019 (2010), arXiv:0912.5297 [astro-ph.CO] .
- Carr et al. (2020) B. Carr, K. Kohri, Y. Sendouda, and J. Yokoyama, arXiv (2020), arXiv:2002.12778, arXiv:2002.12778 [astro-ph.CO] .
- Carr and Kuhnel (2020) B. Carr and F. Kuhnel, Ann. Rev. Nucl. Part. Sci. , 170:14.1 (2020), arXiv:2006.02838 [astro-ph.CO] .
- Green and Kavanagh (2021) A. M. Green and B. J. Kavanagh, J. Phys. G 48, 043001 (2021), arXiv:2007.10722 [astro-ph.CO] .
- Clesse and García-Bellido (2018) S. Clesse and J. García-Bellido, Physics of the Dark Universe 22, 137 (2018).
- Carr et al. (2021) B. Carr, S. Clesse, J. García-Bellido, and F. Kühnel, Phys. Dark Univ. 31, 100755 (2021), arXiv:1906.08217 [astro-ph.CO] .
- Chandrasekhar (1931) S. Chandrasekhar, Astrophys. J. 74, 81 (1931).
- Rakavy and Shaviv (1967) G. Rakavy and G. Shaviv, Astrophys. J. 148, 803 (1967).
- Fraley (1968) G. S. Fraley, Astrophys. Space Sci. 2, 96 (1968).
- Byrnes et al. (2018) C. T. Byrnes, M. Hindmarsh, S. Young, and M. R. S. Hawkins, JCAP 1808, 041 (2018), arXiv:1801.06138 [astro-ph.CO] .
- Abbott et al. (2020e) B. P. Abbott et al. (LIGO Scientific, Virgo), Astrophys. J. Lett. 892, L3 (2020e), arXiv:2001.01761 [astro-ph.HE] .
- Clesse and Garcia-Bellido (2020) S. Clesse and J. Garcia-Bellido, arXiv (2020), arXiv:2007.06481 [astro-ph.CO] .
- Wyrzykowski and Mandel (2020) Ł. Wyrzykowski and I. Mandel, Astron. Astrophys. 636, A20 (2020), arXiv:1904.07789 [astro-ph.SR] .
- Kashlinsky (2016) A. Kashlinsky, Astrophys. J. Lett. 823, L25 (2016), arXiv:1605.04023 [astro-ph.CO] .
- Abbott et al. (2018a) B. P. Abbott et al. (LIGO Scientific, Virgo), Phys. Rev. Lett. 121, 231103 (2018a), arXiv:1808.04771 [astro-ph.CO] .
- Abbott et al. (2019b) B. P. Abbott, R. Abbott, T. Abbott, S. Abraham, F. Acernese, K. Ackley, C. Adams, R. X. Adhikari, V. Adya, C. Affeldt, et al., Physical review letters 123, 161102 (2019b).
- Nitz and Wang (2021a) A. H. Nitz and Y.-F. Wang, Phys. Rev. Lett. 126, 021103 (2021a), arXiv:2007.03583 [astro-ph.HE] .
- Nitz and Wang (2021b) A. H. Nitz and Y.-F. Wang, arXiv (2021b), arXiv:2102.00868 [astro-ph.HE] .
- Raidal et al. (2019) M. Raidal, C. Spethmann, V. Vaskonen, and H. Veermäe, JCAP 02, 018 (2019), arXiv:1812.01930 [astro-ph.CO] .
- Cannon et al. (2021) K. Cannon et al., SoftwareX 14, 100680 (2021), arXiv:2010.05082 [astro-ph.IM] .
- Cannon et al. (2012) K. Cannon, R. Cariou, A. Chapman, M. Crispin-Ortuzar, N. Fotopoulos, M. Frei, C. Hanna, E. Kara, D. Keppel, L. Liao, et al., The Astrophysical Journal 748, 136 (2012).
- Hanna et al. (2020) C. Hanna et al., Phys. Rev. D 101, 022003 (2020), arXiv:1901.02227 [gr-qc] .
- Messick et al. (2017) C. Messick, K. Blackburn, P. Brady, P. Brockill, K. Cannon, R. Cariou, S. Caudill, S. J. Chamberlin, J. D. Creighton, R. Everett, et al., Physical Review D 95, 042001 (2017).
- Sachdev et al. (2019) S. Sachdev, S. Caudill, H. Fong, R. K. Lo, C. Messick, D. Mukherjee, R. Magee, L. Tsukada, K. Blackburn, P. Brady, et al., arXiv preprint arXiv:1901.08580 (2019).
- LIGO Scientific Collaboration (2018) LIGO Scientific Collaboration, “LIGO Algorithm Library - LALSuite,” free software (GPL) (2018).
- Dhurandhar and Sathyaprakash (1994) S. V. Dhurandhar and B. S. Sathyaprakash, Phys. Rev. D 49, 1707 (1994).
- Balasubramanian et al. (1996) R. Balasubramanian, B. S. Sathyaprakash, and S. V. Dhurandhar, Phys. Rev. D 53, 3033 (1996), [Erratum: Phys.Rev.D 54, 1860 (1996)], arXiv:gr-qc/9508011 .
- Owen (1996) B. J. Owen, Phys. Rev. D 53, 6749 (1996), arXiv:gr-qc/9511032 .
- Owen and Sathyaprakash (1999) B. J. Owen and B. S. Sathyaprakash, Phys. Rev. D 60, 022002 (1999), arXiv:gr-qc/9808076 .
- Allen et al. (2012) B. Allen, W. G. Anderson, P. R. Brady, D. A. Brown, and J. D. E. Creighton, Phys. Rev. D 85, 122006 (2012), arXiv:gr-qc/0509116 .
- Blanchet et al. (1995) L. Blanchet, T. Damour, B. R. Iyer, C. M. Will, and A. G. Wiseman, Phys. Rev. Lett. 74, 3515 (1995), arXiv:gr-qc/9501027 .
- Poisson (1998) E. Poisson, Phys. Rev. D 57, 5287 (1998), arXiv:gr-qc/9709032 .
- Damour et al. (2001a) T. Damour, P. Jaranowski, and G. Schaefer, Phys. Lett. B 513, 147 (2001a), arXiv:gr-qc/0105038 .
- Damour et al. (2001b) T. Damour, B. R. Iyer, and B. S. Sathyaprakash, Phys. Rev. D 63, 044023 (2001b), [Erratum: Phys.Rev.D 72, 029902 (2005)], arXiv:gr-qc/0010009 .
- Buonanno et al. (2009) A. Buonanno, B. Iyer, E. Ochsner, Y. Pan, and B. S. Sathyaprakash, Phys. Rev. D 80, 084043 (2009), arXiv:0907.0700 [gr-qc] .
- Mikoczi et al. (2005) B. Mikoczi, M. Vasuth, and L. A. Gergely, Phys. Rev. D 71, 124043 (2005), arXiv:astro-ph/0504538 .
- Blanchet et al. (2005) L. Blanchet, T. Damour, G. Esposito-Farese, and B. R. Iyer, Phys. Rev. D 71, 124004 (2005), arXiv:gr-qc/0503044 .
- Arun et al. (2009) K. G. Arun, A. Buonanno, G. Faye, and E. Ochsner, Phys. Rev. D 79, 104023 (2009), [Erratum: Phys.Rev.D 84, 049901 (2011)], arXiv:0810.5336 [gr-qc] .
- Bohé et al. (2013) A. Bohé, S. Marsat, and L. Blanchet, Class. Quant. Grav. 30, 135009 (2013), arXiv:1303.7412 [gr-qc] .
- Bohé et al. (2015) A. Bohé, G. Faye, S. Marsat, and E. K. Porter, Class. Quant. Grav. 32, 195010 (2015), arXiv:1501.01529 [gr-qc] .
- Mishra et al. (2016) C. K. Mishra, A. Kela, K. G. Arun, and G. Faye, Phys. Rev. D 93, 084054 (2016), arXiv:1601.05588 [gr-qc] .
- Harry et al. (2008) I. W. Harry, S. Fairhurst, and B. S. Sathyaprakash, Class. Quant. Grav. 25, 184027 (2008), arXiv:0804.3274 [gr-qc] .
- Babak (2008) S. Babak, Class. Quant. Grav. 25, 195011 (2008), arXiv:0801.4070 [gr-qc] .
- Harry et al. (2009) I. W. Harry, B. Allen, and B. S. Sathyaprakash, Phys. Rev. D 80, 104014 (2009), arXiv:0908.2090 [gr-qc] .
- Manca and Vallisneri (2010) G. M. Manca and M. Vallisneri, Phys. Rev. D 81, 024004 (2010), arXiv:0909.0563 [gr-qc] .
- Magee et al. (2018) R. Magee, A.-S. Deutsch, P. McClincy, C. Hanna, C. Horst, D. Meacher, C. Messick, S. Shandera, and M. Wade, Phys. Rev. D 98, 103024 (2018), arXiv:1808.04772 [astro-ph.IM] .
- Cannon et al. (2015) K. Cannon, C. Hanna, and J. Peoples, arXiv (2015), arXiv:1504.04632 [astro-ph.IM] .
- Essick et al. (2020) R. Essick, P. Godwin, C. Hanna, L. Blackburn, and E. Katsavounidis, (2020), arXiv:2005.12761 [astro-ph.IM] .
- Godwin et al. (2020) P. Godwin et al., (2020), arXiv:2010.15282 [gr-qc] .
- Cannon et al. (2013) K. Cannon, C. Hanna, and D. Keppel, Phys. Rev. D 88, 024025 (2013), arXiv:1209.0718 [gr-qc] .
- Farr et al. (2015) W. M. Farr, J. R. Gair, I. Mandel, and C. Cutler, Phys. Rev. D 91, 023005 (2015), arXiv:1302.5341 [astro-ph.IM] .
- Kapadia et al. (2020) S. J. Kapadia et al., Class. Quant. Grav. 37, 045007 (2020), arXiv:1903.06881 [astro-ph.HE] .
- Abbott et al. (2018b) B. P. Abbott, R. Abbott, T. D. Abbott, M. Abernathy, F. Acernese, K. Ackley, C. Adams, T. Adams, P. Addesso, R. Adhikari, et al., Classical and Quantum Gravity 35, 065010 (2018b).
- De Luca et al. (2021) V. De Luca, V. Desjacques, G. Franciolini, P. Pani, and A. Riotto, Phys. Rev. Lett. 126, 051101 (2021), arXiv:2009.01728 [astro-ph.CO] .
- Chen et al. (2020) Z.-C. Chen, C. Yuan, and Q.-G. Huang, Phys. Rev. Lett. 124, 251101 (2020), arXiv:1910.12239 [astro-ph.CO] .
- Vaskonen and Veermäe (2021) V. Vaskonen and H. Veermäe, Phys. Rev. Lett. 126, 051303 (2021), arXiv:2009.07832 [astro-ph.CO] .
- Kohri and Terada (2021) K. Kohri and T. Terada, Phys. Lett. B 813, 136040 (2021), arXiv:2009.11853 [astro-ph.CO] .
- Clesse et al. (2018) S. Clesse, J. García-Bellido, and S. Orani, (2018), arXiv:1812.11011 [astro-ph.CO] .
- Arzoumanian et al. (2020) Z. Arzoumanian et al. (NANOGrav), Astrophys. J. Lett. 905, L34 (2020), arXiv:2009.04496 [astro-ph.HE] .
- Ali-Haïmoud et al. (2017) Y. Ali-Haïmoud, E. D. Kovetz, and M. Kamionkowski, Phys. Rev. D 96, 123523 (2017), arXiv:1709.06576 [astro-ph.CO] .
- Gow et al. (2020) A. D. Gow, C. T. Byrnes, A. Hall, and J. A. Peacock, JCAP 01, 031 (2020), arXiv:1911.12685 [astro-ph.CO] .
- Liu et al. (2019) L. Liu, Z.-K. Guo, and R.-G. Cai, Eur. Phys. J. C 79, 717 (2019), arXiv:1901.07672 [astro-ph.CO] .
- Kocsis et al. (2018) B. Kocsis, T. Suyama, T. Tanaka, and S. Yokoyama, The Astrophysical Journal 854, 41 (2018).
- Hütsi et al. (2021) G. Hütsi, M. Raidal, V. Vaskonen, and H. Veermäe, JCAP 03, 068 (2021), arXiv:2012.02786 [astro-ph.CO] .
- Vaskonen and Veermäe (2020) V. Vaskonen and H. Veermäe, Phys. Rev. D 101, 043015 (2020), arXiv:1908.09752 [astro-ph.CO] .
- Boehm et al. (2021) C. Boehm, A. Kobakhidze, C. A. J. O’hare, Z. S. C. Picker, and M. Sakellariadou, JCAP 03, 078 (2021), arXiv:2008.10743 [astro-ph.CO] .
- De Luca et al. (2020) V. De Luca, V. Desjacques, G. Franciolini, and A. Riotto, JCAP 11, 028 (2020), arXiv:2009.04731 [astro-ph.CO] .
- Abbott et al. (2016d) B. P. Abbott, R. Abbott, T. Abbott, M. Abernathy, F. Acernese, K. Ackley, C. Adams, T. Adams, P. Addesso, R. Adhikari, et al., Physical Review X 6, 041015 (2016d).
- et al (2021) A. N. et al, “gwastro/pycbc: 1.18.0 release of pycbc,” (2021).
Appendix A Injections and sensitive space-time volume
We estimate the sensitive space-time volume of our search by using 15 populations of simulated, non-spinning binary sources, spanning the plane of our search. Binaries in a given population have the same component masses and their distributions are isotropic in sky locations and source orientations, and uniform in co-moving distances. We simulate sources using the time-domain TaylorT4 waveforms with phase corrections at 3.5 PN order Buonanno et al. (2009) and inject them in data during the observation period of O2. We search for all these injected signals to measure for each population. Subsequently, we use the estimated to calculate upper limits on the merger rate. We carry out this analysis for a uniform mass model search and present the sensitive space-time volumes and the corresponding rate limits in Table 2, and on Fig. 3.
| () | ||
|---|---|---|
| 2.0, 0.21 | 44,368 | |
| 2.0, 0.40 | 12,333 | |
| 2.0, 0.60 | 5,882 | |
| 2.0, 0.80 | 3,389 | |
| 2.0, 0.99 | 2,111 | |
| 4.0, 0.41 | 1,704 | |
| 4.0, 0.60 | 1,302 | |
| 4.0, 0.80 | 869 | |
| 4.0, 0.99 | 618 | |
| 6.0, 0.61 | 496 | |
| 6.0, 0.80 | 389 | |
| 6.0, 0.99 | 299 | |
| 8.0, 0.81 | 246 | |
| 8.0, 0.99 | 200 | |
| 9.8, 0.99 | 188 |
Appendix B EB merger rate suppression factor
For the suppression factor in the EB merging rates of Eq. 1 we have used the latest analytical prescriptions from Ref. Hütsi et al. (2021), adapted to our broad PBH mass distributions, with two contributions
| (4) |
The first factor is given by
| (5) |
It takes into account the binary disruption by both matter fluctuations with a (rescaled) variance , and by the number of nearby PBHs at a distance smaller than the maximal comoving distance for such nearby PBH to fall onto the binary before matter-radiation equality. This number, for any mass function, has been estimated as
| (6) |
In Eqs. (5) and (6), is the mean PBH mass and is the corresponding variance. The function in Eq. 5 encodes the transition between small and large limits. A good approximation (with an estimated accuracy of 7% Hütsi et al. (2021) compared to the N-body simulations of Raidal et al. (2019) for a monochromatic or a lognormal mass function) is given by
| (7) | |||||
where is the Euler function and is the confluent hypergeometric function. For an extended mass function spanning several decades of masses, this approach generically gives , which would lead to a huge rate suppression for EBs and, as a consequence, LB mergers would be dominant. However it is unrealistic because it is unlikely that PBHs with a much smaller mass than the one of the binary components can ionize this binary. Instead, given that we have a sharp peak in the mass function, we use the approximation and that corresponds to the monochromatic limit. For , one gets . Given the uncertainties on the exact value of , we estimate the possible error on as the following. As a lower bound, we consider a value of ten times lower than for . As an upper bound, we consider the limit , which gives
| (8) |
For , one gets and there is no suppression in the EB merger rate. These lower and upper bounds on have been used to calculate the uncertainties in the limits reported in Fig. 5 for our different mass models.
The second factor comes from the binary disruption in early-forming clusters and can be approximated today by
| (9) |
Since we are interested by subsolar BHs at typical distances that are still relatively small compared to cosmological scales, one can safely neglect the redshift dependence in from Hütsi et al. (2021). For , one gets , such that one gets . Such a value is also motivated observationally, since it can reproduce the merging rates of GW190521, GW190814 and GW190425 Clesse and Garcia-Bellido (2020).
Finally, we point out that if , the merger rates from perturbed binaries could exceed the rate of non-perturbed binaries Vaskonen and Veermäe (2020), however there is no simple prescription that could be used for extended mass functions and these rates also have large uncertainties. Therefore we did not consider perturbed binaries in our work. It can be also pointed out that subtle general relativistic effects may also highly suppress the rate of EBs Boehm et al. (2021) if the metric around each PBH is similar to the Thakurta metric. However this is not the case for a perturbed Mc Vittie metric, as shown in De Luca et al. (2020).
Appendix C Limits on for
monochromatic models
The previous O2 limits on for monochromatic mass models can be re-analysed with our assumptions for the merging rates of EBs and LBs, using the same method as Abbott et al. (2016d). These limits are shown in Fig. 7 and for EBs they are two orders of magnitude less stringent than previously found, an effect due to the rate suppression factor . We find a limit of only for EBs and masses between and but without firmly excluding given the rate uncertainties.
Appendix D Time-frequency analysis
We perform time-frequency analysis of data around the trigger-times of the four candidates events reported in Table 1 for quantitative inspection about presence of GW signal. The scalograms or q-scans are obtained from the strain channel data stretches of the two LIGO detectors centered at trigger times of the four candidates. No q-scan provides clear visual indications of chirpy signatures or the presence of GW signal in the time-frequency representation of data. A similar conclusion is obtained for a search of long-duration bursts 80 seconds around the triggers using the strain channel DCH-CLEAN_STRAIN_C02, after spectral whitening each 4 seconds with 2 seconds of overlap.
