High-Power, Fiber-Laser-Based Source for Magic-Wavelength Trapping in Neutral-Atom Optical Clocks
Abstract
We present a continuous-wave, 810 nm laser with watt-level powers. Our system is based on difference-frequency generation of 532 nm and 1550 nm fiber lasers in a single pass through periodically poled lithium niobate (PPLN). We measure the broadband spectral noise and residual intensity noise to be compatible with off-resonant dipole trapping of ultracold atoms. Given the large bandwidth of the fiber amplifiers, the output can be optimized for a range of wavelengths, including the strontium clock-magic wavelength of 813 nm. Furthermore, with the exploration of more appropriate nonlinear crystals, we believe there is a path toward scaling this proof-of-principle design to many watts of power, and that this approach could provide a robust, rack-mountable trapping-laser for future use in strontium-based optical clocks.
I Introduction
Alkaline-earth atoms are a cornerstone of neutral-atom optical clocks,McGrew et al. (2018) as well as studies of degenerate quantum gases,Stellmer et al. (2009) diatomic molecules,McGuyer et al. (2015) and cavity QED.Norcia et al. (2016) In comparison to alkali atoms, a distinguishing benefit of alkaline-earths is their ultranarrow ‘clock transition.’ To take full advantage of the opportunities that this transition affords, experiments must confine atoms in so-called ‘magic wavelength’ (MWL) traps, for which the light shifts on the ground and clock-excited states are approximately equal, and perturbations of trapping light on the clock-transition frequency are minimized.Takamoto et al. (2005)
In this work, we consider applications to strontium clocks, for which the MWL is near 813 nm. Given the atomic polarizability of strontium at this wavelength, experiments often require a few watts of optical power in order to load and image large atomic samples. However, high optical powers cannot come at the cost of a trapping laser’s intensity noise or spectral purity. For example, power fluctuations at even multiples of the trap frequency can parametrically heat atoms, causing Doppler broadening and loss, and optical power that is far-detuned from the MWL can cause light shifts on the clock frequency. As such, incoherent features in a laser’s optical spectrum – such as those caused by amplified spontaneous emission (ASE) – must be compatible with state-of-the-art optical clocks, whose fractional-frequency uncertainties have been characterized at or below the level.Bloom et al. (2014)
In strontium clocks, Ti:Sapphire lasers have become a standard solution for meeting these challenges, as their high-power output has manageable ASE,Fasano et al. (2021) and can support exceptional atomic lifetimes.Hutson et al. (2019); Young et al. (2020) However, Ti:Sapphire lasers can be more challenging to operate outside of low-vibration, laboratory environments. Alternatively, recent experiments, especially those aimed at studying portable strontium clocks, have relied on the direct output of low-power diode lasers (often with a build-up cavity around the atoms),Bowden et al. (2019); Schiller et al. (2012); Akatsuka, Takamoto, and Katori (2010) or tapered amplifiers (TAs). While TAs have a small footprint, they are limited to comparatively lower powers than those attainable with Ti:Sapphire lasers.Schkolnik, Williams, and Yu (2020); Poli et al. (2014)
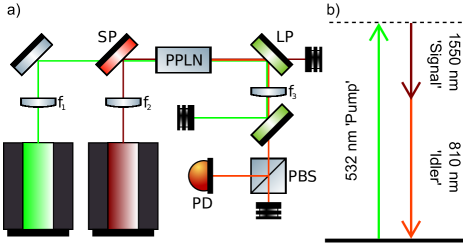
Here, we develop a laser system that can address these performance considerations by using a commercially available PPLN crystal555MSFG1-0.5-40, from Covesion to generate light at the difference frequency between two high-power, continuous-wave (CW) fiber-laser sources. The 532 nm ‘pump’ laser for this difference-frequency generation (DFG) processBoyd (2020) can provide up to 10 W of power, with a linewidth 200 kHz.666ALS-GR-532-10-I-CP-SF, from Azurlight Systems For our ‘signal’ light, we use an erbium-doped fiber amplifier (EDFA), 777Koheras BOOSTIK, K592-000-018, from NKT seeded by a single-frequency OEM laser 888Koheras BASIK MIKRO, K022- 40-1565.50-FCPGT-0,5-SSPC-0, from NKT with a center wavelength of about 1550 nm. This laser provides 15 W of power, with a Lorentzian linewidth 200 Hz. We then convert these into ‘idler’ light near 810 nm. The specific wavelengths we use in this work were chosen due to their short-term availability within our lab, but one can attain similar EDFAs within a few tens of nanometers around 1550 nm, enabling production of MWL lasers for strontium optical clocks.
With this scheme, we reach optical powers up to 1.3 W near 810 nm, and we find that the generated light exhibits an ASE background that is suppressed by dBc/Hz near the center wavelength, as measured after a single-mode optical fiber. If the laser were centered on the 813 nm MWL, we estimate that the resulting frequency shifts on the strontium clock transition could be reduced below the level, for typical trap depths. We also measure relative intensity noise (RIN) that is dBc/Hz for frequencies between 30 Hz and 100 kHz, which is within the bandwidth of acousto-optic modulators used to actively suppress RIN, often by dB. Based on manufacturer specifications, we believe that the RIN above 100 kHz is dBc/Hz.
We also note that the measured limitations on power scaling and ASE can be traced to our choice of nonlinear crystal and fiber lasers, respectively. Since both higher-damage-threshold crystalsKurimura et al. (2005); Tovstonog et al. (2008) and lower-noise fiber lasers are available, the performance measured here – while already suitable for use in metrology – is not inherent to our DFG scheme, and could be improved in future realizations.
II Setup
Single-pass, quasi-phase-matched frequency conversion with periodically poled crystals is a powerful technology for a range of demanding applications in atomic physics,Oates et al. (2007); Wilson et al. (2011); Hankin et al. (2014); Bai et al. (2019); Bridge et al. (2016) as it can imbue high-power visible laser light with the narrow linewidths, and robust operation of longer-wavelength fiber lasers. The viability of this approach for a desired output wavelength relies primarily on the availability of appropriate source lasers,Fu et al. (2017) and nonlinear crystals that can be precisely poled for a given quasi-phase-matching process.Xu and Zhu (2012) In this work, we take advantage of the fact that the frequency of 813 nm, MWL light is close to the difference-frequency of 532 nm and 1550 nm lasers, which have each been the subject of extensive study, and can be obtained at high power, as well as with impressive spectral purity.Samanta et al. (2007); Delavaux and Nagel (1995)
Fig. 1 shows the optics diagram for our design (Fig. 1a), as well as a schematic depiction of the DFG process (Fig. 1b), which outputs 1idler photon (810 nm) and 2signal photons (1550 nm) for each pair of pump (532 nm) and signal photons that is converted. The expected performance can be estimated with Boyd-Kleinman theory, Boyd and Kleinman (1968) and in the simplified case of normal beam incidence on the nonlinear crystal, the amount of converted power should be given by Broyer et al. (1985); Canarelli et al. (1992); Goldberg, Burns, and McElhanon (1995)
| (1) |
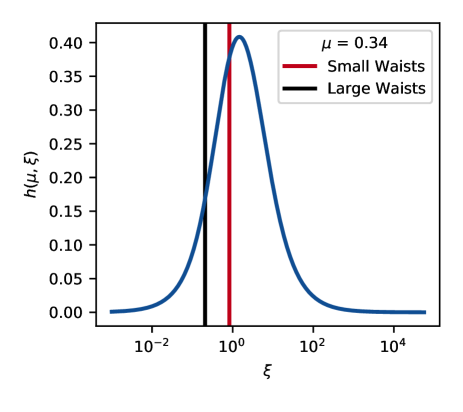
where are the power, angular frequency, and index of refraction in the crystal, and the labels correspond to the idler, signal, and pump, respectively. Additionally, is the speed of light, , is the length of the nonlinear crystal, is the vacuum permittivity, and is the Boyd-Kleinman focusing function (see Fig. 5 in the Appendix). The arguments of are the focusing parameter (where the confocal parameter is defined as twice the Rayleigh range of the beam) and . We estimate the index of refraction at each wavelength using the extended Sellmeier coefficients in Lin et al.Lin et al. (2017) Finally, is the effective nonlinear coefficient for our phase-matching process, and is related to the coefficient of our chosen crystal – PPLN, with – as well as the duty cycle of the poling.Hu, Xu, and Zhu (2013) Typically, for PPLN at visible and near-IR wavelengths, but has been quoted over a range of values, sometimes as high as . Goldberg, Burns, and McElhanon (1995); Shoji et al. (1997); Miller et al. (1997); Sowade et al. (2010) In order to capture the uncertainty in the value , which depends on the manufacturing process for the crystal, as well as the wavelength dependence of , we present Boyd-Kleinman theory curves in Fig. 2 as shaded regions, bounded above and below by curves that assume values of and , respectively.
Eq. 1 is valid when the confocal parameters of the pump () and signal () are equal. However, in this work we test two different pairs of beam sizes, and in both cases . For the larger (smaller) pair of pump and signal beam waists, this leads to a 6% (2%) difference between and . To account for this, calculations in Fig. 2 take the average confocal parameter .
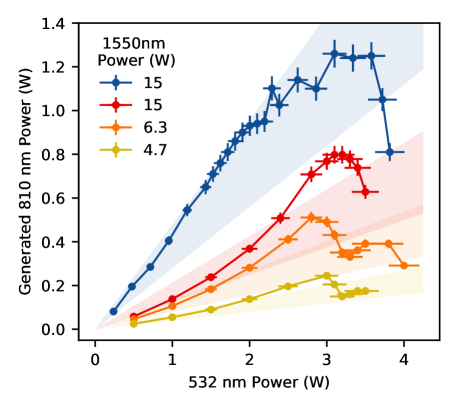
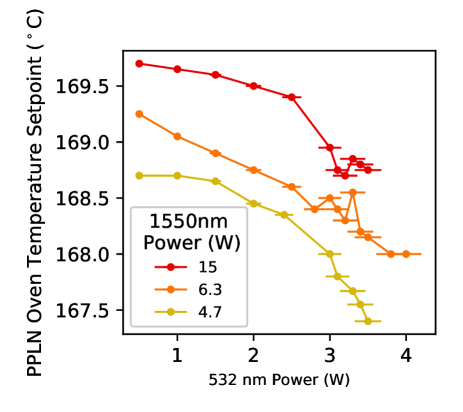
We observe reasonable agreement between the expected (Eq. 1) and generated idler power, shown in Fig. 2, when the pump power is less than about 2.5 W. However, at high pump powers, there is significant deviation, and ultimately loss of conversion. We believe that this is due to absorption and heating in the PPLN crystal. One indication of thermal effects comes from the change in the optimum setpoint temperature on our PPLN oven controller (see Fig. 6 in the Appendix), which we reoptimize before each datapoint in Fig. 2. Additionally, the deviations in idler power lead, at first, to higher than expected output powers, but only for the case when the beam waist is larger than optimal to begin with. This is consistent with an intermediate regime where the self-focusing of the beam in the crystal actually increases the value of . Potential sources for significant heating are direct absorption of 532 nm pump light,Schwesyg et al. (2011) as well as green-induced absorption of the infrared signal or idler light.Moore, Biondini, and Kath (2002)
As a result of these thermal effects, we observe power instability over the course of tens of minutes when operating at the largest power of 1.3(1) W. To avoid these issues, the measurements presented in the rest of this report operate at 1 W of 810 nm power (see blue curve in Fig. 2), where the output power was stable over many hours, and optimal alignment of the pump and signal did not drift from day to day.
III Relative Intensity Noise
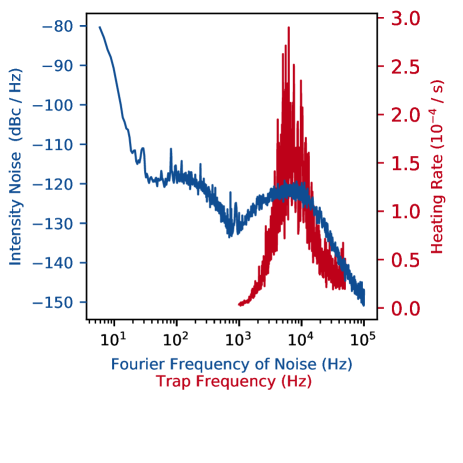
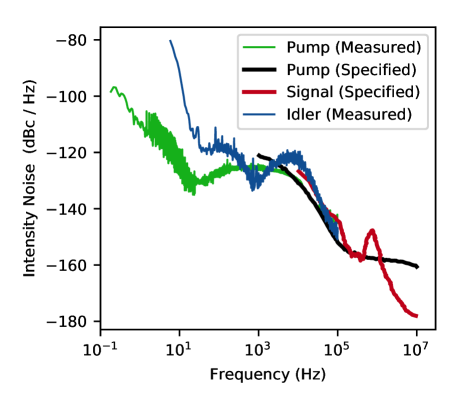
One of the most important characteristics for a trapping laser in ultracold-atom experiments is its level of RIN. In particular, amplitude noise at twice the trap frequency can cause parametric heating, which is sometimes the primary limitation on trapping lifetimes. In this section we determine the intensity noise on the generated light, shown in Fig. 3. Measurements at frequencies above 100 kHz were consistent with the noise floor of our spectrum analyzer and, based on manufacturer specifications, should be -150 dBc/Hz (see Fig. 7 in the Appendix).
The trap frequencies for optical lattice and tweezer clocks are typically in the range of 10 to 100 kHz, and as such low RIN at similar frequency scales is critical for minimizing the effects of parametric heating. The RIN profile we observe in Fig. 3 is in good agreement with the specifications for our fiber-laser sources (Fig. 7 in the Appendix). Additionally, the noise on this free-running output is concentrated within the bandwidth of most acousto-optic modulators, which could provide an additional >20 dB of suppression. Using the Fokker-Planck model in Gehm et al. one can calculate the expected heating rate for traps made with our system’s output,Gehm et al. (1998) and find a worst-case heating rate of roughly per second, for 6 kHz trap frequencies, as shown in Fig. 3. By numerically solving the rate equations associated with parametric heating in a harmonic trap,Blatt et al. (2015) we find that this corresponds to a three-dimensional motional ground state lifetime on the order of a few minutes. As this timescale is much longer than those associated with other technical sources of heating, we believe that this laser should be compatible with the observed trap lifetimes of s in optical lattices or tweezers, such as those utilized in our lab.Young et al. (2020); Hutson et al. (2019)
IV Optical Spectrum
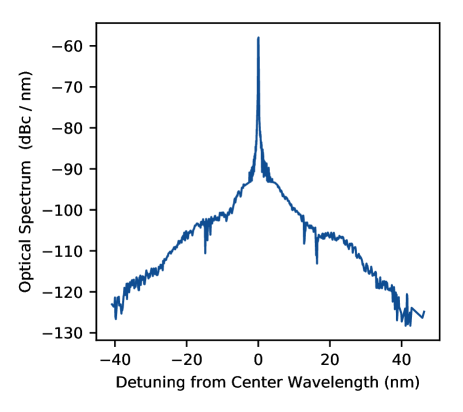
Along with RIN, the spectral purity of trapping lasers can be of central importance, particularly for sensitive atomic-clock experiments. To understand the output of our system, we measure the generated 810 nm idler on an optical spectrum analyzer (OSA). The results are shown in Fig. 4. A salient characteristic of fiber-laser spectra for use in ultracold-atom experiments is the presence of a broad ASE pedestal.Belotelov et al. (2020) The relevant metric for evaluating the effects of ASE in an atomic clock is the fractional-frequency shift of the clock transition for a given laser intensity, assuming that the spectrum is centered on the MWL. For example, it was determined that the ASE from a typical TA operating at the MWL induced a fractional-frequency shift of roughly on the strontium clock transition, per of trap depth.Bilicki (2017) Here is the recoil energy of an 813 nm trap photon. As an estimate on the effects of ASE, we calculate the polarizability of strontium’s ground and clock states over the range of wavelengths in Fig. 4, and determine the resulting fractional shift on the clock transition to be on the order of , when considering wavelengths further than 0.05 nm from the carrier. This effect is similar to calculations for TA spectra after passing through a single-mode fiber. It is important to consider the fact that single-mode fibers can provide substantial ASE filtering,Belotelov et al. (2020); Bilicki (2017) and can also introduce alignment-dependent asymmetries in the optical spectrum. For future work with a permanent DFG system integrated into our experimental apparatus, it will be important to measure the optical spectrum before and after it is filtered by a single-mode fiber.
In order to assess the compatibility with metrological applications, we note that the most accurate strontium clocks currently reach trap depths of around , and uncertainties at the level.Bothwell et al. (2019) Given our laser’s estimated ASE-induced shift of , we hypothesize that it could be used in clock experiments with state-of-the-art accuracy. However, given the imprecision of our OSA measurement, especially near the center frequency, future investigations of this claim will utilize an optical heterodyne measurement with another narrow laser,Fasano et al. (2021) as well as direct observation of light shifts using our lab’s optical-tweezer clock.Young et al. (2020)
V Discussion
We have demonstrated a high-power, low-noise 810 nm laser, based on frequency conversion of rack-mountable fiber lasers. With the specification of lower noise pump and signal lasers, we believe this DFG process could synthesize light at the 813 nm MWL for strontium’s clock transition, and would be compatible with fractional-frequency shifts that are suppressed below the level, and trapping lifetimes 100 s. Additionally, it will be possible to scale this system to higher optical powers and lower levels of ASE with the use of higher-damage threshold nonlinear crystalsKurimura et al. (2005); Tovstonog et al. (2008) and lower noise fiber amplifiers, both of which are commercially available.
The simplicity of our scheme makes it a particularly appealing option for current designs of strontium clocks that will operate in space,Schkolnik, Williams, and Yu (2020) or in studies of geodesy, for which spacious, low-noise conditions are not feasible.Grotti et al. (2018) Another strength of this DFG-based design is that the 810 nm light should inherit a linewidth that is the quadrature sum of the pump and signal, which can each be exceptionally narrow for fiber lasers. These linewidths would then allow for minimal heating in optical lattices, which are formed by standing-wave interference patters, and are sensitive to laser phase noise. Finally, we hypothesize that a similar solution should be possible in ytterbium lattice clocks, where the necessary infrared, ‘signal’ wavelength would fall within the bandwidth of low-noise, high-power thulium amplifiers.
Acknowledgements.
We acknowledge helpful discussions with A.C. Wilson and J. Ye as well as close readings of the manuscript by W.F. McGrew and C.J. Kennedy. We also thank R. B. Hutson of the Ye group for sharing his polarizability calculations. Any mention of commercial products is for information only; it does not imply recommendation or endorsement by NIST. This material is based upon work supported by NIST, AFOSR, and ARO. W.J.E. and N.S. acknowledge support from NDSEG and the NRC research associateship program, respectively.Appendix A Focusing Parameter
The focusing parameter in Eq 1 is given by
| (2) |
where is the length of the crystal divided by the confocal parameter ( is the Gaussian beam radius and is the wavelength), and , where .Broyer et al. (1985); Canarelli et al. (1992); Goldberg, Burns, and McElhanon (1995) We plot this parameter in Fig. 5 for reference.
Appendix B Change in Optimal PPLN oven Temperature With Power
We were not able to directly probe the temperature profile of the PPLN. However, we observed heating of the crystal through the fact its controller needed to be reoptimized for each different beam power. In Fig. 6, we present the power dependence of the optimal controller setpoint. For each datapoint, the temperature was swept over the optimum, with step sizes of 0.1 ∘C (though smaller steps were necessary for higher power operation) and roughly one minute of settling time before each step. At the highest powers, we also observed that the optimal position for the translation stages that set the distance between the focusing lenses and the crystal would change. However, we did not optimize this distance for each power.
Appendix C Residual Amplitude Noise on Source Lasers
In order to document the source of intensity noise on our system, we note that the RIN measured on our generated light is both consistent with that on our pump laser, as well as manufacturer specifications for both the pump and the idler. At lower frequencies (<100 Hz) there is larger intensity noise on our system, perhaps due to thermal drifts of the crystal temperature, or beam alignments. However, noise at these frequencies is not limiting for laser performance, as it can be stabilized with standard techniques.Wang et al. (2020)
References
- McGrew et al. (2018) W. McGrew, X. Zhang, R. Fasano, S. Schäffer, K. Beloy, D. Nicolodi, R. Brown, N. Hinkley, G. Milani, M. Schioppo, et al., “Atomic clock performance enabling geodesy below the centimetre level,” Nature 564, 87–90 (2018).
- Stellmer et al. (2009) S. Stellmer, M. K. Tey, B. Huang, R. Grimm, and F. Schreck, “Bose-einstein condensation of strontium,” Physical review letters 103, 200401 (2009).
- McGuyer et al. (2015) B. H. McGuyer, M. McDonald, G. Z. Iwata, M. G. Tarallo, W. Skomorowski, R. Moszynski, and T. Zelevinsky, “Precise study of asymptotic physics with subradiant ultracold molecules,” Nature Physics 11, 32–36 (2015).
- Norcia et al. (2016) M. A. Norcia, M. N. Winchester, J. R. Cline, and J. K. Thompson, “Superradiance on the millihertz linewidth strontium clock transition,” Science advances 2, e1601231 (2016).
- Takamoto et al. (2005) M. Takamoto, F.-L. Hong, R. Higashi, and H. Katori, “An optical lattice clock,” Nature 435, 321–324 (2005).
- Bloom et al. (2014) B. Bloom, T. Nicholson, J. Williams, S. Campbell, M. Bishof, X. Zhang, W. Zhang, S. Bromley, and J. Ye, “An optical lattice clock with accuracy and stability at the 10- 18 level,” Nature 506, 71–75 (2014).
- Fasano et al. (2021) R. Fasano, Y. Chen, W. McGrew, W. Brand, R. Fox, and A. Ludlow, “Characterization and suppression of background light shifts in an optical lattice clock,” Physical Review Applied 15, 044016 (2021).
- Hutson et al. (2019) R. B. Hutson, A. Goban, G. E. Marti, L. Sonderhouse, C. Sanner, and J. Ye, “Engineering quantum states of matter for atomic clocks in shallow optical lattices,” Physical review letters 123, 123401 (2019).
- Young et al. (2020) A. W. Young, W. J. Eckner, W. R. Milner, D. Kedar, M. A. Norcia, E. Oelker, N. Schine, J. Ye, and A. M. Kaufman, “Half-minute-scale atomic coherence and high relative stability in a tweezer clock,” Nature 588, 408–413 (2020).
- Bowden et al. (2019) W. Bowden, R. Hobson, I. R. Hill, A. Vianello, M. Schioppo, A. Silva, H. S. Margolis, P. E. Baird, and P. Gill, “A pyramid mot with integrated optical cavities as a cold atom platform for an optical lattice clock,” Scientific reports 9, 1–9 (2019).
- Schiller et al. (2012) S. Schiller, A. Görlitz, A. Nevsky, S. Alighanbari, S. Vasilyev, C. Abou-Jaoudeh, G. Mura, T. Franzen, U. Sterr, S. Falke, et al., “The space optical clocks project: Development of high-performance transportable and breadboard optical clocks and advanced subsystems,” in 2012 European Frequency and Time Forum (IEEE, 2012) pp. 412–418.
- Akatsuka, Takamoto, and Katori (2010) T. Akatsuka, M. Takamoto, and H. Katori, “Three-dimensional optical lattice clock with bosonic sr 88 atoms,” Physical Review A 81, 023402 (2010).
- Schkolnik, Williams, and Yu (2020) V. Schkolnik, J. R. Williams, and N. Yu, “Direct semiconductor diode laser system for an optical lattice clock based on neutral strontium for future tests of fundamental physics in space,” in Optical, Opto-Atomic, and Entanglement-Enhanced Precision Metrology II, Vol. 11296 (International Society for Optics and Photonics, 2020) p. 112962H.
- Poli et al. (2014) N. Poli, M. Schioppo, S. Vogt, U. Sterr, C. Lisdat, G. Tino, et al., “A transportable strontium optical lattice clock,” Applied Physics B 117, 1107–1116 (2014).
- Note (1) MSFG1-0.5-40, from Covesion.
- Boyd (2020) R. W. Boyd, Nonlinear optics (Academic press, 2020).
- Note (2) ALS-GR-532-10-I-CP-SF, from Azurlight Systems.
- Note (3) Koheras BOOSTIK, K592-000-018, from NKT.
- Note (4) Koheras BASIK MIKRO, K022- 40-1565.50-FCPGT-0,5-SSPC-0, from NKT.
- Kurimura et al. (2005) S. Kurimura, N. E. Yu, Y. Nomura, M. Nakamura, K. Kitamura, and T. Sumiyoshi, “Qpm wavelength converters based on stoichiometric lithium tantalate,” in Advanced Solid-State Photonics (Optical Society of America, 2005) p. 92.
- Tovstonog et al. (2008) S. V. Tovstonog, S. Kurimura, I. Suzuki, K. Takeno, S. Moriwaki, N. Ohmae, N. Mio, and T. Katagai, “Thermal effects in high-power cw second harmonic generation in mg-doped stoichiometric lithium tantalate,” Optics express 16, 11294–11299 (2008).
- Oates et al. (2007) C. W. Oates, Z. Barber, J. Stalnaker, C. Hoyt, T. M. Fortier, S. A. Diddams, and L. Hollberg, “Stable laser system for probing the clock transition at 578 nm in neutral ytterbium,” in 2007 IEEE International Frequency Control Symposium Joint with the 21st European Frequency and Time Forum (IEEE, 2007) pp. 1274–1277.
- Wilson et al. (2011) A. C. Wilson, C. Ospelkaus, A. VanDevender, J. A. Mlynek, K. R. Brown, D. Leibfried, and D. J. Wineland, “A 750-mw, continuous-wave, solid-state laser source at 313 nm for cooling and manipulating trapped 9 be+ ions,” Applied Physics B 105, 741–748 (2011).
- Hankin et al. (2014) A. Hankin, Y.-Y. Jau, L. Parazzoli, C. Chou, D. Armstrong, A. Landahl, and G. Biedermann, “Two-atom rydberg blockade using direct 6 s to n p excitation,” Physical Review A 89, 033416 (2014).
- Bai et al. (2019) J. Bai, J. Wang, S. Liu, J. He, and J. Wang, “Autler–townes doublet in single-photon rydberg spectra of cesium atomic vapor with a 319 nm uv laser,” Applied Physics B 125, 33 (2019).
- Bridge et al. (2016) E. M. Bridge, N. C. Keegan, A. D. Bounds, D. Boddy, D. P. Sadler, and M. P. Jones, “Tunable cw uv laser with< 35 khz absolute frequency instability for precision spectroscopy of sr rydberg states,” Optics Express 24, 2281–2292 (2016).
- Fu et al. (2017) S. Fu, W. Shi, Y. Feng, L. Zhang, Z. Yang, S. Xu, X. Zhu, R. A. Norwood, and N. Peyghambarian, “Review of recent progress on single-frequency fiber lasers,” JOSA B 34, A49–A62 (2017).
- Xu and Zhu (2012) P. Xu and S. Zhu, “Quasi-phase-matching engineering of entangled photons,” AIP Advances 2, 053807 (2012).
- Samanta et al. (2007) G. Samanta, G. Fayaz, Z. Sun, and M. Ebrahim-Zadeh, “High-power, continuous-wave, singly resonant optical parametric oscillator based on mgo: spplt,” Optics letters 32, 400–402 (2007).
- Delavaux and Nagel (1995) J.-M. Delavaux and J. Nagel, “Multi-stage erbium-doped fiber amplifier designs,” Journal of lightwave technology 13, 703–720 (1995).
- Boyd and Kleinman (1968) G. Boyd and D. Kleinman, “Parametric interaction of focused gaussian light beams,” Journal of Applied Physics 39, 3597–3639 (1968).
- Broyer et al. (1985) M. Broyer et al., “Intracavity cw difference frequency generation by mixing three photons and using gaussian laser beams,” Journal de Physique 46, 523–533 (1985).
- Canarelli et al. (1992) P. Canarelli, Z. Benko, R. Curl, and F. K. Tittel, “Continuous-wave infrared laser spectrometer based on difference frequency generation in aggas 2 for high-resolution spectroscopy,” JOSA B 9, 197–202 (1992).
- Goldberg, Burns, and McElhanon (1995) L. Goldberg, W. Burns, and R. McElhanon, “Difference-frequency generation of tunable mid-infrared radiation in bulk periodically poled linbo 3,” Optics letters 20, 1280–1282 (1995).
- Lin et al. (2017) H. Lin, S. Yu, C. Shi, X. Lv, P. Lv, Z. Xie, G. Zhao, and S. Zhu, “Extended sellmeier equation for the extraordinary refractive index of 5% mgo-doped congruent linbo3 at high temperature,” AIP Advances 7, 095201 (2017).
- Hu, Xu, and Zhu (2013) X. Hu, P. Xu, and S. Zhu, “Engineered quasi-phase-matching for laser techniques,” Photonics Research 1, 171–185 (2013).
- Shoji et al. (1997) I. Shoji, T. Kondo, A. Kitamoto, M. Shirane, and R. Ito, “Absolute scale of second-order nonlinear-optical coefficients,” JOSA B 14, 2268–2294 (1997).
- Miller et al. (1997) G. Miller, R. Batchko, W. Tulloch, D. Weise, M. Fejer, and R. Byer, “42%-efficient single-pass cw second-harmonic generation in periodically poled lithium niobate,” Optics letters 22, 1834–1836 (1997).
- Sowade et al. (2010) R. Sowade, I. Breunig, C. Tulea, and K. Buse, “Nonlinear coefficient and temperature dependence of the refractive index of lithium niobate crystals in the terahertz regime,” Applied Physics B 99, 63–66 (2010).
- Schwesyg et al. (2011) J. R. Schwesyg, A. Markosyan, M. Falk, M. C. C. Kajiyama, D. H. Jundt, K. Buse, and M. M. Fejer, “Optical loss mechanisms in magnesium-doped lithium niobate crystals in the 300 to 2950 nm wavelength range,” in Advances in Optical Materials (Optical Society of America, 2011) p. AIThE3.
- Moore, Biondini, and Kath (2002) R. Moore, G. Biondini, and W. Kath, “Self-induced thermal effects and modal competition in continuous-wave optical parametric oscillators,” JOSA B 19, 802–811 (2002).
- Gehm et al. (1998) M. Gehm, K. O’hara, T. Savard, and J. Thomas, “Dynamics of noise-induced heating in atom traps,” Physical Review A 58, 3914 (1998).
- Blatt et al. (2015) S. Blatt, A. Mazurenko, M. Parsons, C. Chiu, F. Huber, and M. Greiner, “Low-noise optical lattices for ultracold li 6,” Physical Review A 92, 021402 (2015).
- Wang et al. (2020) Y. Wang, K. Wang, E. F. Fenton, Y.-W. Lin, K.-K. Ni, and J. D. Hood, “Reduction of laser intensity noise over 1 mhz band for single atom trapping,” Optics Express 28, 31209–31215 (2020).
- Belotelov et al. (2020) G. Belotelov, V. Ovsiannikov, D. Sutyrin, A. Y. Gribov, O. Berdasov, V. Pal’chikov, S. Slyusarev, and I. Y. Blinov, “Lattice light shift in strontium optical clock,” Laser Physics 30, 045501 (2020).
- Bilicki (2017) S. Bilicki, Strontium optical lattice clocks: clock comparisons for timescales and fundamental physics applications, Ph.D. thesis, Observatoire de Paris-SYRTE (2017).
- Bothwell et al. (2019) T. Bothwell, D. Kedar, E. Oelker, J. M. Robinson, S. L. Bromley, W. L. Tew, J. Ye, and C. J. Kennedy, “Jila sri optical lattice clock with uncertainty of,” Metrologia 56, 065004 (2019).
- Grotti et al. (2018) J. Grotti, S. Koller, S. Vogt, S. Häfner, U. Sterr, C. Lisdat, H. Denker, C. Voigt, L. Timmen, A. Rolland, et al., “Geodesy and metrology with a transportable optical clock,” Nature Physics 14, 437–441 (2018).