A short mean free path at favors late and rapid reionization by faint galaxies
Abstract
Recent measurements of the ionizing photon mean free path () at suggest that the IGM was rapidly evolving at those times. We use radiative transfer simulations to explore the implications for reionization, with a focus on the short value of cMpc/ at . We introduce a model for sub-resolution ionizing photon sinks based on radiative hydrodynamics simulations of small-scale IGM clumping. We argue that the rapid evolution in at , together with constraints on the metagalactic ionizing background, favors a late reionization process in which the neutral fraction evolved rapidly in the latter half. We also argue that the short points to faint galaxies as the primary drivers of reionizaton. Our preferred model, with Mpc/, has a midpoint of and ends at . It requires 3 ionizing photons per H atom to complete reionization and a LyC photon production efficiency of at . Recovering as low as the measured central value may require an increase in IGM clumpiness beyond predictions from simulations, with a commensurate increase in the photon budget.
1 Introduction
There are several lines of evidence that reionization ended around , or perhaps later. The large Ly forest opacity fluctuations at have been attributed to neutral islands below (Becker et al., 2015; Bosman et al., 2018; Eilers et al., 2018; Kulkarni et al., 2019; Keating et al., 2020b; Nasir & D’Aloisio, 2020; Qin et al., 2021). Other independent constraints from high- Ly emitter (LAE) surveys and quasar damping wing analyses also suggest a significantly neutral IGM at (Davies et al., 2018; Wang et al., 2020; Kashikawa et al., 2006; Schenker et al., 2012; Pentericci et al., 2014; Ono et al., 2011). The reionization models invoked to explain these observations are consistent with the low value of Cosmic Microwave Background optical depth reported by Planck, (Planck Collaboration et al., 2018). Given large uncertainties in these measurements, however, it is unclear whether reionization was rapid or more extended in duration (e.g. Finkelstein et al., 2019). In this letter, we argue that recent measurements of the mean free path at point to a reionization process that was both late and rapid.
The new evidence considered here was reported by Becker et al. (2021, B21). They extended direct measurements of the mean free path (MFP; ) to and found a rather low value of cMpc/h. This disfavors at the level even the low MFP predicted by the “Low ” model of Keating et al. (2020a), in which the IGM was still neutral at and reionization ended at . The B21 result suggests that ionizing photon sinks played a larger role than previous models have captured, and/or that the IGM was even more neutral at .
Recent theoretical work has demonstrated that modeling the sinks is complicated by the interplay between self-shielding and the hydrodynamic response of the IGM to photoheating (Park et al., 2016; D’Aloisio et al., 2020). Before reionization, the gas clumps down to its Jeans scale, which in the CDM cosmology can be as low as kpc. After ionization fronts (I-fronts) sweep through, the local density structure “relaxes” by Jeans smoothing and photoevaporative processes, evolving to a less clumpy state over a timscale Myr. State-of-the-art radiative hydrodynamics (RHD) simulations have yet to fully bridge the scale gap between the sinks and the Mpc boxes necessary to converge on reionization observables (Iliev et al., 2014). In addition, the largest dynamic ranges have been achieved with moment-based radiative transfer (RT) methods, which may be numerically inaccurate in the sinks (Wu et al., 2021).
A key addition of this work is that we have developed a new sub-grid model for the sinks based on the study of D’Aloisio et al. (2020, D20). We have incorporated this into a new ray tracing RT code, giving our reionization simulations a formal dynamic range of over 5 orders of magnitude in scale. In this letter, we present first results from this new simulation framework and we use them to interpret the B21 measurements.
2 Numerical Methodology
We ran RT simulations of reionization in a volume using our new ray tracing code, which we will describe in detail elsewhere (Cain & D’Aloisio in prep.). We use a coarse-grained uniform RT grid with . The premise is to use a pre-run suite of highly resolved (small volume) RHD simulations to model the opacity evolution in each RT cell during reionization.
2.1 Coarse-grained RT
Our monochromatic RT algorithm traces rays from source cells using an adaptive splitting and merging scheme based on Abel & Wandelt (2002) and similar to the procedure of Trac & Cen (2007). We track 48 directions (HEALPix level 1) and use the full speed of light because the commonly adopted reduced-speed approximation leads to inaccuracies near the end of reionization. We propagate sub-grid “moving-screen” I-fronts across the coarse cells with speed , where is the incident ionizing flux, is the proper H density, and accounts for singly ionized helium. We assume that ray intersecting cell contributes photoionizations over a path length , where is the cell ionized fraction and is the total path length of the ray through the cell. We further assume that the MFP in the ionized part of the cell takes a locally uniform value, . The mean H photoionization rate there is
| (1) |
where is the number of photons incident on the cell in a time from ray , is the cell volume, and is the H photoionization cross-section. The over-bars denote frequency averages. To compute these quantities, we assume a specific intensity of between 1 and 4 Ry, consistent with models of young metal-poor stellar populations (e.g. D’Aloisio et al., 2019). The numerator of eq. 1 counts H ionizations per unit time. The denominator gives the number of H i atoms in ionized gas since is the -weighted mean . We tested this moving-screen framework against simulations of plane-parallel I-fronts similar to those in D20 (but with one domain) and found good agreement in the photon budget. For comparison against Ly forest measurements, we track temperatures on the RT grid using the approximate method of D’Aloisio et al. (2019). We adopt their fit for the post I-front temperature, , and the subsequent thermal evolution is modeled using their Eq. 6.
2.2 Sub-grid model for
We extract from the RHD simulations of D20, which use dark matter particles and gas/RT cells in a box. These simulations are parameterized by three environmental quantities: the reionization redshift, , the impinging , which quantifies the strength of the external ionizing background, and the box-scale linear over-density over its standard deviation, . We have expanded the D20 suite to include all combinations of , , and . For cells reionized below , we extrapolate logarithmically in cosmic time. We tested our extrapolation against a simulation with and found good agreement. The frequency-averaged MFP is obtained using , where is a volume average.
The D20 simulations track the self-shielding and hydrodynamic response of the IGM in the wake of I-fronts sourced by a steady background (constant ). However, can evolve considerably in realistic environments. Using D20-style simulations with time-varying , we have developed an empirical model for the evolution of ,
| (2) |
The first term on the right is the quantity measured from the D20 simulations – the evolution of at fixed . The second term captures the instantaneous change in with . The last term implements a relaxation timescale over which evolves towards an equilibrium value in response to a sudden increase in . The term and are interpolated from the expanded D20 suite. When interpolating over , we correct for the I-front crossing time of the cell by averaging the opacity in the least and most recently ionized gas. For , we assume a power law , where . This form is motivated by McQuinn et al. (2011), the constraints of B21, as well as our D20-style calibration simulations. Eq. 2 is integrated in fully ionized cells with . In partially ionized cells or those with , we set . Since depends on , we iterate Eqs. 1-2 until convergence. The D20-style simulations that we used to calibrate Eq. 2 included up to impulsive increases in as well as more realistic cases with gradual evolution. Eq. (2) captures in the gradually time-varying- simulations to better than a few percent, while a straight interpolation over-estimates it by 10-15%. Our impulsive tests yielded similar levels of improvement. Consistent with the results of these tests, we use Myr.
2.3 Density fields and source models
The RT sims were run on a coarse-grained version of the hydrodynamics simulation in D’Aloisio et al. (2018), which employed a modified version of the code of Trac & Pen (2004). Density fields and halo catalogs were saved at time intervals of 10 Myr from . The halo mass functions are converged down to h-1M⊙, more massive than the smallest halos believed to have contributed to reionization. We extended our sources by generating sub-resolution halos down to h-1M⊙ using the nonlinear biasing method of Ahn et al. (2015), applied with the halo mass function of Trac et al. (2015). (As discused below, we have also run tests with h-1M⊙.) We used two models for the ionizing photon production rate of each halo: constant (dependent only on ) and UV luminosity (), where is the number of photons per unit time produced by a halo. The former is our fiducial model, which assigns more weight to low-mass galaxies in the ionizing photon budget. As we will see, the motivation for this choice is that the short value of (z=6) favors models in which reionization is driven by faint, less-biased sources. For the model, we abundance matched to the UV luminosity function of Finkelstein et al. (2019). In both cases we chose the overall normalization of at each redshift to set the global emissivity history, . We varied by trial and error to find reionization models consistent with the Planck constraints and the mean free path measurements.
3 Results
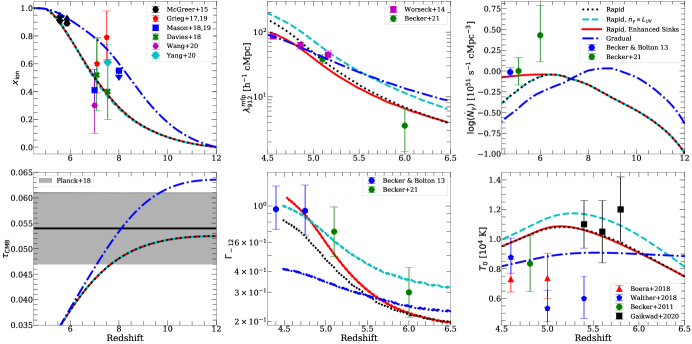
In Fig. 1 we show 4 models chosen to illustrate our conclusions. In clock-wise order, starting at the top left, the panels show the volume-weighted mean ionized fraction, comoving MFP at 1 Ry (), comoving ionizing emissivity (), temperature at the cosmic mean density (), volume-weighted mean in ionized gas, and the cumulative CMB optical depth. We compare against an assortment of existing constraints. To calculate , we traced 50,000 sight lines from random locations, created mock quasar absorption spectra, and fit to the model of Prochaska et al. (2009) and Worseck et al. (2014).111Our sight lines do not start on QSOs, thus are not affected by biases from the proximity effect (D’Aloisio et al., 2018; Becker et al., 2021). When we anchored sight lines on massive halos, we found that the model of Prochaska et al. (2009) did not provide a good fit at rest-frame Å, owing to the local clustering of sources and the back-reaction of on . Excluding these wavelengths in the fit gave the un-biased . In this work, we assume that the observations represent the un-biased . For reference, the biased is 9.3, 15.8, 15.1, 9.1 Mpc/h in the rapid, gradual, , and enhanced sinks models, respectively.
All models in Fig. 1 end reionization at and formally have the same duration of Myr (). The key distinction between the rapid and gradual scenarios is how quickly evolves in the last half of reionization. In the rapid model (black/dotted), the emissivity peaks at and reionization proceeds rapidly after its midpoint. As a result, and grow rapidly between and 5.2, consistent with the measurements at those redshifts. The cyan/dashed curve shows a model with the same emissivity, but with . In this case reionization is driven by rarer, brighter galaxies222For the model, half the ionizing photons are produced by halos with at . For the model with independent of , production is peaked around ; we find . which, on average, produce larger in ionized bubbles. This results in being too long across all redshifts.
A principal conclusion from our modeling is that the short measured by B21 prefers faint, less-biased sources as the main drivers of reionization. We have run a set of models with a lower of . Adopting the same as in our rapid model, we find and Mpc at . The dependence of on can be understood in terms of halo bias. Sources are less clustered in models with lower , which leads to ionized bubbles being smaller, on average. Large-scale fluctuations in are also reduced. In contrast, for models with highly clustered sources, the intense ionizing radiation in over-dense regions quickly clears away the local sinks, allowing this radiation to penetrate much further into the IGM bulk.
In the gradual model (blue/dot-dashed), reionization proceeds more gradually after its midpoint. By , more of the gas has relaxed in response to photoheating. This, combined with the larger , results in a factor of longer at compared to the rapid model. The evolution in is flatter but it undershoots by a factor of the measurements of Becker & Bolton (2013) at . Generally, models in which most of the IGM was reionized well before are difficult to reconcile with a short . We have confirmed this with other runs as well, including those with M⊙. The problem is that the local grow with time after owing to relaxation and photoevaporation. In gas that was reionized at higher redshift, the only way to obtain low is to lower . But the slow evolution results in undershooting the Ly forest measurements of at . Hence, another principal conclusion from our modeling is that a rapidly evolving is required to recover both the short value of at and its rapid evolution to . However, we note that the rapid models are in 2-3 tension with the McGreer et al. (2015) constraints on (top-left of Fig. 1). Updating these constraints with more QSO sight lines will provide a critical test of our assertion.
There are two more obvious deficits of the rapid model (black/dashed): (1) The quick growth in continues below , which is incompatible with measurements; (2) Relatedly, to control the growth of and at , must fall by in the Myr between and 5, a rapid evolution in the galaxy population (see however Ocvirk et al. (2021)). We emphasize that is an input to our simulations; the decline is not the result of any feedback prescription. D20 found that their are converged in resolution at the 10 % (factor of ) level in relaxed (un-relaxed gas), respectively. Moreover, up to Myr after , D20 found similar to the unheated simulations of Emberson et al. (2013). This argues against numerical convergence being the sole culprit.
One plausible explanation for the behavior of is that our sub-grid model overestimates in over-dense cells, e.g. by inadequately sampling massive sinks near the end of reionization. To illustrate that we can obtain milder evolution in through sinks, we crudely scale down in all over-dense cells after by a factor of , such that is a factor of 2 shorter in those cells by . The result is the rapid+enhanced sinks model (red/solid), for which levels off after . In this case, the enhanced sinks regulate the growth of and so they do not outpace the measurements below . This obviates the need for a rapid decline in , illustrating an approximate degeneracy between the emissivity and the sinks.333We have also run an enhanced sinks version of the gradual model. While it is in better agreement with the measurements – reconciling a major deficiency of the model – we find Mpc. This is still much larger than the measurement, suggesting that an even larger boost to the sinks at would be required in this scenario.
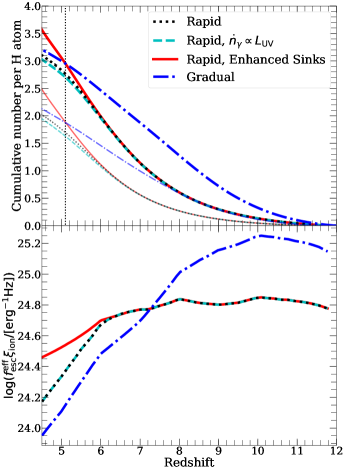
The thick curves in the top panel of Fig. 2 show the cumulative number of photons per hydrogen atom absorbed. The thin curves show the cumulative recombinations.444The number of recombinations is given by the total number of absorptions minus the net number of ionizations. For reference, the vertical line corresponds to reionization’s end. All our models require photons/H atom to complete reionization. This is a factor of more than in recent models of the ionizing emissivity.555We find and photons/H atom in the models of Robertson et al. (2015) and Finkelstein et al. (2019), respectively. Although more photons are absorbed earlier in the gradual model, the cumulative number is similar to the rapid models because much of the gas remains un-relaxed in the latter.
In a paper submitted concurrently with this work, Davies et al. (2021) quantify in detail the implications of the B21 measurement of for high- galaxies. Considering also the dark pixel fraction constraints on , they find that photons per baryon are required to bring reionization to completion. Although this appears considerably larger than our budget, we note that in our rapid models are longer than the central value of B21, and the neutral fractions are . Adjusting for the former would bring down their budget to 3.7 photons per baryon. Adjusting for latter would bring us further into agreement. Moreover, we have rerun the rapid simulation, but with a uniform () boost to the clumping (emissivity). This yields and , closer to the B21 central value of Mpc. It requires 5.2 photons/H atom by .
The emissivity is commonly modeled as , where is an effective escape fraction, is the ionizing efficiency, and is the UV luminosity density. The bottom panel of Fig.2 shows the product, , obtained by applying this relation to our and integrating the UV luminosity function of Finkelstein et al. (2019) for . Previous studies have assumed , consistent with the constraints of Bouwens et al. (2016) for galaxies. There is evidence that the bluest galaxies at higher redshift exhibit higher efficiencies, (Bouwens et al., 2016; Stark et al., 2017; Endsley et al., 2021). For the rapid models to be consistent with values of requires . The gradual model requires a more extreme at its peak of . However, if we let M⊙, we find , indicating that such an early peak in emissivity would likely require efficient star formation in galaxies with M⊙ (see e.g. Finkelstein et al., 2019). Our are similar to those reported by Davies et al. (2021). That our rapid models require supports the conclusion that faint galaxies must have been prolific leakers of LyC radiation, if reionization was driven by stellar emissions.
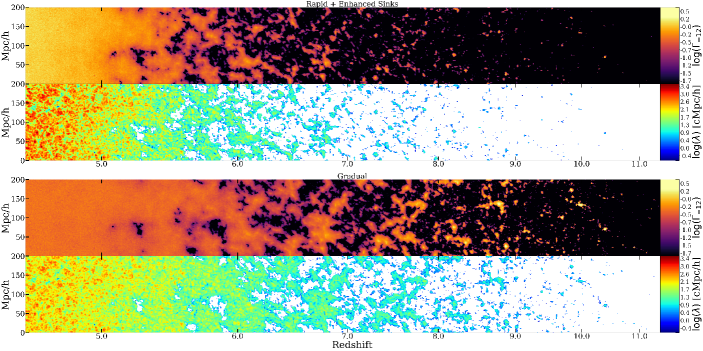
The top and bottom sets of panels in Fig. 3 show light cones through our rapid+enhanced sinks and gradual models, respectively. In each set, the top(bottom) panel shows (). The neutral islands down to likely make both models compatible with the large opacity fluctuations observed in the Ly forest (Kulkarni et al., 2019; Nasir & D’Aloisio, 2020). The Ly forest mean flux evolution, however, may already disfavor the gradual model (c.f. bottom-middle of Fig. 1). Another contrasting feature is the existence of large (s Mpc) ionized bubbles out to in the gradual model, which is of interest for recent observations of bright LAE over-densities at (Castellano et al., 2018; Tilvi et al., 2020; Endsley et al., 2021). The different global and morphologies may be testable by forthcoming 21cm surveys.
4 Conclusion
We have explored the implications of the B21 MFP measurements for reionization. Taken together with constraints on the intensity of the metagalactic ionizing background, we have argued that the rapid evolution from cMpc/h to cMpc/h favors a rapid and late reionization process. We have also argued that the short value of is evidence that reionization was driven primarily by the faintest, least biased galaxies among its sources. In our preferred models, ionizing photons/H atom are required to complete reionization. Half of them come from galaxies with M⊙, or lower. At , this corresponds to UV magnitudes . In addition to confirming the low value of , other avenues forward include updating the Ly forest dark pixel limits on and constraining the IGM temperature at . Our analysis highlights the complementary channels for constraining reionization with QSO absorption spectra.
References
- Abel & Wandelt (2002) Abel, T., & Wandelt, B. D. 2002, MNRAS, 330, L53, doi: 10.1046/j.1365-8711.2002.05206.x
- Ahn et al. (2015) Ahn, K., Iliev, I. T., Shapiro, P. R., & Srisawat, C. 2015, MNRAS, 450, 1486, doi: 10.1093/mnras/stv704
- Becker & Bolton (2013) Becker, G. D., & Bolton, J. S. 2013, MNRAS, 436, 1023, doi: 10.1093/mnras/stt1610
- Becker et al. (2011) Becker, G. D., Bolton, J. S., Haehnelt, M. G., & Sargent, W. L. W. 2011, MNRAS, 410, 1096, doi: 10.1111/j.1365-2966.2010.17507.x
- Becker et al. (2015) Becker, G. D., Bolton, J. S., Madau, P., et al. 2015, MNRAS, 447, 3402, doi: 10.1093/mnras/stu2646
- Becker et al. (2021) Becker, G. D., D’Aloisio, A., Christenson, H. M., et al. 2021, arXiv e-prints, arXiv:2103.16610. https://arxiv.org/abs/2103.16610
- Boera et al. (2019) Boera, E., Becker, G. D., Bolton, J. S., & Nasir, F. 2019, ApJ, 872, 101, doi: 10.3847/1538-4357/aafee4
- Bosman et al. (2018) Bosman, S. E. I., Fan, X., Jiang, L., et al. 2018, MNRAS, 479, 1055, doi: 10.1093/mnras/sty1344
- Bouwens et al. (2016) Bouwens, R. J., Smit, R., Labbé, I., et al. 2016, ApJ, 831, 176, doi: 10.3847/0004-637X/831/2/176
- Castellano et al. (2018) Castellano, M., Pentericci, L., Vanzella, E., et al. 2018, ApJ, 863, L3, doi: 10.3847/2041-8213/aad59b
- D’Aloisio et al. (2018) D’Aloisio, A., McQuinn, M., Davies, F. B., & Furlanetto, S. R. 2018, MNRAS, 473, 560, doi: 10.1093/mnras/stx2341
- D’Aloisio et al. (2019) D’Aloisio, A., McQuinn, M., Maupin, O., et al. 2019, ApJ, 874, 154, doi: 10.3847/1538-4357/ab0d83
- D’Aloisio et al. (2020) D’Aloisio, A., McQuinn, M., Trac, H., Cain, C., & Mesinger, A. 2020, The Astrophysical Journal, 898, 149, doi: 10.3847/1538-4357/ab9f2f
- Davies et al. (2021) Davies, F. B., Bosman, S. E. I., Furlanetto, S. R., Becker, G. D., & D’Aloisio, A. 2021, arXiv e-prints, arXiv:2105.10518. https://arxiv.org/abs/2105.10518
- Davies et al. (2018) Davies, F. B., Hennawi, J. F., Bañados, E., et al. 2018, The Astrophysical Journal, 864, 142, doi: 10.3847/1538-4357/aad6dc
- Eilers et al. (2018) Eilers, A.-C., Davies, F. B., & Hennawi, J. F. 2018, ApJ, 864, 53, doi: 10.3847/1538-4357/aad4fd
- Emberson et al. (2013) Emberson, J. D., Thomas, R. M., & Alvarez, M. A. 2013, The Astrophysical Journal, 763, 146, doi: 10.1088/0004-637x/763/2/146
- Endsley et al. (2021) Endsley, R., Stark, D. P., Charlot, S., et al. 2021, MNRAS, 502, 6044, doi: 10.1093/mnras/stab432
- Finkelstein et al. (2019) Finkelstein, S. L., D’Aloisio, A., Paardekooper, J.-P., et al. 2019, ApJ, 879, 36, doi: 10.3847/1538-4357/ab1ea8
- Gaikwad et al. (2020) Gaikwad, P., Rauch, M., Haehnelt, M. G., et al. 2020, MNRAS, 494, 5091, doi: 10.1093/mnras/staa907
- Greig et al. (2019) Greig, B., Mesinger, A., & Bañados, E. 2019, MNRAS, 484, 5094, doi: 10.1093/mnras/stz230
- Greig et al. (2016) Greig, B., Mesinger, A., Haiman, Z., & Simcoe, R. A. 2016, Monthly Notices of the Royal Astronomical Society, 466, 4239, doi: 10.1093/mnras/stw3351
- Iliev et al. (2014) Iliev, I. T., Mellema, G., Ahn, K., et al. 2014, MNRAS, 439, 725, doi: 10.1093/mnras/stt2497
- Kashikawa et al. (2006) Kashikawa, N., Shimasaku, K., Malkan, M. A., et al. 2006, ApJ, 648, 7, doi: 10.1086/504966
- Keating et al. (2020a) Keating, L. C., Kulkarni, G., Haehnelt, M. G., Chardin, J., & Aubert, D. 2020a, MNRAS, 497, 906, doi: 10.1093/mnras/staa1909
- Keating et al. (2020b) Keating, L. C., Weinberger, L. H., Kulkarni, G., et al. 2020b, MNRAS, 491, 1736, doi: 10.1093/mnras/stz3083
- Kulkarni et al. (2019) Kulkarni, G., Keating, L. C., Haehnelt, M. G., et al. 2019, MNRAS, 485, L24, doi: 10.1093/mnrasl/slz025
- Mason et al. (2018) Mason, C. A., Treu, T., de Barros, S., et al. 2018, ApJ, 857, L11, doi: 10.3847/2041-8213/aabbab
- Mason et al. (2019) Mason, C. A., Fontana, A., Treu, T., et al. 2019, Monthly Notices of the Royal Astronomical Society, 485, 3947, doi: 10.1093/mnras/stz632
- McGreer et al. (2015) McGreer, I. D., Mesinger, A., & D’Odorico, V. 2015, MNRAS, 447, 499, doi: 10.1093/mnras/stu2449
- McQuinn et al. (2011) McQuinn, M., Oh, S. P., & Faucher-Giguère, C.-A. 2011, The Astrophysical Journal, 743, 82, doi: 10.1088/0004-637x/743/1/82
- Nasir & D’Aloisio (2020) Nasir, F., & D’Aloisio, A. 2020, Monthly Notices of the Royal Astronomical Society, 494, 3080–3094, doi: 10.1093/mnras/staa894
- Ocvirk et al. (2021) Ocvirk, P., Lewis, J. S. W., Gillet, N., et al. 2021, arXiv e-prints, arXiv:2105.01663. https://arxiv.org/abs/2105.01663
- Ono et al. (2011) Ono, Y., Ouchi, M., Mobasher, B., et al. 2011, The Astrophysical Journal, 744, 83, doi: 10.1088/0004-637x/744/2/83
- Park et al. (2016) Park, H., Shapiro, P. R., Choi, J.-h., et al. 2016, ApJ, 831, 86, doi: 10.3847/0004-637X/831/1/86
- Pentericci et al. (2014) Pentericci, L., Vanzella, E., Fontana, A., et al. 2014, The Astrophysical Journal, 793, 113, doi: 10.1088/0004-637x/793/2/113
- Planck Collaboration et al. (2018) Planck Collaboration, Aghanim, N., Akrami, Y., et al. 2018, arXiv e-prints, arXiv:1807.06209. https://arxiv.org/abs/1807.06209
- Prochaska et al. (2009) Prochaska, J. X., Worseck, G., & O’Meara, J. M. 2009, ApJ, 705, L113, doi: 10.1088/0004-637X/705/2/L113
- Qin et al. (2021) Qin, Y., Mesinger, A., Bosman, S. E. I., & Viel, M. 2021, Monthly Notices of the Royal Astronomical Society, 506, 2390, doi: 10.1093/mnras/stab1833
- Robertson et al. (2015) Robertson, B. E., Ellis, R. S., Furlanetto, S. R., & Dunlop, J. S. 2015, ApJ, 802, L19, doi: 10.1088/2041-8205/802/2/L19
- Schenker et al. (2012) Schenker, M. A., Stark, D. P., Ellis, R. S., et al. 2012, ApJ, 744, 179, doi: 10.1088/0004-637X/744/2/179
- Stark et al. (2017) Stark, D. P., Ellis, R. S., Charlot, S., et al. 2017, MNRAS, 464, 469, doi: 10.1093/mnras/stw2233
- Tilvi et al. (2020) Tilvi, V., Malhotra, S., Rhoads, J. E., et al. 2020, ApJ, 891, L10, doi: 10.3847/2041-8213/ab75ec
- Trac & Cen (2007) Trac, H., & Cen, R. 2007, The Astrophysical Journal, 671, 1, doi: 10.1086/522566
- Trac et al. (2015) Trac, H., Cen, R., & Mansfield, P. 2015, ApJ, 813, 54, doi: 10.1088/0004-637X/813/1/54
- Trac & Pen (2004) Trac, H., & Pen, U.-L. 2004, New A, 9, 443, doi: 10.1016/j.newast.2004.02.002
- Walther et al. (2019) Walther, M., Oñorbe, J., Hennawi, J. F., & Lukić, Z. 2019, ApJ, 872, 13, doi: 10.3847/1538-4357/aafad1
- Wang et al. (2020) Wang, F., Davies, F. B., Yang, J., et al. 2020, ApJ, 896, 23, doi: 10.3847/1538-4357/ab8c45
- Worseck et al. (2014) Worseck, G., Prochaska, J. X., O’Meara, J. M., et al. 2014, MNRAS, 445, 1745, doi: 10.1093/mnras/stu1827
- Wu et al. (2021) Wu, X., McQuinn, M., & Eisenstein, D. 2021, J. Cosmology Astropart. Phys, 2021, 042, doi: 10.1088/1475-7516/2021/02/042
- Yang et al. (2020) Yang, J., Wang, F., Fan, X., et al. 2020, ApJ, 897, L14, doi: 10.3847/2041-8213/ab9c26