A universal relation between the properties of supermassive black holes, galaxies, and dark matter halos
Abstract
We study the relations between the mass of the central black hole (BH) , the dark matter halo mass , and the stellar-to-halo mass fraction in a sample of nearby galaxies with dynamically measured and . The main improvement with respect to previous studies is that we consider both early- and late-type systems for which is determined either from globular cluster dynamics or from spatially resolved rotation curves. Independently of their structural properties, galaxies in our sample build a well defined sequence in the -- space. We find that: (i) and strongly correlate with each other and anti-correlate with ; (ii) there is a break in the slope of the - relation at of , and in the - relation at of ; (iii) at a fixed , galaxies with a larger tend to occupy lighter halos and to have later morphological types. We show that the observed trends can be reproduced by a simple equilibrium model in the CDM framework where galaxies smoothly accrete dark and baryonic matter at a cosmological rate, having their stellar and black hole build-up regulated both by the cooling of the available gas reservoir and by the negative feedback from star formation and active galactic nuclei (AGN). Feature (ii) arises as the BH population transits from a rapidly accreting phase to a more gentle and self-regulated growth, while scatter in the AGN feedback efficiency can account for feature (iii).
keywords:
galaxies:formation – galaxies:evolution – galaxies:halos – galaxies:structure – quasars: supermassive black holes1 Introduction
In a simplified theoretical framework, the build-up of galaxies can be thought as resulting from the competition between the ‘positive’ process of cooling and gravitational collapse of gas within the potential wells provided by dark matter halos (White & Rees, 1978), and a series of ‘negative’ mechanisms such as gas heating and subsequent expulsions caused by feedback from star formation (Larson, 1974; Dekel & Silk, 1986) and active galactic nuclei (AGN; Silk & Rees, 1998; Harrison, 2017). This competition between inflows and outflows or, alternatively, cooling and heating, ultimately regulates the galaxy gas reservoir out of which stars form and super-massive black holes (BHs) grow. This simple framework is at the basis of several successful theoretical models of galaxy formation and evolution (e.g. Somerville et al., 2008; Bouché et al., 2010; Lilly et al., 2013; Behroozi et al., 2019).
The picture described above suggests the existence of three ‘leading characters’ playing a major role in the evolution of a galaxy, namely its dark matter halo, its stellar component and its BH. Their masses (, and ) and growth rates are closely related to the positive and negative processes discussed: gas accretes onto halos at rates of ( being the Universal baryon fraction), stellar feedback depends on the star formation rate (or SFR) and AGN feedback depends on the BH accretion rate . Thus, in this picture, galaxies can be fully described by the co-evolution among their stellar, BH and dark matter contents, whose growths are intertwined. A direct consequence of this evolutionary scenario is that, at any redshift, , and are expected to be related to each other. A careful characterisation of the relations between these three quantities in nearby systems can give fundamental clues on the parameters that regulate galaxy evolution, and is the subject of this work.
Most studies in the literature have focused on the correlation between pairs of this leading trio. In particular, the relation between and or, equivalently, between and the galaxy global star formation efficiency , has received a lot of attention from both the observational and the theoretical communities. From the theoretical side, this so-called stellar-to-halo mass relation (SHMR; for a recent review see Wechsler & Tinker, 2018) is commonly probed via a semi-empirical technique known as abundance matching, which relates galaxies to halos by matching the observed stellar mass function to the theoretical halo mass function obtained from cosmological N-body simulations, assuming that stellar mass increases monotonically with the mass of the host halo. Different abundance matching studies (e.g. Vale & Ostriker, 2004; Behroozi et al., 2010; Moster et al., 2013; Kravtsov et al., 2018) all point towards a scenario where is maximal in galaxies with (or ) and rapidly decreases at lower and higher , which is traditionally interpreted as evidence for negative feedback from star formation in the low-mass regime and from AGN activity in the high-mass one. Observationally, the SHMR can be probed via different methods such as galaxy-galaxy weak lensing (Mandelbaum et al., 2006; Leauthaud et al., 2012), satellite or globular cluster kinematics (More et al., 2011; van den Bosch et al., 2019), internal galaxy dynamics (Cappellari et al., 2013; Read et al., 2017) or a combination of these (Dutton et al., 2010). Recent studies from Posti & Fall (2021) and Posti et al. (2019a) have found strong evidence for a difference in the SHMR of early- and late-type systems, with the former following the standard predictions from abundance matching models while the latter showing a monotonically increasing as a function of mass, with no distinctive ‘peak’ in . This discrepancy results in a substantially different associated to the two galaxy types at (that is, where most massive spirals are observed), suggesting the existence of different pathways for the stellar mass build-up in early- and late-type systems.
The existence of empirical correlations between the mass of the supermassive BH and the properties of the host galaxy bulge (like its mass and velocity dispersion ) \colorblack has been largely explored in the literature (for an in-depth review see Graham, 2016) and is now well established (e.g. Magorrian et al., 1998; Marconi & Hunt, 2003; Kormendy & Ho, 2013; Saglia et al., 2016; de Nicola et al., 2019). The - relation, in particular, \colorblack is amongst the tightest ones, with a vertical intrinsic scatter of dex, which is often interpreted as evidence for co-evolution between the BH and the host bulge resulting from AGN feedback (King, 2003; Somerville et al., 2008; King & Pounds, 2015). \colorblack Mergers can also play a role (Peng, 2007; Jahnke & Macciò, 2011), and there is evidence that the slope and normalisation of the relation between and (or ) depend on the galaxy structural parameters such as the bulge-to-total ratio and Sersic index (Graham & Scott, 2013; Scott et al., 2013; Sahu et al., 2019a, b). \colorblack Spiral galaxies also exhibit a very tight (intrinsic scatter of dex) correlation between and the spiral arm pitch angle (Seigar et al., 2008; Berrier et al., 2013; Davis et al., 2017), which is also supported by cosmological hydrodynamical simulations (Mutlu-Pakdil et al., 2018).
Surprisingly, however, the relation between and the total stellar mass of the host has been explored much less in the literature and with somewhat contradictory results, ranging from being non-existent (Kormendy & Gebhardt, 2001) to being as tight as the - relation (Läsker et al., 2014). McConnell & Ma (2013) and Davis et al. (2018) gave more moderate views on the subject, showing the existence of a positive correlation between and as expected from a co-evolution scenario (e.g. Bower et al., 2017, hereafter B17), although with a larger scatter with respect to the relations with the bulge properties.
Several theoretical models have suggested that the dynamically-dominant component of a galaxy, i.e. its dark matter, should dictate the formation of BHs (e.g. Loeb & Rasio, 1994; Haehnelt et al., 1998; Booth & Schaye, 2010, B17) as a direct consequence of the physics of gas accretion onto halos. On the observational side, \colorblack the pioneering works by Whitmore et al. (1979) and Whitmore & Kirshner (1981) highlighted the existence of a relation between the galaxy rotational velocity , traced by H i kinematics, and the central velocity dispersion of the stellar component. However, it was Ferrarese (2002) who firstly interpreted this relation as evidence for a correlation between and , since dark matter dominates the galaxy kinematics at large radii. The study of Ferrarese and later developments (e.g. Pizzella et al., 2005; Volonteri et al., 2011) were criticised by Kormendy & Bender (2011), who showed that the correlation was apparent only in galaxies hosting a classical bulge, blaming the ‘rotation curve conspiracy’ (e.g. van Albada & Sancisi, 1986) as a possible culprit for the observed trend. Sabra et al. (2015) used a sample of galaxies of different morphological types with direct (dynamical) measurements of and only found evidence for an extremely weak correlation between and the BH mass. However, the sample of Sabra et al. (2015) was later expanded by Davis et al. (2019b) and Smith et al. (2021), who concluded that a - relation for spiral galaxies exists, consistent with expectations from the joint and Tully & Fisher (1977) relations. \colorblack Similar results were derived by Robinson et al. (2021) using a sample of 24 systems with measurements from reverberation mapping. One of the limitations of these studies is that they often make use of , the line-width of the integrated velocity profile from H i or CO emission-line measurements, as a proxy for , which may lead to spurious results in cases where the rotation curve declines in the inner regions or the gas is not sufficiently extended in radius (e.g. Brook et al., 2016; Ponomareva et al., 2017).
These considerations indicate that, while several fragmented pieces of evidence for a co-evolution between stars, dark matter and BHs in galaxies exist, steps need to be taken in order to build a more coherent observational picture, preparatory for constraining our theoretical understanding of galaxy evolution. The goal of this study is to provide important steps in this direction. On the one hand, we aim to clarify the relationship between , and (or rather, we prefer to focus on instead of ) from observational data. The main improvement with respect to previous works is that, from the large pool of systems with dynamical estimates, we select a suitable sub-sample with dynamical measurements of coming, for the vast majority of objects, from either globular cluster kinematics (for galaxies of earlier Hubble types) or spatially resolved rotation curves from interferometric H i data (for galaxies of later Hubble types). Unlike studies that use H or CO data, which are limited to the inner regions of the galaxy, or H i line-width data from single-dish telescopes, which lack spatial resolution, the measurements used in this work allow to trace galaxy dynamics up to very large distances from the galaxy centres (typically ) and are better suited to model the dark and luminous matter distribution in galaxies. In addition, we embed our observational results within a more general theoretical framework, showing that the observed relations are consistent with simple evolutionary models in CDM where the stellar and BH mass built-up are regulated by the competition between positive and negative mechanisms discussed at the beginning of this Section.
This paper is organised as follows. Our sample of nearby galaxies is described in Section 2 and the resulting scaling relations are presented in Section 3. Section 4 is dedicated to the building and the application of our model of galaxy evolution. The limitations of our model and the comparison with previous works are discussed in Section 5. Finally, Section 6 presents a summary and the conclusions of this study.
2 Galaxy sample
| Galaxy | T-type | Ref. for | method | Ref. for | |||
|---|---|---|---|---|---|---|---|
| (1) | (2) | (3) | (4) | (5) | (6) | (7) | (8) |
| Milky Way | 4.0 | KH13 | GCs | Posti & Helmi (2019) | |||
| M 31 | 3.0 | KH13 | RC (H i) | Corbelli et al. (2010) | |||
| M 66 | 3.1 | S16 | RC (H) | Chemin et al. (2003) | |||
| M 81 | 2.4 | S16 | RC (H i) | de Blok et al. (2008) | |||
| Centaurus A | -2.1 | S16 | RC (H i) | vanGorkom et al. (1990) | |||
| Circinus | 3.3 | S16 | RC (H i) | Jones et al. (1999) | |||
| NGC 307 | -1.9 | S16 | Schw | Erwin et al. (2018) | |||
| NGC 821 | -4.8 | KH13 | GCs | PF21 | |||
| NGC 1023 | -2.6 | KH13 | GCs | PF21 | |||
| NGC 1068 | 3.0 | S16 | RC (H) | Emsellem et al. (2006) | |||
| NGC 1097 | 3.3 | vdB16 | RC (H i) | Ondrechen et al. (1989) | |||
| NGC 1300 | 4.0 | KH13 | RC (H i) | Lindblad et al. (1997) | |||
| NGC 1398 | 2.0 | S16 | RC (H i) | Moore & Gottesman (1995) | |||
| NGC 1399 | -4.6 | S16 | GCs | Schuberth et al. (2010) | |||
| NGC 1407 | -4.5 | S16 | GCs | PF21 | |||
| NGC 2273 | 0.9 | S16 | RC (H i) | Noordermeer et al. (2007) | |||
| NGC 2748 | 4.0 | KH13 | RC (H) | Erroz-Ferrer et al. (2015) | |||
| NGC 2787 | -1.0 | S16 | RC (H i) | Shostak (1987) | |||
| NGC 2960 | 0.8 | S16 | RC (H i) | Sun et al. (2013) | |||
| NGC 2974 | -4.3 | S16 | GCs | PF21 | |||
| NGC 3079 | 6.4 | S16 | RC (H i) | Sofue et al. (1999) | |||
| NGC 3115 | -2.9 | KH13 | GCs | PF21 | |||
| NGC 3227 | 1.5 | S16 | RC (H i) | Mundell et al. (1995) | |||
| NGC 3245 | -2.1 | S16 | RC (stars) | Zasov et al. (2012) | |||
| NGC 3377 | -4.8 | KH13 | GCs | PF21 | |||
| NGC 3607 | -3.2 | KH13 | GCs | PF21 | |||
| NGC 3608 | -4.8 | KH13 | GCs | PF21 | |||
| NGC 3706 | -3.2 | vdB16 | Schw | Gültekin et al. (2014) | |||
| NGC 3783 | 1.4 | vdB16 | RC (H i) | García-Barreto et al. (1999) | |||
| NGC 3923 | -4.8 | S16 | GCs | Norris et al. (2012) | |||
| NGC 3998 | -2.2 | S16 | Schw | Boardman et al. (2016) | |||
| NGC 4151 | 1.9 | S16 | RC (H i) | Mundell et al. (1999) | |||
| NGC 4258 | 4.0 | S16 | RC (H i) | Ponomareva et al. (2016) | |||
| NGC 4303 | 4.0 | vdB16 | RC (H i) | Sofue et al. (1999) | |||
| NGC 4374 | -4.4 | KH13 | GCs | PF21 | |||
| NGC 4388 | 2.8 | KH13 | RC (H i)a | Woods et al. (1990) | |||
| Veilleux et al. (1999) | |||||||
| NGC 4459 | -1.6 | KH13 | GCs | PF21 | |||
| NGC 4472 | -4.8 | S16 | GCs | Côté et al. (2003) | |||
| NGC 4473 | -4.7 | KH13 | GCs | PF21 | |||
| NGC 4486 | -4.3 | KH13 | GCs | PF21 | |||
| NGC 4501 | 3.3 | S16 | RC (CO) | Nehlig et al. (2016) | |||
| NGC 4526 | -1.9 | KH13 | GCs | PF21 | |||
| NGC 4564 | -4.6 | KH13 | GCs | PF21 | |||
| NGC 4594 | 1.1 | S16 | RC (H i) | Bajaja et al. (1984) | |||
| NGC 4649 | -4.6 | KH13 | GCs | PF21 | |||
| NGC 4697 | -4.5 | KH13 | GCs | PF21 | |||
| NGC 4736 | 2.3 | S16 | RC (H i) | Speights et al. (2019) | |||
| NGC 4762 | -1.8 | Krajnović et al. (2018) | RC (stars) | Fisher (1997) | |||
| NGC 4826 | 2.2 | S16 | RC (H i) | Braun et al. (1994) | |||
| NGC 4945 | 6.1 | KH13 | RC (H i) | Sofue et al. (1999) | |||
| NGC 5328 | -4.7 | S16 | X-ray | Trinchieri et al. (2012) | |||
| NGC 5846 | -4.8 | S16 | GCs | PF21 | |||
| NGC 7052 | -4.9 | S16 | X-ray | Memola et al. (2011) | |||
| NGC 7457 | -2.7 | KH13 | GCs | PF21 | |||
| NGC 7619 | -4.8 | S16 | Schw | Pu et al. (2010) |
black Notes. (1) Galaxy name; (2) morphological T-type from the HyperLEDA database; (3)-(5) black hole mass, stellar mass and star formation efficiency; (6) references for BH measurements: KH13-Kormendy & Ho (2013), S16-Saglia et al. (2016), vdB16-van den Bosch (2016); (7) method used for measurements: GCs-globular cluster dynamics, RC-rotation curve (using as described in the text), Schw-Schwarzschild model, X-ray- modelling of the X-ray-emitting circumgalactic gas; (8) references for measurements. a comes from the mean of the two quoted studies.
While several works have focused on the determination of galaxy BH, halo and stellar masses separately, we are not aware of a comprehensive study where these three quantities have been derived simultaneously in a homogeneous, self-consistent fashion. The main reasons for this are the very different physical scales associated to these masses, whose measurements requires very diverse data sets. Therefore, the galaxy sample used in this work is derived from a combination of different datasets, using a variety of approaches. We show that, in spite of such diversity, a coherent picture emerges. All halo masses presented in this study are computed within the radius where the mean halo density becomes equal to 200 times the critical density of the Universe, that is, .
The first sample that we consider is that of Posti & Fall (2021, hereafter PF21), who used measurements of globular cluster radial velocities from the SLUGGS Survey (Brodie et al., 2014; Forbes et al., 2017) to perform a dynamical mass modelling of nearby early-type galaxies. The and estimates of PF21 rely on the modelling of the phase-space distribution of globular clusters using a gravitational potential given by the sum of two spherical components, namely a Navarro-Frenk-White (NFW; Navarro et al., 1996) dark matter halo and a stellar bulge described by a Sersic (1968) profile. The SLUGGS data provide astrometric and spectroscopic measurements for several tens of clusters per object at distances up to times the galaxy effective radii, effectively probing the large-scale galactic dynamics. images from Spitzer Space Telescope are used to constrain the distribution of the stellar components whose mass-to-light ratio is a free parameter of the model, along with the halo mass and concentration. We used the and provided by PF21 for a subsample of of their systems that also have dynamical measurements of collected by Kormendy & Ho (2013) and Saglia et al. (2016). These are all based on stellar dynamics, with the exceptions of NGC 4526 (CO dynamics), NGC 4374 and NGC 4459 (ionised gas dynamics).
Next, we considered the sample of Terrazas et al. (2017), who have combined the data previously collected by Saglia et al. (2016) and van den Bosch (2016) to build a dataset of galaxies spanning different morphological types and with robust estimates for their from stellar, gas or maser dynamics. Stellar masses in Terrazas et al. (2017) are derived from extinction-corrected Ks-band photometry from 2MASS (Huchra et al., 2012). To determine the of these objects, we have searched the literature for spatially resolved observations of large-scale kinematic tracers, preferably H i emission-line data but also H or CO data. In cases where we judged the velocity field of such tracer to be regular enough so that a rotation curve could be determined reliably, we used , the rotational speed in the flat part of the rotation curve, as a proxy for . The details of the -to- calibration are presented in Appendix A. When gas kinematics was not available, which is typically the case in earlier galaxy types, we used dynamical estimates based preferably on globular cluster radial velocities or, in the absence of these measurements, on modelling of the X-ray emitting halo gas, or on Schwarzschild models for the stellar component. Following this approach, we included a total of 30 galaxies from the Terrazas et al. (2017) sample. Finally, we complemented our dataset with three additional objects from the recent sample of de Nicola et al. (2019), and four spiral galaxies from Kormendy & Ho (2013), following the same procedure described above to estimate the halo masses.
The main properties of the resulting sample of galaxies are listed in Table 1, along with the references related to the and measurements. The vast majority of galaxies in our sample have determined with the rotation curve method (27, of which 21 from H i data, three from H, one from CO and two from stellar kinematics) or from globular cluster dynamics (22). Schwarzschild models and the X-ray method are used only for four and two objects, respectively. We stress that the measurements used in this work have not been derived from observations alone, since none of the data extend to the halo virial radii. Instead, they are based on theoretical constraints on the properties of DM halos in CDM cosmological models, and in particular on the correlation between halo mass and concentration of Dutton & Macciò (2014) which our rotation curve method and the measurements of PF21 rely on. Aside from the early types from PF21, where is determined dynamically, we have homogenised the stellar mass measurements in our sample using a common ratio of (McGaugh & Schombert, 2014). Other choices for are possible, but have little impact on our results.
As most galaxies have determined either from rotation curves or from globular cluster dynamics, it would be important to quantify how these two methods compare to each other. This is not trivial, given that globular clusters are more abundant in early type galaxies where cold gas is typically scarce. In our sample, NGC 2974 is the only galaxy for which both measurements are available: using our eq. (2) with (from the H i study of Kim et al., 1988) gives , which perfectly agrees with the value found by PF21 and reported in Table 1, . This result, even if it is obtained for a single object, is reassuring and preparatory for the rest of the analysis.
3 Observed scaling relations
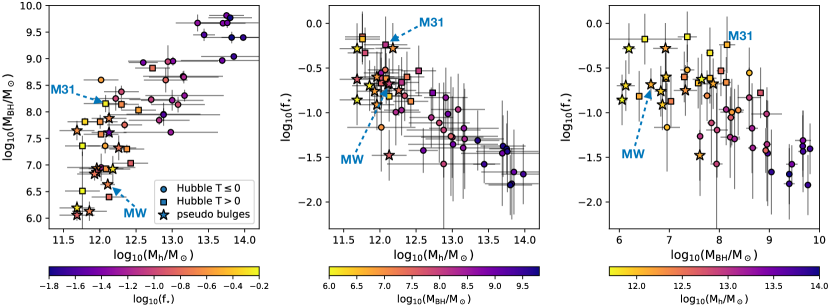
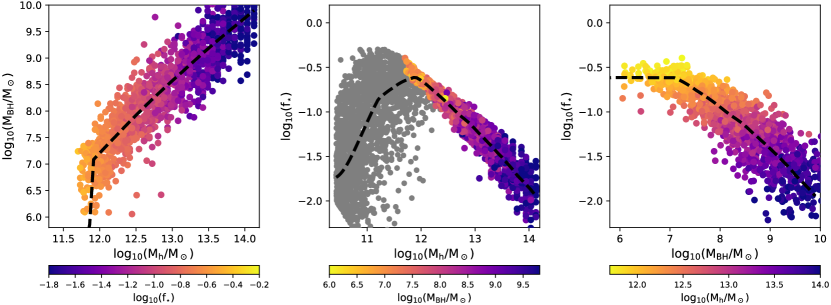
We now focus on the relations between , , and for the systems in our sample. In Fig. 1 we show the distribution of our galaxies in the (,) space (left panel), in the (,) space (central panel) and in the (,) space (right panel). It is evident that, in the mass range considered, each quantity appears to be related to the others. On average, the star formation efficiency decreases with increasing halo or BH masses, while and are positively correlated with each other.
The correlation between and does not come as a surprise, as it was firstly discovered by Ferrarese (2002). While we discuss this relation further in Section 5.1, we highlight here a couple of interesting features. First, the trend shown by the data at high seems to break down around of a few (or of ), steepening below this threshold mass. This feature may be simply produced by an increase in the scatter of the relation in the low regime, possibly coupled with low-number statistics, but we will later show that a break in the - relation arises ‘naturally’ in our galaxy evolution model as resulting from a change in the mode by which BHs accrete their gas. Second, the observed correlation is surprisingly tight. In Section 3.2 we show that, in our sample, the strength of the correlation between and and its intrinsic scatter are comparable to those of a very well studied scaling law, the - relation.
The relation between and , shown in the central panel of Fig. 1, is also not surprising. Galaxies are well known to follow a stellar-to-halo mass relation (SHMR, e.g. Moster et al., 2013; Behroozi et al., 2013) according to which peaks at the value of for halo masses of and decreases rapidly at lower and higher , possibly because star formation is made inefficient by stellar and AGN feedback, respectively. As the minimum in our data is close to this peak value, we only sample the high-mass, descending portion of the SHMR. Interestingly, some low- galaxies in our sample have compatible with , meaning that they have been able to convert all their (theoretically) available baryons into stars. The same result was found by Posti et al. (2019a) for a sample of high-mass spirals from the SPARC dataset (Lelli et al., 2016).
The rightmost panel of Fig. 1 shows the anti-correlation between and . As noticed for the - relation, also here the trend seems to change around : galaxies hosting lower-mass BHs have approximately constant , while at larger the star formation efficiency gets progressively reduced. As discussed before, the low-mass trend could also be due to an increase in the scatter, although here the break appears more evident. As this relation is less tight than that between and , one may conclude that mass, and not BH feedback, is the main quenching driver in high-mass galaxies (e.g. Bundy et al., 2008; Peng et al., 2010b; Geha et al., 2012; Dubois et al., 2013). The results from our modelling (Section 4), however, suggest that this is not the case.
In Fig. 1 we have used different markers for galaxies of different morphology: circles show earlier galaxy types (), squares show later galaxy types (), while star markers highlight the spirals hosting pseudo-bulges as listed by Kormendy & Ho (2013). \colorblack While early-type systems populate preferentially the high regime and late-types appear only at lower , the galaxy population as a whole seems to distribute along a well defined sequence in the -- space. Discs hosting pseudo-bulges are no exception, as they do not occupy a preferential position in any of the three relations presented. \colorblack We stress that the overlap between different galaxy types in the - plane (central panel of Fig. 1) is not in tension with the results of PF21, who found distinct SHMR for early and late type systems: the split between morphological types becomes evident only in the - space (not shown here), due to the fact that the most massive early and late-type galaxies, albeit having halo masses that differ by more than an order of magnitude, show only a factor difference in (see Fig. 3 in PF21, ).
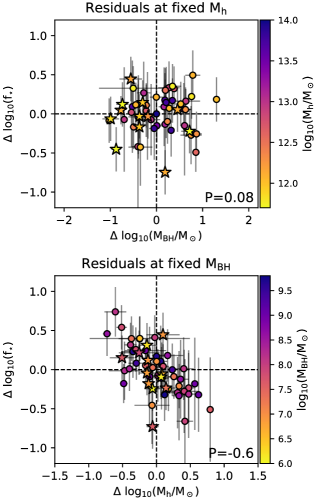
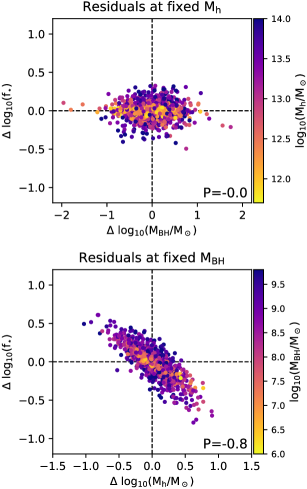
The color-coding used in Fig. 1 is useful to highlight another interesting feature of our data. The first and the third panel of Fig. 1 suggest that, at fixed , systems that have been more (less) efficient at forming stars are those that live in lower (higher) mass halos. Conversely, no significant trend can be seen at fixed (first and second panel). The features discussed can be better appreciated in Fig. 2. Here, we have determined empirically the mean trends of and as a function of , and plotted the residuals with respect to these trends against each other in the top panel of Fig. 2. The clear lack of an anti-correlation between these residuals is surprising, as one might expect that galaxies hosting larger BHs are also those where AGN feedback, and therefore star formation quenching, is more effective. In contrast, there is instead weak evidence for a positive correlation (Pearson coefficient of ). Similarly, the residuals with respect to the mean - and - relations are compared in the bottom panel of Fig. 2. The anti-correlation between and at fixed BH mass becomes now very evident (Pearson coefficient of ). In Section 4.2 we show that uncorrelated scatter in the parameters of our evolution model can explain the trends shown in Fig. 2 remarkably well. In particular, system-to-system variability in BH feedback efficiency is a viable explanation for the observed anti-correlation between and at fixed .
3.1 The 3D -- relation
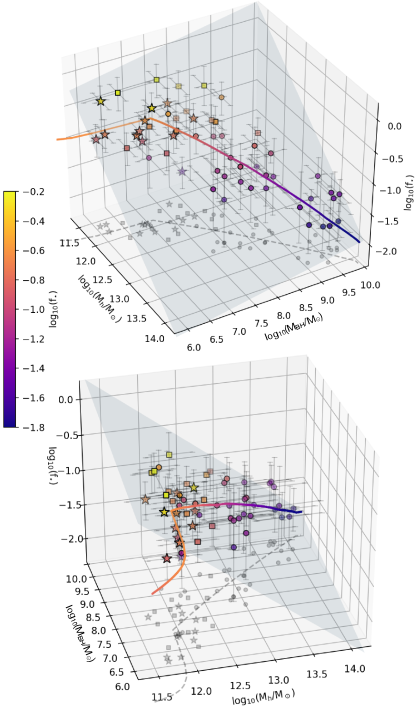
We now analyse the distribution of our galaxy sample in the 3D (,,) space. The eingenvalues of the covariance matrix associated to our data are approximately in a 26:3:1 ratio. The presence of a substantially larger eigenvalue indicates that there is a clear tendency for the data to distribute along a unique direction in the 3D space, given by the associated eigenvector. This is a simple geometrical confirmation of the fact that , and are all related to each other, as previously discussed. It also suggests that, in the mass range studied here, measuring either , or in a galaxy suffices to determine the other two quantities, with good approximation.
The 3:1 ratio of the two lower eigenvalues indicate that a (marginally) more refined representation for our data is given by a plane in the 3D space considered. We used the LtsFit Python package from Cappellari et al. (2013) to fit our data with the following parametric form:
| (1) |
The code uses a least-squares fitting algorithm which allows for intrinsic scatter and errors in all coordinates. The best-fit solution is found for , , , and is consistent with no intrinsic scatter. The parameters found are indicative of the same trends discussed above, i.e., depends strongly on at a fixed , but very weakly (or not at all) on at a fixed . The best-fit parameters of eq. (1) remain within the quoted uncertainties if we fit only the data with (that is, we exclude the data points below the break).
Figure 3 offers two representative 3D views of the data, along with the best-fit plane and the theoretical model that we build in Section 4. The 3D views clearly highlight how the data distribute preferentially along a one-dimensional sequence, although a plane can capture the distribution of their scatter. We stress, though, that the plane described by eq. (1) is valid exclusively in the range of masses spanned by the data, and in particular it will not hold at , a regime where is known to decrease, rather than increase as eq. (1) would suggest.
3.2 Relating to the properties of the stellar component
The importance of characterising the relations between and other observable galaxy properties is twofold. On the one hand, these relations provide fundamental clues to constrain the physics of BH growth and to clarify the role of AGN feedback in galaxy evolution. On the other hand, the existence of tight scaling relations offer convenient ways to determine the BH masses using more easily observable quantities as proxies. While the primary focus of this study is the relation between and global galaxy properties such as and , in this Section we briefly discuss how BH masses relate to some of the properties of the stellar component in our galaxy sample.
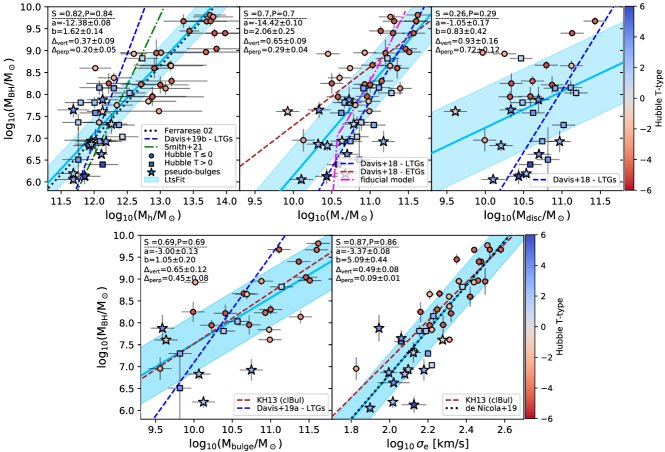
Fig. 4 shows the relations between and four different stellar properties: the total stellar mass , the stellar disc mass , the stellar bulge mass , and the mean stellar velocity dispersion within the effective radius . The relation, already discussed in Section 3, is also shown as a reference. The measurements adopted here are from de Nicola et al. (2019) and Kormendy & Ho (2013), while bulge fractions are mostly based on the 2D-decompositions of images from the the Spitzer Survey of Stellar Structure in Galaxies (Sheth et al., 2010) via the Galfit package (Peng et al., 2002, 2010a) or, when these were not available, on the kinematic decomposition reported in Fall & Romanowsky (2018). Each panel in Fig. 4 reports the Spearman (S) and Pearson (P) correlation coefficients of the quantity pair analysed, and the best-fit parameters of linear (in log-space) regression determined with LtsFit, including the intrinsic scatter in the vertical and perpendicular directions, and . Galaxies in Fig. 4 are colour coded by their Hubble morphological T-type, taken from the HyperLEDA database. Fig. 4 also shows a representative selection of the best-fit relations previously determined in the literature, which will be discussed in more detail in Section 5.1.
The correlation coefficients that we find confirm the widely accepted scenario according to which i) the stellar property that best correlates with is ; ii) bulges correlates with much better than discs. However, in our sample, the strength of the correlation between and (correlation coefficients of ) is comparable to that between and (). We also find a lower in the relation than in the relation, although this is probably due to the large uncertainties associated with our estimates. All considered, our results indicate that both and seems to provide a similar accuracy when used as proxies for the BH mass, which is quite remarkable given the completely different scales involved. We stress, though, that the perpendicular intrinsic scatter of the - is about half that of the -, indicating that the former is more ‘fundamental’ than the latter. \colorblack The relation between and (not presented here) shows a trend similar to that between and , with a hint of a break visible around of -. \colorblack As discussed by PF21, a correlation between these two quantities is expected as resulting from the combination of the SHMR, which links to , and the Faber & Jackson (1976) and Tully & Fisher (1977) relations, which relate to a characteristic velocity of the stellar component (that is, for early galaxy types).
Another interesting feature shown by the data is that the relation shows similar strength and intrinsic scatter as the relation. \colorblack This means that, in our sample, the bulge mass and the total stellar mass are equally-good proxies for , which is a puzzling result considering the poor correlation between and . The top-right panel of Fig. 4 may give a clue to the solution of this puzzle, indicating that earlier and later galaxy types follow somewhat parallel sequences in the MBH-Mdisc plane. This results in an overall poor correlation between BH and disc masses, but when bulges are included in the total budget the sequence of early types approaches the other one, increasing the overall correlation strength. A similar result was also found by Davis et al. (2018), who stressed the importance of distinguishing between early- and late- galaxy types in the study of the (see also Section 5.1). \colorblack We note, however, that relative to a unbiased, volume-limited sample, massive discs are over-represented (shallower mass function) in our sample while massive spheroids are under-represented (steeper mass function). This limitation, together with the fact that bulge/disc fraction measurements are available only for (39/55) of it, restrain us from investigating these features further in this work.
Finally, we stress that the correlation coefficients and best-fit parameters determined in this Section do not vary significantly when galaxies hosting pseudo-bulges are removed from the analysis. The main difference is visible in the relation, whose slope decreases when these low-mass systems are removed. However, this would be readily explained if the intrinsic shape of the relation was not a simple power-law, but its slope increases at lower masses as we suggest in the Section below. \colorblack Similarly, moderate () variations in the mass-to-light ratios of discs and bulges have little impact on the results presented in this Section.
4 A simple galaxy evolution model
In this Section we investigate the physical origin of the trends presented in Section 3 using a simple equilibrium model for galaxy evolution in the CDM framework111We assume a Planck Collaboration et al. (2013) cosmology (, ), in particular .. Our model is largely inspired by the work of B17 and is based on a commonly accepted framework where galaxy halos smoothly accrete dark matter and gas at a cosmological rate, having their stellar and black hole build-up regulated both by the cooling of the available gas reservoir and by stellar/AGN feedback. We provide a full description of our model in Appendix B, while below we give a brief overview - sufficiently detailed to follow the rest of this study - of its main ingredients.
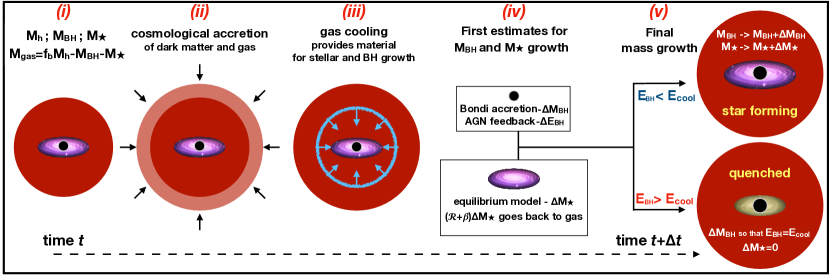
The model follows the evolution of BH, stellar and dark matter masses of a galaxy given some initial conditions, namely the initial ‘seed’ masses and , and the seeding cosmological time . At each time-step, the mass growths of the various components are determined via the sequence of physical processes illustrated in Fig. 5. These include standard recipes for cosmological accretion of dark matter and gas onto halos, gas radiative cooling, star formation, BH accretion, and simplified treatments for stellar and AGN feedback. The galactic gas reservoir, intended as the sum of interstellar and circumgalactic media (ISM and CGM), is described as a single component following an equation of state with (as in B17, ), with a temperature equal to the halo virial temperature, a mass given by222Hence the total mass of baryons within the halo is always equal to , which implies that the gas accreted onto the halo never leaves the system , and a pristine metallicity (chemical enrichment is not treated in our model, but a case with a higher metallicity is discussed in Section 4.2). At each time-step, the gas cooling rate is balanced by the rates at which stars form, the BH grows and gas is returned to the initial reservoir because of stellar mass losses and feedback (‘equilibrium’ model). In our implementation, feedback from star formation has two effects: it drives galaxy-scale outflows which instantly return gas to the initial reservoir, with a mass-loading equal to ( and being free parameters), and it acts as a regulator of the gas density close to the BH, significantly reducing its accretion rate for large (e.g. Hopkins et al., 2021). AGN feedback is treated as a continuous accumulation of energy deposited by the BH onto the gas reservoir at a rate , being the BH feedback efficiency, another free parameter. The total energy released by the BH, , must not exceed the gravitational binding energy of the cooling gas, : at time-steps when this occurs, the BH accretion rate is reduced so that the condition above is satisfied, and star formation is manually turned off. This form of ‘preventative’ AGN feedback is the only quenching channel that we provide in our galaxy evolution framework. The main parameters regulating our model are summarised in Table 2, while the caption of Fig. 5 points to the relevant equations defined in Appendix B.
We stress that the final goal of this modelling exercise is to offer a simple but cosmologically motivated interpretation for the observed scaling relations between BH, stellar and halo masses presented in Fig. 1 and 3. While we acknowledge that correlates more strongly with than with (Section 3.2), here we do not offer separate treatments for the growth via smooth accretion or via episodic mergers and treat the galaxy stellar component as a whole. This simplifies our approach significantly, bypassing the need for prescriptions regulating the formation of bulges which would introduce additional complexity to the model. Clearly, the use of such simplification implies that we will not get physical insights on the co-evolution between bulges and BHs. For instance, we cannot distinguish a scenario where the - relation results from the physics of stellar and AGN feedback, which separately produce and scalings (Power et al., 2011; King & Nealon, 2021), from a scenario where the - arises statistically from the hierarchical merging of galaxies with initially uncorrelated and (Peng, 2007; Jahnke & Macciò, 2011). We leave the answer to this topic to more dedicated theoretical studies, though our simple model still provides useful insights once compared to the presented correlations between and global galaxy properties.
4.1 A fiducial model
| Parameter | description | value | status |
| earliest seed injection time | () | fixed | |
| latest seed injection time | () | fixed | |
| seed halo mass | fixed | ||
| seed stellar mass | fixed | ||
| gas metallicity | pristine | fixed | |
| recycled gas fraction due to stellar mass losses | fixed | ||
| seed black hole mass | free | ||
| normalisation of the gas density near the BH, eq. (10) | free | ||
| BH feedback efficiency, eq. (11) | free | ||
| present-day critical halo mass, eq. (7) | free | ||
| slope of the mass-loading due to stellar feedback, eq. (6) | free |
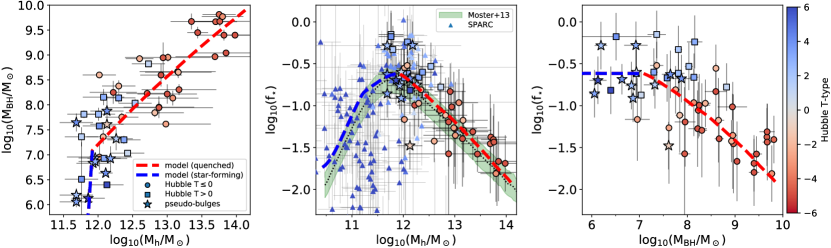
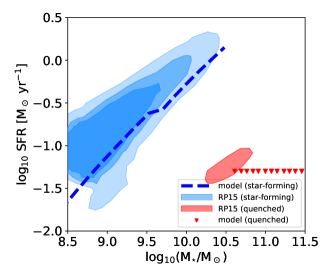
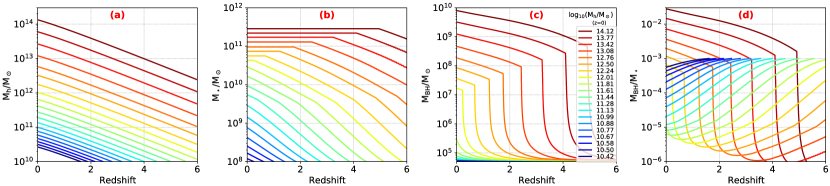
Table 2 shows a summary of the main parameters of our equilibrium model. By experimenting with different parameter values, we have found a ‘fiducial’ set which produces a model in excellent agreement with our data at . The fiducial parameter set is reported in the bottom portion of Table 2 and the comparison with the data is presented in Figure 6. Clearly, our model predicts a -- relation (dashed lines in Fig. 6) which passes right through the data. In particular, the model predicts a break in the relations at which is visible in our data as well, as discussed in Section 3. In the central panel of Fig. 6 we also show the SHMR determined by Moster et al. (2013) from abundance matching prediction (green-shaded region), and the dynamical measurements of Posti et al. (2019a) for the spirals from the SPARC dataset (Lelli et al., 2016), which allows us to extend the dynamical range of the - plot down to lower masses. However, measurements for in the SPARC sample are not available. Our model performs very well along the entire mass range. Interestingly, the measurements from SPARC indicate that the scatter in the SHMR increases at lower , a point which we will return to in Section 4.2. A 3D view of the fiducial model was already offered in Fig. 3.
While our model seems to correctly predict the relations between stellar, halo and BH masses, which are quantities integrated over cosmic time, one may question its performance when it comes to more ‘instantaneous’ properties, like the star formation rates of present-day galaxies. In our model, the SFR of a system is abruptly shut down when the BH energy output becomes equal to the binding energy of gas within the halo cooling radius. We show below that this happens earlier in more massive halos, while in less massive galaxies this may only occur at . This produces a segregation between low-mass systems that are normally star forming at , and high-mass galaxies that are quenched. Figure 7 shows the relation between the SFR, averaged over the latest of evolution, and the stellar mass of systems in our fiducial model, and compares it with the approximate observed distribution from SDSS measurements by Renzini & Peng (2015). Our model correctly reproduces the slope () of the main sequence of star formation (e.g. Noeske et al., 2007; Popesso et al., 2019), albeit with a slightly lower normalisation (by dex), as well as the approximate at which quenched galaxies begin to dominate the SFR- distribution (that is, around ). Clearly, the transition between these two regimes is supposed to be gradual, whereas in our simplified treatment of BH feedback it is abrupt. We discuss this further in Section 5. Going back to Fig. 6, we have used blue and red dashed-lines to show the star-forming and quenched galaxy populations, respectively. In our fiducial model, at the transition occurs at , so that most of the systems studied in this work are supposed to be quenched. While this may not be the case for individual galaxies, our results hold for the galaxy population as a whole.
Further insights on the evolutionary scenarios predicted by our fiducial model are provided by Figure 8, where we show the dark matter, stellar and BH mass build-up as a function of for systems of different present-day . By construction, the halo growth (panel a in Fig. 8) proceeds undisturbed at all and for all systems. The BH growth (panel c), instead, is more interesting. At high the BH accretion proceeds slowly, both because seeds are still small and because supernova-driven outflows are very efficient at lowering the central gas density. As stellar feedback becomes less efficient, this early phase is then followed by a very rapid growth, which ends abruptly only when . Then, the accretion proceeds at a more gradual pace in a self-regulating mode driven by the continuous balance between and . This balance defines univocally the slope of the - relation for , whose excellent agreement with the data is one of the main success of our simple theoretical model. The at which the transition to the self-regulating accretion mode occurs is a function of the galaxy mass: high-mass systems enter the self-regulating phase earlier, whereas galaxies with (corresponding to ) are still in the rapidly accreting mode. This agrees well with the picture of anti-hierarchical growth of BHs emerging from the study of AGN luminosity functions (e.g. Fig. 8 in Marconi et al., 2004), and produces the break in the scaling relations visible around BH masses of (see Fig. 1). Also, this transition between the rapidly accreting phase and the self-regulating phase signals the end of the stellar mass build up (panel b). As the transition occurs earlier in more massive halos, the redshift at which quenching occurs increases for increasing , which is again in agreement with the picture of anti-hierarchical growth of galaxies (or ‘downsizing’, e.g. Cowie et al., 1996; Eyles et al., 2005; Fontanot et al., 2009). However, in our model the BHs of quenched galaxies still accrete gas because and keep growing with time, requiring increasingly higher for the balancing. Thus the BH-to-stellar mass ratio increases with time in most massive halos (panel d), which seems to be at odds with predictions from other theoretical models (e.g. Lamastra et al., 2010) and with observational data (e.g. Merloni et al., 2010), although observational bias at high- may play an important role (Lauer et al., 2007). We discuss further the limitations of our modelling approach in Section 5.3.
The reader may have noticed that we have avoided any statistical approach to optimise the model parameters to the observed data. In fact, the fiducial values reported in Table 2 are only indicative, and we do not exclude that a better match could be obtained by tuning the parameters further or even using very different parameter values. The spirit of our approach is to offer a proof of concept that a simple equilibrium model in CDM framework is well suited for describing many of the observed trends, rather than offering precise estimates for some parameter values.
4.2 Interpreting the observed scatter
One of the most interesting features of our data lies in their scatter, and in particular in the correlations between the residuals shown in Fig. 2. In this Section we explore the possibility that such correlations arise ‘naturally’ in our model because of random fluctuations in the model parameters.
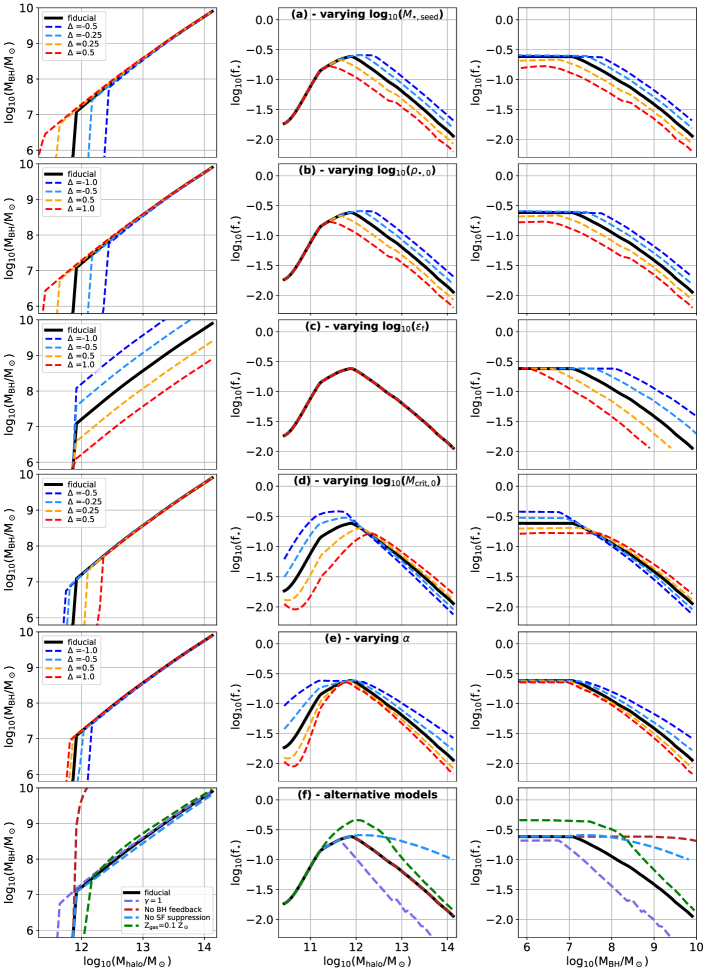
As a first step, it is instructive to assess how the -- relation predicted at responds to variations in the single model parameters. This is shown in Figure 9, where we compare our fiducial model with a series of other realisations obtained by varying one by one the various parameters while keeping the others fixed to their fiducial values. This exercise reveals a number of interesting features. First, the high-mass slope of the - relation remains the same in all our experiments, indicating that it is a strong prediction of the self-regulated accretion mechanism described above. Its normalisation instead depends entirely on (panel c in Fig. 9): as expected, higher BH masses are reached for lower feedback efficiencies, and vice versa. Surprisingly, has no impact on the SHMR. As we discuss in Section 5.3, this is due to the primary role of BH in processing the gas accreted from the halo and can be seen as a consequence of our oversimplified treatment of star formation processes. In practice, regulates the fraction of that feeds the BH in the self-regulating phase, but (by construction) the fraction that does not accrete onto the BH does not form stars either, leaving no impact on the SHMR. The role of and is to set the BH accretion rate via eq. (8) during the phase that precedes the self-regulating mode, effectively shortening or extending the self-regulating sequence in the plane and affecting the post-peak part of the SHMR (panels a and b). We note that and are completely degenerate in the mass range considered, which is another reason for considering the values quoted in Table 2 as indicative only. Finally, the parameters regulating the stellar feedback efficiency, and , play a major role in setting the slope of the SHMR at all masses and its normalisation at low masses, respectively (panels e and d). Thus, in our models, stellar feedback participates in regulating the star formation efficiency at all masses (via ), and not only in the low- regime.
The panel-set f in Fig. 9 shows the effect of altering some of the main assumptions of the model, and deserves a more in-depth discussion. The coefficient of the equation of state for the gas accreting onto the BH has an influence on the slope of the SHMR in the high-mass regime: using in eq. (9) (isothermal gas) leads to a steeper slope (purple-dashed curves) that is not compatible with the data and that cannot be easily changed by varying the other parameters of the model. Removing completely the BH feedback from our fiducial model (that is, assuming ) leads to overmassive BHs in all galaxies, as shown by the red-dashed curves in the panels. Allowing the BH growth to self-regulate without suppressing also the star formation in systems with leads to a much flatter high-mass slope for the SHMR (blue-dashed curves), which means that star formation quenching driven by BH feedback is an important ingredient in our model. Finally, the green-dashed curves show the effect of increasing the gas metallicity from pristine to . This promotes gas cooling and effectively enhances the star formation efficiency, increasing the maximum achievable without changing the peak mass. This would give a better agreement the high- values measured for the most massive spirals of the SPARC sample (Posti et al., 2019a), and for some of the systems in our sample as well. While modelling the metallicity evolution of the galactic gas reservoir goes beyond the purpose of the present study, we stress that the peak reached by our fiducial model may well be underestimated given the pristine composition assumed for the gas accreted at all redshift.
The above experiments offer an interpretation of the scatter seen in the data. From panel-set c in Fig. 9, it is clear that a scatter in produces an anti-correlation between and at a fixed . This happens because, as scatters from lower to higher values, galaxies hosting BH of similar mass occupy more massive halos (that is, generated from earlier seeds), which necessarily correspond to lower values of as the SHMR is not sensitive to . Fluctuations in , instead, offer a way to obtain both a positive correlation between and at a fixed (but only in the low- regime), and a higher scatter in the low- part of the SHMR.
These considerations can be better visualised in Fig. 10, which shows a stochastic realisation of our fiducial model obtained by introducing Gaussian fluctuations, with standard deviation of , in , and . The color-coding follows that of Fig. 1 and helps one recognise, within the model, the same features seen in the data and discussed in Section 3. By fitting eq. (1) to this synthetic dataset, after excluding systems with or (grey circles in Fig. 1) which do not have a counterpart in the observed sample, we find , and . These value are in excellent agreement with those found for our observed dataset in Section 3.1. In Fig. 11 we show the relations between the residuals calculated at fixed and in our scattered model, computed following the same procedure used for the data in Fig. 2. The comparison between Fig. 2 and Fig. 10 shows remarkable similarities between the data and the model (similar Pearson coefficients). Including also fluctuations in and does not alter the trends seen in the residual, although the agreement with the data worsens. Although qualitative, these considerations indicate that a simple, uncorrelated scatter in the model parameters may well explain the features observed the data residuals.
Once again, the experiments presented in this section must be considered as a proof of concept that the data can be well reproduced by models like the one presented in this work. The physical origin for the scatter in the model parameters is a matter of great relevance, but its investigation goes beyond the purpose of this study.
5 Discussion
5.1 Comparison with other works
The positive, tight correlation between and was first noticed by Ferrarese (2002) as a consequence of the correlation between rotational velocity and central velocity dispersion in galaxies (originally discovered by Whitmore et al., 1979), the former being a proxy for and the latter for . \colorblack Later on, Bandara et al. (2009) provided a more direct evidence for a correlation between and the total dynamical mass of the galaxy by focusing on a sample of early type systems for which were determined via gravitational lensing models. A similar - relation was derived by Krumpe et al. (2015) by studying the X-ray luminosity dependence on the clustering strength of low- AGNs. Interestingly, the original relation determined by Ferrarese (2002), shown as a black dotted line in the top-left panel of Fig. 4, is in a remarkably good agreement with our data, in spite of the different methods used to determine BH masses and the different calibration adopted, \colorblack and with the results of Bandara et al. (2009) and Krumpe et al. (2015).
The findings of Ferrarese (2002) were very surprising as they indicated that dark matter alone could engineer the BH growth without passing through the complex baryonic physics associated with BH accretion. Kormendy & Bender (2011) and later Kormendy & Ho (2013) have argued against such conclusion, pointing out that the relation holds only for classical bulges and is not followed by spirals hosting pseudo-bulges or by bulgeless discs, which would suggest that that it comes as a byproduct of the co-evolution between spheroids - arguably formed by mergers and therefore strictly related to the accretion history of halos - and BHs. In our study we have shown that all galaxies participate in the same relation (left panel in Fig. 1). This seems to be the case also for the 12 spirals that host pseudo-bulges, although our statistics are heavily affected by the limited mass range where these are present within our sample (). The relation, however, appears to change slope at of a few (or of ), which suggests an origin from different competing mechanisms. In the theoretical framework of Section 4, these competing mechanisms are the stellar feedback at low and the AGN feedback at high . At , feedback from stars regulate the density of cold gas near the BH, and since in our model the stellar feedback efficiency depends on via eq. (6), a relation follows. At higher , the BH regulates its own growth as its accretion rate is limited by the balance between the AGN feedback energy and the cold gas gravitational binding energy. Since the gas cooling rates and the binding energy both depend on , another relation follows, albeit with a different slope. Ultimately, a relation between , and must be expected in any galaxy evolution framework where the material used for the stellar and BH build-up is provided by the cooling of the halo gas reservoir.
de Nicola et al. (2019) used a sample of 83 galaxies with different morphologies and high-quality measurements to investigate the correlations between and the host galaxy properties. Not surprisingly, our data are in perfect agreement with the best-fit relation of de Nicola et al. (2019) (dotted black line in the bottom-right panel of Fig. 4) as the majority of our measurements come from their study. More noticeably, they also agree well with the relation reported by Kormendy & Ho (2013) for classical bulges (red-dashed line in the same panel), especially in the high-mass regime. Interestingly, galaxies with show a characteristic deviation from the best-fit line that closely mimics that observed in the plane. This is only partially visible in our Fig. 4, but is much more evident in the larger sample of de Nicola et al. (2019, see the top panel of their Fig.2). This points towards the existence of a tight correlation between and .
Davis et al. (2019b) studied a sample of spiral galaxies with dynamical measurements of , using the line-width of the integrated velocity profile (from H i or H data) as a proxy for , which is then converted to using the calibration from Katz et al. (2019a). A similar study was more recently done by Smith et al. (2021) using both spatially resolved and unresolved CO observations, and including early-type systems too. The relations resulting from these two studies are shown in the top-left panel333Here we used the -to- calibration from eq. (2) and, for the results of Smith et al. (2021), assumed , being the galaxy inclination of Fig. 4, and are consistent with our data only in the low-mass regime. However, there are differences between our study and those of Davis et al. (2019b) and Smith et al. (2021) in terms of both methods and goals. As for methods, we have used a more complete galaxy sample spanning different morphological types, and relied on separate techniques to determine depending on the galaxy morphology: spatially resolved rotation curves in late-types, which we carefully selected from the literature, and globular cluster dynamics in early-types, mostly coming from the work of PF21. This allowed us to see features in the data, namely the break in the relation, that were not apparent in the samples of other studies. As for goals, rather than focusing on characterising the relation in order to use one quantity as a proxy for the other, we made the attempt to encapsulate our results in a theoretical framework, with the purpose of understanding the physical origin for the observed trends.
In a series of recent works, Davis et al. (2018, 2019a, 2019b) have focused on characterising the scaling relations between and the host galaxy properties in late-type systems, which until then had received little attention in the literature. The scaling relations resulting from their studies, shown as blue-dashed lines in the various panels of Fig. 4, are in good agreement with our data when only late-type (Hubble ) galaxies are considered, but are in tension with the full sample which includes many early-type objects. This discrepancy is particularly severe in the plane (bottom-left panel of Fig. 4), where our data indicate a much shallower slope, virtually identical to that found by Kormendy & Ho (2013) for classical bulges (red-dashed line in the same panel), with respect to the scaling found by Davis et al. (2019a). Davis et al. (2018) compared their relation determined in 40 spirals with that derived using 21 early-type galaxies from the sample of Savorgnan et al. (2016), finding significant differences in the slope and normalisation. The two relations reported by Davis et al. (2018) are shown in the top-middle panel of Fig. 4, and indeed appear to better describe separately the two galaxy types. Our fiducial model, shown as a magenta dot-dashed line in the same panel, is ignorant of galaxy morphology and predicts a unique relation that passes mostly in between the two sequences of Davis et al. (2018).
Our theoretical model is largely inspired by the work of B17, who however focused almost entirely on how BH growth in halos is related to the development of the ‘red’ and ‘blue’ galaxy sequences in the present-day Universe. B17 clearly showed the peculiar shape of the relation, which we found to be in excellent agreement with the data, and suggested the use of equilibrium models as possible improvements for their approach. We have followed their suggestion here so that can be predicted from within the same framework that models the evolution of dark matter halos and BHs.
black While we model the cooling of gas reservoir in halos, it must be expected that BH fuelling is primarily governed by physical processes occurring at sub-kpc scales rather than by large-scale cosmological infall. Recently, Hopkins et al. (2021) presented a model in which the fraction of gas available for BH fuelling is regulated by feedback from star formation occurring in the central () galaxy regions. At these radii, the timescales over which stellar feedback operates are longer than the dynamical timescales: this prevents the onset of an ‘equilibrium’ phase where the thickness of a the gas layer smoothly adjusts to the turbulence injected by stellar feedback (e.g. Marasco et al., 2015; Bacchini et al., 2020), producing instead a galaxy-scale outflow with an efficiency that depends on the central surface density. This model implies that BH masses trace the host galaxy properties above a critical surface brightness (typical of bulges), and correctly predicts the slope and normalisation of the - and the - relations. Our model is not tailored to reproduce ‘local’ galaxy properties but it includes a conceptually similar prescription, inherited from B17: the density of gas near the BH scales as the inverse of the mass loading factor (eq. 10). Since depends on (eq. 6), galaxies with feature a severe deficit in their central gas density and their BHs grow slowly. Conversely, stellar feedback has virtually no impact on the BH growth at higher , which is regulated instead by the balance between and (unlike the model of Hopkins et al., 2021, which does not consider AGN feedback).
We stress that more refined semi-analytical models than the one presented here are available in the literature (e.g. Croton et al., 2006; Somerville et al., 2008; Guo et al., 2013; Henriques et al., 2015; Behroozi et al., 2019). These approaches include several ingredients such as mergers, environmental effects, different modes of AGN-driven feedback, and are designed to capture the evolution of chemical abundances and angular momentum of galaxies in addition to the quantities studied here. However, none of these works have focused specifically on the relation, most likely because of the lack of high-quality data available at the time of the writing. We expect that the dataset built in this work (Table 1) will be useful for theorists to constrain future models of galaxy evolution.
black Cosmological hydrodynamical simulations in the CDM framework such as Illustris (Vogelsberger et al., 2014) predict relations between , , and spiral arm pitch angle in qualitative agreement with the observations (Mutlu-Pakdil et al., 2018). A more quantitative comparison with between these predictions and the dataset built in the present work would provide useful constraints to galaxy evolution models.
5.2 Considerations on galaxy morphology
It is well known that galaxy colour and morphology are strongly correlated: while the galaxy population transits from the ‘blue cloud’ of star forming systems to the ‘red sequence’ of quenched ones, it also undergoes a structural transformation from a preferentially disc-dominated to a more spheroid-dominated morphology (Roberts & Haynes, 1994; Baldry et al., 2004; Muzzin et al., 2013; Kelvin et al., 2014). In this Section we explore the morphology distribution of our sample and interpret it in the framework of our model.
We turn our attention to the color-coding used in Fig. 6, which indicates the morphological Hubble T-type. The morphology distribution is strongly bi-modal in , with late- (early-) type systems systematically occupying halos with masses below (above) . This corresponds to a similarly sudden transition around of . The same bimodal behaviour was already noticed by PF21. The transition as a function of appears instead to be more gradual and occurs at BH masses between and , roughly where the break in the BH scaling relations appears.
We already touched upon the different scalings followed by the different morphological types in Section 5.1. Considering earlier and later types separately in Fig. 6, one may argue that the two categories obey different scaling laws, as the separation in the - space and, above all, in the - space is visible. However, our theoretical model predicts a unique relation in the -- space. While information on morphology (or angular momentum) are not specifically encoded within our model, one may question the existence of a single evolutionary sequence valid for all galaxy types.
Fully addressing the question above goes beyond the purpose of this study, but a qualitative argument comes from the fact that, at a fixed , galaxies with higher do not only live in lighter halos (see Section 3 and Fig. 2) but also have later morphological types (rightmost panel of Fig. 6). In our theoretical framework, lighter halos at are always associated to later seeds which, due to their relatively short lifespan, had a lower probability of experiencing major mergers that could induce a morphological transformation (e.g. Hopkins et al., 2010; Martin et al., 2018). Hence our model, which reproduces the correlations shown in Fig. 2 (Section 4.2), can also qualitatively explain the trends with the morphological type. We stress that, within this framework, the relation between galaxy quenching and morphological transformation is indirect: quenching is caused by BH growth and feedback, which is more significant in more massive halos; more massive halos are produced by earlier seeds, which have a higher probability of experiencing morphological transformations induced by major mergers. In a more realistic scenario, however, it is likely that galaxy mergers have an impact on the growth of the central BH. For instance, mergers can funnel gas towards the central regions of the galaxy, thus promoting BH growth and triggering AGN feedback (e.g. Hopkins et al., 2006). \colorblack Also, variations in the angular momentum of a galaxy have an impact on the stability of its disc and can possibly affect the evolution of as suggested by Romeo et al. (2020). In general, the BH accretion rate may increase if the overall angular momentum of the galaxy gets reduced (which may be the case after a major merger). These considerations suggest that the relationship between galaxy structure and quenching are more complex than suggested by our simple framework.
5.3 Limitations of our model
One of the main conceptual weakness of the model discussed in Section 4 lies in its lack of an explicit, physically motivated prescription for star formation processes caused by the absence of a dedicated treatment of the ISM. Star formation is instead fully described by eq. (5), which simply states that the material that does not feed the BH gets partitioned into stars and recycled gas. In other words, the BH is the preferential target for gas accretion, and only the cold gas spared by BH feeding - if AGN feedback permits - participates in star formation processes. While this prescription simplifies significantly the treatment of star formation in our model, it does not capture the commonly accepted idea that gas cooling from the circumgalactic medium is firstly deposited onto the ISM by different mechanisms (e.g. Marasco et al., 2012; Fraternali, 2017), and only later can participate to star formation and BH feeding processes depending on the complex physics of this medium. \colorblackAlso, since in our model we do not follow gas dynamics explicitly, we cannot address the question on how gas is transported from the scales of the circumgalactic medium (tens or hundreds of kpc) down to the scales of BH accretion discs (). Dedicated analytical and numerical models are required explore the physical processes responsible for gas transport to different scales (e.g. Hopkins & Quataert, 2011).
The adopted prescription also does not allow us to follow the physics of star formation quenching, which is instead implemented ‘ad-hoc’ in the model: the time when the BH enters the self-regulated phase marks the end of the stellar mass built-up, as any subsequent inflow of gas will target the BH alone. This has a number of side effects. First, it produces a net segregation between star-forming and quenched systems (Fig. 7), leaving no space for a transitory, ‘green-valley’-like regime. Second, as the BH population keeps growing in mass while star formation is stopped, the -to- ratio increases with time in most massive systems (panel d in Fig. 8), which is in tension with high- observations (e.g. Merloni et al., 2010). Third, it leads to a SHMR that is slightly too steep in the high-mass end. This is only marginally visible from Fig. 6 but becomes much more evident when an isothermal equation of state ( in eq. (8)) is used, as discussed in Section 4.2. A model in which gas accretion gets partioned a-priori between star formation and BH feeding, in the delicate phase where , may help to alleviate these issues and would likely provide a more realistic picture of stellar and BH mass assembly in high-mass galaxies.
Our model assumes a continuous and smooth mass assembly, which begs the question if mergers play any role in it. The smooth accretion of dark matter and gas that we adopt (eq. 3) can also be interpreted as a continuous ‘rain’ of gas-rich minor mergers, but we stress that in our framework the bulk of stellar and BH mass is built ‘in-situ’. While cosmological hydrodynamical simulations suggest that most of the stellar mass in halos with is built ex-situ (Pillepich et al., 2018b), which may also explain why correlates with better than , a scenario where the BH scaling relations are preferentially produced by mergers does not seem to be favoured by the data (King & Nealon, 2021). However, major mergers may be relevant to set galaxy morphology, as discussed in Section 5.2.
Finally, we notice that the BH feedback efficiency adopted in our fiducial model, , is times smaller than the typical values used in semi-analytical models (e.g. Croton et al., 2006, 2016) and cosmological hydrodynamical simulations (e.g. Di Matteo et al., 2005; Schaye et al., 2015; Pillepich et al., 2018a) to reproduce galaxy scaling relations. It is not trivial to compare our feedback prescription with those adopted in these more complex models, which often employ different feedback ‘modes’ (e.g. ‘quasar’-mode and ‘radio’-mode) depending on the BH accretion rate. Also, varies significantly from one model to another: for instance, in their hydrodynamical simulations, Valentini et al. (2020) implemented the coupling between the AGN energy and a realistic multi-phase ISM, finding that adequately regulates the BH growth in Milky Way-like galaxies. A simplification that we adopted here is the absence of an AGN duty cycle: our model assumes a continuous feeding of the BH, corresponding to a continuous energy output distributed over the entire galaxy lifespan, whereas the observed AGN activity is intermittent. We plan to take this effect into account in future developments of our model.
6 Conclusions
Galaxy formation is regulated by the competition between processes that favour the growth of stars and supermassive BHs, such as the cooling and gravitational collapse of gas accreted from the intergalactic medium, and those that quench them, namely negative feedback resulting from star formation and BH accretion. The stellar, halo and BH masses of present-day galaxies are precious remnants of these evolutionary processes and of the key parameters that describe them. For these reasons, the characterisation of the relations between , and (or equivalently, as in this study, ) at any redshift is a subject of great interest for both the observational and the theoretical astrophysical communities.
In this work we have focused on the relations between , and at using a sample of galaxies with dynamical estimates of their BH and halo masses, all having and . Unlike previous studies, where the line-widths of the integrated velocity profiles from H i, CO or H data were used as proxies for (e.g. Sabra et al., 2015; Davis et al., 2019b; Smith et al., 2021), our sample is almost entirely made of galaxies for which either spatially resolved rotation curves or globular cluster kinematics were previously analysed in the literature, providing a more refined estimate of their . Our main results, valid in the mass range considered, can be summarised as follows:
- •
-
•
In our sample, the strength and tightness of the correlation between and is comparable to the one between and , the mean stellar velocity dispersion within the effective radius (Fig. 4).
-
•
Bulge masses correlates with significantly better than disc masses, but not statistically better than the total of the host galaxy. \colorblack The limitations of our sample prevent us from assessing whether this property is also applicable to a complete, volume-limited sample.
-
•
The slopes of the - and the - relations show a break at or (Fig. 1).
-
•
At a fixed , correlates negatively with and positively with the Hubble morphological T-type. That is, at a given BH mass, galaxies with a higher global star formation efficiency tend to have later morphological types and to occupy less massive halos (Fig. 6 and 2). There is no significant trend instead between and at fixed .
In Section 5 we developed an equilibrium model in the CDM framework to explain the observed trends and provide insights into their physical origin. Our model, largely inspired by that developed by B17, assumes that galaxies evolve by smoothly accreting dark and baryonic matter at a cosmological rate, while the competition between the cooling of the available gas reservoir and negative feedback from star formation and AGN regulates the growth rates of stars and BHs. The model is based on five free parameters regulating the stellar and AGN feedback, which we manually tuned to match the data. In spite of its simplicity, the model reproduces the observed relations remarkably well, including the break at and the trends found at fixed and (Fig. 6 and 11). In the model, the break originates as the BH population transits from a rapidly accreting phase, in which stellar feedback is inefficient and the BH feedback energy is still small compared to the gravitational binding energy of the cooling gas , to a more gradual and self-regulated growth, driven by the continuous balance between the and . This balance produces a slope in the relation in excellent agreement with the data at . The correlations at fixed are instead produced by scatter in the BH feedback efficiency: higher efficiencies lead to less massive BHs at a given halo mass but do not alter the stellar-to-halo mass relation; hence, at fixed , galaxies with a higher will be those occupying less massive halos.
As our model lacks a dedicated treatment of mass accretion provided by mergers, it does not allow us to follow separately the formation of spheroids and discs, which in turns prevents us from drawing conclusions on the physics that regulate the co-evolution between spheroids and BHs. More advanced models are required to tackle this topic, which we plan to implement in a follow-up study.
Acknowledgements
black The authors thank Alister Graham for providing constructive comments to the manuscript. AM and GC acknowledge the support by INAF/Frontiera through the "Progetti Premiali" funding scheme of the Italian Ministry of Education, University, and Research. LP acknowledges support from the Centre National d’Études Spatiales (CNES) and from the European Research Council (ERC) under the European Unions Horizon 2020 research and innovation program (grant agreement No. 834148).
Data Availability
The data underlying this article are available in the article and in its online supplementary material.
References
- Bacchini et al. (2020) Bacchini C., Fraternali F., Iorio G., Pezzulli G., Marasco A., Nipoti C., 2020, A&A, 641, A70
- Bajaja et al. (1984) Bajaja E., van der Burg G., Faber S. M., Gallagher J. S., Knapp G. R., Shane W. W., 1984, A&A, 141, 309
- Baldry et al. (2004) Baldry I. K., Glazebrook K., Brinkmann J., Ivezić Ž., Lupton R. H., Nichol R. C., Szalay A. S., 2004, ApJ, 600, 681
- Bandara et al. (2009) Bandara K., Crampton D., Simard L., 2009, ApJ, 704, 1135
- Behroozi et al. (2010) Behroozi P. S., Conroy C., Wechsler R. H., 2010, ApJ, 717, 379
- Behroozi et al. (2013) Behroozi P. S., Wechsler R. H., Conroy C., 2013, ApJ, 770, 57
- Behroozi et al. (2019) Behroozi P., Wechsler R. H., Hearin A. P., Conroy C., 2019, MNRAS, 488, 3143
- Berrier et al. (2013) Berrier J. C., et al., 2013, ApJ, 769, 132
- Binney et al. (2009) Binney J., Nipoti C., Fraternali F., 2009, MNRAS, 397, 1804
- Boardman et al. (2016) Boardman N. F., et al., 2016, MNRAS, 460, 3029
- Bondi (1952) Bondi H., 1952, MNRAS, 112, 195
- Booth & Schaye (2010) Booth C. M., Schaye J., 2010, MNRAS, 405, L1
- Bouché et al. (2010) Bouché N., et al., 2010, ApJ, 718, 1001
- Bower et al. (2017) Bower R. G., Schaye J., Frenk C. S., Theuns T., Schaller M., Crain R. A., McAlpine S., 2017, MNRAS, 465, 32
- Braun et al. (1994) Braun R., Walterbos R. A. M., Kennicutt Robert C. J., Tacconi L. J., 1994, ApJ, 420, 558
- Brodie et al. (2014) Brodie J. P., et al., 2014, ApJ, 796, 52
- Brook et al. (2016) Brook C. B., Santos-Santos I., Stinson G., 2016, MNRAS, 459, 638
- Bruzual & Charlot (2003) Bruzual G., Charlot S., 2003, MNRAS, 344, 1000
- Bundy et al. (2008) Bundy K., et al., 2008, ApJ, 681, 931
- Cappellari et al. (2013) Cappellari M., et al., 2013, MNRAS, 432, 1709
- Chemin et al. (2003) Chemin L., Cayatte V., Balkowski C., Marcelin M., Amram P., van Driel W., Flores H., 2003, A&A, 405, 89
- Chen et al. (2020) Chen Z., et al., 2020, ApJ, 897, 102
- Corbelli et al. (2010) Corbelli E., Lorenzoni S., Walterbos R., Braun R., Thilker D., 2010, A&A, 511, A89
- Correa et al. (2015) Correa C. A., Wyithe J. S. B., Schaye J., Duffy A. R., 2015, MNRAS, 450, 1521
- Côté et al. (2003) Côté P., McLaughlin D. E., Cohen J. G., Blakeslee J. P., 2003, ApJ, 591, 850
- Cowie et al. (1996) Cowie L. L., Songaila A., Hu E. M., Cohen J. G., 1996, AJ, 112, 839
- Croton et al. (2006) Croton D. J., et al., 2006, MNRAS, 365, 11
- Croton et al. (2016) Croton D. J., et al., 2016, ApJS, 222, 22
- Davis & Laor (2011) Davis S. W., Laor A., 2011, ApJ, 728, 98
- Davis et al. (2017) Davis B. L., Graham A. W., Seigar M. S., 2017, MNRAS, 471, 2187
- Davis et al. (2018) Davis B. L., Graham A. W., Cameron E., 2018, ApJ, 869, 113
- Davis et al. (2019a) Davis B. L., Graham A. W., Cameron E., 2019a, ApJ, 873, 85
- Davis et al. (2019b) Davis B. L., Graham A. W., Combes F., 2019b, ApJ, 877, 64
- Dayal et al. (2019) Dayal P., Rossi E. M., Shiralilou B., Piana O., Choudhury T. R., Volonteri M., 2019, MNRAS, 486, 2336
- Dekel & Birnboim (2006) Dekel A., Birnboim Y., 2006, MNRAS, 368, 2
- Dekel & Silk (1986) Dekel A., Silk J., 1986, ApJ, 303, 39
- Di Matteo et al. (2005) Di Matteo T., Springel V., Hernquist L., 2005, Nature, 433, 604
- Dubois et al. (2013) Dubois Y., Gavazzi R., Peirani S., Silk J., 2013, MNRAS, 433, 3297
- Dutton & Macciò (2014) Dutton A. A., Macciò A. V., 2014, MNRAS, 441, 3359
- Dutton et al. (2010) Dutton A. A., Conroy C., van den Bosch F. C., Prada F., More S., 2010, MNRAS, 407, 2
- Emsellem et al. (2006) Emsellem E., Fathi K., Wozniak H., Ferruit P., Mundell C. G., Schinnerer E., 2006, MNRAS, 365, 367
- Erroz-Ferrer et al. (2015) Erroz-Ferrer S., et al., 2015, MNRAS, 451, 1004
- Erwin et al. (2018) Erwin P., Thomas J., Saglia R. P., Fabricius M., Rusli S. P., Seitz S., Bender R., 2018, MNRAS, 473, 2251
- Eyles et al. (2005) Eyles L. P., Bunker A. J., Stanway E. R., Lacy M., Ellis R. S., Doherty M., 2005, MNRAS, 364, 443
- Faber & Jackson (1976) Faber S. M., Jackson R. E., 1976, ApJ, 204, 668
- Fall & Efstathiou (1980) Fall S. M., Efstathiou G., 1980, MNRAS, 193, 189
- Fall & Romanowsky (2018) Fall S. M., Romanowsky A. J., 2018, ApJ, 868, 133
- Ferrarese (2002) Ferrarese L., 2002, ApJ, 578, 90
- Fisher (1997) Fisher D., 1997, AJ, 113, 950
- Fontanot et al. (2009) Fontanot F., De Lucia G., Monaco P., Somerville R. S., Santini P., 2009, MNRAS, 397, 1776
- Forbes et al. (2017) Forbes D. A., et al., 2017, AJ, 153, 114
- Fraternali (2017) Fraternali F., 2017, Gas Accretion via Condensation and Fountains. p. 323, doi:10.1007/978-3-319-52512-9_14
- Fraternali & Tomassetti (2012) Fraternali F., Tomassetti M., 2012, MNRAS, 426, 2166
- García-Barreto et al. (1999) García-Barreto J. A., Combes F., Koribalski B., Franco J., 1999, A&A, 348, 685
- Geha et al. (2012) Geha M., Blanton M. R., Yan R., Tinker J. L., 2012, ApJ, 757, 85
- Graham (2016) Graham A. W., 2016, Galaxy Bulges and Their Massive Black Holes: A Review. p. 263, doi:10.1007/978-3-319-19378-6_11
- Graham & Scott (2013) Graham A. W., Scott N., 2013, ApJ, 764, 151
- Gültekin et al. (2014) Gültekin K., Gebhardt K., Kormendy J., Lauer T. R., Bender R., Tremaine S., Richstone D. O., 2014, ApJ, 781, 112
- Guo et al. (2013) Guo Q., White S., Angulo R. E., Henriques B., Lemson G., Boylan-Kolchin M., Thomas P., Short C., 2013, MNRAS, 428, 1351
- Haehnelt et al. (1998) Haehnelt M. G., Natarajan P., Rees M. J., 1998, MNRAS, 300, 817
- Harrison (2017) Harrison C. M., 2017, Nature Astronomy, 1, 0165
- Henriques et al. (2015) Henriques B. M. B., White S. D. M., Thomas P. A., Angulo R., Guo Q., Lemson G., Springel V., Overzier R., 2015, MNRAS, 451, 2663
- Hopkins & Quataert (2011) Hopkins P. F., Quataert E., 2011, MNRAS, 415, 1027
- Hopkins et al. (2006) Hopkins P. F., Hernquist L., Cox T. J., Di Matteo T., Robertson B., Springel V., 2006, ApJS, 163, 1
- Hopkins et al. (2010) Hopkins P. F., et al., 2010, ApJ, 715, 202
- Hopkins et al. (2021) Hopkins P. F., Wellons S., Angles-Alcazar D., Faucher-Giguere C.-A., Grudic M. Y., 2021, arXiv e-prints, p. arXiv:2103.10444
- Huchra et al. (2012) Huchra J. P., et al., 2012, ApJS, 199, 26
- Jahnke & Macciò (2011) Jahnke K., Macciò A. V., 2011, ApJ, 734, 92
- Jones et al. (1999) Jones K. L., Koribalski B. S., Elmouttie M., Haynes R. F., 1999, MNRAS, 302, 649
- Katz et al. (2019a) Katz H., Desmond H., McGaugh S., Lelli F., 2019a, MNRAS, 483, L98
- Katz et al. (2019b) Katz H., Desmond H., McGaugh S., Lelli F., 2019b, MNRAS, 483, L98
- Kelvin et al. (2014) Kelvin L. S., et al., 2014, MNRAS, 444, 1647
- Kereš et al. (2005) Kereš D., Katz N., Weinberg D. H., Davé R., 2005, MNRAS, 363, 2
- Kim et al. (1988) Kim D. W., Guhathakurta P., van Gorkom J. H., Jura M., Knapp G. R., 1988, ApJ, 330, 684
- King (2003) King A., 2003, ApJ, 596, L27
- King & Nealon (2021) King A., Nealon R., 2021, MNRAS, 502, L1
- King & Pounds (2015) King A., Pounds K., 2015, ARA&A, 53, 115
- Kormendy & Bender (2011) Kormendy J., Bender R., 2011, Nature, 469, 377
- Kormendy & Gebhardt (2001) Kormendy J., Gebhardt K., 2001, in Wheeler J. C., Martel H., eds, American Institute of Physics Conference Series Vol. 586, 20th Texas Symposium on relativistic astrophysics. pp 363–381 (arXiv:astro-ph/0105230), doi:10.1063/1.1419581
- Kormendy & Ho (2013) Kormendy J., Ho L. C., 2013, ARA&A, 51, 511
- Krajnović et al. (2018) Krajnović D., et al., 2018, MNRAS, 477, 3030
- Kravtsov et al. (2018) Kravtsov A. V., Vikhlinin A. A., Meshcheryakov A. V., 2018, Astronomy Letters, 44, 8
- Kroupa et al. (2020) Kroupa P., Subr L., Jerabkova T., Wang L., 2020, MNRAS, 498, 5652
- Krumpe et al. (2015) Krumpe M., Miyaji T., Husemann B., Fanidakis N., Coil A. L., Aceves H., 2015, ApJ, 815, 21
- Lamastra et al. (2010) Lamastra A., Menci N., Maiolino R., Fiore F., Merloni A., 2010, MNRAS, 405, 29
- Larson (1974) Larson R. B., 1974, MNRAS, 169, 229
- Läsker et al. (2014) Läsker R., Ferrarese L., van de Ven G., Shankar F., 2014, ApJ, 780, 70
- Lauer et al. (2007) Lauer T. R., Tremaine S., Richstone D., Faber S. M., 2007, ApJ, 670, 249
- Leauthaud et al. (2012) Leauthaud A., et al., 2012, ApJ, 744, 159
- Lelli et al. (2016) Lelli F., McGaugh S. S., Schombert J. M., 2016, AJ, 152, 157
- Lilly et al. (2013) Lilly S. J., Carollo C. M., Pipino A., Renzini A., Peng Y., 2013, ApJ, 772, 119
- Lindblad et al. (1997) Lindblad P. A. B., Kristen H., Joersaeter S., Hoegbom J., 1997, A&A, 317, 36
- Loeb & Rasio (1994) Loeb A., Rasio F. A., 1994, ApJ, 432, 52
- Magorrian et al. (1998) Magorrian J., et al., 1998, AJ, 115, 2285
- Mandelbaum et al. (2006) Mandelbaum R., Seljak U., Kauffmann G., Hirata C. M., Brinkmann J., 2006, MNRAS, 368, 715
- Marasco et al. (2012) Marasco A., Fraternali F., Binney J. J., 2012, MNRAS, 419, 1107
- Marasco et al. (2015) Marasco A., Debattista V. P., Fraternali F., van der Hulst T., Wadsley J., Quinn T., Roškar R., 2015, MNRAS, 451, 4223
- Marconi & Hunt (2003) Marconi A., Hunt L. K., 2003, ApJ, 589, L21
- Marconi et al. (2004) Marconi A., Risaliti G., Gilli R., Hunt L. K., Maiolino R., Salvati M., 2004, MNRAS, 351, 169
- Martin et al. (2018) Martin G., Kaviraj S., Devriendt J. E. G., Dubois Y., Pichon C., 2018, MNRAS, 480, 2266
- McConnell & Ma (2013) McConnell N. J., Ma C.-P., 2013, ApJ, 764, 184
- McGaugh & Schombert (2014) McGaugh S. S., Schombert J. M., 2014, AJ, 148, 77
- Memola et al. (2011) Memola E., Salucci P., Babić A., 2011, A&A, 534, A50
- Merloni et al. (2010) Merloni A., et al., 2010, ApJ, 708, 137
- Mo et al. (1998) Mo H. J., Mao S., White S. D. M., 1998, MNRAS, 295, 319
- Moore & Gottesman (1995) Moore E. M., Gottesman S. T., 1995, ApJ, 447, 159
- More et al. (2011) More S., van den Bosch F. C., Cacciato M., Skibba R., Mo H. J., Yang X., 2011, MNRAS, 410, 210
- Moster et al. (2013) Moster B. P., Naab T., White S. D. M., 2013, MNRAS, 428, 3121
- Mundell et al. (1995) Mundell C. G., Pedlar A., Axon D. J., Meaburn J., Unger S. W., 1995, MNRAS, 277, 641
- Mundell et al. (1999) Mundell C. G., Pedlar A., Shone D. L., Robinson A., 1999, MNRAS, 304, 481
- Mutlu-Pakdil et al. (2018) Mutlu-Pakdil B., Seigar M. S., Hewitt I. B., Treuthardt P., Berrier J. C., Koval L. E., 2018, MNRAS, 474, 2594
- Muzzin et al. (2013) Muzzin A., et al., 2013, ApJ, 777, 18
- Navarro et al. (1996) Navarro J. F., Frenk C. S., White S. D. M., 1996, ApJ, 462, 563
- Nehlig et al. (2016) Nehlig F., Vollmer B., Braine J., 2016, A&A, 587, A108
- Noeske et al. (2007) Noeske K. G., et al., 2007, ApJ, 660, L43
- Noordermeer et al. (2007) Noordermeer E., van der Hulst J. M., Sancisi R., Swaters R. S., van Albada T. S., 2007, MNRAS, 376, 1513
- Norris et al. (2012) Norris M. A., et al., 2012, MNRAS, 421, 1485
- Ondrechen et al. (1989) Ondrechen M. P., van der Hulst J. M., Hummel E., 1989, ApJ, 342, 39
- Peng (2007) Peng C. Y., 2007, ApJ, 671, 1098
- Peng et al. (2002) Peng C. Y., Ho L. C., Impey C. D., Rix H.-W., 2002, AJ, 124, 266
- Peng et al. (2010a) Peng C. Y., Ho L. C., Impey C. D., Rix H.-W., 2010a, AJ, 139, 2097
- Peng et al. (2010b) Peng Y.-j., et al., 2010b, ApJ, 721, 193
- Pillepich et al. (2018a) Pillepich A., et al., 2018a, MNRAS, 473, 4077
- Pillepich et al. (2018b) Pillepich A., et al., 2018b, MNRAS, 475, 648
- Pizzella et al. (2005) Pizzella A., Corsini E. M., Dalla Bontà E., Sarzi M., Coccato L., Bertola F., 2005, ApJ, 631, 785
- Planck Collaboration et al. (2013) Planck Collaboration et al., 2013, A&A, 557, A52
- Ponomareva et al. (2016) Ponomareva A. A., Verheijen M. A. W., Bosma A., 2016, MNRAS, 463, 4052
- Ponomareva et al. (2017) Ponomareva A. A., Verheijen M. A. W., Peletier R. F., Bosma A., 2017, MNRAS, 469, 2387
- Popesso et al. (2019) Popesso P., et al., 2019, MNRAS, 483, 3213
- Posti & Fall (2021) Posti L., Fall S. M., 2021, A&A, 649, A119
- Posti & Helmi (2019) Posti L., Helmi A., 2019, A&A, 621, A56
- Posti et al. (2019a) Posti L., Fraternali F., Marasco A., 2019a, A&A, 626, A56
- Posti et al. (2019b) Posti L., Marasco A., Fraternali F., Famaey B., 2019b, A&A, 629, A59
- Power et al. (2011) Power C., Zubovas K., Nayakshin S., King A. R., 2011, MNRAS, 413, L110
- Pu et al. (2010) Pu S. B., Saglia R. P., Fabricius M. H., Thomas J., Bender R., Han Z., 2010, A&A, 516, A4
- Read et al. (2017) Read J. I., Iorio G., Agertz O., Fraternali F., 2017, MNRAS, 467, 2019
- Renzini & Peng (2015) Renzini A., Peng Y.-j., 2015, ApJ, 801, L29
- Roberts & Haynes (1994) Roberts M. S., Haynes M. P., 1994, ARA&A, 32, 115
- Robinson et al. (2021) Robinson J. H., et al., 2021, ApJ, 912, 160
- Romeo et al. (2020) Romeo A. B., Agertz O., Renaud F., 2020, MNRAS, 499, 5656
- Sabra et al. (2015) Sabra B. M., Saliba C., Abi Akl M., Chahine G., 2015, ApJ, 803, 5
- Saglia et al. (2016) Saglia R. P., et al., 2016, ApJ, 818, 47
- Sahu et al. (2019a) Sahu N., Graham A. W., Davis B. L., 2019a, ApJ, 876, 155
- Sahu et al. (2019b) Sahu N., Graham A. W., Davis B. L., 2019b, ApJ, 887, 10
- Savorgnan et al. (2016) Savorgnan G. A. D., Graham A. W., Marconi A., Sani E., 2016, ApJ, 817, 21
- Schaye et al. (2015) Schaye J., et al., 2015, MNRAS, 446, 521
- Schuberth et al. (2010) Schuberth Y., Richtler T., Hilker M., Dirsch B., Bassino L. P., Romanowsky A. J., Infante L., 2010, A&A, 513, A52
- Scott et al. (2013) Scott N., Graham A. W., Schombert J., 2013, ApJ, 768, 76
- Seigar et al. (2008) Seigar M. S., Kennefick D., Kennefick J., Lacy C. H. S., 2008, ApJ, 678, L93
- Sersic (1968) Sersic J. L., 1968, Atlas de Galaxias Australes
- Sheth et al. (2010) Sheth K., et al., 2010, PASP, 122, 1397
- Shostak (1987) Shostak G. S., 1987, A&A, 175, 4
- Silk & Rees (1998) Silk J., Rees M. J., 1998, A&A, 331, L1
- Smith et al. (2021) Smith M. D., et al., 2021, MNRAS, 500, 1933
- Sofue et al. (1999) Sofue Y., Tutui Y., Honma M., Tomita A., Takamiya T., Koda J., Takeda Y., 1999, ApJ, 523, 136
- Soltan (1982) Soltan A., 1982, MNRAS, 200, 115
- Somerville & Davé (2015) Somerville R. S., Davé R., 2015, ARA&A, 53, 51
- Somerville et al. (2008) Somerville R. S., Hopkins P. F., Cox T. J., Robertson B. E., Hernquist L., 2008, MNRAS, 391, 481
- Speights et al. (2019) Speights J. C., Godwin C., Reimer R., Benton A., Lemaire R., 2019, ApJ, 883, 77
- Sun et al. (2013) Sun A.-L., Greene J. E., Impellizzeri C. M. V., Kuo C.-Y., Braatz J. A., Tuttle S., 2013, ApJ, 778, 47
- Sutherland & Dopita (1993) Sutherland R. S., Dopita M. A., 1993, ApJS, 88, 253
- Terrazas et al. (2017) Terrazas B. A., Bell E. F., Woo J., Henriques B. M. B., 2017, ApJ, 844, 170
- Trinchieri et al. (2012) Trinchieri G., Marino A., Mazzei P., Rampazzo R., Wolter A., 2012, A&A, 545, A140
- Tully & Fisher (1977) Tully R. B., Fisher J. R., 1977, A&A, 500, 105
- Vale & Ostriker (2004) Vale A., Ostriker J. P., 2004, MNRAS, 353, 189
- Valentini et al. (2020) Valentini M., et al., 2020, MNRAS, 491, 2779
- Veilleux et al. (1999) Veilleux S., Bland-Hawthorn J., Cecil G., 1999, AJ, 118, 2108
- Vogelsberger et al. (2014) Vogelsberger M., et al., 2014, MNRAS, 444, 1518
- Volonteri et al. (2011) Volonteri M., Natarajan P., Gültekin K., 2011, ApJ, 737, 50
- Wechsler & Tinker (2018) Wechsler R. H., Tinker J. L., 2018, ARA&A, 56, 435
- White & Frenk (1991) White S. D. M., Frenk C. S., 1991, ApJ, 379, 52
- White & Rees (1978) White S. D. M., Rees M. J., 1978, MNRAS, 183, 341
- Whitmore & Kirshner (1981) Whitmore B. C., Kirshner R. P., 1981, ApJ, 250, 43
- Whitmore et al. (1979) Whitmore B. C., Kirshner R. P., Schechter P. L., 1979, ApJ, 234, 68
- Wolfire et al. (2003) Wolfire M. G., McKee C. F., Hollenbach D., Tielens A. G. G. M., 2003, ApJ, 587, 278
- Woods et al. (1990) Woods D., Madore B. F., Fahlman G. G., 1990, ApJ, 353, 90
- Zasov et al. (2012) Zasov A. V., Khoperskov A. V., Katkov I. Y., Afanasiev V. L., Kaisin S. S., 2012, Astrophysical Bulletin, 67, 362
- Zinger et al. (2020) Zinger E., et al., 2020, MNRAS, 499, 768
- de Blok et al. (2008) de Blok W. J. G., Walter F., Brinks E., Trachternach C., Oh S. H., Kennicutt R. C. J., 2008, AJ, 136, 2648
- de Nicola et al. (2019) de Nicola S., Marconi A., Longo G., 2019, MNRAS, 490, 600
- van Albada & Sancisi (1986) van Albada T. S., Sancisi R., 1986, Philosophical Transactions of the Royal Society of London Series A, 320, 447
- van den Bosch (2016) van den Bosch R. C. E., 2016, ApJ, 831, 134
- van den Bosch et al. (2019) van den Bosch F. C., Lange J. U., Zentner A. R., 2019, MNRAS, 488, 4984
- vanGorkom et al. (1990) vanGorkom J. H., van der Hulst J. M., Haschick A. D., Tubbs A. D., 1990, AJ, 99, 1781
Appendix A The conversion from to
In Section 2 we make use of rotation curve measurements to estimate in our systems. Rather than resorting to theoretical models, we prefer to calibrate the relation empirically using the results of Posti et al. (2019a), which are based on mass decomposition of rotation curves from the SPARC galaxy sample (Lelli et al., 2016).
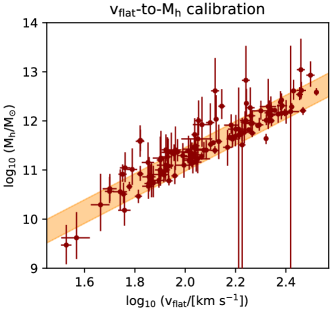
In Fig. 12 we show that this relation holds over a large dynamical range, and is given by
| (2) |
with an rms scatter of dex, which we adopt as the uncertainty associated to our estimates via eq. (2). The final uncertainty also incorporates measurement errors in . These, however, are often very small or not quoted at all in the literature.
We note that similar relations for the SPARC sample were recently derived by Katz et al. (2019b) using a variety of different assumptions in the rotation curve decomposition procedures. In Katz et al. (2019b), the values for the slope (intercept) of eq. (2) vary in the range (), depending on the halo profile adopted and on the priors used in the modelling. Our estimates in eq. (2) are well within these ranges.
Appendix B Detailed model description
In this Appendix we describe in detail our theoretical model of galaxy evolution used in Section 4. For consistency with the observed dataset, we assume that all halo ‘virial’ quantities (such as mass, radius and velocity) are defined at (or within) , the radius where the mean halo density becomes equal to 200 times the (redshift-dependant) critical density of the Universe, and simply use the suffix ‘h’ to refer to halo properties.
Halo growth
We start by assuming a cosmological growth for dark matter halos as parametrised by Correa et al. (2015)444Note that this parametrisation is valid for , as we assume here.:
| (3) |
where , is the Hubble constant, and (so that the Hubble parameter is given by ).
Eq. (3), like the other equations in this Appendix, is solved numerically from to , corresponding to the current age of the Universe, using a constant time-step of and assuming . By varying from to we can sample halo masses at the present epoch from (for younger seeds) to (for older seeds). We note that varying the seed halo mass is equivalent of varying the seed time, and simply allows us to modify the range of sampled at with no consequences on our results.
Halos accrete baryons as well as dark matter. At any given time , the total baryonic content of our system is always , being the universal baryonic fraction. This material is divided into gas, stars, and BH as described below.
Gas cooling
We assume that, at a any given time , the total gas reservoir of our model galaxy is given by , and being the stellar and BH mass of the galaxy. In reality, this gaseous reservoir is a complex, multi-phase structure build by a mixture of heterogeneous processes, including cosmological accretion of pristine gas, outflows produced by stellar and BH feedback. Our model does not aim to capture the complex physics of this medium. We make instead the simplifying assumption that the entire reservoir is in a single phase defined by the virial temperature of the dark matter halo. Therefore, in what follows we make no distinction between interstellar and circumgalactic media, and simply refer to the whole gas reservoir as the ‘gas’ component of the model.
Clearly, only a small fraction of can be used to form stars and to feed the BH, and we assume that this fraction is determined by the cooling rate of the gas reservoir. Specifically, following White & Frenk (1991), at any time we define the halo cooling radius as the radius within a halo where the cooling time is equal to . Using the formulation from Chen et al. (2020), we have
| (4) |
where , and are the halo virial radius, temperature and circular velocity measured at respectively, is the cooling function ( being the gas metallicity), is the Boltzmann constant and is the proton mass. In this work we use the collisional ionisation equilibrium cooling functions of Sutherland & Dopita (1993) at metallicity , representative for a pristine gas. In Section 4.2 we explore the effect of using a higher metallicity.
The ratio is a decreasing function of both cosmic time and . At high , where halo masses are small, densities are high and gas can efficiently cool, in all systems. As time progresses, halos grow and cooling remains efficient only within a fraction of the virial radius, but in the lowest mass regime () the ratio remains even at . This is related to the dichotomy between the so-called ‘cold’ and ‘hot’ mode gas accretion (e.g. Kereš et al., 2005; Dekel & Birnboim, 2006), with the former (latter) working preferentially at high (low) and in low-mass (high-mass) systems. In present-day Milky-Way-like galaxies, decreases below at .
Assuming NFW profiles and the time-dependent -concentration relation from Dutton & Macciò (2014), we can compute , the mass fraction enclosed within , and the total mass of the cooling gas as . The time-derivative of this quantity, , gives the rate that becomes gas eligible for star formation and BH feeding at any given time.
We implicitly assume that the dominant timescale of the gas accretion process is the gas cooling time (e.g. Binney et al., 2009), and that the newly cooled material can be used immediately by the galaxy with no delay time, that is .
Stellar growth and feedback
We assume a simple equilibrium model where the the rate at which the gas cools is balanced by the rates at which stars form, the BH grows and gas is returned to the initial reservoir because of stellar mass losses and feedback. Such a model can be described by
| (5) |
where is the recycled gas fraction due to stellar mass losses and is the mass-loading factor of the outflows driven by stellar feedback. Here we set (e.g. Fraternali & Tomassetti, 2012), but similar results can be obtained using (Bruzual & Charlot, 2003) by slightly adjusting the model parameters. The parameter , instead, requires a more in-depth discussion.
Following an approach that is very popular in semi-analytical models, and is supported by arguments based on energy- and momentum-driven winds, we assume that is a decreasing function of (e.g. Somerville & Davé, 2015, and references therein). This choice leads to a scenario where stellar feedback is very efficient in the low-mass regime, leading to low star formation efficiencies, but becomes less effective at larger masses. We parametrise the mass-loading factor as
| (6) |
with . In eq.(6), is a time-dependent critical halo mass below which stellar feedback is more effective. As in B17 and Dayal et al. (2019), we assume that scales with redshift as
| (7) |
where sets the critical mass at . We notice that the redshift dependence in eq. (7) is very weak: at , at and at . In B17, is fixed to and to , while Dayal et al. (2019) adopt . In this work, we prefer to treat both and as free parameters.
Eq. (5) can be used to compute the stellar mass growth in the time interval [, ] if the BH mass growth is known. We describe how the latter is determined below. While a starting seed is required to integrate eq. (5), in practice we find that systems quickly lose memory of their initial seed and converge towards a stable solution for any reasonable choice of . has some impact on systems with present-day but, in the range of masses studied here, can be considered only a technical necessity due to our implementation and has no particular physical meaning. For simplicity, we set to .
In our model, feedback-driven outflows (via ) and stellar mass losses (via ) immediately re-join the gas reservoir (so that the total baryonic mass within the virial radius remains ) and can participate in future stellar and BH growth.
BH growth and feedback
We assume Bondi-like accretion (Bondi, 1952), where the BH grows at a rate
| (8) |
where is the gravitational constant, is the density of the gas near the BH (ideally measured at the Bondi radius) and is the gas effective sound speed. Eq. (8) represents a specific expression to parametrise the BH accretion as a function of BH mass and the thermo-dynamic properties of the gas, and has been largely adopted in the literature using different normalisation factors (e.g. Di Matteo et al., 2005; Croton et al., 2006; Bower et al., 2017). We stress that different prescriptions are also possible (e.g. Hopkins & Quataert, 2011), \colorblack and that the mode by which BHs grow in the early Universe can be significantly different (e.g. Kroupa et al., 2020).
By adopting a polytropic equation of state , being the gas pressure, eq. (8) can be written as
| (9) |
where is the gas mean atomic weight, is the proton mass, is the Boltzmann constant, and and define the normalisation of the equation of state. Here, for simplicity, we adopt and , meaning that, at the temperatures typical for the warm ISM, the pressure is , similar to that determined for the Galactic ISM (Wolfire et al., 2003). However, we stress that any choice for or is degenerate with the normalisation of defined below in eq. (10), thus the exact values of these quantities cannot be constrained by our analysis. For consistency with B17 we adopt , so that . Thus the BH growth will strongly depend on the BH seed mass, which is another free parameter of our model, and weakly on the gas density, which we model as described below. The isothermal case () is briefly discussed in Section 4.2.
As in B17, we make the assumption that the density of the gas near the BH scales proportionally to the typical density of the ISM, and is inversely proportional to the mass loading factor as feedback from star formation is supposed to remove gas from the innermost regions of the galaxy. As discussed, in this study we do not model the ISM explicitly, but we can make an educated guess on how its density scales with the main ingredients of our model. By assuming that the ISM stratifies in a disc with a radially constant thickness, we write its density as . Simple treatments for these quantities are and, in a scenario where the halo angular momentum sets the size of the disc (Fall & Efstathiou, 1980; Mo et al., 1998), (see Posti et al., 2019b, for a more detailed treatment of disc sizes). With these assumptions, can be finally written as
| (10) |
where the normalisation is a free parameter.
Our expression for follows the prescription of B17 and is meant to capture plausible variations in the central gas density, but we stress that different prescriptions can be adopted. For instance, we experimented using , finding results perfectly compatible with our current implementation. We also tried a more straightforward approach with finding similar results, except for a somewhat larger slope in the SHMR in the high-mass range. All considered, our results do not depend significantly on our prescription for .
As grows with time, feedback from star formation becomes increasingly less efficient (eq. 6) and would rapidly diverge if there were no mechanisms that prevented inflow, such as AGN feedback. In our model, we implement a ‘preventative’ AGN feedback recipe (e.g. Zinger et al., 2020), where the energy released by the BH counteracts gas cooling and accretion onto the galaxy.
A BH radiates away a fraction of its accreted rest-mass energy providing a luminosity , being the speed of light. Since only a fraction of such luminosity couples with the gas, the AGN feedback energy rate will be
| (11) |
As commonly done in the literature, we set (e.g. Soltan, 1982; Marconi et al., 2004; Davis & Laor, 2011) and treat , the so-called ‘BH feedback efficiency’, as a free parameter of our model.
black The BH heats the surrounding gas at a rate given by eq. (11). In principle, a detailed calculation of the balance between heating and cooling rates would be required to model self-consistently the physics of gas accretion onto the galaxy. However, this is not a trivial task, given that we ignore both the scale over which the AGN energy is transferred to the gas and the way by which baryons redistribute within the halo after the heating and cooling processes. We therefore adopt a simplified approach, similar to those often adopted in the literature (e.g. Bower et al., 2017; Chen et al., 2020), that aims at capturing the effects of this balance integrated over the entire galaxy lifespan. We assume that the energy output specified by eq. (11) is accumulated during the lifespan of the BH with no significant energy loss. At each time-step, the BH energy output accumulated up to that epoch, , is compared to the gravitational binding energy of the gas within the cooling radius of the system, \colorblack given by
| (12) |
where is the gas density profile, which we assume to be NFW-like, and is the enclosed halo mass. We impose , so that the implemented mass accretion onto the BH is given by the minimum between eq. (8) and the value required for to be equal to . The physical justification for this choice is that, at any given time, the shell of cooling circumgalactic gas that produces an accretion rate equal to is located - by definition - at ; thus the BH needs to heat all baryons within this radius in order to prevent the cooling material from accreting onto the galaxy. Since is an integrated quantity, at early times , and the BH population can grow unimpeded following eq. (8) and (10). Growth rates decrease dramatically when BHs enter the self-regulated, binding energy-limited accretion phase. Examples of BH mass built-up are given in Section 4.1.
A key choice that we make is that, at times when the BH is in the self-regulated phase, we also stop the stellar mass growth. In other words, AGN-driven feedback in our model has two main effects: it quenches star formation and regulates BH accretion. In principle this phase is not permanent, given that at subsequent times the halo accretes new material and the gas cooling proceeds, effectively increasing . In practice though, as we discuss in the main text, we find that once a BH enters the self-regulated phase it never leaves it, and star formation remains suppressed for the rest of the galaxy lifetime.