Roughness and Correlations in the Transition from Island to Film Growth: Simulations and Application to CdTe Deposition
Abstract
Using kinetic Monte Carlo simulations, we develop a framework to relate morphological properties and microscopic dynamics during island growth, coalescence, and initial formation of continuous heteroepitaxial films. The average island width is controlled by adatom mobility on the substrate. Subsequent evolution strongly depends on the Ehrlich-Schwöebel energy barrier of the deposited material. As decreases, islands becomes taller and their coalescence is delayed. For small islands and large , the global roughness increases as and the local roughness increases at short scales (apparent anomalous scaling) before and after island coalescence. If the islands are wide, may have a plateau for large and has a maximum for small when the islands coalesce. This framework is applied to atomic-force microscopy data of the initial stages of CdTe deposition on Kapton: a maximum of during island coalescence indicates negligible ES barrier, consistently with scaling properties of much thicker films, and the diffusion coefficient on the Kapton surface at is estimated. Applications of the framework to other materials are suggested, in which the expected roles of ES barriers are highlighted.
keywords:
thin films , heteroepitaxy , islands , roughness , kinetic Monte Carlo , cadmium telluride1 Introduction
Solid films deposited from vapor or in solution have a large variety of technological applications [1], which explain the efforts to understand the relations between their morphological properties and microscopic dynamics. The film properties depend on the initial stages of deposition because the nucleation, growth, and coalescence of islands affect, for instance, the grain crystallography and the formation of grain boundaries [2, 3, 4, 5]. Modeling the microscopic interactions of atoms or molecules may be useful to determine those properties. For instance, the geometry of islands and mounds in the homoepitaxial growth of some metals was already described and the activation energies of adatom diffusion in different local surface configurations was determined [6, 7, 8, 9, 10, 11]. However, this is more difficult when atoms or molecules are deposited on weakly interacting substrates, in which wide and thick three-dimensional islands are formed (Volmer-Weber mode). This growth mode is observed in the deposition of a large variety of materials, such as metals, semiconductors, molecular compounds, and organic molecules, depending on the substrate used. For the deposition of thermally evaporated transition metals on substrates such as oxides and graphene, some atomistic models were also developed; in general, they are nontrivial extensions of the models used for homoepitaxy [12, 13, 14].
On the other hand, after a continuous film is formed, dynamic scaling of the surface fluctuations is frequently used to identify the universality class of film roughening [15]. This approach helps to infer the main physical processes that control the growth and was already applied to deposits of various materials [15, 16, 17]. Several works have also investigated the scaling of surface fluctuations and correlations in the initial stages of heteroepitaxial film deposition [18, 19, 20, 21, 22, 23, 24, 25, 26, 27, 28, 29, 30, 31]. Their results cannot be interpreted in the light of kinetic roughening theories because the deposits are mostly formed by isolated islands, so that height fluctuations and correlations are related to island widths, heights, and surface density. Thus, a relevant question is whether surface fluctuations and correlations at those initial deposition stages can be related to the microscopic growth dynamics, independently of a specific atomistic modeling and of dynamic scaling analysis.
The first aim of our work is to investigate this question in a model for heteroepitaxial film growth using kinetic Monte Carlo simulations. The study considers a broad range of parameters that represent the interplay of atomic or molecular flux and their diffusion after adsorption. The surface roughness (local and global) and the autocorrelation function are measured from the island growth to the formation of a continuous film. In the transition between these regimes, those quantities are shown to be related to microscopic parameters that control the film growth, with particular relevance for the Ehrlich-Schwöebel (ES) [32] barriers at step edges. Applications to previous works on growth of metalic and organic films are discussed.
Our second aim is to validate this theoretical framework in the study of the initial stages of CdTe film deposition on Kapton. CdTe is a direct gap semiconductor widely used in solar cells and other optoelectronic devices [33] and polyimide substrates are advantageous for their lightness and flexibility [34, 35]. These substrates constrain deposition to relatively low temperatures (compared e.g. with glass), but this feature is important to reduce production costs [35] and CdTe cells on Kapton have conversion efficiencies exceeding [36].
Here, the observed features in the transition from CdTe island growth to continuous film formation suggest the presence of very small ES barriers, a result consistent with the previous observation of Kardar-Parisi-Zhang (KPZ) [37] scaling of surface fluctuations in much thicker CdTe films.
2 Models and Methods
2.1 Experimental Methods
We thermally evaporated CdTe material ( purity, Sigma Aldrich) on cm polyimide foils (Kapton® HN, DuPont) using a home made hot wall epitaxy (HWE) growth system [38]. The HWE system consists of two independently controlled furnaces, used for source and substrate, separated by a shutter that prevents CdTe vapour to impinge on the substrate during thermalization and controls the beginning and the end of the growth process. The furnaces are installed inside a vacuum chamber. The deposition parameters are shown in Table 1.
| Pressure of vacuum chamber | torr |
|---|---|
| Reservoir temperature | |
| Substrate temperature | |
| Deposition rate | nm/min |
| Deposition times (min) | , , , , |
The substrate temperature used in our system is low compared to most industrial techniques to produce CdTe cells due to the choice of the flexible Kapton substrate. However, the high temperature techniques require controlled deposition atmospheres to avoid the desorption of CdTe from the substrate [35], which is not the case here. In the low temperature vapor deposition, no remarkable difference in CdTe crystal quality has been observed [35]. Moreover, this low temperature technique produces films with smaller roughness, which can be advantageous for optical applications [39].
The surface of each film was imaged with atomic force microscopy (AFM) (Ntegra Prima SPM, NT-MDT) operated in air, contact mode, using Si probes (CSG30, NT-MDT; radius 10 nm) [40]. We imaged several independent square patches of lateral size m over each film surface, otherwise specified. Lateral and vertical spatial resolutions were near m and nm, respectively. Each AFM image defines a scalar height field , from which we computed the global and local roughnesses [Eqs. (7) and (8) in Sec. 2.3] and the auto-correlation function [Eq. (9) in Sec. 2.3].
2.2 Simulation Methods
2.2.1 Deposition Model
The model is defined in a simple cubic lattice in which the lattice constant is the length unit and the lateral size is . The initially flat substrate is located at , the deposit grows in , and periodic boundary conditions are considered in the and directions. Each atom or molecule of the deposit occupies a single lattice site; for simplicity, hereafter we refer to the deposited species as an adatom. Solid-on-solid conditions are considered, so the films have no pores. A column of the deposit is defined as the set of adatoms with the same position; the height variable is the value of of the topmost adatom in that column.
The deposition occurs with a collimated flux of atoms per substrate site per unit time. In each deposition event, a column is randomly chosen and the adsorption of the incident atom occurs as it lands at the top of that column. Desorption is neglected.
Surface diffusion is modeled by hops of the adatoms at the top of the columns, with rates depending on their number of neareast neighbors (NNs). Substrate atoms/molecules are immobile. For a simple description of heteroepitaxy, the diffusion coefficient of an adatom is different at , where it is in contact with the substrate, and at the other layers, , where it is in contact only with the same species. If the adatom has no lateral NN (i.e. if it is on a terrace), the numbers of hop attempts per unit time depends on its current height: if it is at , if it is at . These rates have activated Ahrrenius forms
| (1) |
where is a frequency, and are activation energies, is the Boltzmann constant, and is the substrate temperature. Otherwise, if the adatom has lateral NNs, the hopping rates at and at are
| (2) |
where
| (3) |
Here, is a bond energy that represents the interaction with each lateral NN.
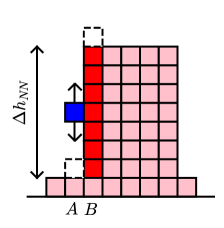
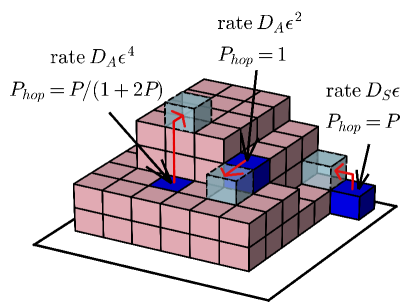
When an adatom attempts to hop, the direction is randomly chosen among the four NN columns, or . If the chosen column has the same height (i.e. a hop in the same layer), the adatom moves with probability . Otherwise, if the adatom attempts to hop to a layer at a different height , there is an additional energy barrier for crossing the step edge, which is the Ehrlich-Schwöebel (ES) barrier [32], with activation energy . If the height difference between the columns is large [e.g. columns A and B of Fig. 1(a)], the solid-on-solid constraint in a simple cubic lattice implies that the adatom has to hop from the top of one column to the top of the other. Thus, besides representing the step edge barrier, the probability of the hop between those points also has to represent the adatom motion along a vertical terrace of length separating the initial and final positions; see Fig. 1(a). The relevance of mass transport in faceted island walls is shown, for instance, in recent simulations of Ag deposition on weakly interacting substrates [14]. Considering that the probability of the adatom to return to the original position before reaching the other layer increases with , Ref. [41] proposed that the overall probability of executing the hop should be expressed as
| (4) |
With probability , the adatom remains at the current position. Also note that the probability is considered for downwards and upwards hops.
Fig. 1(b) illustrates the possible hops of some adatoms and show their corresponding probabilities.
The interplay between temperature and flux is represented by the diffusion-to-deposition ratios defined as
| (5) |
They are interpreted as the average numbers of hops of terrace adatoms during the average time of deposition of one atomic layer. In heteroepitaxy, the adatom interaction with the substrate is weaker than the interaction with other adatoms, so that ; consequently, and . Throughout this work, the dimensionless parameters that represent the growth conditions are the ratios and , the detachment probability , and the probability of crossing a monolayer step edge.
This model is an extension of the Clarke-Vvedensky (CV) model [42] of thin film growth, in which the hop frequency is , where is the reduced Planck’s constant, as predicted by transition state theory. However, it is also frequent that a constant (set e.g. as ) is used in simulation and analytical works [5]. This choice weakly affects the results because temperature variations have much stronger effects on the Boltzmann factors of Eqs. (1), (3), and (4).
In the presentation of simulation results, we use the dimensionless film thickness
| (6) |
This is the average number of deposited atoms per substrate site at time or, alternatively, the number of deposited monolayers.
2.2.2 Simulation Details
We performed simulations in lattices with , in which finite size effects are small. The maximal dimensionless film thickness is . For each parameter set, we generated deposits and observed small fluctuations in the average quantities.
Table 2 shows the simulated parameter sets that are presented in this work, labeled from A to P. Simulations with other parameter sets were also performed, which support the conclusions stated here. The ratio ranges between and , which is typical of epitaxial growth in broad temperature ranges [5, 43]. The ratio is – times larger than , which corresponds to a facilitated diffusion in the substrate. The detachment probability ranges between and . The step-edge probability is chosen in the range –, where the highest value indicates the absence of the ES barrier.
| Set | ||||
|---|---|---|---|---|
| A | ||||
| B | ||||
| C | ||||
| D | ||||
| E | ||||
| F | ||||
| G | ||||
| H | ||||
| I | ||||
| J | ||||
| K | ||||
| L | ||||
| M | ||||
| N | ||||
| O | ||||
| P |
The simulations are implemented with a kinetic Monte Carlo algorithm described in detail in Ref. [43].
2.3 Basic Quantities
The height fluctuations are monitored with the calculation of the global roughness defined as
| (7) |
Here the overbars denote a spatial average and the angular brackets denote an average over different configurations with a given thickness. The asperity of the surface in square observation windows of lateral size is quantified by the local surface roughness
| (8) |
where the inner brackets (with subindex ) denote the averages inside an observation window and the outer brackets denote averages over different window positions and over different deposits with the same thickness.
The autocorrelation function, which measures the correlations in the heigth fluctuations at a distance , is defined as [16]
| (9) |
Here the configurational average is taken over different initial positions , different orientations of (directions and ), and different deposits, and is a global square roughness defined as in Eq. (7) but without taking the square root of the spatial average. With this definition, for in any thickness.
The autocorrelation function of mounded surfaces usually has the first minimum at a position that approximates the average distance between the top of the hills and the bottom of the valleys [16]. Here, is used to characterize the deposit patterns before, during, and after island coalescence.
In the simulation data, , , and are dimensionless quantities measured in units of the lattice constant. In the experimental data, the global and the local roughnesses are in nanometers, whereas is in micrometers. The height is measured in nanometers, as explained in Sec. 2.1.
During the simulations, isolated islands are formed at short times and eventually coalesce. Our definition of islands considers only the occupation of the level , in which two adatoms belong to the same island if they are NNs. The enumeration of islands is performed with the Hoshen-Kopelman algorithm [44]. The island density is defined as the number of islands per substrate site.
3 Results of CdTe Deposition
Figures 2(a)-(f) show typical surface images of the initial stages of CdTe deposition. The substrate surface [Fig. 2(a), ] has nm. At min, several islands with heights up to nm are formed and the average thickness is nm. The deepest regions in Fig. 2(b) (darkest colors) have CdTe coverages much smaller than the average thickness or the island heights. At min, the average thickness is nm and the heights of several islands are close to nm, so the same interpretation holds for the deepest regions of the image in Fig. 2(c). At min [Fig. 2(e)], a different scenario starts to appear because the maximal height differences and the average thickness have approximately the same value nm, which suggests that most of the substrate area (possibly all that area) is already covered by CdTe. In other words, at that time, island coalescence is complete or almost complete. At the longest time [ min; Fig. 2(f)], the average thickness increased to nm but the height fluctuations had a sharp decrease and are limited to nm. This indicates that a smoothening process takes place in the transition from island coalescence to continuous film formation.
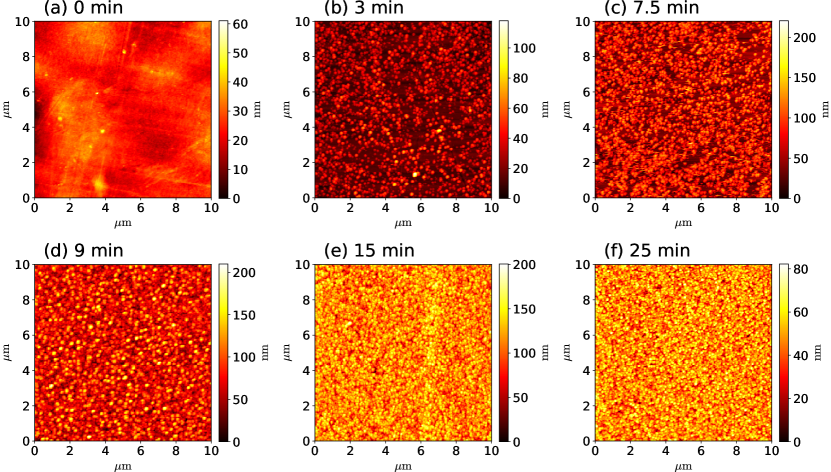
Figure 3(a) shows the autocorrelation function at the same deposition times. The curves for min show minima at m, which are of the same order of magnitude as the island sizes. Figure 3(b) shows the evolution of the global roughness. It has the largest values nm at min and min, and then decreases to a value nm at min. In Ref. [45], it was shown that the roughness of these CdTe films fluctuates between nm and nm until s of deposition. This confirms that there is smoothening of the surface after the island coalescence and the initial formation of a continuous film.
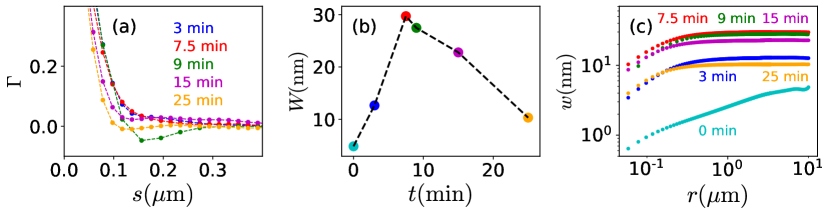
Figure 3(c) shows the local roughness as a function of the window size for several growth times. The plots at min and min show increasing in time for all . This split of a plot in all scales is a typical feature of systems with anomalous roughening [46]. However, the interpretation of the present results cannot follow theories of anomalous roughening because this is a transient feature related to the initial island pattern. Similar conclusion was drawn in Ref. [40]. From min to min, the changes in for all window sizes are smaller than the changes formerly observed. Finally, at min, the roughness has decreased at all scales, confirming the smoothening when the continuous film is formed.
4 Simulation Results
4.1 Island Growth
Here we analyze the island features for deposition of one atomic layer, i.e. dimensionless film thickness .
Figure 4(a) shows an image of a deposit obtained with the parameter set D, in which the bonds with lateral NN are strong and the ES barrier is large. The average island size is small and their borders are disordered. At , branched clusters are formed because and are relatively small and prevent the adatom detachment from NNs. A small occupation of the layers with is observed due to restrictions to interlayer transport. If or are smaller than the present values by two or more orders of magnitude, branched islands are also formed in the first layer.
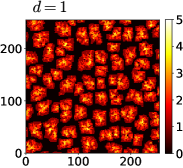
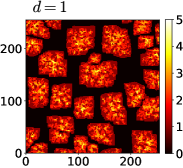
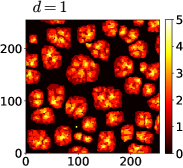
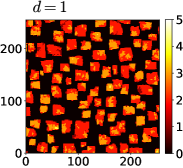
Figure 4(b) shows an image of a deposit obtained with a larger diffusion coefficient at the substrate in comparison with Fig. 4(a). The island size increases because coarsening is facilitated during the initial deposition stages, but branched structures are still being formed on the top of the islands. We checked that changes in have little effect on island density (measured at ), but larger produces more compact structures at the layers with . Figure 4(c) shows an island configuration obtained with the same parameters as in Fig. 4(a), but with larger detachment probability . This leads to a decrease in island density (increase in the island size) and helps the formation of more compact structures at all layers.
Finally, Fig. 4(d) shows the effect of a negligible step-edge barrier, , while the other parameters remain the same as in Fig. 4(a). This change has little effect on island density. However, now the islands are higher and more compact; the clusters at the upper layers () are also more compact. This is a consequence of facilitated transport from the substrate to the top of the islands, particularly for the adatoms with small numbers of lateral bonds. The widths of the gaps between the islands increase, so a smaller ES barrier delays island coalescence (as will be confirmed later).
Previous works on submonolayer island growth, in which the dynamics is restricted to the first layer, obtained scaling relations for the island density in terms of and for small coverages (typically ) [47, 48, 49]. In conditions of facile detachment of low-bonded atoms () from islands, it was predicted that and that the island density scales as [49]
| (10) |
where is a scaling function. For , the dependence of on is weak, so Eq. (10) implies [49].
Here we measured by the occupancy of the level in deposits with one monolayer (). In this case, there is significant occupancy of the levels , which differs from the submonolayer studies mentioned above. Despite this difference, Fig. 5 shows a good data collapse of as a function of . The deviations increase as increases because the effects of become more relevant when the mobility on the substrate is very large; indeed, interlayer transport depends not only on , but also on and .
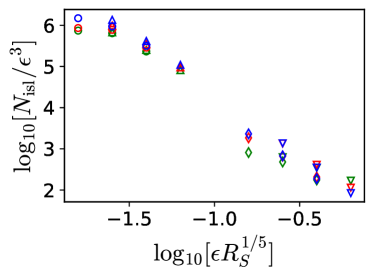
These results show that the relations obtained in low coverage submonolayers are also reasonable approximations for the island density with coverage of one monolayer. The smallest islands, which are obtained for the smallest , have less than adatoms in the first layer and widths lattice constants when they begin to coalesce. This width sets the crossover between the regimes of small and large islands in this model.
4.2 Film Formation with Large ES Barrier
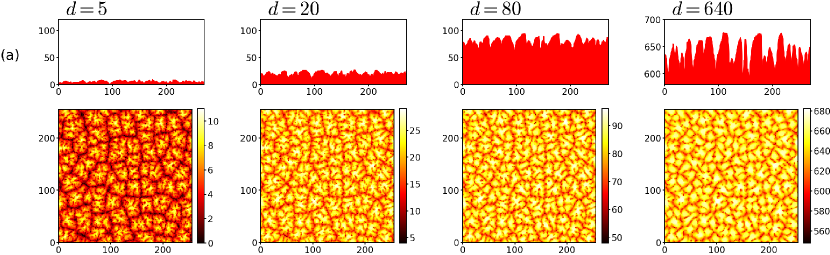
Here we consider , corresponding to a large ES barrier. Fig. 6(a) and 6(b) show top views and cross sections of deposits with several thicknesses grown with two parameter sets.
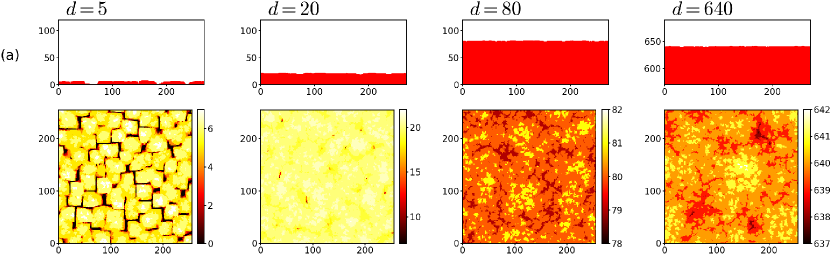
In Fig. 6(a), the parameters are the same of Fig. 4(a). For dimensionless thickness , all islands already coalesced into a single large domain, and for a continuous film is formed (minimum height is ). However, until the largest thickness (), the gaps between the initial islands are visible, showing that coarsening is very slow. Moreover, close inspection shows the formation of smaller sharp structures separated by other gaps. These features are representative of other deposits with small initial islands, which are obtained with small and .
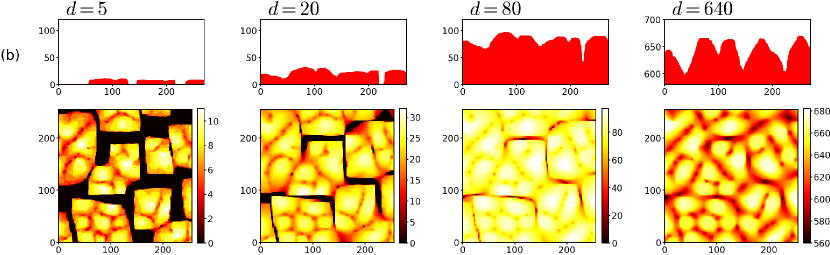
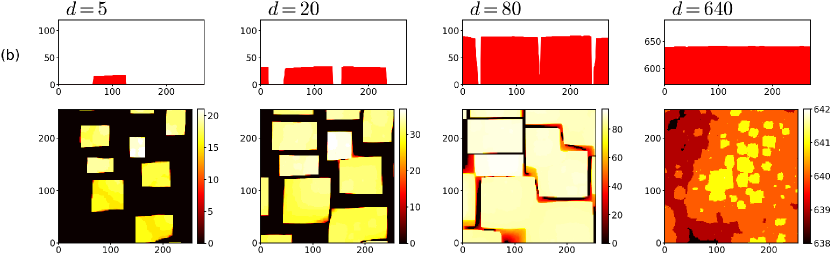
In Fig. 6(b), higher adatom mobility is considered. Larger islands are formed and they have already coalesced when , but some unfilled gaps remain until . It shows that the increase of adatom mobility delays island coalescence. At the top of each initial island, we observe the formation of some mounds; the mound widths are smaller than the island sizes because and they are rounded and smoother than the structures formed in Fig. 6(a) because and are larger. The pattern observed at the longest times mixes the initial island pattern with the mounded pattern formed on the top of those islands.
Figures 7(a) and 7(b) show the auto-correlation function as a function of the distance for the same parameters and film thicknesses of Figs. 6(a) and 6(b), respectively. The position of the first minimum of , which we denote as , indicates the typical distance between the top of the hills and the bottom of the valleys of the film surface. Before island coalescence and without mound formation on them, is related to the island size, as observed for in both cases. As the thickness increases, decreases. For , is related to the size of the mounds formed on the top of the initial islands; the mound slopes are increasing in the continuous film, which explains the deepening of the minimum.
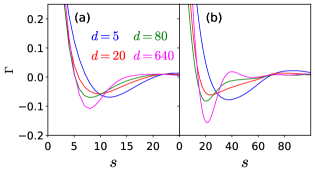
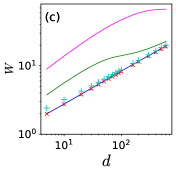
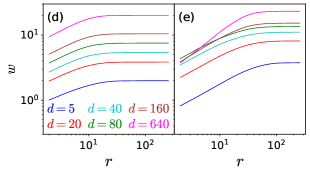
Figure 7(c) shows the evolution of the global roughness for five parameter sets. In the cases of small islands and rapid coalescence (), the data collapse into a single universal line with slope ; this is the case, for instance, with the parameter set D of the images in Fig. 6(a). They are cases with effectively random (uncorrelated) deposition, in which adatom diffusion is mostly restricted to terraces. However, for and , the large adatom mobility on the substrate facilitates mass transport to the top of the islands, despite the ES barrier. This leads to larger height differences between those islands and the substrate, i.e. larger , but slows down after island coalescence. For the parameter set K of the images in Fig. 6(b), the plot has an inflection and then continues to increase.
Figures 7(d) and 7(e) show the local roughness as a function of window size for the same parameter sets of Figs. 6(a) and 6(b), respectively, and several thicknesses. In both cases, during island growth, an apparent anomalous roughening is observed, in which increases for small as fast as does (large ). However, this is a transient behavior that should not be interpreted as true anomalous roughening [46]. Indeed, the subsequent evolution differs in the two cases. In Fig. 7(d), which is typical for small islands and rapid coalescence, the anomaly remains after the continuous film is formed. There are small correlations at short scales, which explain the increase of for , but uncorrelated growth in large scales. In Fig. 7(e), with larger , , and , larger islands are formed and slower variations of are observed after the continuous film formation, in small or large windows.
In all cases, when the film thickness is sufficiently large and the memory of the island pattern has disappeared, the large ES barrier is expected to lead to true anomalous roughening in all cases, as observed in other deposition processes with constrained interlayer transport [41, 50, 51]. However, the larger the initial islands, the longer the time for attaining this regime. For this reason, for , Fig. 7(c) only shows a maximum of for the largest simulated thicknesses.
4.3 Film Formation without ES Barrier
The transition from island coalescence to continuous film growth for () is illustrated in Figs. 8(a) and 8(b) for the parameter sets F and M, respectively. In the former, the small islands have already coalesced with deposited layers, forming a large cluster with narrow gaps. For , a mounded topography is reminiscent of the island pattern, but for the surface has no feature of the initial islands; in the largest thickness, it has large terraces with disordered borders. The same features are observed in other cases where small islands are formed. In Fig. 8(b), the islands are larger, taller, and more distant from each other, so the coalescence is only observed in the panel of . Subsequently, the gaps between the islands are rapidly filled and there is no evidence of their formation when . For this thickness, the surface has large terraces with smooth borders, as a consequence of large and . Comparison with Fig. 6(b) (where the growth parameters are the same, except ) shows that a smaller ES barrier delays the island coalescence.
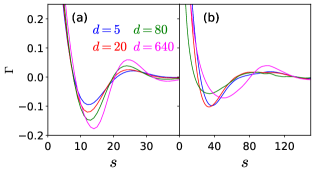
Figures 9(a) and 9(b) show the auto-correlation function as a function of the distance for the same parameters and film thicknesses of Figs. 8(a) and 8(b), respectively. For , has a deep minimum in both cases and is nearly half of the average island size. In the smallest mobility case, a shallow minimum of is observed for , which is consistent with the absence of surface patterns. In the largest mobility case, has no minimum at , but for it displays a minimum at , which accounts for the terraces shown in Fig. 8(b) (whose borders approximately follow the lattice directions).
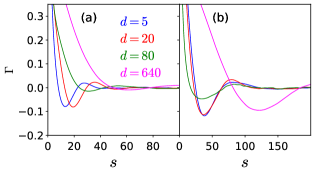
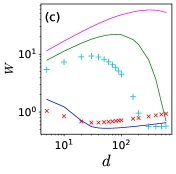
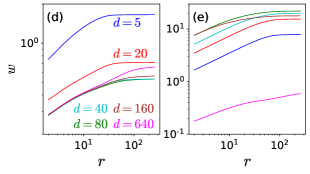
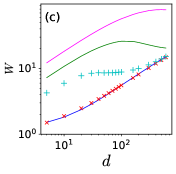
Figure 9(c) shows the global roughness as a function of the thickness for five parameter sets. In all cases, has a maximum at the thickness in which most of the islands have already coalesced but the gaps between them were not filled yet. When small islands are formed, the maximum of is shown at [note that Fig. 9(c) has data only for ]. For the parameter set of Fig. 8(b), the maximum is at . The initial rapid growth of is a consequence of the rapid increase of the island heigths, which is possible because the interlayer transport is facilitated. The subsequent decrease is a consequence of the formation of a continuous film, in which the facile interlayer transport rapidly suppresses the large height differences. This type of smoothening process is similar to that observed in high temperature deposition on rough substrates [52].
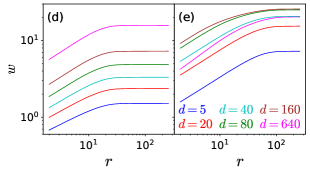
Figs. 9(d) and 9(e) show as a function of for the parameter sets of Figs. 8(a) and 8(b), respectively, and several thicknesses. The apparent anomalous scaling is observed in Fig. 9(e) (large islands) in the regime of island growth, but it ceases when the islands coalesce. During this coalescence and formation of a continuous film, the plot is displaced down as the thickness increases, i.e. the height fluctuations decrease at all lengthscales; this is expected in a smoothening process.
When the global roughness decreases to a value (i.e. near one lattice constant), the memory of the initial islands is already lost and subsequent growth occurs as in initially flat substrates. The roughening is that of the CV model without ES barriers [53, 54] and, for , the growth is almost layer by layer in experimentally reasonable film thicknesses [55]. For instance, in Fig. 9(d), from to and the plot is consistent with the normal roughening of the CV model with large , in which increases only in the largest windows [53]. Moreover, the initial decay of becomes slower as the film grows, which accounts for a time increasing correlation length of the fluctuations of a self-afine surface [16]. However, in Fig. 9(e), this regime begins at because island coalescence occurs at longer times.
4.4 Film Formation with Small ES Barrier
Here we analyze the deposition with , corresponding to a small ES barrier. Figures 10(a) and 10(b) show the surfaces of the deposits for the sets E and L, respectively, with several thicknesses. The increase of adatom mobility also leads to formation of larger and taller islands and a delay of their coalescence. As in the case of large ES barrier, the initial gaps between the islands are still visible in the thickest films, particularly in the case of smaller adatom mobility [Fig. 10(a)]. However, smoother structures are observed on the top of the initial islands.
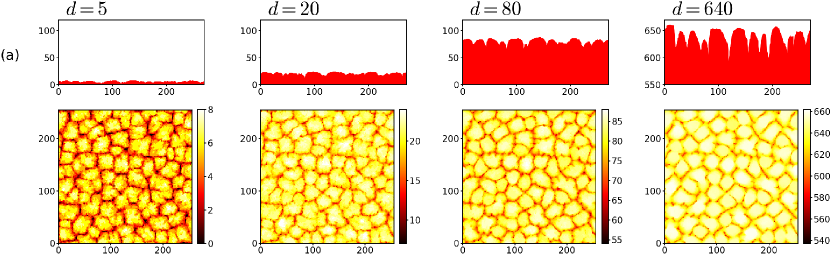
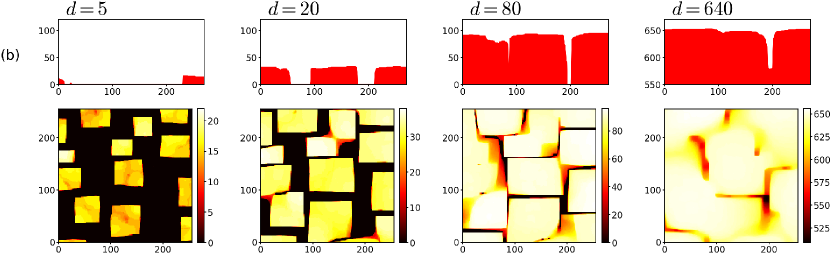
Fig. 11 shows the auto-correlation function [(a), (b)], the global roughness (c), and the local roughness [(d), (e)], for several deposition parameters and thicknesses.
For the case of small islands, illustrated in Fig. 10(a), the minimum of shown in Fig. 11(a) has an increasing depth but is almost constant, which indicates the continuous enhancement of the initial island pattern. In Fig. 11(d), shows an apparent anomaly, in which it increases with the thickness for small and large . The corresponding global roughness [Fig. 11(c)] slowly increases for small thicknesses, but subsequently scales as , with a prefactor smaller than that obtained for large ES barrier [Fig. 7(c)]. This means that a weaker ES barrier enhances the correlations at small scales, but the growth is still uncorrelated at length scales larger than the island size. If the values of , , or are smaller than those of Fig. 10(a), we obtain results similar to those of large ES barrier, as described in Sec. 4.2.
In the case of larger islands, illustrated in Fig. 10(b), there is coarsening of the structures formed on the top of the islands because the ES barrier is small. In the thickest films, the minimum of is shallower and is larger [Fig. 11(b)]. remains approximately constant in and [Fig. 11(c)] and decreases in the largest thicknesses. The local roughness for small windows follows the same trend [Fig. 11(e)]. Plateaus of are also observed for other model parameters in Fig. 11(c); they indicate a balance between mechanisms of roughening (typical of large ) and smoothening (typical of ). If , , and exceed the values of Fig. 10(b) by factors , the results are similar, although the roughness may have a small decrease at the largest thicknesses.
The general trend observed here is that, with small adatom mobility, the ES barrier controls the transition from island to film growth, as in the case of large ES barrier. However, large adatom mobility may affect the transition properties.
5 Discussion
5.1 A Framework to Analyze the Transition from Island to Film Growth
The island density is approximately predicted by previous results of low coverage submonolayer growth [49] in terms of the diffusion coefficient of atoms/molecules on the substrate and of their probabilities of detachment from NNs. Larger diffusivity on the substrate generally leads to wider islands. The ES barrier has a weak effect on the island density and, consequently, a weak effect on the island width before coalescence. However, since the ES barrier controls the transport from the substrate to the island tops, a smaller favors the formation of taller islands, which delays the island coalescence.
If the islands are small (widths lattice constants), the coalescence occurs at short times and the ES barrier is the main quantity that affects the subsequent morphology. For large barriers, the initial island pattern remains at the surface until long times after the continuous film formation; the global roughness has an uncorrelated increase with the thickness () and the local roughness shows an apparent anomalous scaling. Instead, with negligible ES barrier, there is a smoothening process as the islands coalesce and a continuous film begins to grow; this is followed by a normal roughening regime.
If the islands are large, is large at short times and reaches a plateau or a maximum as the islands coalesce. For large ES barriers, mounds with increasing slopes grow on the top of the initial islands, so the plateau is followed by a regime in which increases (this may take a long time depending on the island size); the local roughness shows an anomalous behavior before and after island coalescence. With negligible ES barrier, has a maximum when the islands coalesce and decreases with the formation of a continuous film (but may slowly grow at longer times). Similar features were recently observed in Ref. [56].
In the regimes of island growth and coalescence, the local roughness follows the same trend of the global roughness in small and large window sizes; this includes the cases in which decreases with the thickness (smoothening). The position of the first minimum of the autocorrelation function, , may be used to determine a characteristic lateral size of the surface patterns: initially, it is related to the widths of the islands; after they coalesce, if large and rounded mounds are formed, their sizes are related to .
5.2 The Kinetics of Low Temperature CdTe Deposition on Kapton
The autocorrelation function in the intial stages of the CdTe film growth [Figs. 3(a)] has shallow minima at nm, which correspond to island sizes nm. Considering that the lattice constant of the CdTe crystal is nm and using this value in the model, rough estimates of the island sizes are lattice constant units. This gives dimensionless island densities (i.e. number of islands per substrate site) . Here we consider the scaling predicted in Ref. [49] for not too large, as discussed in Sec. 4.1 [i.e. a limit of Eq. (10) in which weakly depends on ]. It gives , which is actually a condition of large mobility in our model. Considering the deposition rate of nm/min, the diffusion coefficient of CdTe on the Kapton surface is estimated as at .
The variations of global and local roughness in the transition from island to continuous CdTe film growth have many similarities with those observed in our model with large adatom mobility (simulations with and ) but also with negligible ES barrier (). First, the plots have maxima when the islands are coalescing; see Figs. 3(b) for CdTe and 9(c) for the model. Second, the plots are initially displaced to larger values as the thickness increases and, after island coalescence, they are displaced to smaller values as increases; see Figs. 3(c) for CdTe and 9(e) for the model.
The kinetic roughening of much thicker CdTe films was already studied. [57, 45]. In Ref. [45], the global roughness of films deposited on Kapton fluctuate between nm and nm for thicknesses between nm and m. In films thicker than m, it increases as , which is the scaling of the KPZ class. The distributions of heights, local roughness, and extremal heights of those films also agree with numerically estimated KPZ distributions. The same KPZ scaling is also observed in thick CdTe films on Si(001) substrates [57].
KPZ scaling is a type of normal roughening, in opposition to anomalous roughening [46, 58]; in other words, in KPZ growth, the local roughness is time independent in small windows (except for vanishing corrections) and increases in time in windows of the order of the lateral correlation length or larger. Normal roughening is not obtained with ES barriers. For instance, Ref. [41] simulated the same model studied here using and eV () and showed a columnar morphology, while the roughness scaled as . Models of homoepitaxial growth with step edge barriers shows mound formation [5], in which anomalous roughening is expected. For these reasons, the observed KPZ scaling in thick CdTe films can be explained only if the ES barrier is very small.
Thus, the framework developed here to analyze the roughness evolution at short deposition times gives a result consistent with the dynamic scaling applied to long deposition times. Moreover, it becomes clear that the approach to analyze short time features is very different from that of dynamic scaling; for instance, the displacement of plots to larger values before island coalescence cannot be interpreted as anomalous roughening, and the subsequent smoothening is inconsistent with the usual dynamic scaling relations.
Although our model qualitatively explains the transition from island to film formation, it cannot be used for a quantitative description of the island morphology because it is built on a simple cubic lattice. The model is also not suitable for a quantitative description of the polycrystalline structures of thick CdTe films [57, 45]. Despite these limitations, the compatibility with negligible ES barriers and the estimate of the diffusion coefficient on Kapton may be important for future quantitative modeling of vapour deposited CdTe films.
5.3 Possible Applications to the Deposition of Other Materials
Here we show that some published experimental results on different materials are qualitatively similar to simulation results of this work.
We begin with two recent works on thermally evaporated perovskite films. In Ref. [24], MAPbI3 films (MA=) were deposited on a Si substrate whose roughness was nm. The first AFM image of the deposit, obtained at s, showed isolated islands with heights nm covering part of the substrate and showed that the global roughness increased to nm; subsequently, the islands coalesced while decreased to values smaller than nm; continued deposition to a maximal thickness of nm led to a small increase in . In Ref. [30], MAPbBr3 films were deposited on SiO2 and ITO substrates whose initial roughnesses were nm and nm, respectively. In deposition at C, the measured roughness increased to nm when islands partially covered the substrates (thickness nm), decreased to nm when there was significant island coalescence (thickness nm), and then decreased to nm (thickness nm). In both cases, our model suggests that the ES barriers for diffusion of adsorbed molecules weakly affect the island growth and the transition to a continuous film. Moreover, the roughness evolution is similar to that of our model for relatively low mobility on the substrate [Fig. 9(c), ], in which the maximal values of the roughness are obtained at very short times, possibly before the island coalescence.
There are also experiments with different initial evolutions of the roughness and of the surface correlations. In the sputtering deposition of Ta films by Yang et al [21], the roughness slowly varies as before the island coalescence, which indicates that the average island height slowly increases, but the scaling changes to when a continuous film grows. Those authors proposed a mechanistic model in which the gaps between the islands remain after their coalescence. In a work with a molecular beam deposition setup, Gedda et al [22] grew cobalt phthalocyanine films on a SiO2/Si(001) substrate whose roughness was nm. Their AFM images illustrate the transition from island to film growth at substrate temperature C. The roughness in this regime varies as , but the slope of the plot increases after the continuous film is formed. The HHCF (height-height correlation function) curves at different times are slightly split, which suggests anomalous scaling. In both cases, our simulation results suggest the presence of large ES barriers in the deposited materials.
Our simulations also suggest an interpretation of the results of copper electrodeposition by Guo and Searson [59]. Using a solution with sulfates, they electrodeposited disk-shaped cooper islands on RuO2 . During the island growth, there is an increase of the global roughness and an apparent anomaly of the local roughness, which increases in time for small and for large windows with the same exponent. During and after island coalescence, is approximately constant in time for all length scales, with the global value near nm. In the same work, the electrodeposition was performed in perchlorate solutions, which produces hemispherical islands. Similar evolutions of and are observed before island coalescence, then reaches a plateau ( nm) when they coalesce, and subsequently decreases to nm. The simulation results with large may explain the large island sizes and, combined with a small ES barrier (), explain the evolution of the roughness (global and local). The maintainance of a large roughness up to a nominal thickness of m and almost h of deposition may be interpreted as a consequence of balanced mechanisms of smoothening and roughening, as observed in the simulations with small (but not negligible) ES barriers [Fig. 11(c)].
6 Conclusion
Kinetic Monte Carlo simulations of a heteroepitaxial film growth model were performed to investigate the transitions between the regimes of island growth, island coalescence, and continuous film growth. The global roughness, the local roughness, and the autocorrelation function were calculated. From the results obtained for broad ranges of model parameters, we developed a framework to relate the evolution of those quantities to the microscopic properties of the growing material, independently of a dynamic scaling methods. This framework emphasizes the interplay between the diffusion coefficients of atoms/molecules on the substrate (which set the island width) and the ES barrier for crossing step edges (which affects island coalescence and film coarsening).
We also used AFM images to study those transitions in the initial stages of vapor phase deposition of CdTe on Kapton using the hot wall technique. When the islands coalesce, the global roughness reaches a maximal value nm, which decreases to nm when a continuous film (thickness nm) is formed. The increase and decrease of is accompanied by corresponding increase and decrease of the local roughness at short and large windows. The comparison with the simulation results suggests that the ES barriers are negligible in the initial stages of CdTe film deposition. Much thicker CdTe films show changes in crystalline grain orientation, but the observed KPZ scaling [45] is also consistent with small ES barriers, which consequently seems to be a feature of the whole film growth. The comparison with the simulation results also predicts a large mobility of CdTe on the Kapton surface, with diffusion coefficient estimated as at .
The application of our theoretical framework to analyze the deposition of other materials was also discussed, including perovskite, metallic, and organic films on several substrates. This analysis distinguishes cases in which large, small, or negligible ES barriers are expected to be present and cases of small or large mobility of the deposited species. We expect that these results may be useful for future modeling of those materials. We also expect that our methods can be extended to model other features in the transition from islands to continuous films, e.g. those recently observed in the deposition of other organic films [28, 29].
Acknowledgments
The authors acknowledge support of the Brazilian agency CAPES for an interinstitutional cooperation project (Procad 88881.068506/2014-01). TBTT is supported by CAPES (PNPD20130933 - 31003010002P7). RA is supported by CAPES (88887.370801/2019-00 - PrInt). SOF is supported by CNPq (436534/2018-5 and 303153/2018-0) and FAPEMIG (APQ-00371-17). FDAAR is supported by CNPq (305391/2018-6) and FAPERJ (E-26/210.354/2018 and E-26/202.881/2018).
References
- [1] M. Ohring, Materials science of thin films - deposition and structure, 2nd ed., Academic Press, New York, USA, 2001.
- [2] T. Michely, J. Krug, Islands, Mounds, and Atoms, Springer, 2003.
- [3] Z. Zhang, M. G. Lagally, Atomistic processes in the early stages of thin-film growth, Science 276 (5311) (1997) 377–383. doi:10.1126/science.276.5311.377.
- [4] C. Ratsch, J. A. Venables, Nucleation theory and the early stages of thin film growth, J. Vacuum Sci. Technol. A 21 (5) (2003) S96–S109. doi:10.1116/1.1600454.
- [5] J. W. Evans, P. A. Thiel, M. C. Bartelt, Morphological evolution during epitaxial thin film growth: Formation of 2D islands and 3D mounds, Surface Science Reports 61 (1) (2006) 1 – 128. doi:10.1016/j.surfrep.2005.08.004.
-
[6]
J. A. Stroscio, D. T. Pierce, M. D. Stiles, A. Zangwill, L. M. Sander,
Coarsening of
unstable surface features during Fe(001) homoepitaxy, Phys. Rev. Lett. 75
(1995) 4246–4249.
doi:10.1103/PhysRevLett.75.4246.
URL https://link.aps.org/doi/10.1103/PhysRevLett.75.4246 -
[7]
M. Kalff, P. Smilauer, G. Comsa, T. Michely,
No
coarsening in Pt(111) homoepitaxy, Surf. Sci. 426 (3) (1999) L447 – L453.
doi:10.1016/S0039-6028(99)00351-9.
URL http://www.sciencedirect.com/science/article/pii/S0039602899003519 -
[8]
C. R. Stoldt, K. J. Caspersen, M. C. Bartelt, C. J. Jenks, J. W. Evans, P. A.
Thiel, Using
temperature to tune film roughness: Nonintuitive behavior in a simple
system, Phys. Rev. Lett. 85 (2000) 800–803.
doi:10.1103/PhysRevLett.85.800.
URL https://link.aps.org/doi/10.1103/PhysRevLett.85.800 -
[9]
I. Furman, O. Biham, J.-K. Zuo, A. K. Swan, J. F. Wendelken,
Epitaxial growth
of Cu on Cu(001): Experiments and simulations, Phys. Rev. B 62 (2000)
R10649–R10652.
doi:10.1103/PhysRevB.62.R10649.
URL https://link.aps.org/doi/10.1103/PhysRevB.62.R10649 -
[10]
K. J. Caspersen, A. R. Layson, C. R. Stoldt, V. Fournee, P. A. Thiel, J. W.
Evans, Development
and ordering of mounds during metal(100) homoepitaxy, Phys. Rev. B 65 (2002)
193407.
doi:10.1103/PhysRevB.65.193407.
URL https://link.aps.org/doi/10.1103/PhysRevB.65.193407 -
[11]
J. Yu, J. G. Amar,
Effects of
short-range attraction in metal epitaxial growth, Phys. Rev. Lett. 89 (2002)
286103.
doi:10.1103/PhysRevLett.89.286103.
URL https://link.aps.org/doi/10.1103/PhysRevLett.89.286103 - [12] J. M. Warrender, M. J. Aziz, Effect of deposition rate on morphology evolution of metal-on-insulator films grown by pulsed laser deposition, Phys. Rev. B 76 (2007) 045414. doi:10.1103/PhysRevB.76.045414.
- [13] V. Elofsson, B. Lü, D. Magnfält, E. P. Münger, K. Sarakinos, Unravelling the physical mechanisms that determine microstructural evolution of ultrathin Volmer-Weber films, J. Appl. Phys. 116 (2014) 044302. doi:10.1063/1.4890522.
- [14] B. Lü, G. A. Almyras, V. Gervilla, J. E. Greene, K. Sarakinos, Formation and morphological evolution of self-similar 3D nanostructures on weakly interacting substrates, Phys. Rev. Mater. 2 (2018) 063401.
- [15] A. Barabási, H. E. Stanley, Fractal Concepts in Surface Growth, Cambridge University Press, New York, USA, 1995.
- [16] Y. Zhao, G. Wang, T. Lu, Characterization of Amorphous and Crystalline Rough Surface: Principles and Applications, Academic Press, San Diego, CA, USA, 2001.
- [17] J. Krug, Origins of scale invariance in growth processes, Advances in Physics 46 (2) (1997) 139–282. doi:10.1080/00018739700101498.
-
[18]
X. Zhang, E. Barrena, D. de Oteyza, H. Dosch,
Transition
from layer-by-layer to rapid roughening in the growth of DIP on SiO2,
Surf. Sci. 601 (12) (2007) 2420 – 2425.
doi:https://doi.org/10.1016/j.susc.2007.04.051.
URL http://www.sciencedirect.com/science/article/pii/S0039602807002786 - [19] L. Guo, P. C. Searson, Evolution of surface width in electrochemical nucleation and growth, Electrochem. Comm. 12 (2010) 431–434. doi:10.1016/j.elecom.2010.01.011.
- [20] I. Lee, E. Park, Anomalous kinetic roughening by chemical reaction-limited aggregation, J. Phys. Soc. Japan 80 (2011) 124602. doi:10.1143/JPSJ.80.124602.
- [21] J. J. Yang, J. Tang, N. Liu, F. Ma, W. Tang, K. W. Xu, Unstable kinetic roughening during the island coalescence stage of sputtered tantalum films, J. Appl. Phys. 111 (2012) 104303.
- [22] M. Gedda, N. V. V. Subbarao, D. K. Goswami, Local diffusion induced roughening in cobalt phthalocyanine thin film growth, Langmuir 30 (2014) 8735–8740.
- [23] W. Liao, J. G. Ekerdt, Ru nucleation and thin film smoothness improvement with ammonia during chemical vapor deposition, J. Vac. Sci. Technol. A 34 (2016) 031508. doi:10.1116/1.4944852.
- [24] Y. Liu, T. Zhou, M. Sun, D. Zhao, Q. Wei, Y. Sun, R. Wang, F. Jin, Q. Niu, Z. Su, Scaling behavior and morphology evolution of CH3NH3PbI3 perovskite thin films grown by thermal evaporation, Mater. Res. Express 4 (2017) 075510.
- [25] A. Agrawal, Y. Tchoe, H. Kim, J. Y. Park, Qualitative analysis of growth mechanism of polycrystalline InAs thin films grown by molecular beam epitaxy, Appl. Surf. Sci. 462 (2018) 81–85. doi:10.1016/j.apsusc.2018.08.076.
- [26] J. A. Creeden, S. E. Madaras, D. B. Beringer, I. Novikova, R. A. Lukaszew, Intrinsic anomalous scaling of epitaxial vanadium dioxide thin films on titanium dioxide, AIP Advances 9 (2019) 095045. doi:10.1063/1.5119790.
- [27] G. Pradhan, P. P. Dey, A. K. Sharma, Anomalous kinetic roughening in growth of MoS2 films under pulsed laser deposition, RSC Adv. 9 (2019) 12895–12905. doi:10.1039/c9ra01867k.
- [28] H. Spreitzer, B. Kaufmann, C. Ruzié, C. Röthel, T. Arnold, Y. H. Geerts, C. Teichert, R. Resel, A. O. F. Jones, Alkyl chain assisted thin film growth of 2,7-dioctyloxy-benzothienobenzothiophene, J. Mater. Chem. C 7 (2019) 8477–8484. doi:10.1039/c9tc01979k.
- [29] S. Chiodini, A. Straub, S. Donati, C. Albonetti, F. Borgatti, P. Stoliar, M. Murgia, F. Biscarini, Morphological transitions in organic ultrathin film growth imaged by in situ step-by-step atomic force microscopy, J. Phys. Chem. C 124 (2020) 14030–14042. doi:10.1021/acs.jpcc.0c03279.
- [30] S. Parveen, S. M. Obaidulla, P. Giri, Growth kinetics of hybrid perovskite thin films on different substrates at elevated temperature and its direct correlation with the microstructure and optical properties, Appl. Surf. Sci. 530 (2020) 147224.
-
[31]
V. Gervilla, G. Almyras, F. Thunström, J. Greene, K. Sarakinos,
Dynamics
of 3d-island growth on weakly-interacting substrates, Applied Surface
Science 488 (2019) 383–390.
doi:https://doi.org/10.1016/j.apsusc.2019.05.208.
URL https://www.sciencedirect.com/science/article/pii/S0169433219315168 - [32] R. L. Schwöebel, Step motion on crystal surfaces II, J. Appl. Phys. 40 (1969) 614.
- [33] J. D. Major, Grain boundaries in CdTe thin film solar cells: a review, Semicond. Sci. Technol. 31 (2016) 093001. doi:10.1088/0268-1242/31/9/093001.
- [34] X. Mathew, J. P. Enriquez, A. Romeo, A. N. Tiwari, CdTe/CdS solar cells on flexible substrates, Solar Energy 77 (2004) 831.
- [35] A. Romeo, E. Artegiani, D. Menossi, Low substrate temperature CdTe solar cells: A review, Solar Energy 175 (2018) 9–15.
- [36] A. Salavei, D. Menossi, F. Piccinelli, A. Kumar, G. Mariotto, M. Barbato, M. Meneghini, G. Meneghesso, S. Di Mare, E. Artegiani, A. Romeo, Comparison of high efficiency flexible CdTe solar cells on different substrates at low temperature deposition, Solar Energy 139 (2016) 13.
- [37] M. Kardar, G. Parisi, Y. Zhang, Dynamic scaling of growing interfaces, Phys. Rev. Lett. 56 (1986) 889–892. doi:10.1103/PhysRevLett.56.889.
- [38] S. O. Ferreira, E. C. Paiva, G. N. Fontes, B. R. A. Neves, Characterization of CdTe quantum dots grown on Si(111) by hot wall epitaxy, J. Appl. Phys. 93 (2) (2003) 1195–1198. doi:10.1063/1.1530364.
- [39] S. O. Ferreira, I. R. B. Ribeiro, J. Suela, I. L. Menezes-Sobrinho, S. C. Ferreira Jr., S. G. Alves, Effect of temperature on the Hurst and growth exponents of CdTe polycrystalline films, Appl. Phys. Lett. 88 (2006) 244102. doi:10.1063/1.2213512.
- [40] R. A. L. Almeida, S. O. Ferreira, I. R. B. Ribeiro, T. J. Oliveira, Temperature effect on (2+1) experimental Kardar-Parisi-Zhang growth, EPL 109 (2015) 46003.
- [41] F. F. Leal, S. C. Ferreira, S. O. Ferreira, Modelling of epitaxial film growth with an Ehrlich-Schwöebel barrier dependent on the step height, Journal of Physics: Condensed Matter 23 (29) (2011) 292201.
- [42] S. Clarke, D. D. Vvedensky, Growth kinetics and step density in reflection high-energy electron diffraction during molecular-beam epitaxy, J. Appl. Phys. 63 (1988) 2272. doi:10.1063/1.341041.
- [43] T. B. T. To, F. D. A. A. Reis, Domain formation in the deposition of thin films of two-component mixtures, J. Alloys Compd. 835 (2020) 155093.
- [44] J. Hoshen, R. Kopelman, Percolation and cluster distribution. I. Cluster multiple labeling technique and critical concentration algorithm, Phys. Rev. B 14 (1976) 3438–3445.
- [45] R. A. L. Almeida, S. O. Ferreira, I. Ferraz, T. J. Oliveira, Initial pseudo-steady state & asymptotic KPZ universality in semiconductor on polymer deposition, Sci. Rep. 7 (2017) 3773.
- [46] J. J. Ramasco, J. M. López, M. A. Rodríguez, Generic dynamic scaling in kinetic roughening, Phys. Rev. Lett. 84 (2000) 2199–2202.
- [47] C. Ratsch, P. Smilauer, A. Zangwill, D. D. Vvedensky, Submonolayer epitaxy without a critical nucleus, Surf. Sci. Lett. 329 (1995) L599–L604.
- [48] M. C. Bartelt, L. S. Perkins, J. W. Evans, Transitions in critical size for metal (100) homoepitaxy, Surf. Sci. Lett. 344 (1995) L1193–L1199.
- [49] T. J. Oliveira, F. D. A. Aarão Reis, Scaling in reversible submonolayer deposition, Phys. Rev. B 87 (2013) 235430. doi:10.1103/PhysRevB.87.235430.
- [50] F. F. Leal, T. J. Oliveira, S. C. Ferreira, Kinetic modelling of epitaxial film growth with up- and downward step barriers, J. Stat. Mech.: Theory and Experiment 2011 (2011) P09018.
- [51] P. Petrov, D. Gogova, Surface roughness evolution in a solid-on-solid model of epitaxial growth, Appl. Phys. A 118 (2014) 337–343.
- [52] T. A. de Assis, F. D. A. A. Reis, Smoothening in thin-film deposition on rough substrates, Phys. Rev. E 92 (2015) 052405.
- [53] T. A. de Assis, F. D. A. Aarão Reis, Dynamic scaling and temperature effects in thin film roughening, J. Stat. Mech.: Theory and Experiment 2015 (6) (2015) P06023.
- [54] I. S. S. Carrasco, T. J. Oliveira, Height fluctuations in homoepitaxial thin film growth: A numerical study, Phys. Rev. Res. 2 (2020) 013385. doi:10.1103/PhysRevResearch.2.013385.
- [55] E. E. M. Luis, I. S. S. Carrasco, T. A. de Assis, F. D. A. Aarão Reis, Statistics of adatom diffusion in a model of thin film growth, Phys. Rev. E 102 (2020) 012805. doi:10.1103/PhysRevE.102.012805.
-
[56]
E. Empting, M. Klopotek, A. Hinderhofer, F. Schreiber, M. Oettel,
Lattice gas study
of thin-film growth scenarios and transitions between them: Role of
substrate, Phys. Rev. E 103 (2021) 023302.
doi:10.1103/PhysRevE.103.023302.
URL https://link.aps.org/doi/10.1103/PhysRevE.103.023302 - [57] R. A. L. Almeida, S. O. Ferreira, T. J. Oliveira, F. D. A. Aarão Reis, Universal fluctuations in the growth of semiconductor thin films, Phys. Rev. B 89 (2014) 045309.
- [58] J. M. López, M. Castro, R. Gallego, Scaling of local slopes, conservation laws, and anomalous roughening in surface growth, Phys. Rev. Lett. 94 (2005) 166103. doi:10.1103/PhysRevLett.94.166103.
- [59] L. Guo, P. C. Searson, Evolution of surface width in electrochemical nucleation and growth, Electrochem. Comm. 12 (2010) 431–434.