Where infall meets outflows: turbulent dissipation probed by CH+ and Ly in the starburst/AGN galaxy group SMM J023990136 at z2.8
Abstract
We present a comparative analysis of the (1-0) and lines, observed with the Atacama Large Millimeter Array (ALMA) and Keck telescope respectively, in the field of the submillimetre-selected galaxy (SMG) SMM J023990136 at , which comprises a heavily obscured starburst galaxy and a broad absorption line quasar, immersed in a large nebula. This comparison highlights the critical role played by turbulence in channeling the energy across gas phases and scales, splitting the energy trail between hot/thermal and cool/turbulent phases in the circum-galactic medium (CGM). The unique chemical and spectroscopic properties of are used to infer the existence of a massive ( ), highly turbulent reservoir of diffuse molecular gas of radius kpc coinciding with the core of the nebula. The whole cool and cold CGM is shown to be inflowing towards the galaxies at a velocity 400 km s-1. Several kpc-scale shocks are detected tentatively in emission. Their specific location in space and velocity with respect to the high-velocity emission suggests that they lie at the interface of the inflowing CGM and the high-velocity emission, and signpost the feeding of CGM turbulence by AGN- and stellar-driven outflows. The mass and energy budgets of the CGM require net mass accretion at a rate commensurate with the star formation rate (SFR). From this similarity, we infer that the merger-driven burst of star formation and black-hole growth are ultimately fuelled by large-scale gas accretion.
keywords:
galaxies: high-redshift – galaxies: starburst – galaxies: intergalactic medium – galaxies: formation – turbulence – molecular processes1 Introduction
| Name | (h m s) | () | Description | References |
|---|---|---|---|---|
| ELAN | Enormous Ly nebula around the entire system | |||
| L1 | 02:39:51.815 a | 01:35:58.39 | Dusty BAL QSO | |
| L1N | 02:39:51.838c | 01:35:57.19 | Marginally extended and somewhat bluer northern companion to the QSO | |
| W1d | Feature extending westwards for several arcsec from BAL QSO, seen in CO(3–2) | |||
| L2 | 02:39:52.00b | 01:35:57.5 | Low-surface-brightness blue structure, east of BAL QSO | |
| L2SW | 02:39:51.951a | 01:35:58.92 | Highly obscured gas-rich starburst galaxy near BAL QSO | |
| L3 | 02:39:51.59b | 01:36:04.8 | Faint Ly blob |
Ivison
et al. (1998). Li et al. (2019). Vernet &
Cimatti (2001). Ivison
et al. (2010a). Frayer et al. (2018).
a Coordinates for L1 and L2SW are measured from the ALMA continuum imaging of Frayer et al. (2018), accurate to s and s in , respectively, and in . b For L2 and L3, the positions come from Li et al. (2019), corrected for the difference between their position for L1 and that of Frayer et al. (2018). c For L1N, the position comes from the Abell 370 Frontier Fields Hubble Space Telescope imaging of Lotz
et al. (2017), corrected for the difference between the position for L1 and that of Frayer et al. (2018). d The position of W1 cannot be given accurately because it is an extended and elongated source (see Fig. 5 in Frayer et al. (2018)).
In cosmological simulations, the growth of galaxies in the early Universe results from the accretion of pristine gas in virialized dark matter halos, modulo ejection of matter by stars and active galactic nuclei (AGN) (e.g. Schaye et al., 2015; Hopkins et al., 2018; Madau & Dickinson, 2014; Somerville & Davé, 2015; Tacconi et al., 2020). This gas regulation involves complex exchanges of mass and energy that take place in the circum-galactic medium (CGM) around growing galaxies. So, the CGM naturally holds many of the clues to the physics of galaxy evolution (Tumlinson et al., 2017; Hafen et al., 2019; Wright et al., 2020). The challenges raised by feedback, and by AGN-driven winds in particular, are so prodigious that they have only started to be touched by new generations of numerical simulations (e.g. Biernacki & Teyssier, 2018; Richings & Faucher-Giguère, 2018b; Costa et al., 2020; Davé et al., 2020).
Observationally, a new era is opening up (see the review of Hodge & da Cunha, 2020). While ejection is observed via ubiquitous ionised and neutral galactic winds (e.g. Rupke, 2018; Veilleux et al., 2020; Faisst et al., 2020) and contributes to the self-regulation of cosmic star formation, evidence of accretion is slowly building up (Bouché et al., 2013; Zabl et al., 2019; Schroetter et al., 2019; Bielby et al., 2020; Walter et al., 2020; Fu et al., 2021).
One new avenue is the direct detection of extended halos ( 10 kpc) of [CII] or CO emission around high-redshift galaxies (Ivison et al., 2010b; Ivison et al., 2011; Carilli & Walter, 2013; Tumlinson et al., 2017) but the dynamics of the gas traced by line emission of extended halos cannot be unambiguously ascribed to inflows or outflows (see e.g. Fujimoto et al., 2019). Only absorption lines provide the straightforward space-velocity information to disentangle inflows from outflows, without providing the physical origin of inflows, though.
As bright sub-millimetre sources, dusty starburst galaxies at high redshift provide unique background sources to probe the environment of growing galaxies using highly sensitive absorption spectroscopy in the sub-millimetre domain, just as quasars do in the visible domain. The power of absorption spectroscopy is even greater against gravitationally lensed starburst galaxies that allow far more sensitive detections. The sub-millimetre domain happens to be that of the fundamental transitions of light hydrides that, by linking hydrogen with heavy elements, are the very first steps of chemistry in space (Gerin et al., 2016). Light hydrides have very high dipole moments so that the critical density of their fundamental transition is orders of magnitude higher than that of CO(1–0), the usual tracer of molecular gas. In diffuse molecular gas, their =1 level is therefore weakly populated, so that molecular gas of low density () can be uniquely detected by absorption of the fundamental transition of light hydrides against sub-millimetre background sources (e.g. Riechers et al., 2013; Indriolo et al., 2018; Berta et al., 2021, for OH+ lines).
Among all hydrides, , one of the three first molecular species ever detected in space (Douglas & Herzberg, 1941), has unique chemical and spectroscopic properties, such that it highlights the sites of dissipation of mechanical energy (Draine, 1986; Gredel et al., 1993; Federman et al., 1996; Godard et al., 2009, 2014). Seen in absorption, it reveals not only the presence of low density molecular gas but also the trails of the supra-thermal energy in this medium. Turbulent transport in a biphase medium comprising cold ( K) and warm ( K) neutral phases may also contribute to production in diffuse gas (Valdivia et al., 2017). In either case, absorption of (1-0) traces the small pockets of "lukewarm" gas in a cold medium of low density. In the rest of the paper, the term "cool molecular gas" is adopted for the gas phase seen in (1-0) absorption 111We note here that cold for observers and cosmologists is K, while it is K or below for submillimetre astronomers, and K for radioastronomers, which is the temperature of the cold neutral medium (CNM) in thermal pressure balance with the warm neutral medium (WNM) at K. The cool molecular gas traced by (1-0) absorption is warmer than the bulk of star-forming molecular clouds at K..
With ALMA, the (–0) line has been detected in all the lensed submillimetre-selected galaxies (SMGs) targeted so far at redshifts – 4.2 (Falgarone et al., 2017, herafter Paper I, and Vidal-Garcia et al., in prep.). Most of these are lensed starburst galaxies discovered by Herschel (Eales et al., 2010; Oliver et al., 2010). absorption lines, found in 15 of the 18 SMGs observed, are unexpectedly deep (opacities 0.25–1.20) and broad (average FWHM 400 km s-1). The emission lines, when fully visible, are extremely broad (FWHM km s-1) and are understood as originating in myriad molecular shocks (Godard et al., 2019) presumably powered by hot galactic winds penetrating the CGM (Paper I).
In Paper I, we assumed that the width of the absorption lines is dominated by turbulence and show that the (1-0) absorption lines reveal previously unseen massive and
highly turbulent reservoirs (TR) of diffuse molecular gas ( ) extending far outside ( kpc) the compact starburst cores of radii kpc.
As absorption lines alone cannot provide the extent of the absorbing medium along the line-of-sight,
the original method followed to determine the radius (and mass) of the diffuse gas traced by absorption
involves several assumptions (Paper I and Appendix A):
(1) the high occurrence of absorption detections suggests not only that the surface filling factor of the diffuse gas against the background continuum source is high but also that
the turbulent reservoirs of diffuse molecular gas and the starburst phase are coeval. We thus assume that the TR lifetime is of the order of the duration of the starburst phase, Myr (Tacconi
et al., 2008; Greve
et al., 2005),
(2) following results obtained in the Milky Way (Godard et al., 2014), the abundance in this diffuse molecular gas is assumed to be proportional to the turbulent energy transfer rate per unit volume, , that depends on the average gas mass density within the TR volume, on the mean turbulent velocity inferred from the observed absorption linewidth, , and on the unknown radius , causing a degeneracy between the abundance, , and ,
(3) we break this degeneracy with the finding that, in the few cases where the stellar mass of the starburst galaxy is known, the radius at which the escape velocity
of the galaxy surrounded by its massive CGM is equal to the mean turbulent velocity is such that within a factor of two,
in spite of stellar masses differing by a factor of 10 and very different gas velocity dispersions.
This is why both the TR lifetime and the starburst phase duration, , are about equal to the dynamical time of the TR large-scale turbulence, .
A validation of these unrelated assumptions can only be achieved by direct imaging of the CGM. This was the primary goal of the present work, in which we compare our (1-0) absorption results with the line emission in SMM J023990136 at , previously detected (Ivison et al., 1998; Vernet & Cimatti, 2001) and recently imaged at high spectral resolution, , with the Keck/KCWI (Li et al., 2019). As often, this primary goal has been largely exceeded and the – comparison in space, and even more importantly in velocity-space, has opened up new perspectives that we also report in this paper.
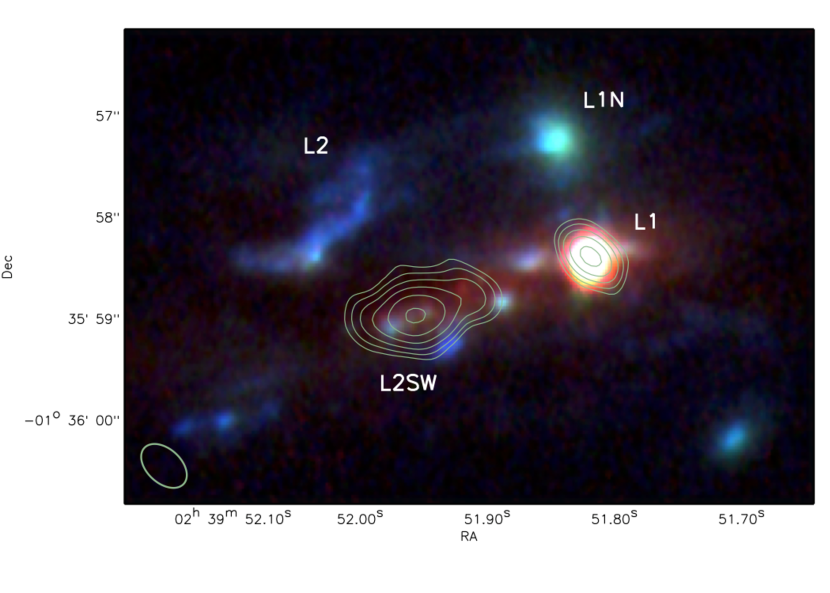
SMM J023990136, the first SMG ever found, is gravitationally lensed by the foreground galaxy cluster Abell 370 with a magnification factor in the range 222Magnification values obtained from the Hubble Space Telescope (HST) Frontier Fields program (Lotz et al., 2017) which includes different models of the lense maps for Abell 370. https://archive.stsci.edu/prepds/frontier/lensmodels/ (Magnelli et al., 2012; Johnson et al., 2014; Richard et al., 2014; Diego et al., 2016). Its total intrinsic bolometric luminosity is (Ivison et al., 2010a). It is a complex and vast galactic nursery (see Table 1 and Fig.1) that harbors the starburst galaxy detected in the FIR dust continuum emission (L2SW), a broad absorption line quasar (BAL QSO) also seen in the FIR continuum (L1) and faint companions visible in the rest-frame UV (L2 and L1N) and undetected in the FIR. A new emitter, L3, has been recently discovered in the field (Li et al., 2019).
The starburst galaxy provides 58 % of the total IR luminosity (log10 , corrected for gravitational amplification – Magnelli et al., 2012), as judged by the relative fractions of rest-frame 122-m continuum emission from L1 and L2SW in naturally weighted ALMA images (Ferkinhoff et al., 2015). The implied SFR for L2SW is around 870 M⊙ yr-1 for a Salpeter (1955) stellar initial mass function (IMF) covering 0.1–100 M⊙ (e.g. Kennicutt, 1998), ignoring the considerable uncertainty related to the IMF. The molecular gas mass inferred from CO observations is , where the CO-to-H2 conversion factor is taken to the average M⊙ (K km s-1 pc2)-1 over its various gas-rich components (Frayer et al., 2018). It extends over kpc in the source plane (Frayer et al., 1998; Ivison et al., 2010a). A new massive elongated structure (W1) extending 13 kpc westward of L1 has been recently discovered by Frayer et al. (2018). It is detected in CO(1-0) single-dish and ALMA CO(3-2) observations, but undetected in higher- CO lines with ALMA. The nature of this low-excitation component, with a velocity red-shifted with respect to that of L1 is undetermined.
For km s-1 Mpc-1, and (Planck Collaboration et al., 2020), 1 arcsec corresponds to a proper size of 8.0 kpc at =2.8 (uncorrected for lensing magnification which acts mainly East-West, Frayer et al. 2018). Throughout the paper, we adopt a correction of 2.25 along the shear direction and 1.06 perpendicular to that, giving a total of 2.38 (Ivison et al., 2010a). The correspondences 3.55 kpc/arcsec, 7.55 kpc/arcsec and 3.36 kpc/arcsec are therefore used in the East-West, North-South and NE-SW (and NW-SE) directions, respectively.
The paper is organised as follows: Sect. 2 is dedicated to the improved determination of the galaxy redshifts, the ALMA and IRAM-30m (1-0) results are presented in Sect. 3, the summary of the Keck/KCWI results is given in Sect. 4, the comparison of the (1-0) and data is conducted in Sect. 5. The discussion, in Sect. 6, includes the many CO observations of this galaxy group and an estimation of the energy budget. The paper ends in Sect. 7 with a summary of our findings and open questions.
2 Improved redshift measurements for the L1 and L2SW galaxies
The redshifts used in the various observations of SMM J023990136 are different: in Ivison et al. (1998), Frayer et al. (1998) and the present observations, in Genzel et al. (2003) and Frayer et al. (2018) and for the observations (Li et al., 2019). They correspond to redshift determinations achieved with different lines and angular resolutions. The velocity difference corresponding to the two extreme redshifts is 300 km s-1, with a remarkable trend: the larger the beam and the lower the line excitation, the higher the redshift 333Similarly, two redshifts differing by km s-1 have been measured for the starburst galaxy G09v1.40 (Bussmann et al., 2013; Yang et al., 2017) likely due to a large scale outflow detected in emission (Falgarone et al., 2017). . In the present paper, all the velocity scales are computed with respect to a reference redshift inferred from an ALMA CO(7-6) image at higher resolution (0.48"0.46") than that published (0.72" 0.61") in Frayer et al. (2018), obtained using Briggs weighting rather than natural weighting to maximise the resolution. The CO(7-6) high excitation line is a better tracer of the dense hot starburst cores than the lower excitation CO(3-2) line, even observed at high angular resolution with ALMA: the CO(3-2) channel maps in Frayer et al. (2018) clearly show the existence of an extended low excitation component at km s-1 that contaminates the L1 and L2SW line profiles. From the new 1mm continuum map, the positions of the galaxies, based on the radio phase calibrators, are given in Table 1. In the CO(7-6) line data cube, the centre velocity of the galaxies shifts to the red for larger apertures. For an aperture associated with the beam size, the velocities (on the scale, that of the CO(7-6) ALMA data) of the mid-points of the half-power strengths centred on the 1mm continuum positions are km s-1 and km s-1. The velocity difference between L1 and L2SW being only 23 km s-1, the reference redshift for the two galaxies, , is inferred from the observed average velocity -308.5 km s-1 of the two galaxies in the scale. It provides the best reference frame for the galaxies themselves because it combines the highest angular resolution with the kinematics of the CO(7-6) lines that peak at the same positions as the 1mm continuum sources.
All the velocities reported in the paper are measured in this reference frame. The absolute velocity estimates are uncertain by only km s-1, corresponding to the uncertainty on .
3 The (1-0) perspective
3.1 ALMA observations and results
SMM J023990136 is one of eight SMGs observed for the first time in ALMA Cycle 4 as part of project 2016.1.00282.S. The (1-0) line ( = 835.137 GHz, Amano (2010)) at redshift 2.8 is shifted into ALMA Band 6 at frequency 219.5 GHz. Observations were done with 42 antennas in configuration C40-4. The minimum and maximum baselines were 15 m and 704 m, respectively, providing a maximum recoverable size of arcsec. J0238+1636, J0239-0234 and J0006-0623 were observed as bandpass, phase and flux calibrators. Data reduction was performed within the Common Astronomy Software Application (CASA) version 5.4.0. We followed the standard ALMA pipeline data reduction. Visual inspection of the different calibration steps, i.e. bandpass, phase, amplitude, and flux, showed satisfactory calibration. We additionally flag antenna DV23 during a short period of time because of bad amplitude. Imaging was done in the same CASA version. We cleaned the data using the CASA task tclean, with the hogbom algorithm. We spectrally regridded the data to a channel width of 50 km s-1. To deconvolve the image, we used a mask contouring the sources which was defined in the continuum image. The restored synthesised beam size is 0.59"0.36" (=54 deg). The phase centre is RA: 2h 39m 51.86s, Dec: -1deg 35’ 58.81" (J2000).
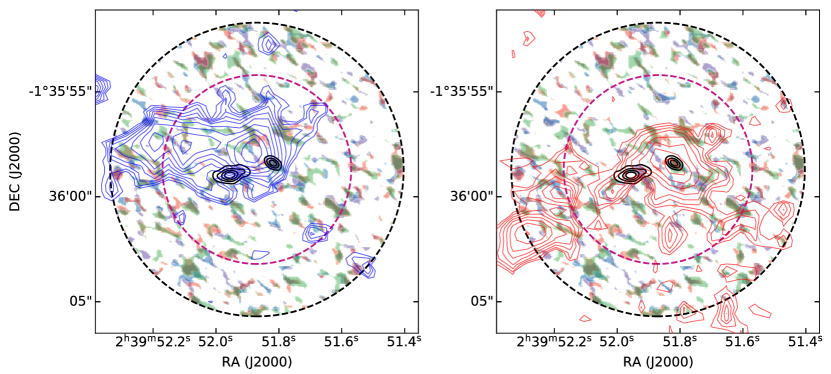
The ALMA rest-frame 360 m continuum image of SMM J023990136 is shown in Figs. 1 and 2. Only the starburst galaxy, L2SW, and the BAL QSO, L1, are detected. The radius of the starburst galaxy L2SW in the source plane has been inferred from a simplified lens modelling to be kpc (see Appendix B) consistent with the radii measured for SMGs at redshifts 1– 3 for which the mid-IR emission is dominated by star formation (e.g. Ikarashi et al., 2017).
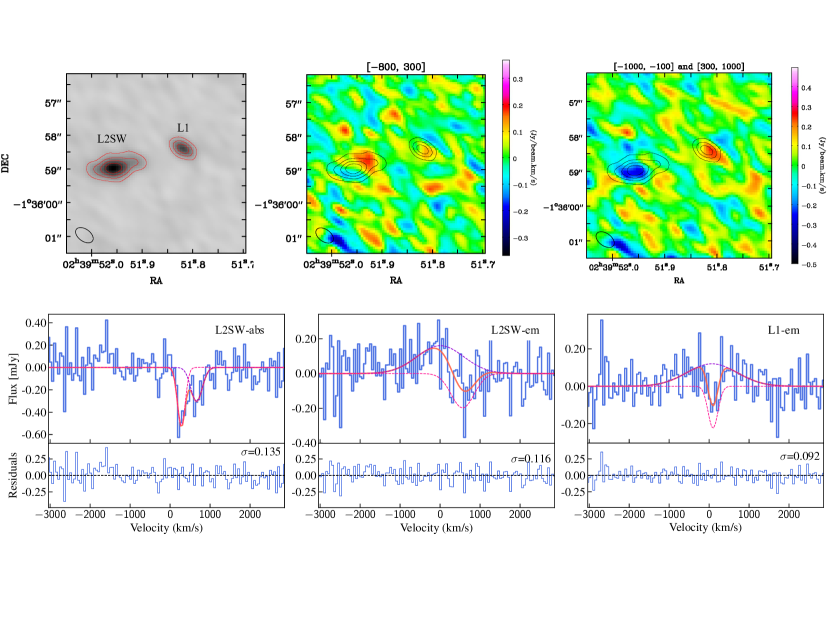
The only three lines detected in the immediate vicinity of L1 and L2SW are displayed in Fig. 2. In the direction of the L2SW peak of dust continuum emission, only absorption is observed: it is redshifted with respect to the galaxies average velocity. An inverse P-Cygni profile is observed one synthesised beam westward of this peak. In the direction of L1, there is no absorption detected against the peak continuum emission but the upper limit is high, , because the continuum source is weak. Absorption is tentatively detected one synthesised beam west of the peak, mostly against the line emission. The regions over which absorption and emission are detected appear at the level in the moment-0 maps of Fig. 2 computed over two different velocity intervals ( is the r.m.s. noise level of the moment-0 maps). In L1 and L2SW, the emitting regions are more extended, at that level, than the synthesised beam and spatially offset from the continuum peaks, an offset already reported in Paper I for other starburst galaxies.
| Source | X() | ||||||||||
|---|---|---|---|---|---|---|---|---|---|---|---|
| mJy | km s-1 | km s-1 | km s-1 | km s-1 | 1014 | kpc | |||||
| L2SW | LVb | 1.5 | 28040 | 21070 | – | – | 0.45 | 2.9 | 0.7 | ||
| HVb | 66070 | 290160 | – | – | 0.26 | 2.3 | 1.3 | ||||
| LV+HVc | 43040 | 580100 | – | – | 0.29 | 5.0 | 23 | 5.2 | 3.5d | ||
| L2SW-em | 0.7 | 600180 | 750440 | 40380 | 1280640 | 0.37 | 8.3 | 30 | 8.8 | 4.4d | |
| L1-em | 0.4 | 8090 | 290130 | 60240 | 1350440 | 0.62 | 5.4 | 12 | 1.3 | 3.3e | |
| Average f | 380200 | 490470 | 55 450 | 6.2 | 22 | 3.7 |
a Rest-frame 360 continuum flux of the galaxies. b Low (LV) and high (HV) velocity components in Fig. 2 (bottom left). c Fit with one single component that allows the determination of the global TR properties. d Mass estimated for , the intrinsic radius of L2SW inferred from lens modelling (Appendix B). e Mass estimated for (Appendix B). f Weighted averages for , and of the single component fit for L2SW, L2SW-em and L1-em.
The line profiles are decomposed into Gaussian components: one or two components in absorption and one in emission. The parameters in Table 2 are inferred from the fits made simultaneously to the emission and absorption lines: and are the FWHM of the emission and absorption lines, (resp. ) is the offset velocity of the absorption (resp. emission) Gaussian with respect to the redshift (Sect. 2). The uncertainties on the parameters have not been evaluated with the bootstrap method to take into account the correlation between these parameters because the emission lines are only tentatively detected.
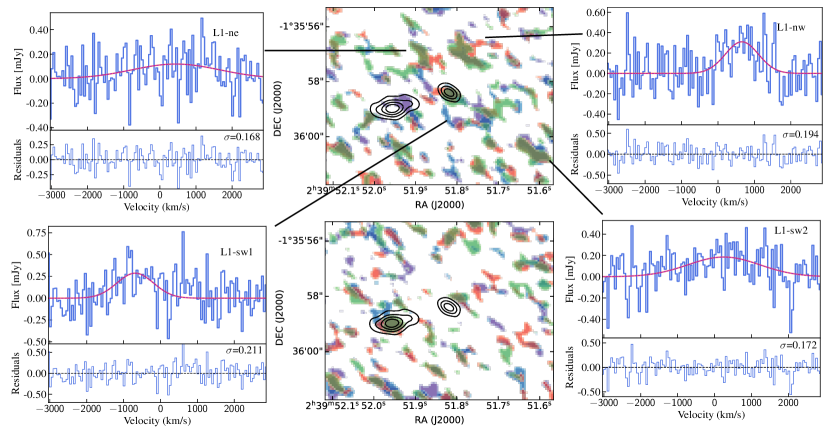
A remarkable feature in the moment-0 maps of Fig. 2 is the presence in the L1 environment of elongated structures above the level, whose shape depends on the velocity range over which the line moment-0 is computed. To highlight the velocity-dependence of their shape, Fig. 3 displays the overlays of all the extended structures brighter than in four different moment-0 maps of the close environment of L1 and L2SW. The choice of their velocity coverage optimises the signal-to-noise ratio of the moment-0 values (i.e. coverage of 1000 and 1600 km s-1 much larger than the resolution to increase the signal but not as large as the lines themselves to limit the noise level), while the choice of their velocity reflects the distribution of the structures in velocity. The overlays of extended structures weaker than in the same moment-0 maps are also shown. spectra integrated over areas encompassing the structure contours in the four different moment-0 maps are also displayed in Fig. 3. These structures are possible regions of line emission located within kpc from the BAL QSO, L1.
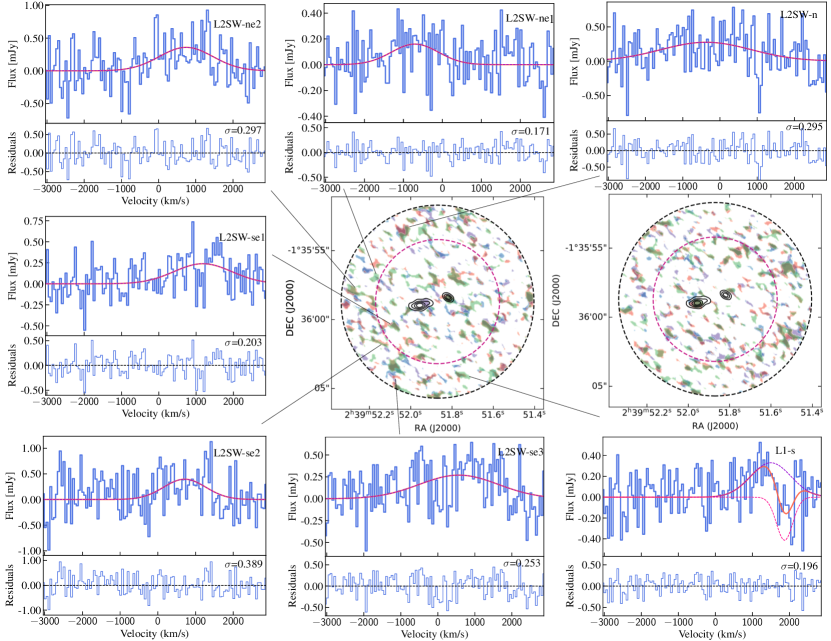
A search for emission lines further away from the galaxies, conducted in velocity-space and space over the 1/3 primary beam of the ALMA observations (43"/3"), has led to the discovery of possible additional structures of emission. The criteria used to identify structures in different moment-0 maps are: (i) line-integrated intensity brighter than the level, where is the r.m.s. noise level of the moment-0 values over the searched area, (ii) more extended, at that level, than the synthesised beam, i.e. and (iii) localised within the 1/3-primary beam area where the noise is minimum (i.e. at a distance less than 7" from the phase centre). No lower limit on the linewidth was included in the selection criteria. The search was performed with CASA and is by no means a systematic search of all the emission spots. This is the goal of an on-going study (Hayatsu et al., in prep.).
However, the number of negative extended structures challenges the statistical significance of the positive structures. While the number of positive structures exceeds that of negative structures close to the phase centre (Fig. 3), it is less clear cut in the wider field, out to the 1/3 response point of the primary beam (Fig. 4). We show in Appendix C that the bright and extended negative structures could be due to combined sidelobes of multiple regions of weak emission and that the number of pixels in positive extended structures larger than one synthesised beam exceeds that in negative ones within 4.5 arcsec from the centre of phase (Fig. 14). This positive excess suggests that a fraction of the positive structures in the inner part of the ALMA field of view are not due to residual sidelobes, although this excess does not tell which are the real emission structures and which are the sidelobes among the positive ones. We also note that, as the total power is missing in our ALMA data, in particular its spatial distribution over a few arcsec, the power in the structures of negative moment-0 is overestimated.
The spectra of seven additional candidates are displayed in Fig. 4 with Gaussian fits to their line profiles and residual spectra. Spectra taken within the same contour as the selected moment-0 structures but localised in their vicinity are displayed in Fig. 15 to illustrate the high quality of the baselines in the inner part of the ALMA field.
These structures of possible line emission are complex because the lines are weak and extremely broad, and emission and absorption coexist over various velocity ranges, depending on the position. This is why, although there are several other prominent positive extended structures in the moment-0 maps of Fig. 4, the seven spectra selected are those for which simultaneous Gaussian fits to the emission and absorption could converge.
| Name | Flux density | a | b | b | S/N c | d d | d e | f |
| mJy | mJy | km s-1 | km s-1 | arcsec | kpc | arcsec2 | ||
| L1-em | 0.12 0.05 | 0.09 | 60 240 | 1350 440 | 2.8 | 1.1 | 3.9 | 0.34 |
| L2SW-em | 0.16 0.12 | 0.12 | 40 380 | 1280640 | 3.0 | 1.1 | 3.9 | 0.38 |
| L1-ne | 0.12 0.11 | 0.17 | 530 1200 | 29003100 | 2.7 | 1.7 | 5.7 | 0.46 |
| L1-nw | 0.310.17 | 0.19 | 740 290 | 1070690 | 3.8 | 2.5 | 8.4 | 0.42 |
| L1-sw1 | 0.290.17 | 0.21 | -600330 | 1160 775 | 3.3 | 2.0 | 6.7 | 1.03 |
| L1-sw2 | 0.18 0.11 | 0.17 | 340 720 | 2290 1700 | 3.6 | 4.5 | 15.1 | 0.32 |
| L2SW-ne1 | 0.16 0.15 | 0.17 | -620 655 | 1420 1540 | 2.5 | 3.8 | 12.8 | 0.44 |
| L2SW-se1 | 0.24 0.13 | 0.20 | 1270 500 | 1820 1210 | 3.6 | 3.2 | 10.8 | 0.54 |
| Average | 0.25 | – | 170 540 g | 1330270 g | – | 8.4 | 0.49 | |
| L1-s h | 0.34 0.24 | 0.20 | 1590 766 | 1275 940 | 2.8 | 5.6 | 42.3 | 0.48 |
| L2SW-n | 0.27 0.15 | 0.30 | -285 545 | 2860 1315 | 3.4 | 5.4 | 25.4 | 1.85 |
| L2SW-ne2 | 0.36 0.13 | 0.30 | 825 320 | 1700 750 | 3.5 | 5.0 | 17.8 | 1.03 |
| L2SW-se2 | 0.48 0.15 | 0.40 | 805 215 | 1390 500 | 3.2 | 5.0 | 16.8 | 0.67 |
| L2SW-se3 | 0.27 0.11 | 0.25 | 655 525 | 2510 1270 | 3.8 | 5.3 | 17.8 | 1.00 |
| Averagei | 0.25 | – | 412 550 g | 1450390 g | – | 28.8 | 0.75 |
a Spectrum noise computed for a spectral resolution km s-1, b Line centroid and FWHM inferred from the Gaussian fits shown in Figs. 3 and 4, c Line signal-to-noise ratio computed over the FWHM, d Projected distance of the structure from the phase centre, expressed in arcsec, e Same distance, expressed in kpc, corrected from lensing shear by adopting the three kpc/arcsec correspondences in the source plane discussed in Sect. 1, f Solid angle of the structure, to be compared to the ALMA synthesised beam area, 0.17 arcsec2, g Weigthed averages, h For this source, absorption was fitted simultaneously with the emission. The absorption parameters are the line centroid km s-1 and FWHM km s-1, i Average values for the 13 structures.
The characteristics of these candidate emission regions and those in the close vicinity of L1 and L2SW are given in Table 3. The first eight structures are the most plausible because they are located within 4.5 arcsec from the phase centre and the r.m.s. noise level of their residuals is 0.2 mJy. The others are less plausible, being further from the phase centre, with noisier spectra but the comparison of their emission to that of suggests that three of them may be real (see Sect. 5). Note that, although the peak intensity is of the order of the r.m.s. noise level in 50 km s-1 channels, the signal-to-noise ratios computed over their full linewidth are all 3 because they are extremely broad ( km s-1).
Four straightforward results regarding the lines of the eight most plausible candidates appear in this Table:
(1) their average centroid velocity, km s-1, is redshifted with respect to the reference frame of the galaxies,
(2) their centroid velocities are highly scattered, with a standard deviation = 540 km s-1,
(3) their average FWHM, km s-1, is extremely large for molecular lines, with FWHM up to 3000 km s-1 and their standard deviation is small,
(4) on average, they are 3 more extended than the ALMA synthesised beam area, mostly because of their elongation.
Several of these structures are elongated over more than 1 arcsec, along directions that are not aligned with the lensing shear direction, roughly aligned with the L2SW–L1 direction (Frayer et al., 2018). In a few cases they are barely resolved in the transverse direction.
3.2 IRAM-30m observations
The (1-0) observations were carried out in June and November 2019 at the frequency GHz corresponding to the rest frame frequency GHz of the (=1-0) transition444This value is the first to have been determined experimentally by Pearson & Drouin (2006). It differs by only 58.5 MHz, or 21 km s-1 from that determined later by Amano (2010). at redshift 2.803. Two EMIR receivers (Carter et al., 2012) were operated, E0 at 90.9 GHz for the 12CO(=3-2) line and E2 for the line. The wobbler was operating at 0.5 Hz with a throw of . The weather conditions were good with a SSB system temperature varying between 160 and 220 K. At this frequency, the half-power beam width is 11.2" (close to the 1/3 ALMA primary beam) and the flux/brightness conversion for point sources is . A spectral resolution of 64 MHz provided a velocity resolution of 87 km s-1. The spectra were reduced and analysed with the CLASS package of the GILDAS software555http://www.iram.fr/IRAMFR/GILDAS.
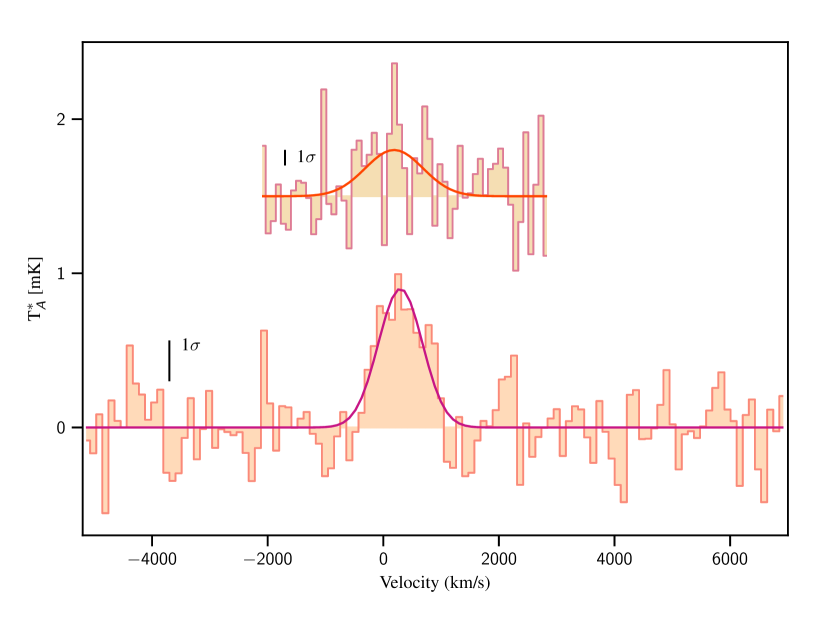
A broad line has been tentatively detected with a peak intensity mK in resolution elements of 87 km s-1, a centroid velocity km s-1 and a FWHM km s-1 (Fig.5). The (3-2) line, mK, is centred at km s-1, and narrower, km s-1, than the line (Fig.5). The offset velocities of the two lines with respect to are similar within the error bars.
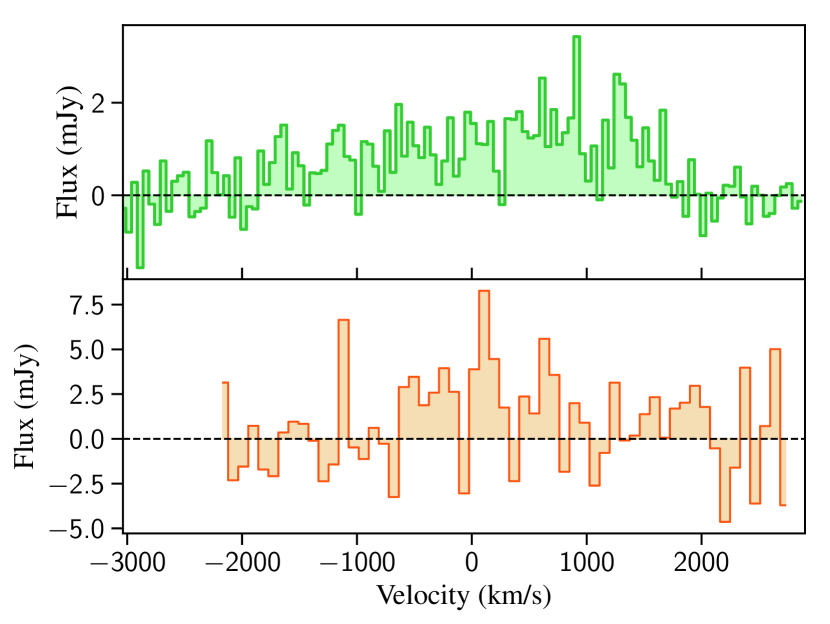
The sum of the eight most plausible line fluxes identified in the ALMA data (Table 3), weighted by the IRAM-30m beam profile at the relevant location, is shown in Fig. 6, top. This sum is smaller than the flux measured with the single-dish IRAM-30m telescope (Fig. 6, bottom). The line integrated fluxes over [-1000, 1000] km s-1 are 1.40.4 Jy km s-1 and 3.51.4 Jy km s-1 for ALMA and IRAM-30m, respectively. Over a broader interval, [-1900, 2200] km s-1, these integrated fluxes are 2.20.5 Jy km s-1 and 4.71.6 Jy km s-1, indicating that the ensemble of scattered emission structures detected by ALMA in the inner 4.5 arcsec of the field of view contributes to about 50% of the power detected by IRAM-30m.
This comparison suggests that these eight structures are the brightest of a broad distribution of weaker structures that contribute to the single-dish detection but are resolved out by ALMA and/or too weak to be detected. This is also in line with our statement that the emission structures we report are not a complete census of the emission spots in the dataset. The line shapes of the two spectra in Fig. 6 are notably different which is likely due to the combination of a complex radiative transfer of the line (i.e. locally the profiles are P-Cygni and inverse P-Cygni) and ALMA filtering.
Last, we note that the total power detected by the IRAM single-dish telescope, 3.5 Jy km s-1 over 2000 km s-1 would correspond, if distributed uniformly, to an integrated line brightness of 4.7 mJy km s-1 beam-1 in an ALMA moment-0 map at the resolution 0.59"0.36", integrated over 1600 km s-1. With a surface filling factor of 8% in the ALMA 1/3 primary beam, it would amount to mJy km s-1 beam-1, that is the level of the moment-0 maps. Recovering the total power and its spatial distribution at a few arcsec scale would possibly shift the moment-0 brightness distributions towards more positive values.
3.3 Properties of the turbulent CGM inferred from the lines
3.3.1 The absorption lines
The absorption line optical depth, computed at the velocity of the deepest absorption, is derived from the Gaussian fits:
| (1) |
with and are the dust continuum flux and the line emission flux at velocity , respectively, and is the flux resulting from the absorption. The optical depth estimates of the absorption lines (Table 2) are not affected by differential lensing because the background dust emission photons and those – at the same frequency – that escaped absorption by molecules have experienced the same lensing. The velocity resolution is coarse and we cannot rule out the possibility that portions of the line might be saturated. The estimated values of could therefore be lower limits, so in Table 2 we provide them without a compiled error. However, the r.m.s. uncertainty on in the spectra of Fig.2 is 0.15 so that the relative uncertainty on is between 25 and 40%.
The column densities are the average values in a solid angle subtended by the area, , of the background source assumed to be uniformly covered by the absorbing screen:
| (2) |
The absorption lines in the direction of L2SW are redshifted with respect to the galaxies systemic velocity at . These redshifted absorption lines are evidence of several inflowing gas streams onto the SMG at velocities, . The projected inflow velocities in the direction of L2SW are large, km s-1 (see Table 2 ). In the direction of L1, the absorption is also redshifted but the offset velocity is much smaller, km s-1.
Following Paper I, we estimate the radius of the reservoir of diffuse molecular gas at the origin of the absorption by connecting the formation rate with the turbulent dissipation rate, assuming that the turbulent dynamical time is of the order of the duration of the starburst phase :
| (3) |
where km s-1 is the mean turbulent velocity provided by the weighted-average width of the absorption lines (Table 2).
The starburst phase duration, , is often estimated as the consumption time of the molecular gas mass due to star formation, . Values of consistent with those of Tacconi et al. (2008), usually around 50–100 Myr, have appeared in the literature as far back as Frayer et al. (1999) and Greve et al. (2005). In the case of SMM J023990136, the starburst galaxy itself, L2SW, comprises approximately 25% of the total molecular gas mass (see Frayer et al., 2018) yielding a bespoke value of Myr for its SFR of about 870 yr-1 (Sect. 1). We caution here that uncertainties stated in the literature have usually ignored the considerable systematics related to gas mass and SFR — those due to and the IMF, for example.
We recall in Appendix A the method followed to infer the abundance from the fact that the formation in the diffuse component is primarily driven by turbulent dissipation. Once is known, the degeneracy between the radius and the abundance is broken and the mass of the diffuse molecular CGM (TR) can be determined.
In Table 2, the different values of the radius , abundance X() and mass of the turbulent reservoir obviously refer to the same entity, probed by different sight-lines. They are close to each other because the absorption optical depths are similar, being bracketed by unity on the upper side and , the sensitivity of the observations on the brightest continuum source. The dynamic range on is therefore limited. The values in Table 2 are computed for Myr, a molecular fraction and the local density of the absorbing medium, . This value of the local density is inferred from the Milky Way studies (Godard et al., 2009). An upper limit on the local gas density of is provided by the fact that the line is seen in absorption (see Appendix D).
The last line of Table 2 gives the average values of the three estimates of the TR properties derived from the three lines-of-sight towards L2SW, L2SW-em and L1-em. The average of the absorption offset velocities, , provides a mean inflow velocity, km s-1 with respect to L1 and L2SW at .
The absorption lines in SMM J023990136 therefore highlight the presence of a massive turbulent reservoir of diffuse molecular gas, , where , inflowing towards the galaxies at km s-1, a velocity comparable to its mean turbulent velocity km s-1. Its inferred radius is independent of the lensing magnification since it is inferred from absorption lines.
3.3.2 The emission lines
The detected line flux densities (Table 3) correspond to line brightness temperatures 10 mK in the source frame, assuming a uniform brightness over the structure solid angle (see Appendix D). This assumption provides a lower limit for the density in the gas component of the CGM where is formed and radiates. In Appendix D, we give the results of non-LTE radiative transfer for the (=1-0) emission using the RADEX code (van der Tak et al., 2007). They provide the gas density and temperature conditions required to form a 10 mK emission line, for two relevant column densities and a local velocity dispersion of 20 km s-1. Densities are required for temperatures K and .
As the radical has an extremely short lifetime, yr (Appendix A), these structures, rich in and located at distances of several 10 kpc from the galaxies, cannot have been stripped by galactic winds from the galaxies’ interstellar medium, because the advection time, even at velocities km s-1 would be Myr. Therefore must have formed in situ, where it is observed. Given the large linewidths and the large densities required for line emission, the seen in emission most likely formed in shocks. However, the emission lines are extremely broad, with an average FWHM km s-1 (Table 3), as in several other SMGs (Paper I). cannot originate in shocks at such high velocities since this would dissociate the molecule needed for the formation and sputter dust grains necessary for the re-formation of . Most likely they originate in lower velocity ( km s-1) UV-irradiated molecular shocks (Paper I and Godard et al. (2019)). A particularly interesting result of Godard et al. (2019) is that the column density in the post-shocked layer of these irradiated shocks increases linearly with the UV-field irradiation over a broad range of pre-shock densities.
The large velocity dispersion of the ensemble of individual low-velocity molecular shocks (LVMS) is at the origin of the broad linewidths. We ascribe it to turbulence generated in the post-shock layer of high-velocity shocks (HVS) in the CGM (see Sect. 6.2). The dynamical energy transfer between HVS and LVMS might be similar to that observed in the 50-kpc long shock in the Stephan’s Quintet driven by a galaxy collision with a gas tidal stream. Within this large-scale shock, the [CII] and CO line velocity dispersions are km s-1 (Guillard et al., 2012; Appleton et al., 2013, 2017) spanning the velocity difference between the intruder galaxy and the tidal stream of atomic gas.
The physics of such powerful energy transfers between 10kpc-scale shocks feeding a turbulent cascade in the multiphase post-shock layers is complex. It is the focus of several recent thorough investigations (e.g. Gaspari et al., 2013, 2017; Li et al., 2020; Gronke & Oh, 2020; Lochhaas et al., 2020; Voit et al., 2020).
We show below the added value of a joint investigation of molecular lines and observations in this field.
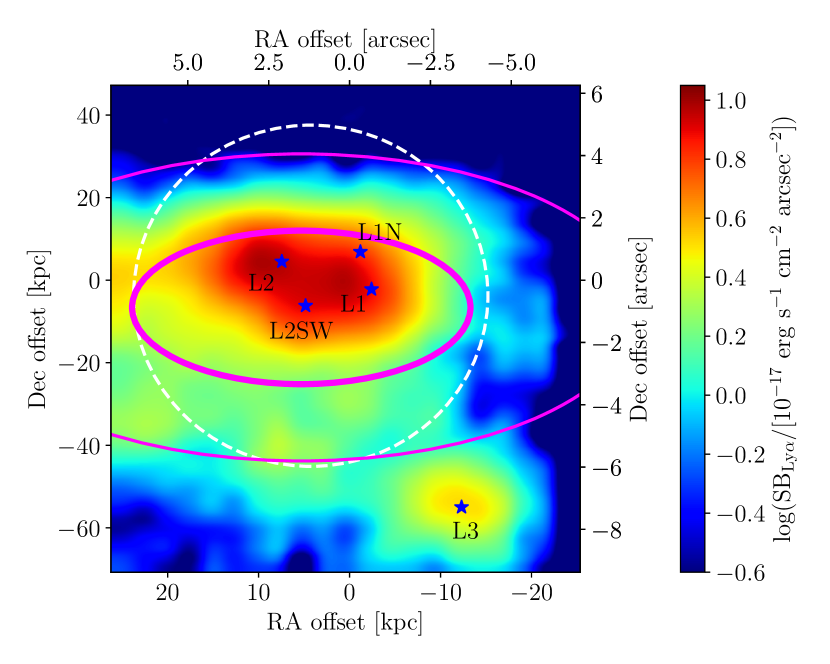
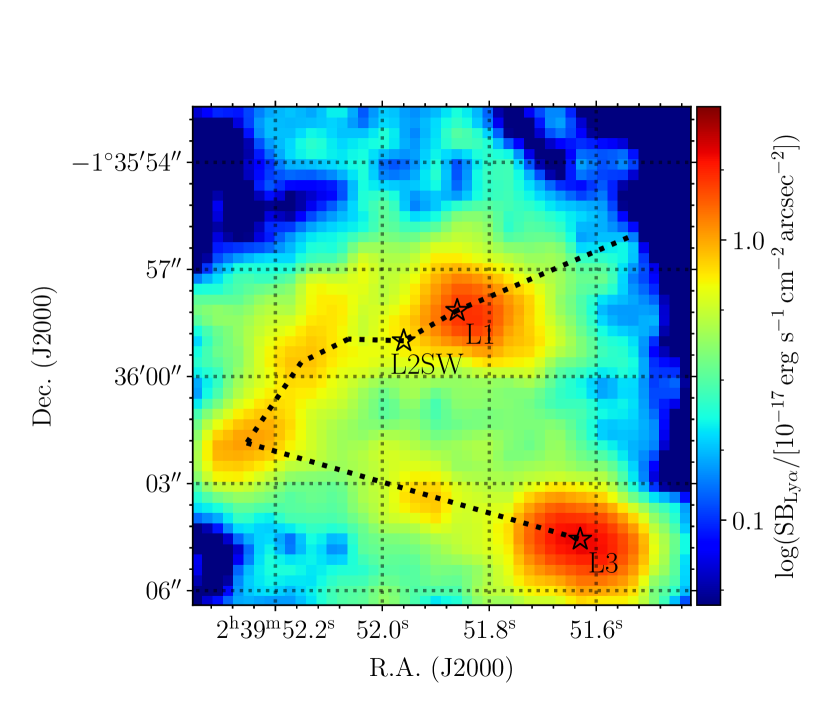
4 The perspective
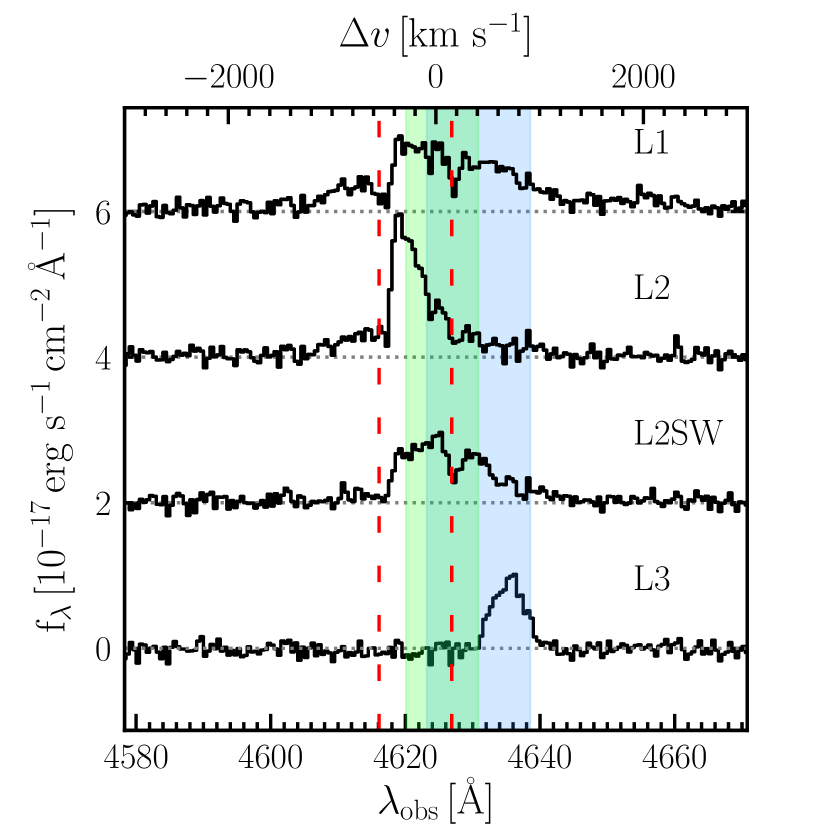
SMM J023990136 was known from the earliest spectroscopic observations with CFHT to be a emitter and the total extent of the emission was found to be 13 arcsec or kpc (Ivison et al., 1998; Vernet & Cimatti, 2001). These galaxies have recently been observed with the Keck/KCWI (Li et al., 2019) and an extended nebula has been imaged over kpc (Fig. 7). However, it is not quite as large and luminous as the nebulae referred to as ELANe by Cai et al. (2017) and Arrigoni Battaia et al. (2018). The bright spot, L3, previously unknown, is the focus of Li et al. (2019) who propose that it is a dark cloud made visible by fluorescence excited by the BAL QSO, L1. The spectra observed at the position of the starburst galaxy L2SW, the BAL QSO L1, the blue companion L2, and the dark cloud L3 are shown in Fig. 8. The lines are highly non-Gaussian and asymmetrical close to the QSO. Towards L3, the line is narrow (FWHM=353 km s-1) and close to Gaussian (Li et al., 2019). Two narrow absorption troughs at km s-1 and km s-1 are also detected at the three positions L1, L2, L2SW and at the same velocities (Fig. 8).
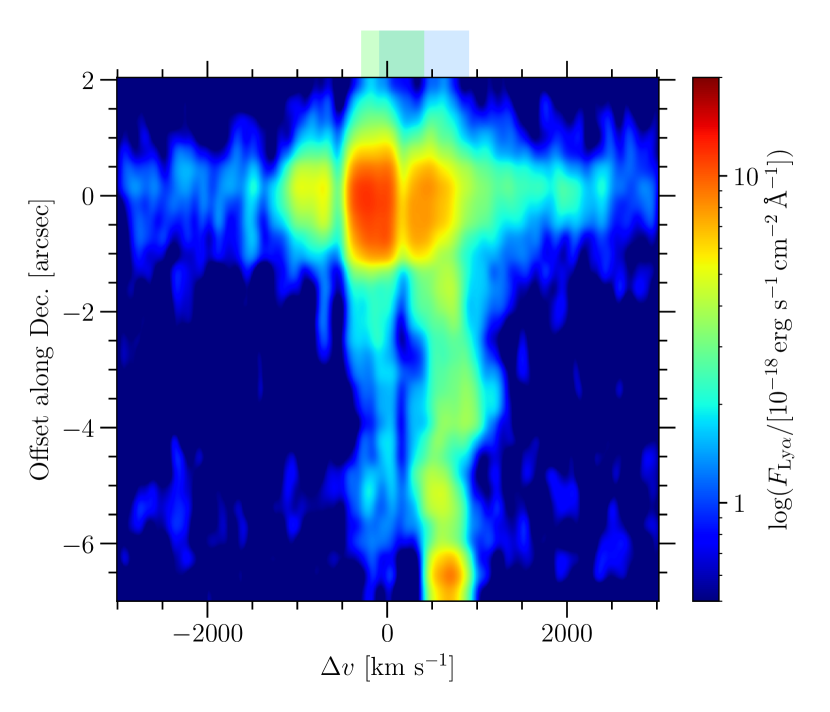
The position-velocity diagram (Fig. 9) shows that the extremely broad lines (FWZI possibly larger than 6000 km s-1) are found only in the inner part of the nebula, indeed unresolved by the KCWI observations which had a seeing of 1.5" (Li et al., 2019), i.e. the extent of the extremely broad emission in the position-velocity cut.
In its more extended part, the lines are narrower and redshifted with respect to by up to km s-1. Remarkably, the average velocity across the southern part of the nebula does not change much. At first sight, the lines cannot be interpreted simply in terms of outflows and inflows, as discussed in Verhamme et al. (2006) and Dijkstra (2017) except for the line in the direction of L1 that has a redshifted centroid velocity, computed as its first moment, km s-1. This redshifted velocity centroid can be seen as a signature of outflowing gas due to the strong scattering of photons. However, an infalling CGM could contribute to the blue peak asymmetry as seen in the direction of L2 and to a lesser extent towards L1 and L2SW. The lines therefore bear the signatures of both outflows and inflows. We show in the next section the unique power of combining and spectroscopy to get some insight into the CGM gas dynamics on a 50 kpc-scale.
5 Comparison of the (1-0) and perspectives
Despite the vast differences between the gas phases emitting and absorbing the (1-0) and lines, a number of straightforward and remarkable properties can be inferred from their comparison.
5.1 The absorptions and asymmetric line shape
5.1.1 Radius of the halo of diffuse molecular gas
The radius inferred for the turbulent reservoir (TR) of diffuse molecular gas traced by (1-0) absorption depends linearly on the duration of the starburst phase (Eq. (3)). This radius is drawn on Fig. 7 for two different values, 50 Myr and 100 Myr that bracket the value 66 Myr computed for SMM J023990136 (Sect 3.1.1) and correspond to the range inferred from the statistical studies of SMGs (e.g. Tacconi et al. 2008). These timescales are uncertain, partly because of the unknown IMF in starburst galaxies (Zhang et al., 2018). However, the broad agreement between the projected extent of the bright core of the nebula and that of the TR is remarkable. This agreement suggests that the CGM is (at least) biphase with a cool molecular phase of low density () and K contributing (Table 2). The warm phase at K, the emitter, is possibly fully ionized.
Even more significant, this agreement supports the theoretical basis of our size determination of a absorbing medium, relying on the turbulent dissipation rate and its scaling with size (Paper I). Indeed, this was the original motivation for imaging the emission of SMM J023990136 with the Keck/KCWI.
5.1.2 Inflow signatures
The range of velocities covered by the absorption lines against L2SW and L1 is highlighted in blue and green, respectively, in Fig. 8. All velocities have been computed with respect to . Together they cover most of the red side of the line. As the absorption is redshifted, the cool molecular gas is inflowing towards the galaxies and is located between the galaxies and the observer. This diffuse molecular gas necessarily contains a fraction of atomic hydrogen susceptible to absorb and scatter photons, most likely at the origin of the line asymmetry at the three positions, L1, L2 and L2SW.
This same velocity range is also highlighted in blue and green in the position-velocity cut of Fig. 9. It is very similar to that of the whole southern part of the nebula, to which L3 belongs. Unless it is an unlikely coincidence, this means that the bulk of the imaged nebula is inflowing towards the galaxies because its velocity (and velocity dispersion) is the same as that of the gas causing the redshifted (1-0) absorption. This redshifted gas, inflowing towards the galaxies, scatters the photons back towards the galaxies, and contributes to the weakening of the observed red side of the line.
Remarkably, the absorption trough at km s-1 falls at the same velocity as the absorption common to both L1 and L2SW sight-lines (Fig. 8). It thus likely corresponds to inflowing gas located between the SMGs and the observer. The other narrow absorption at km s-1 does not coincide with any absorption trough: it might be caused by gas located behind the SMGs, and therefore also inflowing towards the galaxies, but we cannot rule out that it is -poor because metal-poor, reflecting inhomogeneities in the metallicity of inflowing matter. In the former case, since the km s-1 trough has also to lie in front of the whole blue side of the profile, this blue side would be emitted by gas located not only behind the SMGs but also behind the gas causing the absorption at km s-1, and its negative velocities would be the signature of the inflow of the rear part of the nebula onto the galaxies. It is therefore plausible that the entire nebula be inflowing towards the galaxies at velocities of several 100 km s-1.
This redshift of the absorption lines, however, could be ascribed to a gas component unrelated to the galaxies. This is unlikely because the profile in the direction of L2SW-em (Fig. 2) has the characteristic shape of an inverse P-Cygni profile in which the emission and the absorption are linked by the radiative transfer of photons in infalling gas. So, as long as is concerned, the gas responsible for the emission (i.e. from the UV-irradiated shocks) and that causing absorption (i.e. from the large-scale turbulent reservoir of diffuse molecular gas) are dynamically and radiatively coupled. The gas causing the absorption and the extended part of the nebula, at similar velocities and velocity dispersions, are most likely also dynamically linked to the system. We therefore are confident that the gas emitting the redshifted emission of the nebula is dynamically connected to the system, and is inflowing towards L1 and L2SW.
Last, the mere existence of this extended cool molecular phase moving at the same velocities as the warm phase emitting indicates that not only they are mixed together i.e. the CGM is multiphase, as said above, but also that they share the same dynamics. However, the emission probably extends beyond the limits of the KCWI image (Fig. 7) i.e. its radius is kpc in source plane. It is larger than the radius inferred for the diffuse molecular reservoir which suggests that the inflowing gas is molecular only within the inner regions, at distances kpc. The co-spatiality of these two phases further suggests that some thermal cooling radiation necessarily contributes to the line emission (Gnat & Ferland, 2012).
5.2 The broad and emission lines
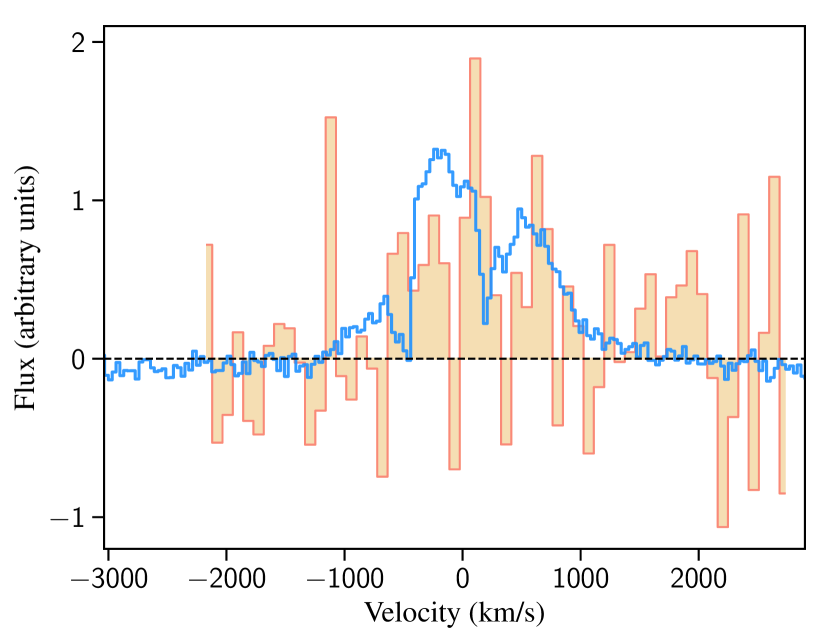
The emission has been integrated over the IRAM-30m HPBW=11.2" to compare its line profile to that of the emission (Fig. 10). As expected, the line cores differ because of the vastly different opacities of the two lines (the Einstein coefficients are respectively s-1 for (1-0) and s-1), but the similarity of their full extent (FWZI 3000 km s-1) is striking and suggests a shock contribution to the lines as done in the analysis of another conspicuous ELAN (Cai et al., 2017) and as modeled in self-irradiated shocks (Lehmann et al., 2020a, b). Extremely broad lines may therefore have a kinematic origin, in parallel to being due to opacity broadening (Faucher-Giguère et al., 2010).
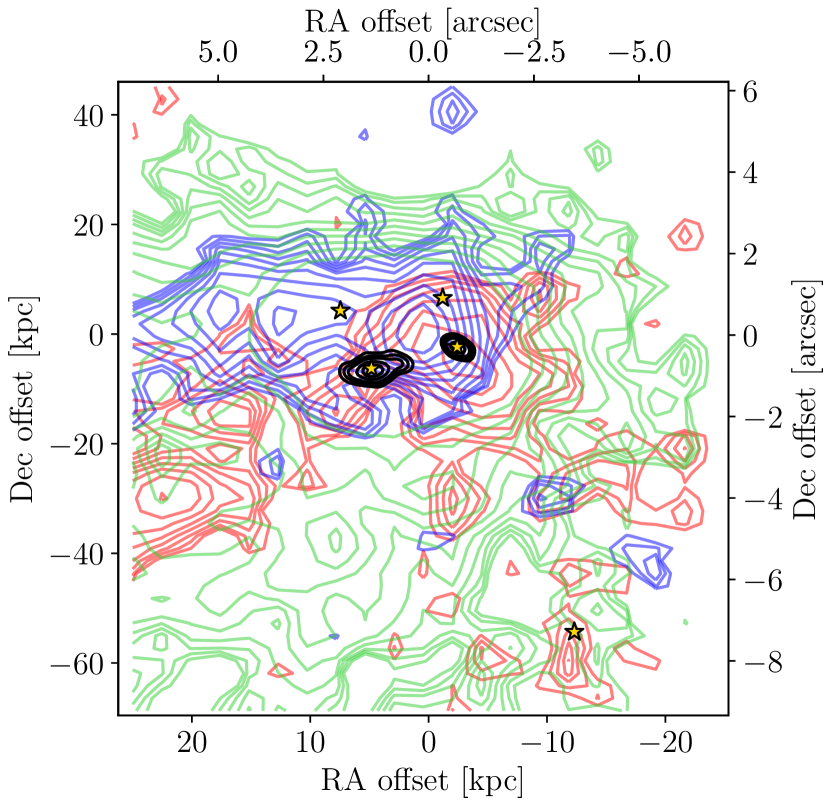
We detail below the rich facets of this similarity, in space and velocity space. The profiles are complex but their spatial distribution in three different velocity ranges (Fig. 11) is most informative. In the velocity range close to the line centroid ([0,500] km s-1, green contours) there is a bright extended plateau with little spatial structure, encompassing the galaxies and co-located with the turbulent reservoir of diffuse gas causing the absorption (Fig. 7). At the opposite, the contours in the high-velocity (HV) positive ([1000,1500] km s-1, red) and negative ([-1200,-700] km s-1, blue) ranges are highly structured in space.
Positive velocities are dominating the HV emission, consistent with primarily outflowing gas according to radiative transfer (Verhamme et al., 2006; Dijkstra, 2017). The geometry of these high positive velocities on each side of L1 and L2SW suggests high opening angles of the outflows.
The overlay of the HV contours with the emission structures identified in the ALMA data suggests that these structures are not randomly distributed in space (Fig. 12). They follow the edges (i.e. brightness gradients) of the high-velocity contours, or are found at the tip of elongated structures. Half of those located within 4.5 arcsec of the phase centre lie in the environment of L1, at projected distances up to 15 kpc in the source plane (see Table 3). Most of the least plausible candidates are clustered to the east of L2SW, where the positive and negative high-velocity contours overlap in projection, signposting complex dynamics. Another view of this overlay is given in Appendix E, where the spatial distribution of high-velocity emissions is compared to moment-0 maps computed on a spatially smoothed version of the ALMA data. Long and weak structures of line emission appear that exquisitely follow, in a few cases, the edges of the high-velocity emissions.
The spatial distribution of the emission structures with respect to the HV emissions suggests that they trace molecular shocks located at the thin and highly convoluted interface of the AGN- and starburst-driven outflows (i.e. the high-velocity components of the line) with the inflowing CGM.
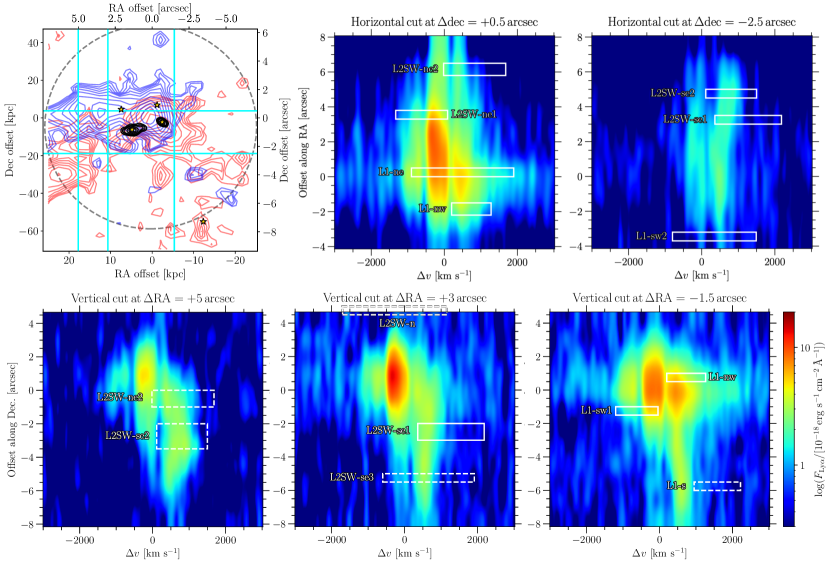
The position-velocity cuts of Fig.13 offer another projection of the data. There, it is clear that the structures of emission never share the position and velocity of peaks, but nevertheless always have a counterpart, albeit sometimes weak. This finding further supports the shock interpretation of the emission structures, shifted both in space and velocity from the peaks. It also highlights the weak contribution of these shocks to the emission of the nebula. The diversity of the relative positions of the shocks and emission is due mostly to projection effects. This comparison of the position-velocity distributions of and emission suggests that L2SW-ne2, L2SW-se2 and L2SW-se3 are plausible regions of emission, although located arcsec (or 18 kpc) from the phase centre. In the following, we adopt 18 kpc as the largest distance of the emission structures from the galaxies.
The observed fact that the broadest lines are found only in the unresolved brightest part of the nebula, in the vicinity of the BAL QSO L1, might appear in apparent contradiction with the findings of Laursen et al. (2009) who show that, in their simulations of forming galaxies, dust absorption primarily affects the wings of the lines. This is so because the wings are found to originate in the densest and most opaque parts of the galaxies. It is not the case here and this suggests that the broad wings in SMM J023990136 are not originating in the most opaque regions of this system but in far less compact regions at distances kpc from L1, at the interface of powerful galactic winds and the CGM, as suggested in Paper I.
6 Discussion
Thanks to the unique kinematic information carried out jointly by the and lines, augmented by the ancillary CO data, we are now able to draw a coherent picture in which a large-scale inflow interacts with powerful AGN- and stellar-driven outflows, and where the mass and energy injection rates from both the galactic winds and gravitational accretion sustain the co-existence over the starburst phase of the massive turbulent CGM and the high star formation rate.
6.1 What , and multi-transition CO observations tell us.
| Line | Telescope | Beam | Source Component | Reference | |||||
| arcsec | km s-1 | km s-1 | km s-1 | km s-1 | |||||
| KCWI | 1.5 (seeing) | 2.8048 | L1 | – | – | 0 a | 1500 | b | |
| L2SW | – | – | 0 | 1500 | |||||
| L3 | – | – | 6706 | 35315 | b | ||||
| (1-0) | ALMA | 0.360.59 | 2.803 | L2SW LV | 280 | 210 | – | – | c |
| L2SW HV | 66070 | 290160 | – | – | |||||
| L2SW LV+HV | 430 | 580 | – | – | |||||
| L2SW-w | 600 | 750 | -10 | 1280 | |||||
| L1-sw | 80 | 290 | 10 | 1350 | |||||
| Scattered structures | – | – | -600 to 1600 | 1000 to 3000 | |||||
| Average | 380 200 | 490 | 170 540 | 1330270 | |||||
| IRAM-30m | 11.2 | – | – | 105170 | 1300500 | ||||
| CO(1-0) | GBT | 25 | 2.808 | A | – | – | 63715 | 26035 | d |
| B | – | – | 5735 | 660100 | |||||
| CO(7-6) | ALMA | 0.60.5 | L1, L2SW | – | – | 0 | 650 | d,e | |
| CO(3-2) | OVRO | 7.44.8 | 2.808 | – | – | 307158 | 710 80 | f | |
| IRAM-PdBI | 5.22.4 | 2.808 | – | – | 100 | 900 | g | ||
| IRAM-30m | 22 | 2.803 | – | – | 16060 | 800100 | b | ||
| ALMA | 0.72 0.61 | 2.808 | W1 | – | – | 650 | 260 | d |
a The line is non-Gaussian and its extremely broad red wing makes its first moment positive (see text), b Li et al. (2019), c This work, d Frayer et al. (2018), e From a sentence in Frayer et al. (2018) stating that the CO(7-6) lines detected by ALMA have a similar FWHM as the GBT component B in CO(1-0), f Frayer et al. (1998), g Genzel et al. (2003)
The published CO observations of SMM J0239901236 are a precious addition to the – comparison because they have been carried out in several transitions and at different angular resolutions. For comparison, the velocities and FWHM of the , and CO lines are gathered in Table 4 with the respective angular resolution of their observations.
The key kinematic properties of the different components seen in various tracers can be summarized as follows:
(1) The line in the direction of L3 and in the bulk of the nebula, the HV absorption line in the direction of L2SW, the CO(1-0) Green Bank Telescope (GBT) component A and the CO(3-2) ALMA component W1, all have, within the error bars, the same redshifted velocity and about the same FWHM (in boldface in Table 4). These CO and components extend, up to 6" and from the galaxies, respectively.
(2) The extremely broad linewings in the direction of L1 and L2SW, the (1-0) emission in the close vicinity of the galaxies and the CO(=7-6) lines trace highly excited gas. They are centred at the same velocity, km s-1 suggesting that there is some shock contribution to the and CO(7-6) emissions associated with the close (kpc-scale) environment of the galaxies. We note that the high- CO line is about twice narrower than the emission lines. This can be understood by the fact that the abundance of is enhanced in strong UV fields while CO is photo-dissociated (Godard et al., 2019).
(3) The average velocity of the absorptions, km s-1 is commensurate with those of the emission lines (Table 3), km s-1 (resp. 412 520 km s-1) for the eight (resp. eleven) most plausible structures.
As the similarities given in (1) are unlikely to be due to a coincidence, we infer that all these gas components, in addition to being projected over a similar large scale area, are sharing the same dynamics i.e. inflow towards the galaxies at km s-1 because the redshifted HV absorption line in the direction of L2SW is seen in absorption. The inflowing stream is therefore multiphase within the inner 20 kpc, with a hint that the purely atomic (or ionized) hydrogen inflow extends even further than 50 kpc. A shock contribution to the emission is inferred from (2).
Lastly, point (3), and the fact that the most plausible emission structures are scattered within a large area around the galaxies (up to distances 18 kpc in the source frame), commensurate with the radius of the diffuse turbulent reservoir, , further support that the shocks traced by the emission lines and the diffuse, highly turbulent, molecular gas are dynamically coupled: the shocks are the signposts of the mechanical fuelling of turbulence by the outflows within the whole CGM. This was already suggested by the inverse-P Cygni profile tentatively detected in the direction of L2SW-em (see Sect. 5.1).
The velocity coherence of the extended component at km s-1 over the full observed projected size of the nebula is striking (Figs. 9 and 13). Its linewidth varies however, mostly km s-1, much broader in the Eastern area with a linewidth km s-1 (pv-cut at RA offset = +5 arcsec in Fig. 13). This velocity component is dominant in the western part of the galaxy environment seen in CO(3-2) (Genzel et al., 2003; Frayer et al., 2018). Lower velocity components, still inflowing (since redshifted in absorption with respect to ), are also present, e.g. the LV absorption component towards L2SW and the absorption in the direction of L1. These are also seen in emission up to 5" (or kpc) eastward of L1 and L2SW (Fig. 9). This is why the average inflowing velocity is only km s-1 (Table 2).
These inflow velocities are large compared to what is expected in forming galaxies (Goerdt & Ceverino, 2015), but recent improved numerical treatments of shock heating in the halo of massive galaxies show that large amounts of gas cool down and fall at such high velocities (Bennett & Sijacki, 2020). We note that the escape velocity at radius 200 kpc of a halo of virial mass , is
| (4) |
So, the observed inflow velocites could then be the kinematic signature of large scale recycled winds, in which case outflows and inflows would be intimately mixed (Herrera-Camus et al., 2020). Galactic winds do generate turbulence and a fraction of the expelled matter is susceptible, if enabled to cool down, to fall back onto the galaxies at large velocities (e.g. Gabor & Bournaud, 2014).
The turbulent velocity of the inflowing gas km s-1 is also very large and traces highly supersonic turbulence, even in gas at K. The processes susceptible to sustain this high level of large scale turbulence are AGN- and stellar-driven winds from L1 and L2SW (Faucher-Giguère & Quataert, 2012; Costa et al., 2020; Nims et al., 2015) but also gravitational energy either from the merger (Oh et al., 2015; Blecha et al., 2018; Biernacki & Teyssier, 2018; Bustamante et al., 2018) – the SMM J023990136 galaxy group being an archetypal example of a merger – or recycled outflows or infalling cold streams (Dekel et al., 2009; Narayanan et al., 2015). This alternative may just be two facets of the same process since galaxies are already forming in accreting cold streams (e.g. Narayanan et al., 2015). Not unexpectedly, Bennett & Sijacki (2020) show that the improvement in the resolution of accretion shocks causes CGM turbulence to increase dramatically, up to values comparable to those observed here.
The inflowing gas could be pristine gas infalling in the dark matter potential well of the galaxies, at large radii where only the line is detected i.e. 40 kpc from the galaxies. The inner part, rich in CO and detected in is metal-enriched and could be part of recycled outflows. We discuss these possibilities in the next sections, relying on the and line observations.
6.2 Where inflow meets outflows
The faster outflow at km s-1, originating in L1, and to a lesser extent L2SW, is clearly visible in the position-velocity cut of Fig. 9. It is unresolved and is therefore confined within the inner 0.75" (or 3 kpc) environment of the galaxies. We show below that the and emission lines make it possible to outline the fate of less powerful outflows, at at distances at least as large as 20 kpc from the galaxies.
The longest structures of broad and weak emission obtained in the smooth moment-0 maps (Fig. 17) are close to the maximum recoverable size of arcsec, i.e. 15 to 40 kpc in the source plane. Such large lengths and large velocity dispersions are reminiscent of the cold gas kinematic properties observed in the 50-kpc long high-velocity shock (HVS) of the Stephan’s Quintet (SQ) where the velocity dispersion of the molecular gas in the post-shock layer of the HVS is that of myriad low-velocity molecular shocks (LVMS). This large dispersion spans the full velocity difference between the colliders, i.e. the intruder galaxy and the HI tidal stream (Guillard et al., 2012, 2021).
Here, the CGM into which the outflows penetrate is inflowing at the projected velocity km s-1. The HVS post-shock extent in velocity, provided by the linewidths, ranges from 1000 to 3000 km s-1 (Table 4). From its average value, km s-1, and , we infer km s-1 with a large scatter due to projection effects. It is remarkable that this estimate of a characteristic outflow velocity, based on line emission, falls in the ranges of the blue and red high velocity emissions (Fig. 11). Their complex geometry prevents more accurate estimates. The linewidths also yield the velocity of the large scale HVS that is close to the relative velocity of the colliders, km s-1.
Interestingly, the 122m [NII] line was detected with the 10.4m telescope of the Caltech Submillimeter Observatory of same HPBW at that frequency as the IRAM-30m telescope (Ferkinhoff et al., 2011) while almost resolved out in subsequent ALMA observations (Ferkinhoff et al., 2015). The similarity of the [NII] and velocities and velocity coverages over the same area supports an origin of the [NII] line in which nitrogen would be collisionally excited in the HVS shocks rather than photo-ionised by hard-UV photons.
Now, the emission brings a new perspective on these kpc-scale HVS. Shocks at high Mach number, in which the magnetic field does not store a large fraction of the pre-shock kinetic energy, heat the post-shock medium to a temperature
| (5) |
in a monoatomic gas with a mean molecular weight per particle (Spitzer, 1968). This is equivalent to say that half the pre-shock kinetic energy density is transformed into thermal energy density in the post-shock gas.
It is not the case here since, as in the SQ shock, the molecules would not survive, nor reform fast enough, at such high temperatures. The width of the lines is not thermal but has to trace fast turbulent motions of dense gas. Indeed, the mean turbulent velocity of the LVMS within the post-shock layer of the HVS, 900 km s-1, is commensurate with the sound velocity km s-1 of the HVS post-shock layer heated at K indicating that these turbulent motions of the LVMS within this HVS post-shock layer are about trans-sonic.
The physics of such a turbulent cascade through gas phases of temperatures ranging from K to 100 K is still unknown although beautiful observations have started to stress the importance of turbulence, even in the hot intracluster gas (Zhuravleva et al., 2014, 2019; Li et al., 2020). The existence of dense gas within AGN-driven shocks is consistent with theoretical predictions (Richings & Faucher-Giguère, 2018a, b; Costa et al., 2020). What is new here is that a fraction of the HVS kinetic energy is not thermalized at K, and therefore radiated in X-rays or highly excited lines of ions, but stored in the extremely fast trans-sonic motions of dense molecular gas i.e. the post-shock layers of the LVMS, emitting the lines.
The cascade of kinetic energy has to proceed up to the stage where the turbulent motions drive shocks at km s-1, enabled to efficiently form . It involves a broad distribution of shock velocities, from to 20 km s-1, propagating in a variety of pre-shock densities and gas phases.
In summary, although they are only individual tentative detections, the spatially scattered and broad emission lines, when analysed in conjunction with the high-velocity field and morphology, can be understood as tracing kpc-scale HVS at 1300 km s-1 formed at the interface of AGN- and stellar-driven outflows at km s-1 and inflowing CGM at km s-1, up to distances as large as kpc from the galaxies (in projection). Interestingly, the standard deviation of their projected velocities, 540 km s-1 (Table 3) corresponds to a mean turbulent velocity of their ensemble km s-1, close to .
6.3 Following the energy trails: radiative, turbulent and gravitational luminosities
The above results confirm the multiphase nature of the cold CGM, including cool diffuse and cold dense molecular phases, in addition to the hot and warm phases, over large distances from the galaxies. They also disclose not only the high level of turbulence in the massive CGM but also how and where the stellar- and AGN-driven outflows inject kinetic energy into the CGM (i.e. the myriad shocks seen in emission).
The two questions raised by these results are therefore: (i) are these outflows able to sustain the turbulence observed in such a massive cold CGM over the starburst phase duration? and (ii) are they able to compensate the mass drain of the cold CGM due to the high star formation rate?
The cold phases of the CGM comprise the cool diffuse molecular gas of mass inferred from absorption and denser molecular gas of mass seen as extended CO(1-0) emission with the EVLA (Ivison et al., 2010a) and the GBT (Frayer et al., 2018). Its turbulent luminosity is , where the dynamical time should be similar for the two components.
For the diffuse gas, and km s-1 (Table 2) so that with Myr. The mass of the denser component extending over 25 kpc, , is the mass of the low-excitation component that contributes 75% of the total mass seen in CO(1-0). We adopt the linewidth measured by Frayer et al. (2018) for the low-excitation CO emission, km s-1, so that km s-1, and . Note that Myr for that low-excitation CO component. The turbulent luminosity of the cool and cold CGM (hereafter cold CGM) is therefore for .
We now estimate the mechanical luminosity of the stellar- and AGN-driven outflows from the luminosity of the (=1-0) emission lines, relying on models of UV-irradiated molecular shocks (Godard et al., 2019). The (=1-0) integrated line flux of all the shocks detected by IRAM-30m, Jy km s-1 (see Sect. 3.2), corresponds to a line luminosity, , at the luminosity distance of SMM J023990136, Gpc (Solomon et al., 1997). As in the UV-irradiated shock models of Godard et al. (2019), the transition is found to contribute about 20 of the energy radiated by all the rotational transitions, the total line luminosity, (after correction for lensing), is as large as 5% of the luminosity, (Li et al., 2019). In these shock models, the total flux radiated in the lines follows the kinetic energy flux entering the shocks, with different ratios depending on the pre-shock densities, the shock velocities and UV-irradiations. For shock velocities km s-1 and an UV-irradiation , this ratio increases sharply between 5 and for pre-shock densities between and that are the most appropriate conditions to explain the line intensities (Appendix D). Estimates of this ratio for molecular shocks at higher velocities will be published in a forthcoming paper (Lehmann et al., in prep.) but these higher velocity shocks are J-shocks, much less efficient to form .
The UV-irradiation of the CGM at distances of several 10 kpc from the galaxies is difficult to estimate. However, values as high as or larger, even at distances kpc from L1, are expected in the case of SMM J023990136 given the illumination of the dark-cloud L3 located at kpc from L1 (Li et al., 2019). The bolometric luminosity of SMM J023990136 is (Ivison et al., 2010a). As the AGN contributes 42% of the total FIR luminosity and assuming that the difference between and is entirely due to the AGN, we infer . The UV-luminosity below 912Å is (Li et al., 2019), so that the flux of UV photons expressed in Habing units666Habing flux integrated between 912Å and 2066Å, cm-2 sr -1 at a distance of 20 kpc from L1 depends only on the solid angle of the quasi dust-free lanes opened up by the AGN-driven winds and responsible from the large anisotropy of UV photons around QSOs:
| (6) |
We note that Li et al. (2019) find for the UV-irradiation in the direction of the L3 dark-cloud at 60 kpc from L1. The UV-luminosity of the AGN alone is therefore sufficient to provide over several regions located at the tip of dust-free lanes around L1, to which the contribution of the L2SW starburst should be added. The anisotropy of the UV field at large scale around these galaxies is supported by the scattered structure of the visible spots in Fig.1.
In the following, we therefore adopt as a lower limit of the shock UV-irradiation in the CGM at distances kpc from the galaxies and the upper limit that provides a lower limit to the kinetic luminosity of the ensemble of LVMS, . This is an immense kinetic luminosity that signposts the terminal dissipative step of the energy cascade triggered, within their post-shock layers, by the HVS. Assuming mass and energy flux conservation between HVS and the myriad LVMS and neglecting the radiative losses in the warm gas that are much smaller that the total luminosity, a massive molecular outflow rate is inferred from :
| (7) |
leading to a mass loading factor in the range of those observed for high- starburst galaxies (Veilleux et al., 2020). The spatial pattern of the high-velocity emissions (Fig. 11) supports a joint AGN and starburst driving of the galactic outflows. Indeed, Biernacki & Teyssier (2018) show that only the non-linear coupling of AGN and supernovae feedbacks is able to produce massive and extended outflows.
As the AGN contribution to the kinetic luminosity is necessarily smaller than the above value, we find that , an upper limit broadly consistent with the values inferred from numerical simulations of AGN-driven large-scale outflows, (Costa et al., 2020).
Even taking into account the % of the shock energy dissipated in the LVMS and radiated in the lines (Godard et al., 2019), the kinetic luminosity estimated above, , is more than 10 larger than that needed to sustain the cold CGM turbulence within a radius kpc and over the starburst lifetime. The mass outflow rate sufficient to feed the cold CGM turbulent luminosity, , is therefore much smaller than :
| (8) |
A net mass inflow rate into the cold CGM, is required to reach a steady-state where the cold CGM mass drain due to star formation is compensated jointly by the outflows and the gas inflow. This net mass inflow to the CGM of the galaxy group could be due to the gas tidal streams of the galaxy merger. However, in numerical simulations, tidal streams due to mergers are not found as massive and extended as what is observed here, and are most often seen as outflows, not inflows (Narayanan et al., 2006). The net mass inflow could also be due to gas expelled further away than 20 kpc from the galaxies by the powerful galactic winds, falling back onto the inner CGM if it succeeds at cooling efficiently. Last, it could be due to cold stream accretion onto the host halo of this galaxy group.
We therefore speculate that the missing mass contribution, , whatever its origin, is due to net gas accretion into the inner gravitational potential well of the galaxy group and that the gravitational cooling rate from this infalling material is an additional energy source of the cold CGM turbulence. The gravitational luminosity estimated at a representative distance from the galaxies
| (9) |
for (Aguirre et al., 2013), appears to be also comparable to all the other luminosities:
| (10) |
where the infalling time from distance 40 kpc at km s-1 is still commensurate with the estimated duration of the starburst phase. The gravitational energy is therefore another contribution to the feeding of turbulence of the massive CGM, and as such, it is also eventually lost by radiation in the cool phase, locally heated by turbulent dissipation and producing in the diffuse CGM.
These results reveal the critical role of turbulence in reprocessing the different sources of energy, were they AGN- and starburst-driven outflows or large-scale gravitational energy of infalling streams, down to the kinetic and thermal energy of the cool phase, in which this energy is eventually radiated and lost.
All the above rates are order-of-magnitude estimates in agreement with the model of Bouché et al. (2010). They show that, although a merger is accelerating the process of star formation in this system, the star formation and black-hole growth are most likely fuelled, ultimately, by large-scale accretion. It is not possible, at this stage to distinguish the origin of the infalling gas, namely cold stream accretion or recycled outflows. Any infalling gas of low metallicity may just be indistinguishable in the inner tens of kpc of the CGM because it is mixed with powerful outflows and metal-enriched by small-scale turbulent mixing, as shown in numerical simulations (e.g. Shen et al., 2013). As a final note, it is fascinating to observers that the theoretical predictions for the total mass inflow rate onto the host halo (Dekel et al., 2009), and the numerical results for both the smooth and merger-based baryon accretion efficiencies at redshift (Wright et al., 2020), be so close to our estimated infall rate for a halo mass , and a cosmological baryon fraction . If not due to chance, this would suggest that the contribution of recycled outflows to the gas infall in this galaxy group is low.
7 Summary and open questions
Unexpectedly, the and lines observed, at high angular and spectral resolution, towards the galaxy group SMM J023990136, provide coherent and complementary information on the dynamics of the multiphase CGM. The main results are summarized as follows:
-
•
The co-existence of the two cool and warm thermal phases up to distances 20 kpc in the CGM of the galaxies validates, in this case, the critical assumptions made to interpret the absorption lines detected against the continuum emission of several starburst galaxies (Paper I). It supports the turbulent framework itself and the link between the abundance in diffuse gas and the turbulent dissipation rate.
-
•
Inflow of the massive, multiphase, highly turbulent CGM towards the galaxies at an average velocity km s-1 is ascertained, from both the redshifted absorption with respect to the velocity of the galaxies and the detailed comparison of the , and CO line profiles.
-
•
Multiple kpc-scale shocks are tentatively detected as broad emission lines ( km s-1 on average) at the interface of the inflowing CGM and the high-velocity emission of galactic winds from the AGN and the starburst galaxy. They are scattered in the CGM, up to kpc from the galaxies. They trigger turbulent cascades in the post-shock gas, generating a hierarchy of shocks, from the high-velocity shocks (HVS) at 1000 km s-1 down to the low-velocity molecular shocks at km s-1, where can form efficiently. The HVS kinetic energy density is not fully thermalized in the post-shock layer.
-
•
While the immense kinetic luminosity of the shock ensemble signposts powerful AGN- and starburst-driven outflows likely enabled to eject considerable amounts of gas out of the galaxies potential well, only % of this kinetic luminosity is required to sustain turbulence in the cold CGM. However, a net mass accretion, at a rate yr-1 is required to balance the mass drain of the cold CGM due to star formation. The loss of gravitational energy of this infalling gas is an additional energy source for the CGM turbulence.
These results, obtained in the galaxy group of SMM J023990136, illustrate the invaluable complementarity of the lines and molecular line tracers, as different as high- CO and lines, in unraveling not only the complex physics of the turbulent, multiphase CGM, but also the disheartening intricacy of the radiative transfer. They suggest that there is thermal cooling and shock contributions to the emission.
Because of a conjunction of three unrelated properties, i.e. its highly endothermic formation, its UV-driven abundance enhancement and its high dipole moment, is a very unique molecular species that provides a wealth of clues inaccessible to other tracers. The lines do not only trace the presence of diffuse molecular gas, of density marginally able to excite the low- CO lines, but they also highlight the bursts of dissipation of mechanical energy, either in emission in UV-irradiated shocks where CO is photo-dissociated, or in absorption, on the sites of intermittent dissipation of turbulence in the cool diffuse gas.
These results reveal the critical role of turbulence in channeling energy and momentum across gas phases and scales, drastically modifying the timescales over which the energy is lost by radiation. The amount of energy stored in fast turbulent motions of cool gas and eventually radiated in low-excitation lines has probably been broadly underestimated.
Lastly, some fine tuning in terms of mass and energy seems to be at work in this galaxy group between the AGN and stellar feedback, the gravitational infall and the star formation rate. While the starburst phase is triggered by the galaxy merger, the steady-state suggested by the existence of the massive turbulent reservoir of cool gas, i.e. the cold CGM, requires large-scale accretion
How is the gravitational potential energy shared between the turbulent and thermal energy of the warm and cool gas in the CGM remains an open issue that could be addressed with future observations of the cooling radiation of the diffuse molecular gas (i.e. the [CII] line, – unfortunately not accessible from ground-based telescopes in this source – and the pure rotational lines of . A similar question opens up for the prodigious shock kinetic energy at the interface of galactic outflows and the CGM, with the additional complexity borne by the hot gas and the multiphase nature of the post-shock gas.
Acknowledgements
We are grateful to the referee for their thorough comments that led us to explore new facets of this study. We thank Dr Vinod Arumugam for creating Fig. 1. This paper makes use of the data under project numbers: ADS/JAO.ALMA2016.1.00282.S (ALMA), U128 (Keck/KCWI) and 086-19 (IRAM 30-m). They are all publicly available in the corresponding archives. ALMA is a partnership of ESO (representing its member states), NSF (USA) and NINS (Japan), together with NRC (Canada) and NSC and ASIAA (Taiwan), in cooperation with the Republic of Chile. The Joint ALMA Observatory is operated by ESO, AUI/NRAO and NAOJ. NRAO is a facility of the NSF operated under cooperative agreement by Associated Universities, Inc.. IRAM is supported by INSU/CNRS (France), MPG (Germany) and IGN (Spain). W. M. Keck Observatory is operated as a scientific partnership among the California Institute of Technology, the University of California and the National Aeronautics and Space Administration. A.V.-G., E.F. and B.G. acknowledge support from the European Research Council Advanced Grant MIST (No 742719, PI: E. Falgarone).
References
- Aguirre et al. (2013) Aguirre P., Baker A. J., Menanteau F., Lutz D., Tacconi L. J., 2013, ApJ, 768, 164
- Agúndez et al. (2010) Agúndez M., Goicoechea J. R., Cernicharo J., Faure A., Roueff E., 2010, ApJ, 713, 662
- Amano (2010) Amano T., 2010, ApJ, 716, L1
- Appleton et al. (2013) Appleton P. N., et al., 2013, ApJ, 777, 66
- Appleton et al. (2017) Appleton P. N., et al., 2017, ApJ, 836, 76
- Arrigoni Battaia et al. (2018) Arrigoni Battaia F., Prochaska J. X., Hennawi J. F., Obreja A., Buck T., Cantalupo S., Dutton A. A., Macciò A. V., 2018, MNRAS, 473, 3907
- Bennett & Sijacki (2020) Bennett J. S., Sijacki D., 2020, MNRAS, 499, 597
- Berta et al. (2021) Berta S., et al., 2021, A&A, 646, A122
- Bielby et al. (2020) Bielby R. M., et al., 2020, MNRAS, 493, 5336
- Biernacki & Teyssier (2018) Biernacki P., Teyssier R., 2018, MNRAS, 475, 5688
- Blecha et al. (2018) Blecha L., Snyder G. F., Satyapal S., Ellison S. L., 2018, MNRAS, 478, 3056
- Bouché et al. (2010) Bouché N., et al., 2010, ApJ, 718, 1001
- Bouché et al. (2013) Bouché N., Murphy M. T., Kacprzak G. G., Péroux C., Contini T., Martin C. L., Dessauges-Zavadsky M., 2013, Science, 341, 50
- Bussmann et al. (2013) Bussmann R. S., et al., 2013, ApJ, 779, 25
- Bustamante et al. (2018) Bustamante S., Sparre M., Springel V., Grand R. J. J., 2018, MNRAS, 479, 3381
- Cai et al. (2017) Cai Z., et al., 2017, ApJ, 837, 71
- Carilli & Walter (2013) Carilli C. L., Walter F., 2013, ARA&A, 51, 105
- Carter et al. (2012) Carter M., et al., 2012, A&A, 538, A89
- Costa et al. (2020) Costa T., Pakmor R., Springel V., 2020, MNRAS, 497, 5229
- Davé et al. (2020) Davé R., Crain R. A., Stevens A. R. H., Narayanan D., Saintonge A., Catinella B., Cortese L., 2020, MNRAS, 497, 146
- Dekel et al. (2009) Dekel A., et al., 2009, Nature, 457, 451
- Diego et al. (2016) Diego J. M., Broadhurst T., Wong J., Silk J., Lim J., Zheng W., Lam D., Ford H., 2016, MNRAS, 459, 3447
- Dijkstra (2017) Dijkstra M., 2017, arXiv e-prints,
- Douglas & Herzberg (1941) Douglas A. E., Herzberg G., 1941, ApJ, 94, 381
- Draine (1986) Draine B. T., 1986, ApJ, 310, 408
- Eales et al. (2010) Eales S., et al., 2010, PASP, 122, 499
- Faisst et al. (2020) Faisst A. L., et al., 2020, ApJS, 247, 61
- Falgarone et al. (2004) Falgarone E., Hily-Blant P., Levrier F., 2004, Ap&SS, 292, 89
- Falgarone et al. (2017) Falgarone E., et al., 2017, Nature, 548, 430
- Faucher-Giguère & Quataert (2012) Faucher-Giguère C.-A., Quataert E., 2012, MNRAS, 425, 605
- Faucher-Giguère et al. (2010) Faucher-Giguère C.-A., Kereš D., Dijkstra M., Hernquist L., Zaldarriaga M., 2010, ApJ, 725, 633
- Federman et al. (1996) Federman S. R., Rawlings J. M. C., Taylor S. D., Williams D. A., 1996, MNRAS, 279, L41
- Ferkinhoff et al. (2011) Ferkinhoff C., et al., 2011, ApJ, 740, L29
- Ferkinhoff et al. (2015) Ferkinhoff C., Brisbin D., Nikola T., Stacey G. J., Sheth K., Hailey-Dunsheath S., Falgarone E., 2015, ApJ, 806, 260
- Flower et al. (1998) Flower D. R., Roueff E., Zeippen C. J., 1998, Journal of Physics B Atomic Molecular Physics, 31, 1105
- Frayer et al. (1998) Frayer D. T., Ivison R. J., Scoville N. Z., Yun M., Evans A. S., Smail I., Blain A. W., Kneib J.-P., 1998, ApJ, 506, L7
- Frayer et al. (1999) Frayer D. T., et al., 1999, ApJ, 514, L13
- Frayer et al. (2018) Frayer D. T., Maddalena R. J., Ivison R. J., Smail I., Blain A. W., Vanden Bout P., 2018, ApJ, 860, 87
- Fu et al. (2021) Fu H., Xue R., Prochaska J. X., Stockton A., Ponnada S., Lau M. W., Cooray A., Narayanan D., 2021, ApJ, 908, 188
- Fujimoto et al. (2019) Fujimoto S., et al., 2019, arXiv e-prints, p. arXiv:1902.06760
- Gabor & Bournaud (2014) Gabor J. M., Bournaud F., 2014, MNRAS, 441, 1615
- Gaspari et al. (2013) Gaspari M., Ruszkowski M., Oh S. P., 2013, MNRAS, 432, 3401
- Gaspari et al. (2017) Gaspari M., Temi P., Brighenti F., 2017, MNRAS, 466, 677
- Gavazzi et al. (2011) Gavazzi R., et al., 2011, ApJ, 738, 125
- Genzel et al. (2003) Genzel R., Baker A. J., Tacconi L. J., Lutz D., Cox P., Guilloteau S., Omont A., 2003, ApJ, 584, 633
- Gerin et al. (2016) Gerin M., Neufeld D. A., Goicoechea J. R., 2016, ARA&A, 54, 181
- Gnat & Ferland (2012) Gnat O., Ferland G. J., 2012, ApJS, 199, 20
- Godard & Cernicharo (2013) Godard B., Cernicharo J., 2013, A&A, 550, A8
- Godard et al. (2009) Godard B., Falgarone E., Pineau des Forêts G., 2009, A&A, 495, 847
- Godard et al. (2014) Godard B., Falgarone E., Pineau des Forêts G., 2014, A&A, 570, A27
- Godard et al. (2019) Godard B., Pineau des Forêts G., Lesaffre P., Lehmann A., Gusdorf A., Falgarone E., 2019, A&A, 622, A100
- Goerdt & Ceverino (2015) Goerdt T., Ceverino D., 2015, MNRAS, 450, 3359
- Gredel et al. (1993) Gredel R., van Dishoeck E. F., Black J. H., 1993, A&A, 269, 477
- Greve et al. (2005) Greve T. R., et al., 2005, MNRAS, 359, 1165
- Gronke & Oh (2020) Gronke M., Oh S. P., 2020, MNRAS, 494, L27
- Guillard et al. (2012) Guillard P., et al., 2012, ApJ, 747, 95
- Guillard et al. (2021) Guillard P., et al., 2021, arXiv e-prints, p. arXiv:2102.06843
- Hafen et al. (2019) Hafen Z., et al., 2019, MNRAS, 488, 1248
- Herrera-Camus et al. (2020) Herrera-Camus R., et al., 2020, A&A, 633, L4
- Hodge & da Cunha (2020) Hodge J. A., da Cunha E., 2020, Royal Society Open Science, 7, 200556
- Hopkins et al. (2018) Hopkins P. F., et al., 2018, MNRAS, 480, 800
- Ikarashi et al. (2017) Ikarashi S., et al., 2017, ApJ, 849, L36
- Indriolo et al. (2018) Indriolo N., Bergin E. A., Falgarone E., Godard B., Zwaan M. A., Neufeld D. A., Wolfire M. G., 2018, ApJ, 865, 127
- Ivison et al. (1998) Ivison R. J., Smail I., Le Borgne J.-F., Blain A. W., Kneib J.-P., Bezecourt J., Kerr T. H., Davies J. K., 1998, MNRAS, 298, 583
- Ivison et al. (2010a) Ivison R. J., Smail I., Papadopoulos P. P., Wold I., Richard J., Swinbank A. M., Kneib J. P., Owen F. N., 2010a, MNRAS, 404, 198
- Ivison et al. (2010b) Ivison R. J., et al., 2010b, A&A, 518, L35
- Ivison et al. (2011) Ivison R. J., Papadopoulos P. P., Smail I., Greve T. R., Thomson A. P., Xilouris E. M., Chapman S. C., 2011, MNRAS, 412, 1913
- Johnson et al. (2014) Johnson T. L., Sharon K., Bayliss M. B., Gladders M. D., Coe D., Ebeling H., 2014, ApJ, 797, 48
- Kennicutt (1998) Kennicutt Robert C. J., 1998, ApJ, 498, 541
- Laursen et al. (2009) Laursen P., Sommer-Larsen J., Andersen A. C., 2009, ApJ, 704, 1640
- Lehmann et al. (2020a) Lehmann A., Godard B., Pineau des Forêts G., Falgarone E., 2020a, in da Cunha E., Hodge J., Afonso J., Pentericci L., Sobral D., eds, IAU Symposium Vol. 352, IAU Symposium. pp 73–74, doi:10.1017/S1743921320000654
- Lehmann et al. (2020b) Lehmann A., Godard B., Pineau des Forêts G., Falgarone E., 2020b, A&A, 643, A101
- Lesaffre et al. (2013) Lesaffre P., Pineau des Forêts G., Godard B., Guillard P., Boulanger F., Falgarone E., 2013, A&A, 550, A106
- Li et al. (2019) Li Q., et al., 2019, ApJ, 875, 130
- Li et al. (2020) Li Y., et al., 2020, ApJ, 889, L1
- Lochhaas et al. (2020) Lochhaas C., Bryan G. L., Li Y., Li M., Fielding D., 2020, MNRAS, 493, 1461
- Lotz et al. (2017) Lotz J. M., et al., 2017, ApJ, 837, 97
- Madau & Dickinson (2014) Madau P., Dickinson M., 2014, ARA&A, 52, 415
- Magnelli et al. (2012) Magnelli B., et al., 2012, A&A, 539, A155
- Miville-Deschênes et al. (2017) Miville-Deschênes M.-A., Murray N., Lee E. J., 2017, ApJ, 834, 57
- Narayanan et al. (2006) Narayanan D., et al., 2006, ApJ, 642, L107
- Narayanan et al. (2015) Narayanan D., et al., 2015, Nature, 525, 496
- Nims et al. (2015) Nims J., Quataert E., Faucher-Giguère C.-A., 2015, MNRAS, 447, 3612
- Oh et al. (2015) Oh S. H., Kim W.-T., Lee H. M., 2015, ApJ, 807, 73
- Oliver et al. (2010) Oliver S. J., et al., 2010, A&A, 518, L21
- Pearson & Drouin (2006) Pearson J. C., Drouin B. J., 2006, ApJ, 647, L83
- Planck Collaboration et al. (2020) Planck Collaboration et al., 2020, A&A, 641, A6
- Richard et al. (2010) Richard J., Kneib J. P., Limousin M., Edge A., Jullo E., 2010, MNRAS, 402, L44
- Richard et al. (2014) Richard J., et al., 2014, MNRAS, 444, 268
- Richings & Faucher-Giguère (2018a) Richings A. J., Faucher-Giguère C.-A., 2018a, MNRAS, 474, 3673
- Richings & Faucher-Giguère (2018b) Richings A. J., Faucher-Giguère C.-A., 2018b, MNRAS, 478, 3100
- Riechers et al. (2013) Riechers D. A., et al., 2013, Nature, 496, 329
- Rupke (2018) Rupke D., 2018, Galaxies, 6, 138
- Salpeter (1955) Salpeter E. E., 1955, ApJ, 121, 161
- Schaye et al. (2015) Schaye J., et al., 2015, MNRAS, 446, 521
- Schroetter et al. (2019) Schroetter I., et al., 2019, MNRAS, 490, 4368
- Shen et al. (2013) Shen S., Madau P., Guedes J., Mayer L., Prochaska J. X., Wadsley J., 2013, ApJ, 765, 89
- Solomon et al. (1997) Solomon P. M., Downes D., Radford S. J. E., Barrett J. W., 1997, ApJ, 478, 144
- Somerville & Davé (2015) Somerville R. S., Davé R., 2015, ARA&A, 53, 51
- Spitzer (1968) Spitzer Lyman J., 1968, Dynamics of Interstellar Matter and the Formation of Stars. p. 1
- Tacconi et al. (2008) Tacconi L. J., et al., 2008, ApJ, 680, 246
- Tacconi et al. (2020) Tacconi L. J., Genzel R., Sternberg A., 2020, arXiv e-prints, p. arXiv:2003.06245
- Tumlinson et al. (2017) Tumlinson J., Peeples M. S., Werk J. K., 2017, ARA&A, 55, 389
- Valdivia et al. (2017) Valdivia V., Godard B., Hennebelle P., Gerin M., Lesaffre P., Le Bourlot J., 2017, A&A, 600, A114
- Veilleux et al. (2020) Veilleux S., Maiolino R., Bolatto A. D., Aalto S., 2020, A&ARv, 28, 2
- Verhamme et al. (2006) Verhamme A., Schaerer D., Maselli A., 2006, A&A, 460, 397
- Vernet & Cimatti (2001) Vernet J., Cimatti A., 2001, A&A, 380, 409
- Voit et al. (2020) Voit G. M., et al., 2020, ApJ, 899, 70
- Walter et al. (2020) Walter F., et al., 2020, arXiv e-prints, p. arXiv:2009.11126
- Wright et al. (2020) Wright R. J., Lagos C. d. P., Power C., Mitchell P. D., 2020, MNRAS, 498, 1668
- Yang et al. (2017) Yang C., et al., 2017, A&A, 608, A144
- Zabl et al. (2019) Zabl J., et al., 2019, MNRAS, 485, 1961
- Zhang et al. (2018) Zhang Z.-Y., Romano D., Ivison R. J., Papadopoulos P. P., Matteucci F., 2018, Nature, 558, 260
- Zhuravleva et al. (2014) Zhuravleva I., et al., 2014, Nature, 515, 85
- Zhuravleva et al. (2019) Zhuravleva I., Churazov E., Schekochihin A. A., Allen S. W., Vikhlinin A., Werner N., 2019, Nature Astronomy, 3, 832
- van der Tak et al. (2007) van der Tak F. F. S., Black J. H., Schöier F. L., Jansen D. J., van Dishoeck E. F., 2007, A&A, 468, 627
Appendix A The manna
is a most fragile species: it has a highly endoenergic formation ( eV) and a fast destruction rate, by collisions with H and . In diffuse and weakly irradiated gas, a warm chemistry activated by dissipation of turbulence in shocks and/or intense velocity shears has been proposed to overcome its fast destruction (Flower et al., 1998; Lesaffre et al., 2013; Godard et al., 2014). Turbulent transport in a biphase medium comprising a cold ( K) and a warm ( K) phase may also contribute to the production in diffuse gas (Valdivia et al., 2017).
Once formed, its lifetime is so short,
| (11) |
that, unlike the CO molecule, is always observed where it formed, i.e. it cannot be transported. Here, is the fraction.
being a light hydride with high dipole moment, the critical density ( ) of its 1–0 transition is almost 10 larger than that of CO(1–0), so the line appears in absorption in low-density gas ( ). In emission, the = 1–0 line is detected only in dense and UV-illuminated gas, either photon-dominated regions (PDRs) or UV-irradiated shocks because, unlike most molecules, the abundance of is enhanced in intense UV fields (Agúndez et al., 2010; Godard & Cernicharo, 2013; Godard et al., 2019).
We recall here the method we devised in Paper I to infer the radius and mass of the reservoir of diffuse molecular gas from the observables: the radius and flux of the sub-mm background continuum source and the width and opacity of the absorption line.
The dominant driver of production in the diffuse gas causing the absorptions is assumed to be turbulent energy dissipation. As in a steady turbulent cascade, the energy dissipation and transfer rates balance each other, the dissipation rate per unit volume is , where and are the unknown sizescale and mean mass density of the part of the turbulent reservoir sampled by absorption and is its mean turbulent velocity inferred from the width of the absorption line. Absorption lines provide the column density of molecules and therefore the number of molecules in the volume subtended by the background continuum source of radius and the unknown length of the line-of-sight across the diffuse CGM. Because we know that these molecules formed in that volume (i.e. they cannot be transported), we know that the energy injection rate due to turbulent dissipation required to sustain the observed number of molecules in that volume has to be:
| (12) |
It only depends on the observed absorption line (see Eq. (2)) and the known values and . The injection rate of turbulent energy in that same volume is:
| (13) |
and a fraction of this energy flux is feeding the warm chemistry:
| (14) |
An estimate is inferred from observations in the Milky Way as follows. The abundances measured in the Solar Neighbourhood are about 3 smaller than those measured in the inner Milky Way, at galactic radii between 4 and 6 kpc (Godard et al., 2014). An exponential decrease of the turbulent energy transfer rate is found between the Inner Galaxy and the Solar Neigborhood from the analysis of CO(1-0) surveys, providing a similar ratio of the values of at these two galactic radii (Miville-Deschênes et al., 2017). Since the turbulent cascade has been found to pervade the atomic medium and the molecular clouds down to the smallest non-star forming cores with a similar energy transfer rate in the Solar Neighborhood (Falgarone et al., 2004), we assume that the same radial dependence applies to the entire cold interstellar medium (ISM):
| (15) |
where is the total column density of the cool hydrogen along the lines-of-sight, being provided by the 21cm absorption optical depth and by CH and HF absorptions over the same velocity intervals (Godard et al., 2014). We find ()-1 from the observed variations of abundances and wiih the Galactic radius. From Eq. (A4) adapted to the Galactic environment, we infer:
| (16) |
where is the mean density of the cool diffuse ISM. An important assumption is made here: the same mean density is relevant for the turbulent energy transfer rate and the mean density of the gas in which is observed in absorption. This is because the bulk of the gas mass is assumed to be that of the cool molecular phase ( K) while the bulk of the volume is filled with the warm phase ( K). This mean density is not the local density , involved in the collisional destruction rate of (Eq. (A1)) .
The gas mass contributing to the absorption is therefore:
| (17) |
where is the mean mass per particle, and the turbulent energy flux pervading that mass, and eventually dissipated in the same volume, is:
| (18) |
Using Eq.(A4), we then infer:
| (19) |
The mass of the turbulent reservoir is then computed by assuming mass conservation across the different shells, regardless of the global inward/outward or turbulent motions, so that its average density decreases with radius as , for an assumed spherical geometry. In that case the hydrogen column density at impact parameter decreases as and the total gas mass is
| (20) |
where inferred from the absorption lines is half the average hydrogen column density within the radius .
Introducing , the total gas mass depends only on the absorption opacity, as shown in Paper I:
| (21) |
where we have introduced , Myr for the lifetime of the turbulent reservoirs, the local gas density that determines the lifetime, A mean mass per particle is adopted.
Appendix B The lensing model
SMM J023990136 is gravitationally lensed by the cluster Abell (Ivison et al., 2010a). The mass distribution of this cluster has been studied in Richard et al. (2010) from the constraints given by multiply lensed background sources observed with bands F475W/F625W and F814W from HST/ACS. These authors assumed for their lens model a bimodal pseudo-isothermal elliptical mass distribution. More recently Diego et al. (2016) have found an alternative way of deriving a free-form mass distribution by analysing the latest HST Frontier images and GLASS spectroscopy. In general, different authors find a good consistency between different models taking into account two cluster clumps and taking independent subsamples of lensed sources as constraints. We recall that the goal of this work is to study the background source rather than to obtain a very detailed modelling of the lens. Since SMM J023990136 is located far from the centres of these two cluster clumps, it is not strongly lensed and a simplification of the lensing model is justified.
In order to derive some of the intrinsic properties of the background source we correct from the distortion and magnification of A using slfit (Gavazzi et al., 2011). This code adopts the standard Metropolis-Hastings algorithm, a standard Markov chain Monte Carlo (MCMC) method, to explore the space of parameters which best reproduces the observed data in the source plane. Given a set of parameters describing the lens model and the luminosity profile(s) of the background source(s), the code builds samples of the posterior probability distribution function of these parameters. We describe the lens as a singular isothermal ellipsoid (SIE) mass distribution centred on the cluster position obtained by Richard et al. (2010). We also fix the minor-to-major axis ratio and orientation of the major axis in the plane of the sky () of the lens to 0.4 and 90.0 degrees respectively. To model the data in the background plane we assume two sources and adopt an elliptical Sersic profile for their luminosity, leaving the rest of the parameters free. These include for each source , PA, its relative position with respect to the lens centre, its effective radius and its intrinsic flux.
We obtain a magnification factor for L2SW and for L1, in agreement with the range of values obtained in the literature (Sect. 1). We derive an effective radius of arcsec corresponding to a physical size of 1.8 kpc for L2SW and a radius of kpc for L1, adopting for both the same redshift and the Planck cosmology (, ).
Appendix C Statistical significance of the emission structures
As illustrated in Sect. 3.1, the tentative structures of line emission are complex and not well suited to state-of-the-art statistical analysis of e.g. continuum point-sources observed by ALMA. The statistical confirmation of their existence has to be conducted in space and velocity-space jointly, because the structures are highly dynamical (see Sect. 6.2) and their boundary and shape depend on the velocity range over which the line emission is integrated. They are spatially extended and often elongated with the shortest dimensions in some cases barely resolved. Their moment-0 values are comparable to the negative values of the minima visible in the moment-0 maps.
These negative spots can be understood as combined sidelobes of multiple extended weak sources, scattered in the ALMA primary beam. As an example, the conspicuous negative feature close to the phase centre (2 arcsec South of L2SW) and extending over ALMA synthesised beam, is due to a very broad (FWHM = 2600 km s-1) line with a peak intensity of -0.3 mJy. Such a large linewidth suggests that it results from the chance combination of negative sidelobes of multiple emissions of narrower width. The order of magnitude of its intensity can be recovered for a total extent of the eight central structures of average size arcsec2, equivalent to synthesised beams, an average linewidth of 1330 km s-1 and an average flux of 0.2 mJy (Table 2): the combination of the sidelobes of 16 of these synthesised beams would be enough.
To assess the reality of an excess of extended positive structures in the moment-0 maps and its dependence on the distance to the centre of phase, we have identified in four moment-0 maps ensembles of neighbouring pixels brighter than (or weaker than ) and connected over areas more extended that one ALMA synthesised beam. In Fig. 14, the excess number of pixels with positive moment-0 values over those with negative values, normalised to the total number of pixels within a given radius, is displayed as a function of this radius (i.e. the distance to the phase centre). The left panel displays this excess for all the connected structures above (and weaker than ) , whatever their size, and the right panel considers only the pixels in structures larger than one synthesised beam area. In the latter case, the excess of positive structures above those negative is statistically significant within 4.5 arcsec from the phase centre. This limit depends on the moment-0 map, as the positive excess computed over [500,1500] km s-1 remains significant up to a distance of 6 arcsec. This velocity interval corresponds to the velocity range where the emission is the most intense (Fig. 6).
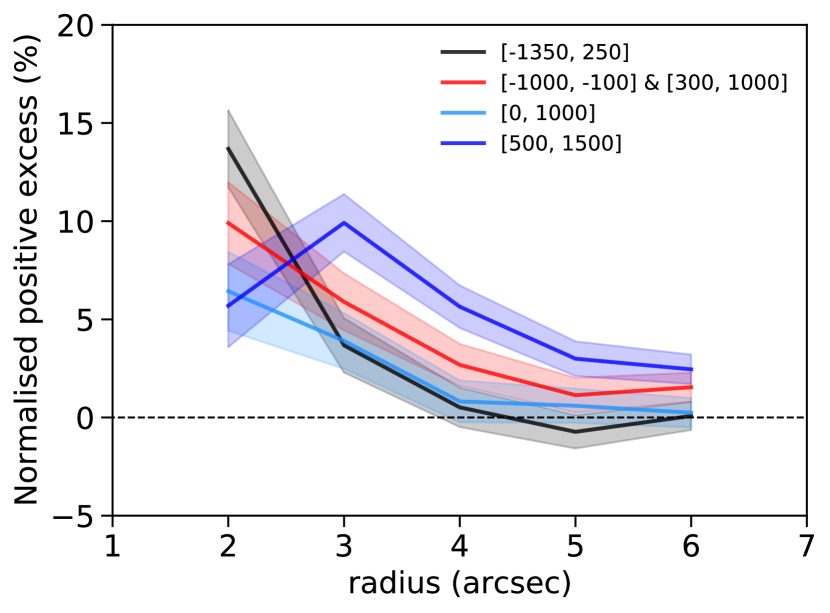
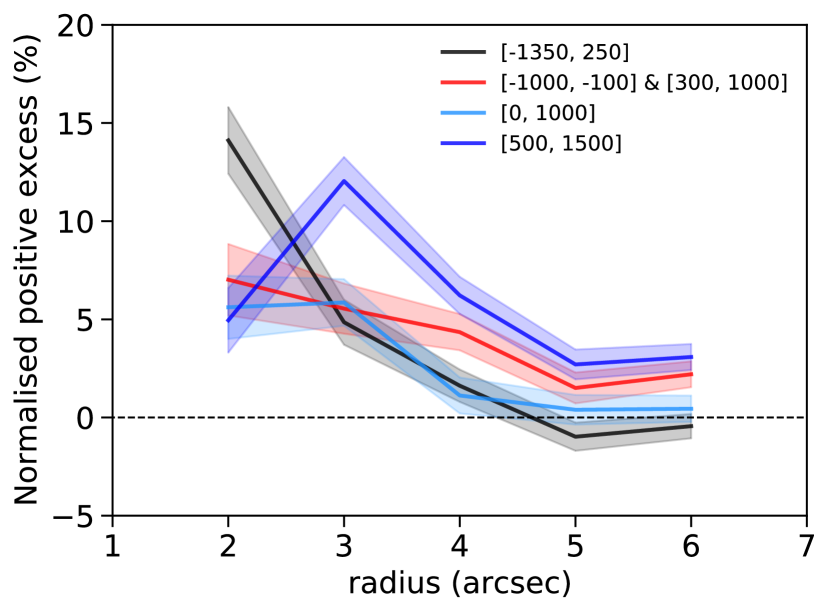
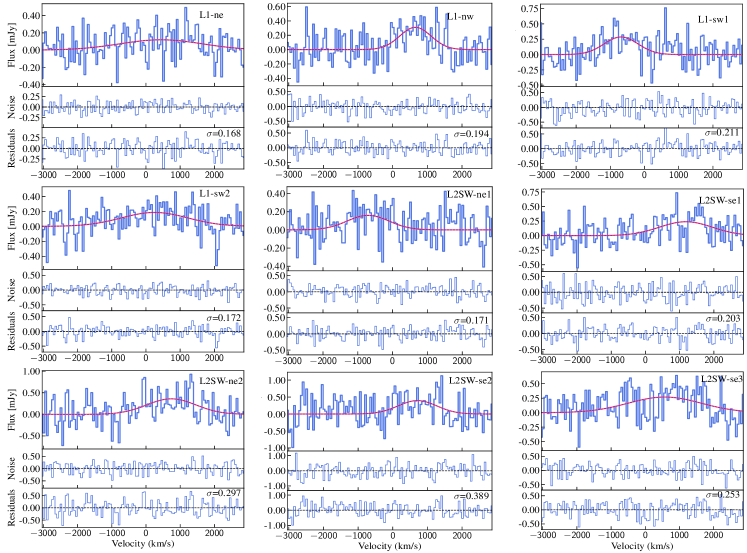
Appendix D Results of non-LTE radiative transfer
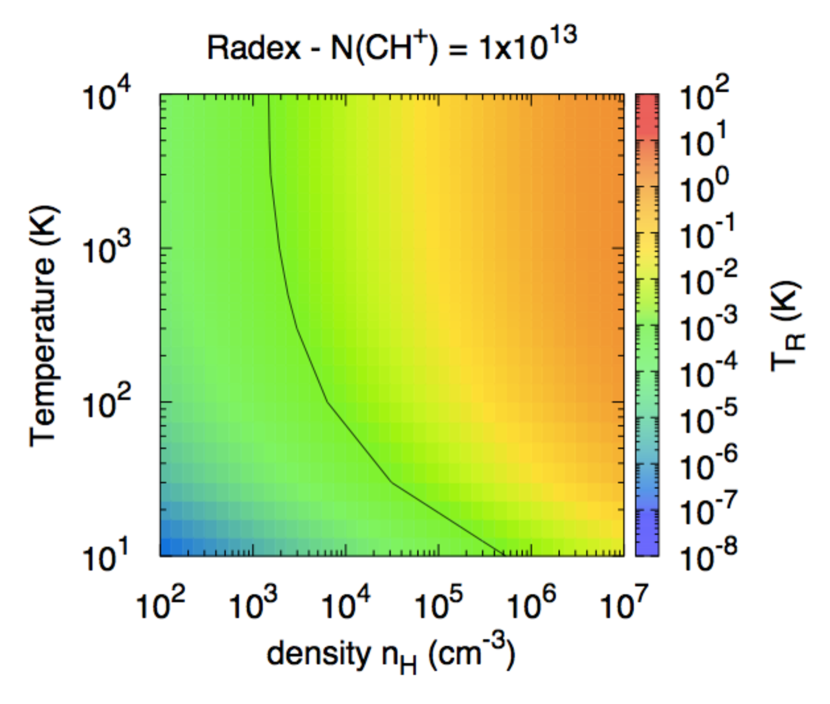
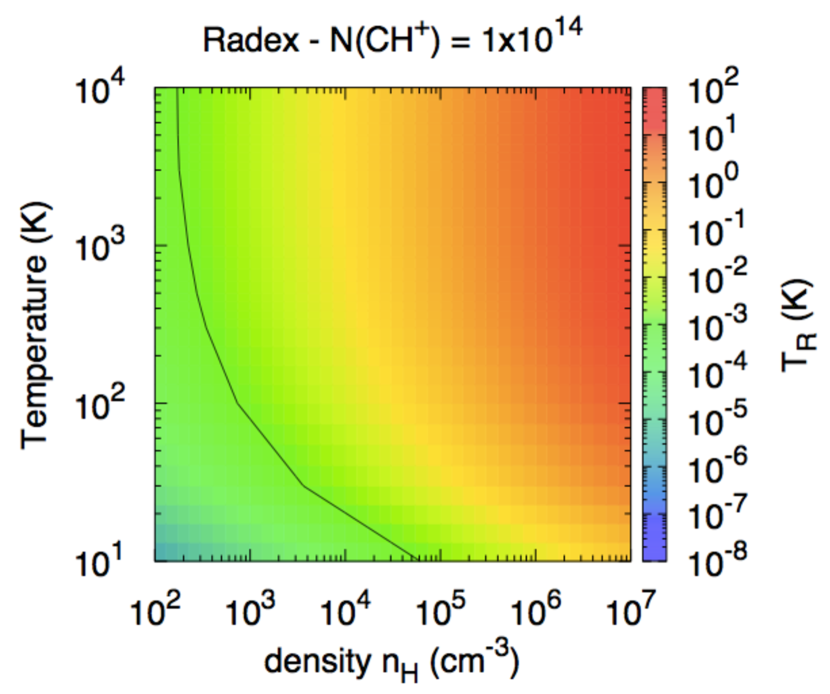
The average peak emission line brightness of the thirteen kpc-scale shocks identified in the field is 0.07 mJy/beam inferred from their average flux density, 0.25 mJy, and solid angle 0.75 arcsec2, or 3.6 beams (Table 3. We express this line brightness in mean brightness temperature, following the basic expressions of the line luminosity in the distant universe (Solomon et al., 1997). At the redshift of the source , we find that
| (22) |
where is the observed wavelength and the synthesised beam. The mean (1-0) line brightness of the extended sources detected by ALMA is therefore mK.
The results of non-LTE radiative transfer computed with RADEX (van der Tak et al., 2007) are displayed in Fig.16 for two column densities and a velocity dispersion km s-1 representative of the intermediate velocity molecular shock models we consider (Godard et al., 2019; Lehmann et al., 2020a). Densities larger than are required to produce the line intensities, even at high temperatures. The black curves correspond to the line temperature at which , where is the line excitation temperature and is the temperature of the continuum background source. These lines separate the parameter domain where the line is seen in emission from that where it is seen in absorption against the continuum background. The lines drawn here, mK, are computed for K. For the smaller continuum fluxes of L1 and L2SW, the curves separating absorption from emission are at mK, in the middle of the green area.
Appendix E Further comparison of the and high-velocity emissions
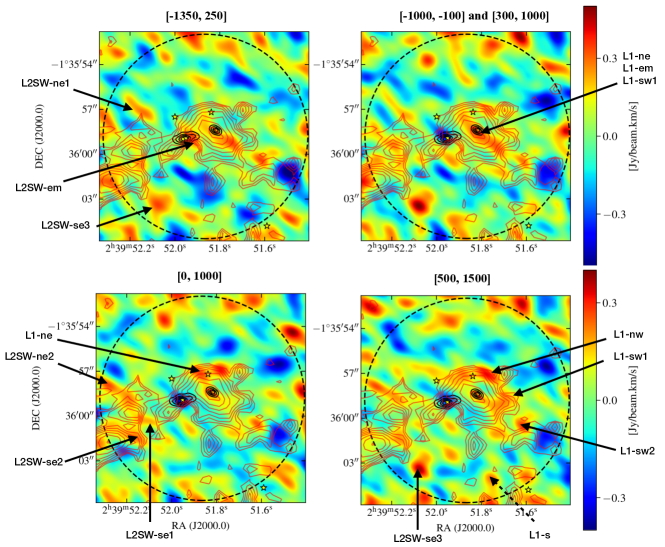
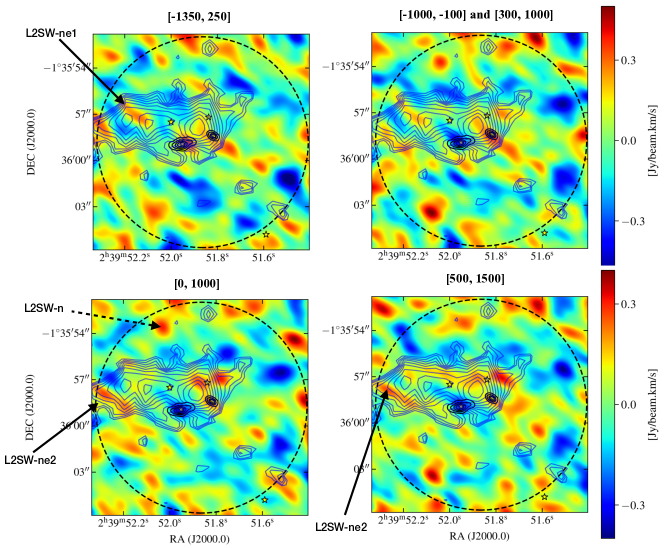
Smoothed versions of selected moment-0 maps are compared with the high-velocity contours in Fig. 17. The smoothed moment-0 maps are not computed as a spatial convolution of the moment-0 maps, with a beam twice larger than the original resolution, but on the original continuum-subtracted spectra. This is why the maps of Fig. 17 do not look like a spatially-smoothed version of those of Figs. 2 to 4.
These figures show that the emission structures identified in the native resolution moment-0 maps are indeed connected by large and weaker structures that exquisitely follow the contours of the high-velocity maps. We stress the following features:
(1) the elongated NE-SW feature across L1 in the [-1000,-100] and [300,1000] km s-1 moment-0 maps comprises L1-ne, L1-em, L1-sw1 and L1-sw2 and is parallel to the broad orientation of the [1000,1500] km s-1 contours,
(2) L1-nw, L1-ne and L1-sw1 are parts of a ring in the [500,1500] km s-1 moment-0 map that closely follows the edge of the red HV contours,
(3) same kind of coincidence for L2SW-se2 in the [0,1000] km s-1 moment-0 map and L2SW-em in the [-1350,250] km s-1 moment-0 map with the red HV contours,
(4) L2SW-se3, L2SW-se2, L2SW-ne1 located at the tip of elongated structures in the red HV map,
(5) a weak and elongated lane in the [500,1500] moment-0 map follows the northern edge of the blue HV contours as does L2SW-ne2 at their South-Eastern edge.
There are a few additional structures that have not been selected, such as that 2" south of L2SW in the [-1000,-100] and [300,1000] km s-1 moment-0 map, but as said in Sect. 3.1, the goal of this selection is not to make a complete census of all the emission spots detected by ALMA but to shed light on a specific process, namely the molecular shocks at the interface of the CGM and outflows, seen as positive and negative high-velocity emission.