Preprint \SetWatermarkColor[gray]0.9 \SetWatermarkFontSize3cm \SetWatermarkAngle30 \SetWatermarkHorCenter11cm
Algorithmic Audit of Italian Car Insurance:
Evidence of Unfairness in Access and Pricing
Abstract.
We conduct an audit of pricing algorithms employed by companies in the Italian car insurance industry, primarily by gathering quotes through a popular comparison website. While acknowledging the complexity of the industry, we find evidence of several problematic practices. We show that birthplace and gender have a direct and sizeable impact on the prices quoted to drivers, despite national and international regulations against their use. Birthplace, in particular, is used quite frequently to the disadvantage of foreign-born drivers and drivers born in certain Italian cities. In extreme cases, a driver born in Laos may be charged 1,000€ more than a driver born in Milan, all else being equal. For a subset of our sample, we collect quotes directly on a company website, where the direct influence of gender and birthplace is confirmed. Finally, we find that drivers with riskier profiles tend to see fewer quotes in the aggregator result pages, substantiating concerns of differential treatment raised in the past by Italian insurance regulators.
1. Introduction
††Preprint of the paper published in the 4th AAAI/ACM conference on AIES (2021)Car ownership is an important factor for employment and, more broadly, for participation in the economic, social and political organization of many societies (Ong, 2002; Smart and Klein, 2020). This may be especially true in Italy, second only to Luxembourg for car ownership among EU states (DG MOVE - EU Directorate-General for Mobility and Transport, 2019). Auto insurance makes vehicle ownership and usage less hazardous from an individual financial perspective (Frezal and Barry, 2019). It acts as a risk-pooling device, covering drivers against liability for bodily injury and property damage in exchange for a premium. Companies are developing increasingly complex machine learning-based models for car insurance pricing (Chapados et al., 2001; Yan et al., 2020).
The legal liability connected to driving a vehicle in Italy, and the car insurance system itself, are known as the Motor Vehicle Liability system (Responsabilità Civile Autoveicoli - RCA). It is mandatory to purchase RCA coverage before using or keeping a motor vehicle on Italian public roads. RCA is regulated by the national Institute for the Supervision of Insurance (Istituto Per la Vigilanza Sulle Assicurazioni - IVASS), which oversees the industry, protecting customers and ensuring transparency while also promoting market stability and the financial viability of businesses.
Over the last decade, the use of sensitive features such as gender and nationality in the Italian car insurance industry has been regulated. The European Union has adopted legislation which prohibits the direct use of gender for setting insurance premiums (ECJ - European Court of Justice, 2011; EC - European Commission, 2012). After finding evidence of discrimination in pricing on the basis of nationality, IVASS and the National Anti-Racial Discrimination Office (Ufficio Nazionale Antidiscriminazioni Razziali - UNAR) issued soft regulation that encourages companies to avoid using nationality-related factors, such as birthplace and citizenship, as inputs to risk models (UNAR - National Anti-Racial Discrimination Office, 2012; IVASS - Institute for the Supervision of Insurance, 2014b).
Concurrently, comparison websites (also called aggregators) have become a primary point of access to RCA subscription, claiming half of the total gross written premiums in the Italian vehicle insurance market in 2017 (Kaesler et al., 2018). Due to their growing importance, comparison websites have come under increased scrutiny and regulation. In a past investigation on RCA aggregators (IVASS - Institute for the Supervision of Insurance, 2014a), IVASS found anecdotal evidence of output variability in connection with risk profile: result pages from comparison websites seemed to display fewer quotes to driver profiles associated with higher risk. While the evidence, based on a limited sample of 7 driver profiles, was not conclusive, this was highlighted as a potential problem of differential treatment, providing uneven opportunities to different driver segments.
To the best of our knowledge, no study to date has analyzed the direct influence of gender on car insurance pricing in Italy, despite the laws and regulations that limit its use. Additionally, we are unaware of any study that has examined the influence of nationality-related features on pricing since regulations were issued by IVASS and UNAR. Finally, we are unaware of a systematic study of output variability in RCA comparison websites.
Research questions. In this paper we exploit nearly 20,000 quotes gathered on a popular comparison website to audit output variability in the aggregator’s result pages, along with the RCA pricing practices of nine companies, representing a significant share of the market. More specifically, we ask:
-
RQ1:
What are the factors that play a major role in setting RCA premiums?
-
RQ2:
Do gender and birthplace directly influence quoted premiums?
-
RQ3:
Do riskier driver profiles see fewer quotes on comparison websites?
We gather our data under a full factorial design, in which we vary some characteristics of the “applicant”, while holding the remaining characteristics fixed. Additionally, we collect data directly from a single RCA company’s website in order to verify whether the key trends detected on the aggregator occur at the company level.
Contributions and outline. We discuss the relevant background and normative fairness framework in Section 2. Section 3 describes the Design of the experiment and the resulting dataset. In Section 4 we address RQ1, finding that age, residence, claim history and insured vehicle type all have a substantial influence on premiums. In section 5, we address RQ2, showing that both gender and birthplace have a direct impact on quoted RCA prices. Birthplace is especially problematic from a fairness perspective, as we find a consistent financial disadvantage for foreign-born drivers and for drivers born in certain Italian cities. In Section 6, we address RQ3. We find that the variability in the number of quotes displayed by the aggregator seems aligned with a deliberate choice: profiles perceived as risky tend to see fewer quotes, raising concerns of transparency and unequal opportunity. In Section 7 we verify that the pricing trends measured on the aggregator are confirmed on a company’s website. Section 8 summarizes our conclusions while outlining the limitations of this paper and directions for future work.
2. Background and Related Work
2.1. Protected attributes and fairness criteria
We focus on gender and birthplace as sensitive features both (1) because there exists legislation regulating their use for insurance pricing in Italy, and (2) because RCA websites require users to input these features before generating quotes. Other features that are commonly invoked in studies of fairness and discrimination are either not collected by insurance websites (e.g. race and ethnicity) or are currently permitted under the law as inputs to risk models (e.g. age).
Gender is often conflated with sex in European legislation on insurance (EU - European Union, 2012; ECJ - European Court of Justice, 2011; EC - European Commission, 2012). The forms in the websites we crawled prompt “The driver is”, providing the options “female” and “male”. We refer to this feature as gender throughout the manuscript and follow the binary framing common in the industry and current legislation.
The principle of gender equality is enshrined by Articles 21 and 23 of the Charter of Fundamental Rights of the European Union (EU - European Union, 2000, 2012). Gender equality has been explicitly operationalized in the context of insurance, with Article 5(1) of Council Directive 2004/113/EC (Council of the EU, 2004), stating that no difference in individuals’ premiums can result from the use of gender as an explicit factor, and fully confirmed in a 2011 judgement by the European Court of Justice (ECJ - European Court of Justice, 2011).
Official guidelines on the application of the ruling (EC - European Commission, 2012) explicitly mention motor insurance, clarifying that indirect discrimination remains possible where justifiable: “For example, price differentiation based on the size of a car engine in the field of motor insurance should remain possible, even if statistically men drive cars with more powerful engines”. Moreover, information about gender may still be collected, stored and used, e.g. to monitor portfolio mix or for the purposes of reinsurance.
Nationality-related features were freely used as inputs to actuarial models in the Italian industry until 2010, when a Tunisian citizen residing in Italy since 1992 sued his car insurance company after being quoted a 30% surcharge due to his citizenship. The lawsuit was later extended to other companies found to engage in similar practices. Following extensive press coverage and further evidence brought forth by non-Italian citizens, the matter came to the attention of UNAR, who opened an investigation in concert with IVASS and the National Association of Insurance Companies (Associazione Nazionale fra le Imprese Assicuratrici). IVASS reported that 25% of companies in their sample took nationality into account as a risk factor. UNAR contacted companies found to charge foreign-born drivers more than Italian-born drivers; one company clarified that birthplace is intended as a proxy for the country where drivers obtain their license, and that learning to drive under different traffic rules and road signs represents an important risk factor. Based on these circumstances, in light of extensive analysis of national and European anti-discrimination law, UNAR issued a general recommendation to the industry, requesting that companies charge the same premiums to Italian and non-Italian citizens, all else being equal (UNAR - National Anti-Racial Discrimination Office, 2012).
Shortly thereafter, two companies under lawsuit issued a press release, stressing the absence of discriminatory intentions in their practices and committing to removing citizenship from the parameters explicitly used in their risk models (ASGI - Association for Judicial Studies on Immigration, 2012). The lawsuit was thereby settled and dropped. Finally, in 2014, IVASS issued soft regulation, recalling and echoing the recommendation from UNAR, with wording explicitly focused on birthplace (IVASS - Institute for the Supervision of Insurance, 2014b). IVASS invited all insurance companies operating in Italy to “reconsider this criterion and put in place any activity deemed necessary in order for car insurance quotes and contracts not to take country of birth into account”. This regulation clarifies unambiguously that birthplace – not only citizenship – is a sensitive factor, and that its direct utilization in actuarial models is considered discriminatory by IVASS. Henceforth, we refer to a single nationality-related variable, i.e. birthplace, given that this is the information currently queried by websites, and distinguish it from citizenship where relevant for the discussion.
In sum, the regulatory framework against discrimination in car insurance described above, comprising EU legislation on gender and Italian soft regulation on birthplace, permits the collection of protected attributes while forbidding their direct utilization, thereby aligning with the criterion of Fairness Through Unawareness (Grgic-Hlaca et al., 2016; Kusner et al., 2017) defined below.
Definition (Fairness Through Unawareness - FTU). Consider a function (equivalently, “algorithm”) , where represents a sensitive feature, represents additional covariates, and represents an output space. The algorithm satisfies FTU with respect to so long as for all and . In other words, the algorithm essentially does not utilize the sensitive feature. If the sensitive feature does not form part of the input to the algorithm, then the algorithm trivially satisfies FTU with respect to that feature.
Given its alignment with current regulation, we adopt FTU as the relevant criterion for the purposes of our algorithmic audit, while recognizing that other notions of fairness may be salient in different contexts.
2.2. Comparison websites
Comparison websites act as digital intermediaries between customers and insurance providers, typically charging the latter a commission while providing a free service to the former (IVASS - Institute for the Supervision of Insurance, 2014a; Kaesler et al., 2018). Their penetration in the European car insurance market has increased dramatically over the last decade. Focusing on the Italian market, in 2017 aggregators reached a 48% share of the total motor gross written premiums (Kaesler et al., 2018). Beyond their importance for direct sales as insurance brokers, comparison websites provide a useful information service for drivers, who can efficiently compare different car insurance options from a single point of access and benefit from increased market transparency.
In a 2014 investigation on comparison websites, IVASS highlighted a few critical aspects (IVASS - Institute for the Supervision of Insurance, 2014a). They tested 7 different driver profiles on 6 competing comparison websites, finding anecdotal evidence of output variability: result pages seemed to display fewer quotes to driver profiles associated with higher risk. This was stressed by IVASS as a potential problem of differential treatment, providing uneven opportunities to different driver segments. Responding to concerns outlined in the report, some comparison websites provided a technical explanation connected to timeouts. The IVASS report concluded that it was impossible to ascertain whether indeed the variability in the number of quotes was due to technical reasons or strategic choices.
It is worth noting that Italian law imposes a dual duty to contract, which applies to both drivers and insurers. According to Article 132 of the Private Insurance Code (Italian govt., 2007a), insurers are obliged to offer RCA coverage to all drivers, regardless of their risk profile. Article 132-bis, introduced in 2017, recognizes the growing importance of intermediaries in car insurance, such as brokers and agents, who are required to inform customers exhaustively and transparently with respect to premiums offered by all companies with which they have a broker agreement.
Our reasons for resorting to a comparison website to acquire car insurance quotes are thus twofold. On one hand, we aim to analyze the direct impact of gender and birthplace on quoted prices in a driver-centric fashion, utilizing this prevalent modality of market access. On the other hand, we are interested in auditing patterns of unequal treatment for different users anecdotally highlighted by IVASS.
2.3. Algorithmic audit
An algorithmic audit can be characterized as a study of algorithms, products and services, aimed at uncovering meaningful relationships between inputs and outputs. As automation becomes increasingly embedded in society, processes designed to reverse engineer and uncover key aspects of algorithms and automated decision systems are fundamental. Auditing is a central part of fairness, accountability and transparency, allowing communities to keep technology and decision systems in check and ensure that they are aligned with specific values and requirements.
Among other notable works in this area, researchers have audited personalization in search engines (Hannak et al., 2013), price discrimination on e-commerce platforms (Hannak et al., 2014), racial bias in judicial risk assessment (Skeem and Lowenkamp, 2016), sources of bias in political queries on Twitter (Kulshrestha et al., 2017), gender- and race-based differences in accuracy of face analysis technology (Buolamwini and Gebru, 2018) and radicalization on YouTube (Ribeiro et al., 2020).
Several other researchers have investigated discrimination in auto insurance pricing. Harrington and Niehaus (1998) used data from Missouri to examine whether insurance profits were higher in ZIP codes with a higher percentage of minorities. They found no evidence of redlining or other racial discrimination. In subsequent work, Ong and Stoll (2007) arrived at a different conclusion. They gathered 836 quotes, varying only the ZIP code while holding all other inputs constant. They found that, after accounting for risk factors, socioeconomic factors in a neighborhood such as percentage of poor residents and black residents correlated with higher premiums. This work is the closest to our study, as it is based on quotes gathered with full control of the inputs, some of which are fixed while others are varied according to an experimental design. Most recently, ProPublica analyzed payouts and premiums for car insurance in California, Illinois, Texas and Missouri, coming to similar conclusions that redlining practices affect minority neighbourhoods unfavourably (Angwin et al., 2017; Larson et al., 2017).
To the best of our knowledge, no such audit has been conducted for the Italian market; our aim is to close a transparency gap between industry practice and current regulation on the equity of RCA pricing and access.
3. Data
Our experimental design and data collection procedure are motivated by the three research questions described in the Introduction. We choose a common strategy to address all three questions: gathering quotes from several companies on a popular RCA comparison website as we vary the drivers’ profiles across features that are known a-priori to generate sizeable variations in RCA premiums, as detailed in technical reports, trade magazines and domain-specific websites (National Consumer Union, 2019; Cosconati et al., 2020).
We tried to balance this principle of sizeable output variability with one of sample representativeness. For example, when deciding which vehicles to consider, we restricted our options to the best-selling cars in the Italian market, thus neglecting pricey luxury vehicles which are likely associated with the most expensive RCA quotes, but are also far from a representative choice for the average Italian driver.
3.1. Design of experiment (DOE)
| Feature | Values tested | Brief description |
|---|---|---|
| gender | F, M | driver’s gender |
| birthplace |
Milan, Rome, Naples,
Romania, Ghana, Laos |
driver’s place of birth |
| age | 18, 25, 32 | driver’s age |
| city | Milan, Rome, Naples | driver’s residence |
| car | OLED, NSEP | insured vehicle type |
| km_driven | 10,000, 30,000 | kms driven yearly |
| class | 0, 4, 9, 14, 18, None (-1) | claim history summary |
We define a full factorial experiment, based on protected features (gender and birthplace) and features which are widely recognized as significant for pricing such as driver age, municipality of residence, car, yearly mileage and claim history (Cosconati, 2018; National Consumer Union, 2019; Serafini et al., 2020). Table 1 summarizes our DOE.
We let gender take the two values permitted in the comparison website: male (M) and female (F). For birthplace, we consider Romania, an EU member state with over 1.1 million citizens residing in Italy, along with Ghana and Laos, two countries in completely different geographical areas which also differ greatly for the number of citizens residing in Italy, estimated at 49,543 and 69, respectively (Istat, 2020).111While the quoted source reports the number of people with foreign citizenship residing in Italy, the forms in websites we utilized query for their birthplace. Given that Italy has a naturalization rate close to 2% (Eurostat, 2020), it seems unlikely that the number of Laos citizens and Laos-born people residing in Italy will differ by orders of magnitude. It is worth noting that most companies are unlikely to have more than a few tens of Laos-born drivers available as data points to infer the “effect” of this factor level. For this reason, pricing policies connected with this factor level plausibly stem from subjective (potentially inadvertent) choices rather than statistically significant inference. Along with these countries, we also consider the 3 largest Italian cities in northern (Milan), central (Rome) and southern Italy (Naples).
According to data on recently underwritten RCA contracts (Serafini et al., 2020; Cosconati et al., 2020), most of the age-related premium variability is concentrated in the youngest age groups. The mean price for the youngest bracket (18-24) is nearly double the national average; premiums decrease with age up to the bracket (35-44), where they align with the national average. For this reason, we focus on a young segment of the population, aged 18, 25 and 32, who, as is typical of Italians at their age, have been driving for 0, 7 and 14 years respectively.
For city of residence, we consider (again) Milan, Rome and Naples. These are the three largest cities in Italy, and they represent cultural and economic hubs in northern, central, and southern Italy, respectively. Among the ten most populous Italian cities, residents of Naples and Milan pay, on average, the highest and the lowest RCA premiums, respectively (Serafini et al., 2020; Cosconati et al., 2020).
The type of insured car is reported to impact quoted price significantly, with age, engine displacement and fuel system cited by trade magazines as the key factors. Among best selling vehicles from 2008 to 2020 (UNRAE - Unione Nazionale Rappresentanti Autoveicoli Esteri, 2017, 2020), the most favourable combination for insurance price is achieved by a 2020 Fiat Panda with a 1.2 litre petrol engine (new, small engine, petrol - abbreviated as NSEP), while the least favourable is a 2008 Fiat Bravo fitted with a 2.0 litre diesel engine (old, large engine, diesel - OLED).
Yearly mileage, or kilometers driven, is often cited as an important factor, due to increased time on the road and consequent chance of causing an accident. We let this feature take values 10,000 (a common default setting in aggregators) and 30,000.
Finally, Bonus-Malus System (BMS) class (Taylor, 1997) summarizes driver claim history, which is updated yearly. Classes 1 and 18 are the best and worst respectively. New drivers start at class 14, but can alternatively choose to acquire the BMS class of a relative from the same household when purchasing their first car insurance (Italian govt., 2007b). Every year, their class improves by 1 if they had no at-fault accidents and increases by 2 otherwise. We investigate the full range available for this feature, from class 1 to class 18, including class 4, 9 and 14 as intermediate values. The aggregator distinguishes between class 1 and “class 1 for one year or more”; we select the latter value and label it “class 0”. Finally, we also test a profile with no driving record (class None), which should be equivalent to class 14.
The full factorial design results in 2,592 unique factor level combinations (profiles), of which 1/6 are excluded due to inadmissibility: 18-year-olds are not allowed to drive powerful cars (OLED), reducing the size of the experiment to 2,160 profiles. In setting the (constant) values of the remaining features that are not factors in our study, we aimed for plausible values that are compatible with our chosen factor levels. Our subject is employed, single, and has no children. They are the only driver of the insured vehicle, which is used for both work and leisure.
3.2. Data collection
We gather our data from a famous comparison website, consistently present in the top two search engine results for the query “comparatore RCA” (RCA comparison website) and meaningful variations thereof. Insurance groups represented in the search results cover over 60% of the RCA market. To avoid disrupting the service of the website, we collect fewer than 200 quotes per day during July 2020, over a period of 17 days. We envision 3 plausible sources of disturbance in the pricing signal: (1) the evolution of actuarial models and pricing schemes over time, (2) session duration, with time spent on the website potentially factored into the pricing scheme, and (3) A/B testing on behalf of insurance companies, the comparison website or both. To compensate for these effects we design a doubly-nested randomization with a control group, summarized by Figure 1 and described hereafter.
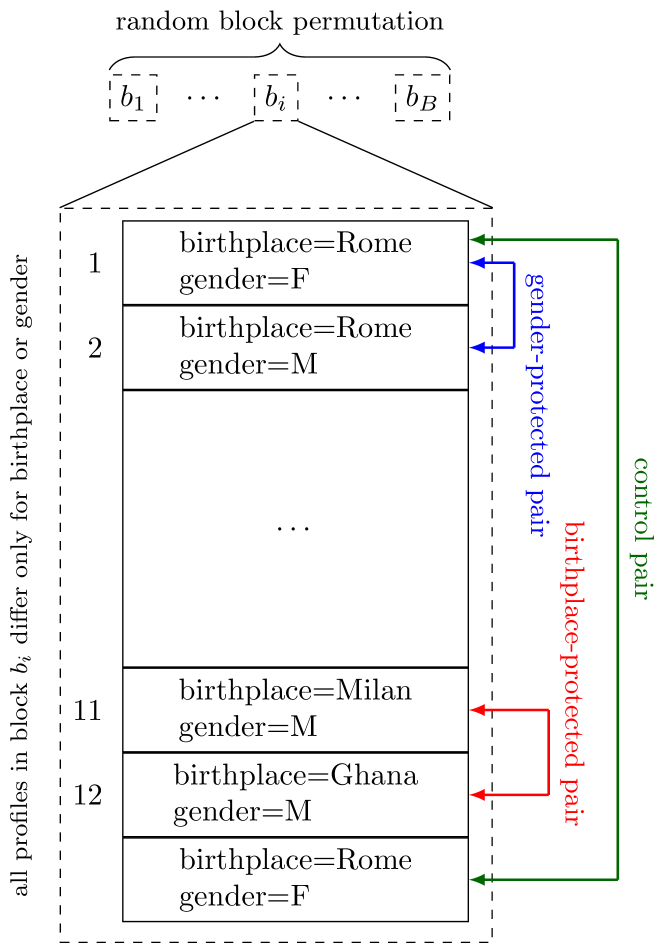
Protected features, likely to cause small fluctuations which we aim to measure carefully, are bundled and rotated. While keeping every other factor constant, we sequentially execute 12 queries, one for each combination of gender and birthplace, normally over a single session, occasionally over two. We call this sequence of 12 queries, identical for every factor but gender and birthplace, a block. This is the inner loop, which is randomized so that each combination of gender and birthplace has an equal chance of occurring at any of the 12 slots in the block. Two profiles that differ only for birthplace (gender) make up a birthplace- (gender-) protected pair, as exemplified in Figure 1. The remaining features are combined via cartesian product and permuted, thus randomizing the order of blocks. This is the outer loop, comprising blocks in total.
The above procedure should disentangle the features of interest, in particular the protected features, from slow price fluctuations deriving from the evolution of actuarial models and pricing schemes. We further control for unaccounted factors, such as A/B testing or session, by repeating every 12th query. We call these control queries, each of them gathered at the end of a block, identical to a regular query gathered at the beginning of the block, with which they form a control pair. Overall, the data collection procedure requires the execution of 2,340 queries – one for each of the 2,160 unique profiles as well as 180 control queries.222Due to a design flaw, we only executed control queries for the final 71 blocks. Each query returns between 5 and 12 price quotes, depending on which companies appear in the search results.
| Company | Num. Quotes | Frequency | Track |
|---|---|---|---|
| c1/a | 1728 | 80% | |
| c1/b | 1728 | 80% | YES |
| c1/c | 1152 | 53% | |
| c2 | 1787 | 83% | |
| c3/a | 1477 | 68% | |
| c3/b | 388 | 18% | YES |
| c3/c | 690 | 32% | YES |
| c4 | 1628 | 75% | |
| c5 | 2148 | 99% | |
| c6/a | 717 | 33% | |
| c6/b | 1428 | 66% | |
| c6/c | 360 | 17% | YES |
| c7 | 102 | 4% | |
| c8 | 2115 | 98% | |
| c9 | 2160 | 100% |
In total, we gather 19,608 yearly quotes from 9 companies (not including control queries), which are summarized in Table 2. Companies are labeled c1 to c9, with arbitrary numbering. Depending on product portfolio and agreements with the comparison website, each company offers up to three different insurance products (labeled ‘/a’, ‘/b’ and ‘/c’). Products from the same company differ in whether they require a tracking device and whether they include premium services, such as road assistance and coverage of legal expenses. Only one company (c9) provides a quote for every tested profile; two more companies (c8 and c4) appear very frequently (in 98% and 99% of the query results, respectively). The remaining companies appear 4-83% of the time. This is a first hint of output variability, analyzed in Section 6.
4. Most Important Factors
4.1. Methods
In this section, we address RQ1, analyzing the average impact each factor has on yearly quoted prices. The comparison website orders quotes for a given profile from cheapest (at the top) to most expensive (at the bottom); hence, we refer to an analysis focused on cheapest quotes as top-k. We perform the following analyses:
-
•
top1: examines the cheapest quote obtained for each profile. This analysis adopts the perspective of a driver solely driven by expense minimization.
-
•
top5: average of the five cheapest quotes obtained for each profile. Average prices correspond to a dual point of view: (1) a driver who is not necessarily seeking the cheapest product; (2) a driver who is “shopping around” on the website, comparing several insurance options against their current contract. At least five quotes were returned for each profile.
-
•
all: average of all quotes obtained for each profile.
-
•
c9: quotes provided by the only company which appeared in result pages for each tested profile, i.e. c9.
For each of the four analyses above, we first reduce all the quotes on the result page to a single price, either by selecting the relevant quote (in the top1 and c9 analyses) or by averaging the selected quotes (in the top5 and all analyses). Thus, each profile corresponds to a single price within each analysis.
4.2. Results
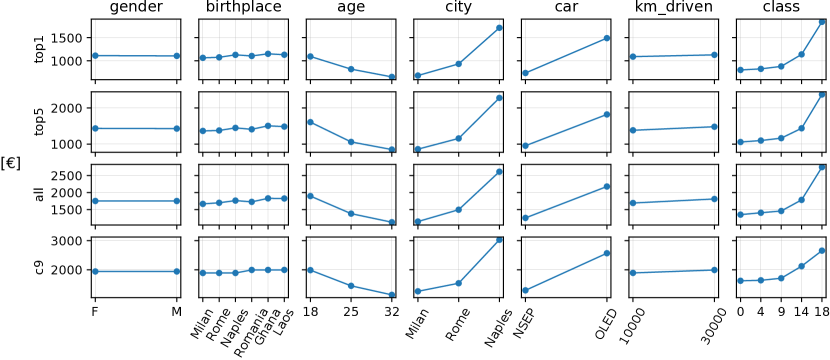
Figure 2 summarizes these analyses (one per row), with each column representing a different feature. Each panel plots the mean quoted price in euros for all profiles with a given feature value, represented on the axis, versus feature values along the axis. For example, the top left panel reports results of the top1 analysis, depicting the average of each “female” profile and the average of each “male” profile.
Notice that results are robust across all analyses (rows) in Figure 2.333An analysis focused on median values, omitted to save space, yields equivalent results. Age, city, car, and class have a strong effect, confirming our DOE considerations for including them. Mileage (km_driven), on the other hand, has a weak effect, despite being reported as a powerful predictor of the number of claims at-fault (Lemaire et al., 2015; Ferreira Jr and Minikel, 2012). We hypothesize that this is due to the low verifiability of this feature, which is self-reported and difficult to verify for insurance companies in the absence of a tracking device fitted on the vehicle.
Among protected features, birthplace seems to be utilized to differentiate not only between different countries, but also Italian cities, though the effects are smaller than for the previously mentioned factors. Gender, on the other hand, seems to play a negligible role. The absence of a clear effect for this feature should not be interpreted as a guarantee that it does not directly influence actuarial models. Rather, it means that, if gender-based differences are present, they do not on average favor men or women. Section 5 provides in-depth analysis on the role of gender and birthplace.
5. Discrimination Analysis
5.1. Methods
In this section, we focus on the direct influence of protected attributes, i.e. birthplace and gender, on price. While the previous section considered average prices across feature levels, here we examine the distribution of price differences for pairs of profiles that differ only in one protected attribute (e.g. F-M for gender, Ghana-Milan for birthplace), which we refer to as protected pairs. For FTU to rigorously hold, the result pages presented to protected pairs of profiles should be identical. To compensate for the effect of external factors (such as A/B testing), modest differences are deemed acceptable so long as they remain comparable to differences between two identical queries (control pairs). Recall that protected pairs are always gathered within the same block (Figure 1), so that the effect of time or browser session on any given protected pair should be minimal, and smaller than the effect it has on control pairs, which are gathered by definition at the very beginning and end of a block.
We conduct top1 and top5 analyses, collapsing each set of query results to a single price as described in Section 4.1. Again, these analyses adopt the perspective of a driver who is only interested in the cheapest possible quote (top1) or a driver who is shopping around and comparing policies (top5). Within each analysis, we consider the vector containing price differences for all protected pairs with two given factor levels (e.g. female and male for gender). We compute its median value and report the -value from a sign test, which tests the null hypothesis that the median difference for each pair of profiles is 0, meaning e.g. that we are as likely to observe a difference in favor of men as a difference in favor of women. If we reject the null hypothesis, then we are compelled to conclude that FTU does not hold, though of course failure to reject the null hypothesis does not guarantee that FTU does hold. In particular, while the condition ensures that no protected group is systematically at a disadvantage, it provides no guarantee about price differences directly determined by a protected attribute in a pair, and compensated by a difference of opposite sign in another protected pair. To this end, we also compute the 5th and 95th percentiles (labelled and , respectively), along with the percentage of protected pairs for which quote difference is within a tolerance threshold of 5€ (). We compare these values against the ones computed for control pairs. To satisfy FTU, we would expect protected pairs and control pairs to exhibit non-zero differences with comparable frequency (summarized by ) and magnitude (summarized by and ).
5.2. Results
Our numerical analysis is presented in Table 3. Rows 1-5 relate to birthplace, where Milan acts as a baseline, and positive values represent a surcharge incurred by drivers born in Rome, Naples, Romania, Ghana and Laos, respectively. Row 6 shows analogous results where the protected attribute is gender and positive differences are unfavourable for female drivers. A final row is added to summarize the effect of noise by reporting results for control pairs.
| top1 | top5 | |||||||||||
|---|---|---|---|---|---|---|---|---|---|---|---|---|
| Attribute | Pairs | |||||||||||
| birthplace | Rome vs Milan | 23% | -238 € | 207 € | 10 € | 7.6 | 5% | -202 € | 240 € | 7 € | 3.0 | |
| birthplace | Naples vs Milan | 27% | -60 € | 274 € | 27 € | 3.2 | 6% | -50 € | 331 € | 53 € | 7.9 | |
| birthplace | Romania vs Milan | 37% | -81 € | 253 € | 17 € | 3.2 | 9% | -86 € | 225 € | 39 € | 6.8 | |
| birthplace | Ghana vs Milan | 30% | -90 € | 553 € | 57 € | 7.9 | 5% | -48 € | 521 € | 84 € | 2.6 | |
| birthplace | Laos vs Milan | 30% | -46 € | 312 € | 56 € | 7.9 | 6% | -60 € | 437 € | 78 € | 2.0 | |
| gender | F vs M | 78% | -48 € | 127 € | 0 € | 5.3 | 39% | -173 € | 187 € | 0 € | 2.1 | |
| noise control | 93% | -33 € | 0 € | 0 € | 2.3 | 89% | -6 € | 11 € | 0 € | 5.0 | ||
Focusing on median difference , we find no systematic gender bias: the median is zero for both top1 and top5 analyses, with insignificant -values, even before correcting for multiple hypotheses testing. However we find some sizeable price differences for gender-protected pairs, which are centered around zero, thus placing no gender at a systematic disadvantage. This finding will be discussed in the next paragraph. Birthplace, on the other hand, is used predominantly in one direction, to the advantage of drivers born in Milan. Their top1 and top5 average quote are consistently lower than that of foreign-born drivers from Laos, Ghana and Romania, with median top5 differences of 78€, 84€ and 39€, respectively. Changing birthplace from Milan to Naples also results in significantly higher quotes ( equal to 27€ for top1 and 53€ for top5). Although less sizeable, drivers born in Rome also find a significant median difference with respect to their Milan-born counterparts ( equal to 10€ for top1 and 7€ for top5). This is the first result we are aware of demonstrating that pricing algorithms return different quotes for drivers born in different Italian cities, even when all remaining factors are held equal. All -values associated with birthplace are significant.
Considering the magnitude of differences directly induced by protected attributes, we find that the gender- and birthplace-based differences - in the top5 results range from 311€ to 569€, compared with a value of 17€ for control pairs. The frequency of for top5 is below 10% for all birthplace-protected pairs and below 40% for gender-protected pairs, compared against a value of 89% for control pairs. Similar if somewhat weaker patterns obtain in the top1 results. We interpret these findings as evidence that gender and birthplace have a direct and substantial influence in the result pages of this comparison website. Histograms for these differences are reported in Appendix A of the auxiliary material.
In sum, the pricing algorithms generating the RCA quotes that drivers obtain through this popular aggregator violate FTU: when all else is held constant, both gender and birthplace have sizable effects on the quoted prices, even though, in the case of gender, the direction of this effect is not systematic, i.e. the median effect is 0. Given that aggregators have become a primary point of access to RCA subscription, these results point to potentially nontrivial violations of existing laws and regulations.
It is not immediately clear to what extent these results arise from individual companies’ pricing algorithms vs. the behavior of the aggregator. In this regard, we note that 4 out of 9 of the companies in the results do not appear to use gender or birthplace directly for pricing insurance. This suggests (1) that these results are probably not due to the aggregator alone and (2) that the use of gender and birthplace does not qualify as a fundamental business need, which might otherwise partially explain violations of FTU. While the aggregator may in theory offer different prices than are offered on companies’ own websites, studies of prevalent business models for aggregators suggest the contrary (IVASS - Institute for the Supervision of Insurance, 2014a; Kaesler et al., 2018). To investigate whether the pricing patterns we find are independent of the aggregator, in Section 7 we analyze a dataset gathered from a single insurance company’s website, comparing these quotes against the ones obtained on the aggregator.
6. Output Variability
6.1. Methods
In this section we analyze the effect of each factor included in our DOE on the frequency with which insurance companies appear in quotes for specific profiles. We report the results from four companies listed in Table 2, for which displays a clear dependency on one or more factors. We also aggregate these results from the perspective of users, detailing how different features affect the average number of quotes they see.
6.2. Results
Figure 3 contains a summary of our results, where each column represents a factor, with all its possible values on the axis.
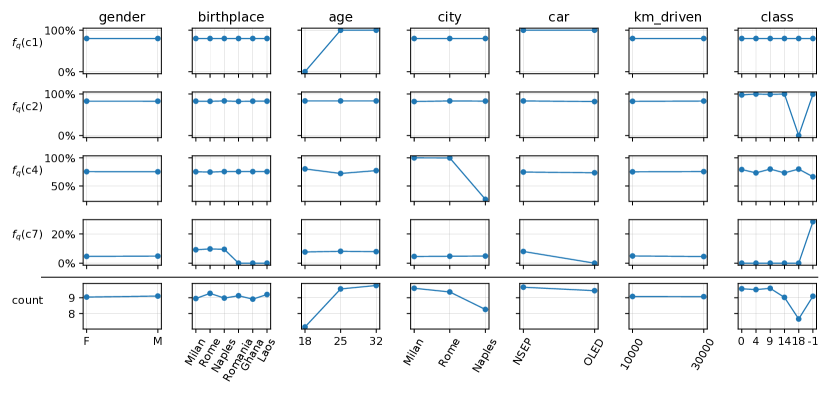
Rows 1-4 depict for c1, c2, c4 and c7 respectively. Interesting patterns emerge over the 2160 profiles that were tested. Company c1 is never present in result pages for 18-year-old drivers. Company c2 is absent from result pages for drivers in the worst BMS class (18). Both these results are very strong, as c1 and c2 are otherwise present 100% of the time. Company c4 is always present in result pages for residents of Rome and Milan, but its frequency of appearance drops to 26% for Naples. Company c7, appearing in only 4% of result pages, seems to focus on Italian-born drivers of non-OLED cars with no claim history.
Row 5 of Figure 3 aggregates these results from the perspective of users, detailing how different features affect the average number of quotes they see, reported on the axis. Age plays a major role, with 18- and 32-year-olds seeing on average 7.1 and 9.8 quotes respectively. Municipality is also important: more quotes are available for residents of Milan than for residents of Naples. Claim history is another important factor, with drivers in BMS classes above 9 seeing fewer quotes than drivers with more favorable classes. Overall, these are also factors which have a strong influence on insurance premiums, as depicted in Figure 2. Profiles perceived as risky see fewer, more expensive quotes.
Just like price, the number of quotes may be subject to noise, due e.g. to A/B testing or technical issues. We quantify this effect by considering control pairs. We notice that 17% of result page pairs differ by 1 in the number of quotes returned, resulting in an average absolute difference of 0.17 quotes for identical profiles. We regard this figure as an estimate of noise affecting the number of quotes returned by the aggregator in its result pages. As shown in the bottom row of Figure 3, age, city and class induce systematic differences, one order of magnitude larger than this threshold.
To illustrate the potential impact of these findings on drivers, let us consider matching profiles that differ only for age, and let us pair 18-year-olds with their 32-year-old counterparts. In 26% of the resulting pairs, the company providing the cheapest quote to the 32-year-old driver is absent from the result page of the matching 18-year-old. This clearly reduces the opportunities available to some younger drivers, hiding from them potentially favourable premiums, which in turn can contribute to an increase in their expenses. This problem is relevant also for factors that are not associated with systematic output variability. Focusing on gender, for example, if we consider gender-protected pairs such that , i.e. the pairs with most extreme top1 differences in favour of men (top 5 percentiles), we find that the company providing the cheapest quote to the male profile is absent from the result page of his female counterpart 84% of the time. In other words, the most extreme differences in top1 price for gender-protected pairs appear to be caused by output variability in the aggregator result pages.
7. Aggregator Influence on Premiums
7.1. Methods
Based on reports on aggregators and their typical business model, we expect their influence on quoted prices to be null or negligible (IVASS - Institute for the Supervision of Insurance, 2014a; Kaesler et al., 2018). In this Section we verify that the key pricing trends obtained on the comparison website are also present on an individual company website. Considering a single company and a single product (c1/a), we repeat our data collection procedure, with doubly-nested randomization and control (summarized in Figure 1), directly on the company website. We concentrate on a subset of our dataset, comprising 32-year-old drivers with BMS classes 0 and 4. We choose this subset since (1) c1/a is always present in the respective aggregator result pages, allowing for a direct comparison; and (2) this is the most representative subset in our sample, as very young drivers and BMS classes above 4 are quite rare among Italian RCA subscribers (Serafini et al., 2020; Cosconati et al., 2020). The resulting dataset consists of 288 regular quotes and 24 control quotes, gathered in the second half of December, 2020.
Concentrating on c1/a, we mimic the analyses from Sections 4 and 5, i.e. an overview of the most important factors and a discrimination analysis focused on protected pairs. As the dataset collected from the aggregator predates this one by six months, we do not attempt a rigorous characterization of the comparison website effect in terms of fees and discounts. Instead, we are mainly interested in evaluating whether the key trends from Sections 4 and 5 are confirmed.
7.2. Results
Figure 4 depicts the effect of each factor, as an average price for profiles sharing a factor level, across each of the remaining factors, similarly to Figure 2.
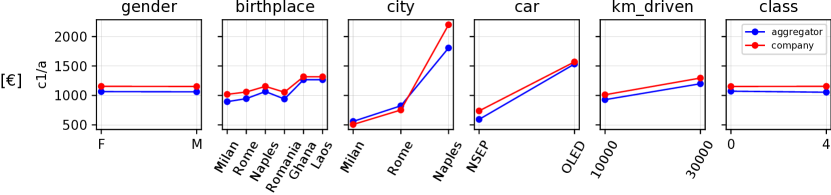
Overall trends are confirmed for every factor across all levels.
Table 4 reports summary statistics for protected pairs on both datasets; corresponding histograms are available in Appendix B of the auxiliary material.
| Attribute | Pairs | Comp. | Aggr. | Comp. | Aggr. | Comp. | Aggr. | Comp. | Aggr. | |||
|---|---|---|---|---|---|---|---|---|---|---|---|---|
| birthplace | Rome vs Milan | 29% | 17% | -1 € | -1 € | 16 € | 23 € | 121 € | 197 € | |||
| birthplace | Naples vs Milan | 20% | 17% | -1 € | -1 € | 144 € | 143 € | 294 € | 435 € | |||
| birthplace | Romania vs Milan | 42% | 38% | -6 € | -10 € | 0 € | 6 € | 124 € | 211 € | |||
| birthplace | Ghana vs Milan | 8% | 0% | 0 € | 92 € | 213 € | 243 € | 1116 € | 867 € | |||
| birthplace | Laos vs Milan | 8% | 0% | 0 € | 87 € | 213 € | 243 € | 1116 € | 914 € | |||
| gender | F vs M | 80% | 76% | 0 € | -5 € | 0 € | 0 € | 14 € | 19 € | |||
| noise control | 96% | 100% | 0 € | 0 € | 0 € | 0 € | 0 € | 0 € | ||||
Similarly to Table 3, we consider both birthplace- and gender-protected pairs in rows 1-6, with a final row focused on control pairs. In each row, we report the frequency of ties within a 5€ tolerance threshold (), along with the median, 5th and 95th percentiles, labelled , and respectively.
Overall we find stable trends across both datasets, as summarized in Table 4.
-
•
About 80% of gender-protected pairs are tied. Ties are less frequent between birthplace-protected pairs within the EU (17%-42%) and very rare when comparing drivers born in Milan with their counterparts born in Ghana or Laos (0%-8%).
-
•
is weakly (if at all) negative, showing that the baseline factor level (Milan for birthplace, male for gender) is rarely at a disadvantage.
-
•
is similar in both datasets, confirming a systematic and sizeable financial disadvantage for drivers born in Naples, Ghana and Laos ( 100€).
-
•
is always larger than 100€ for birthplace-protected pairs, reaching a 1,000€ surcharge for Ghana and Laos.
-
•
noise control shows minimal differences for identical queries.
In sum, these results show that the effect of the comparison website on the prices quoted in its result pages (if any) is modest in comparison with the effect of pricing algorithms employed by company c1. As a final remark, it is worth highlighting the strong financial disadvantage measured for Laos-born drivers despite the small number of Laos citizens residing in Italy (Istat, 2020) and available to company c1 to infer the “effect” of this feature in risk models.444In this case, we can likely rule out that the feature is being used as a proxy for the country where drivers learned to drive, since the company website explicitly queries the year of arrival in Italy, and our input, 2004, predates by 2 years the driver’s license issue date.
8. Discussion and Conclusion
We have conducted an audit of algorithms in the Italian car insurance market, gathering quotes from a widely-used comparison website, to answer the following questions about pricing and access.
RQ1: What are the factors that play a major role in setting RCA premiums?
We examined the prices stratified on each feature, averaged across each of the remaining factors. We found that driver age, city, vehicle and claim history are important factors for RCA pricing, at least for the sample we considered. Contrary to our expectation, the levels we tested for mileage led to small average price differences, probably due to the low verifiability of this feature. Birthplace and gender also induced smaller average fluctuations, which we analyzed more in detail in light of their sensitive nature and existing legislation against their direct use.
RQ2: Do gender and birthplace directly influence quoted premiums?
Both factors have a direct influence on the quotes offered to users: we paired driver profiles, so that they only differ for gender or birthplace, and found that quotes provided to them vary frequently and substantially. These differences are larger than those present in control (identical) pairs.
More in detail, we analyzed the distribution of paired differences, finding that gender-related differences are centered around zero, confirming the finding for RQ1 that no gender is systematically at a disadvantage. However, some sizeable differences were measured in both directions, showing that gender can have a direct non-negligible influence on quoted price. Birthplace-related differences, on the other hand, exhibit patterns of systematic discrimination. Foreign-born drivers and natives of Naples are consistently charged more expensive premiums when compared against drivers born in Milan, ceteribus paribus. We interpret these findings as a violation of Fairness Through Unawareness (FTU), which is the fairness principle that (most closely) aligns with European legislation on gender equality in insurance (ECJ - European Court of Justice, 2011; EC - European Commission, 2012) and Italian soft regulation against nationality-based discrimination (UNAR - National Anti-Racial Discrimination Office, 2012; IVASS - Institute for the Supervision of Insurance, 2014b). We repeated our data collection procedure on a single company’s website, focusing on the most representative subset of our sample. Comparative analysis supports the key trends discussed above, confirming that the influence of the aggregator on quoted prices is moderate, if any.
RQ3: Do riskier driver profiles see fewer quotes on comparison websites?
We analyzed the frequency with which insurers appear in result pages for different profiles, finding that some companies are systematically absent from result pages for certain driver segments. In sum, 18-year-olds, drivers with a bad claim history, and residents of Naples appear to be the least desirable categories in our dataset: when they query the comparison website, they end up receiving, on average, fewer quotes.
These results are compatible with anecdotal findings from IVASS on aggregator output variability, associating riskier profiles with fewer RCA quotes (IVASS - Institute for the Supervision of Insurance, 2014a). The evidence we found on our medium-size sample represents a confirmation that strategic choices seem to be in place, providing users of comparison websites with unequal opportunity and access to products based on their risk profile.
Limitations and future work. Our analyses hinge on quotes for 2,160 driver profiles, a dataset of limited size and not fully representative of the Italian driving population at large. Moreover, we were only able to examine a subset of the relevant features, which does not fully characterize the behavior of the pricing algorithm. While our experiments show a violation of FTU, we did not attempt to quantify the impact of the discrimination that we uncovered on Italian society at large. This would be a large and complex endeavor, and an interesting target for future work.
Acknowledgements.
We are indebted to Tomislav Jajčević and Chiara Maltese for early discussion about this work. Part of this work was supported by MIUR (Italian Minister for Education) under the initiative ”Departments of Excellence” (Law 232/2016).References
- (1)
- Angwin et al. (2017) Julia Angwin, Jeff Larson, Lauren Kirchner, and Surya Mattu. 2017. Minority Neighborhoods Pay Higher Car Insurance Premiums Than White Areas With the Same Risk. Machine Bias. ProPublica, New York, NY, USA. https://www.propublica.org/article/minority-neighborhoods-higher-car-insurance-premiums-white-areas-same-risk
- ASGI - Association for Judicial Studies on Immigration (2012) ASGI - Association for Judicial Studies on Immigration. 2012. Polizze RC Auto: le assicurazioni Quixa e Zurich non applicheranno più il parametro della cittadinanza che rendeva più care le tariffe applicate ai cittadini stranieri. http://old.asgi.it/home_asgi.php%3Fn=2057&l=it.html.
- Buolamwini and Gebru (2018) Joy Buolamwini and Timnit Gebru. 2018. Gender shades: Intersectional accuracy disparities in commercial gender classification. In Conference on fairness, accountability and transparency. PMLR, New York, NY, USA, 77–91.
- Chapados et al. (2001) Nicolas Chapados, Yoshua Bengio, Pascal Vincent, Joumana Ghosn, Charles Dugas, Ichiro Takeuchi, and Linyan Meng. 2001. Estimating Car Insurance Premia: A Case Study in High-Dimensional Data Inference. In Proceedings of the 14th International Conference on Neural Information Processing Systems: Natural and Synthetic (Vancouver, British Columbia, Canada) (NIPS’01). MIT Press, Cambridge, MA, USA, 1369–1376.
- Cosconati (2018) Marco Cosconati. 2018. No news is good news: moral hazard in oligopolistic insurance markets. Quaderno IVASS 10. IVASS, Rome. https://www.ivass.it/pubblicazioni-e-statistiche/pubblicazioni/quaderni/2017/iv10/Quaderno_10.pdf
- Cosconati et al. (2020) Marco Cosconati, Viviana Medori, Debora Serafini, Gian Luca Scialanga, Caterina Visani, Andrea Ianni, and Lino Matarazzo. 2020. IPER: L’andamento dei prezzi effettivi per la garanzia r.c.auto nel secondo trimestre 2020. Bollettino Statistico 8. IVASS, Rome. https://www.ivass.it/pubblicazioni-e-statistiche/statistiche/bollettino-statistico/2020/n8/Bollettino_IPER_2020_2.pdf
- Council of the EU (2004) Council of the EU. 2004. Implementing the principle of equal treatment between men and women in the access to and supply of goods and services L-373-37. https://eur-lex.europa.eu/legal-content/EN/TXT/?uri=celex:32004L0113.
- DG MOVE - EU Directorate-General for Mobility and Transport (2019) DG MOVE - EU Directorate-General for Mobility and Transport. 2019. Statistical pocketbook 2019. https://ec.europa.eu/transport/facts-fundings/statistics/pocketbook-2019_en.
- EC - European Commission (2012) EC - European Commission. 2012. Guidelines on the application of Council Directive 2004/113/EC to insurance, in the light of the judgment of the Court of Justice of the European Union in Case C-236/09 (Test-Achats) C-11/1. https://eur-lex.europa.eu/legal-content/EN/TXT/?uri=CELEX:52012XC0113(01).
- ECJ - European Court of Justice (2011) ECJ - European Court of Justice. 2011. Association belge des Consommateurs Test-Achats ASBL v Conseil des ministres (2011) C-236/09. https://eur-lex.europa.eu/legal-content/EN/ALL/?uri=CELEX:62009CJ0236.
- EU - European Union (2000) EU - European Union. 2000. Charter of Fundamental Rights of the European Union C-364/01. https://eur-lex.europa.eu/legal-content/EN/TXT/?uri=CELEX%3A32000X1218%2801%29.
- EU - European Union (2012) EU - European Union. 2012. Charter of Fundamental Rights of the European Union C-326/391. https://eur-lex.europa.eu/legal-content/EN/TXT/?uri=CELEX:12012P/TXT.
- Eurostat (2020) Eurostat. 2020. Migration and migrant population statistics. https://ec.europa.eu/eurostat/statistics-explained/index.php/Migration_and_migrant_population_statistics#Acquisitions_of_citizenship:_EU-27_Member_States_granted_citizenship_to_672_thousand_persons_in_2018.
- Ferreira Jr and Minikel (2012) Joseph Ferreira Jr and Eric Minikel. 2012. Measuring per mile risk for pay-as-you-drive automobile insurance. Transportation research record 2297, 1 (2012), 97–103.
- Frezal and Barry (2019) Sylvestre Frezal and Laurence Barry. 2019. Fairness in Uncertainty: Some Limits and Misinterpretations of Actuarial Fairness. Journal of Business Ethics (2019), 1–10.
- Grgic-Hlaca et al. (2016) Nina Grgic-Hlaca, Muhammad Bilal Zafar, Krishna P Gummadi, and Adrian Weller. 2016. The case for process fairness in learning: Feature selection for fair decision making. In NIPS Symposium on Machine Learning and the Law, Vol. 1. 2.
- Hannak et al. (2013) Aniko Hannak, Piotr Sapiezynski, Arash Molavi Kakhki, Balachander Krishnamurthy, David Lazer, Alan Mislove, and Christo Wilson. 2013. Measuring Personalization of Web Search. In Proceedings of the 22nd International Conference on World Wide Web (Rio de Janeiro, Brazil) (WWW ’13). Association for Computing Machinery, New York, NY, USA, 527–538.
- Hannak et al. (2014) Aniko Hannak, Gary Soeller, David Lazer, Alan Mislove, and Christo Wilson. 2014. Measuring Price Discrimination and Steering on E-Commerce Web Sites. In Proceedings of the 2014 Conference on Internet Measurement Conference (Vancouver, BC, Canada) (IMC ’14). Association for Computing Machinery, New York, NY, USA, 305–318.
- Harrington and Niehaus (1998) Scott E. Harrington and Greg Niehaus. 1998. Race, Redlining, and Automobile Insurance Prices. The Journal of Business 71, 3 (1998), 439–469.
- Istat (2020) Istat. 2020. Stranieri residenti al 1° gennaio - Cittadinanza. http://dati.istat.it/Index.aspx?DataSetCode=DCIS_POPSTRCIT1.
- Italian govt. (2007a) Italian govt. 2007a. 2007 Decreto Legislativo 7 settembre 2005, n. 209. https://www.normattiva.it/uri-res/N2Ls?urn:nir:stato:decreto.legislativo:2005-09-07;209.
- Italian govt. (2007b) Italian govt. 2007b. Legge 2 aprile 2007, n. 40. http://www.normattiva.it/uri-res/N2Ls?urn:nir:stato:legge:2007-04-02;40!vig=2020-09-18.
- IVASS - Institute for the Supervision of Insurance (2014a) IVASS - Institute for the Supervision of Insurance. 2014a. Investigation into comparison websites in the Italian insurance market. https://www.ivass.it/consumatori/azioni-tutela/indagini-tematiche/documenti/INVESTIGATION_INTO_COMPARISON_WEBSITES_IN_THE_ITALIAN_INSURANCE_MARKET.pdf?language_id=3.
- IVASS - Institute for the Supervision of Insurance (2014b) IVASS - Institute for the Supervision of Insurance. 2014b. Lettera al mercato prot. n. 45-14-007503, 26 novembre 2014. https://www.ivass.it/consumatori/azioni-tutela/lettere-mercato/documenti/Tariffazione_del_rischio_r.c.auto_Fattore_tariffario_nazionalita_di_nascita.pdf.
- Kaesler et al. (2018) Simon Kaesler, Johannes-Tobias Lorenz, and Felix Schollmeier. 2018. Friends or foes: The rise of European aggregators and their impact on traditional insurers. https://tinyurl.com/y26lghy9.
- Kulshrestha et al. (2017) Juhi Kulshrestha, Motahhare Eslami, Johnnatan Messias, Muhammad Bilal Zafar, Saptarshi Ghosh, Krishna P. Gummadi, and Karrie Karahalios. 2017. Quantifying Search Bias: Investigating Sources of Bias for Political Searches in Social Media. In Proceedings of the 2017 ACM Conference on Computer Supported Cooperative Work and Social Computing (Portland, Oregon, USA) (CSCW ’17). Association for Computing Machinery, New York, NY, USA, 417–432.
- Kusner et al. (2017) Matt J Kusner, Joshua Loftus, Chris Russell, and Ricardo Silva. 2017. Counterfactual Fairness. In Advances in Neural Information Processing Systems, I. Guyon, U. V. Luxburg, S. Bengio, H. Wallach, R. Fergus, S. Vishwanathan, and R. Garnett (Eds.), Vol. 30. Curran Associates, Inc., 4066–4076.
- Larson et al. (2017) Jeff Larson, Julia Angwin, Lauren Kirchner, Surya Mattu, Dina Haner, Michael Saccucci, Keith Newsom-Stewart, Andrew Cohen, and Martin Romm. 2017. How We Examined Racial Discrimination in Auto Insurance Prices. Machine Bias. ProPublica, New York, NY, USA. https://www.propublica.org/article/minority-neighborhoods-higher-car-insurance-premiums-methodology
- Lemaire et al. (2015) Jean Lemaire, Sojung Carol Park, and Kili Wang. 2015. The use of annual mileage as a rating variable. Astin Bulletin 46, 1 (2015), 39.
- National Consumer Union (2019) National Consumer Union. 2019. Costo assicurazione auto: da cosa dipende? https://www.consumatori.it/auto-moto/costo-assicurazione-auto/.
- Ong (2002) Paul M Ong. 2002. Car ownership and welfare-to-work. Journal of Policy Analysis and Management 21, 2 (2002), 239–252.
- Ong and Stoll (2007) Paul M. Ong and Michael A. Stoll. 2007. Redlining or risk? A spatial analysis of auto insurance rates in Los Angeles. Journal of Policy Analysis and Management 26, 4 (2007), 811–830.
- Ribeiro et al. (2020) Manoel Horta Ribeiro, Raphael Ottoni, Robert West, Virgílio A. F. Almeida, and Wagner Meira. 2020. Auditing Radicalization Pathways on YouTube. In Proceedings of the 2020 Conference on Fairness, Accountability, and Transparency (Barcelona, Spain) (FAT* ’20). Association for Computing Machinery, New York, NY, USA, 131–141.
- Serafini et al. (2020) Debora Serafini, Viviana Medori, Marco Cosconati, Gian Luca Scialanga, Caterina Visani, Andrea Ianni, and Lino Matarazzo. 2020. IPER: L’andamento dei prezzi effettivi per la garanzia r.c.auto nel primo trimestre 2020. Bollettino Statistico 6. IVASS, Rome. https://www.ivass.it/pubblicazioni-e-statistiche/statistiche/bollettino-statistico/2020/n6/Bollettino_IPER_2020_1.pdf
- Skeem and Lowenkamp (2016) Jennifer L Skeem and Christopher T Lowenkamp. 2016. Risk, race, and recidivism: Predictive bias and disparate impact. Criminology 54, 4 (2016), 680–712.
- Smart and Klein (2020) Michael J Smart and Nicholas J Klein. 2020. Disentangling the role of cars and transit in employment and labor earnings. Transportation 47, 3 (2020), 1275–1309.
- Taylor (1997) Greg Taylor. 1997. Setting a Bonus-Malus Scale in the Presence of other Rating Factors. ASTIN Bulletin 27, 2 (1997), 319–327. https://doi.org/10.2143/AST.27.2.542055
- UNAR - National Anti-Racial Discrimination Office (2012) UNAR - National Anti-Racial Discrimination Office. 2012. Repertorio n.16 del 31 gennaio 2012. http://www.prefettura.it/FILES/AllegatiPag/1247/raccomandazione%20generale%20Tariffe%20polizze%20RCA.pdf.
- UNRAE - Unione Nazionale Rappresentanti Autoveicoli Esteri (2017) UNRAE - Unione Nazionale Rappresentanti Autoveicoli Esteri. 2017. Il Mercato Italiano negli ultimi 10 anni. https://www.federmetano.it/wp-content/uploads/2018/06/AnnualReportUNRAE_2017_web_5b28b32173ff0.pdf.
- UNRAE - Unione Nazionale Rappresentanti Autoveicoli Esteri (2020) UNRAE - Unione Nazionale Rappresentanti Autoveicoli Esteri. 2020. Immatricolazione in Italia di autovetture e fuoristrada. Top 10 per alimentazione - maggio 2020. http://www.unrae.it/files/maggio%20Top%2010%20alimentazione_5ed5061f56ab3.pdf.
- Yan et al. (2020) Chun Yan, Xindong Wang, Xinhong Liu, W. Liu, and J. Liu. 2020. Research on the UBI Car Insurance Rate Determination Model Based on the CNN-HVSVM Algorithm. IEEE Access 8 (2020), 160762–160773.
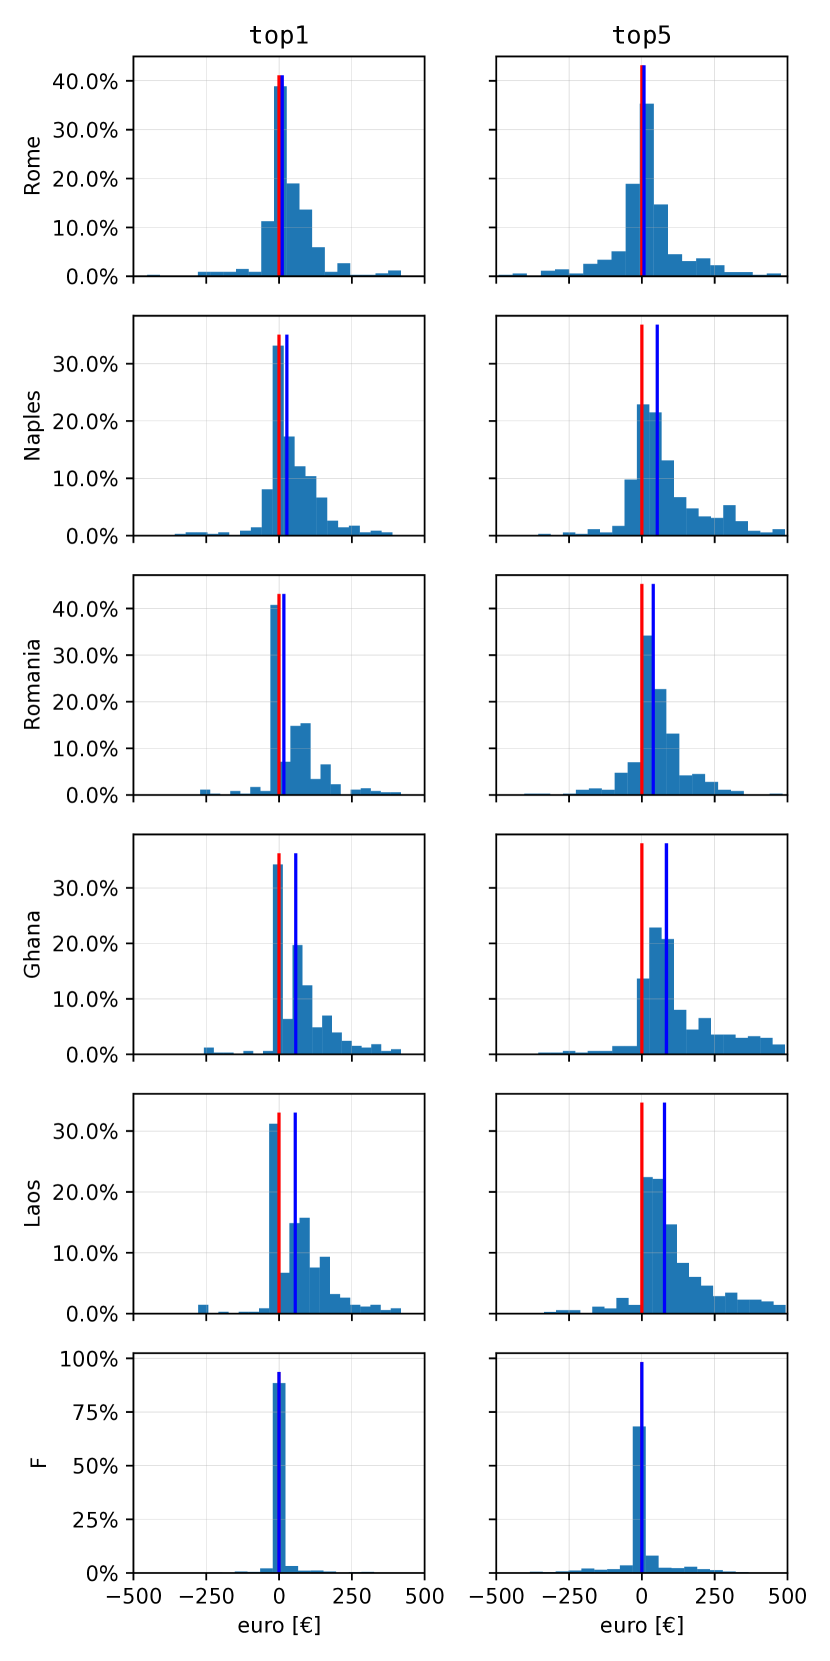
Appendix A Price differences for protected pairs in comparison website
We report histograms for price differences quoted to protected pairs of profiles in Figure 5. Rows 1-5 depict, along the axis, the surcharge incurred by drivers born in Rome, Naples, Romania, Ghana and Laos (respectively) when compared against their counterparts born in Milan. Row 6 depicts differences in price for gender-protected pairs. Positive values represent a financial advantage for the baseline (Milan for birthplace, male for gender).
Birthplace clearly plays an important role, with differences strongly skewed towards positive values, signaling a systematic bias in favour of drivers born in Milan. Gender is used less frequently and in a more balanced fashion, but can still determine sizeable differences for aggregator users.
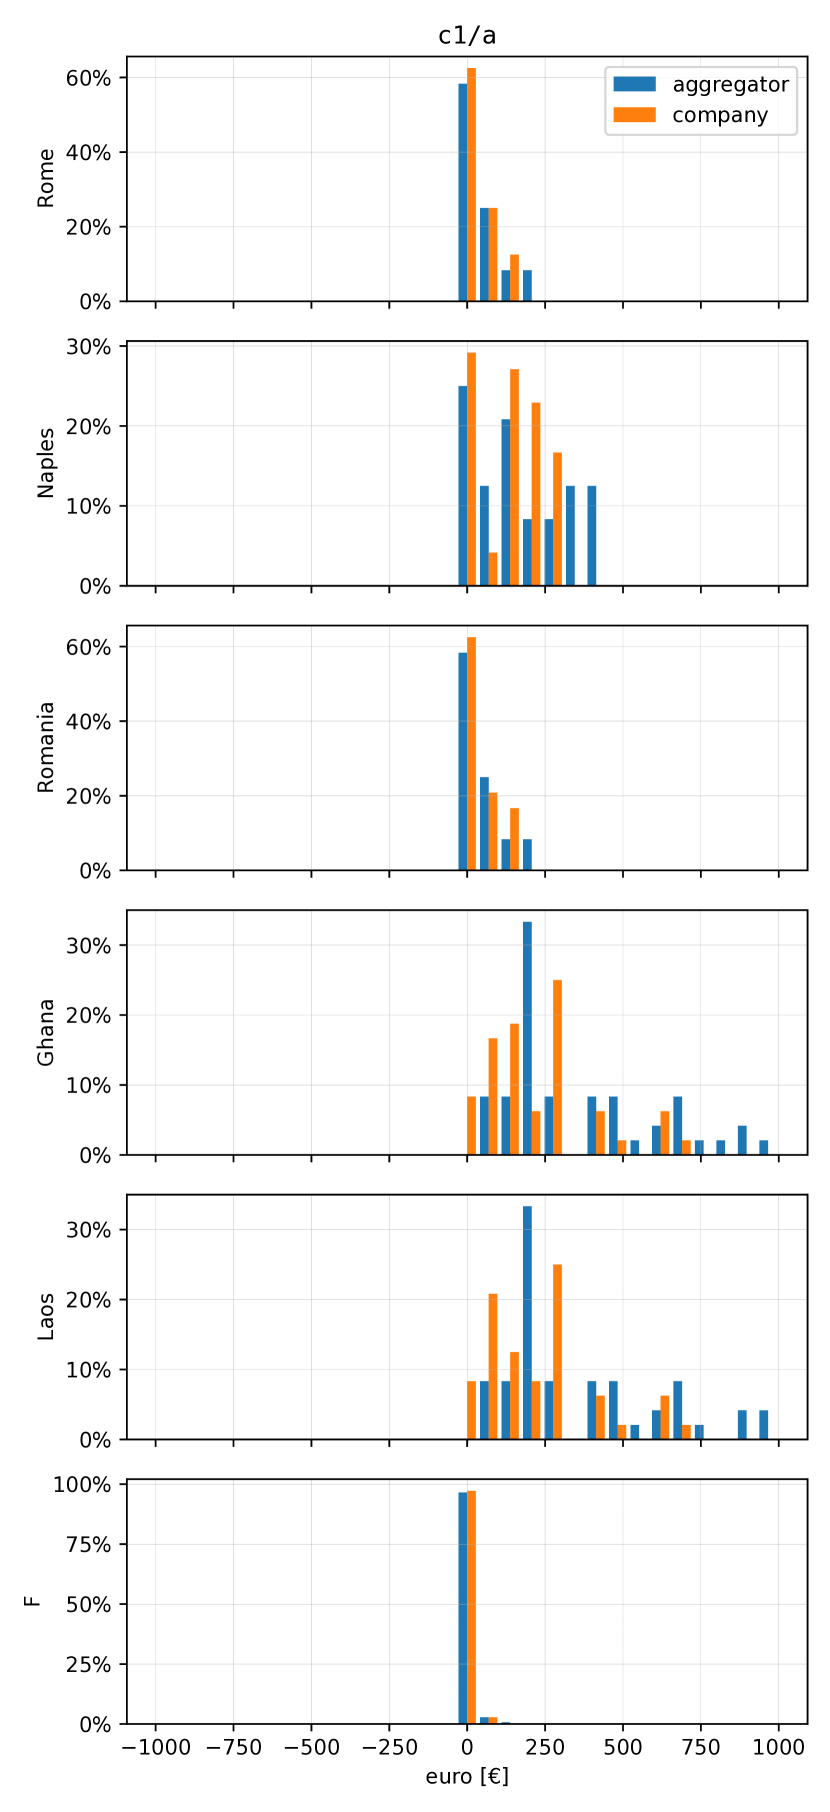
Appendix B Consistency of trends based on protected attributes on company website and aggregator
Figure 6 depicts histograms for price differences quoted to protected pairs of profiles for the insurance product labelled c1/a, reporting both the price obtained on the aggregator (blue) and the price obtained on the company website (orange). Rows are consistent with Figure 5. These results pertain to a subset of the full sample, as described in Section 7. Despite the fact that the aggregator dataset predates the company dataset by six months, key trends are stable.