Constraints on Hadronic Contribution to LHAASO Sources with Neutrino Observations
Abstract
LHAASO detected 12 gamma-ray sources above 100 TeV which are the possible origins of Galactic cosmic-rays. We summarize the neutrino measurements by IceCube and ANTARES in the vicinity of LHAASO sources to constrain the contribution of hadronic gamma-rays in these sources. We find that the current observations constrain that the hadronic gamma-rays contribute no more than of the gamma-rays from Crab Nebula. Gamma-rays from two LHAASO sources, LHAASO J1825-1326 and LHAASO J1907+0626, are dominated by leptonic components up to TeV, under the hypotheses in the analysis by IceCube. The uncertainties of the constraint on the hadronic gamma-ray emission are discussed. We also constrain the total 100 TeV gamma-ray emission from TeV PWNe relying on the remarkable sensitivity of LHAASO at that energies.
1 Introduction
Cosmic-rays extending to several PeV energies are believed to originate from Galactic sources, called PeVatrons. It is hard to localize PeVatrons with only cosmic-ray observations, because charged cosmic-rays below several PeV are deflected frequently by magnetic field while traveling in the Galaxy. Fortunately, PeV cosmic-rays produce high energy (100 TeV) gamma-rays and neutrinos in the collisions with baryon background through hadronuclear () interactions or radiation background through photohadronic () interactions. Those gamma-rays and neutrinos are good tracers of PeVatrons, as both of them travel in a straight line after escaping from the sources.
Gamma-rays can be produced through hadronic process ( or ) and/or leptonic process (inverse Compton scattering). The production mechanisms of observed gamma-rays usually are unclear. However, compared with TeV gamma-rays, the production of TeV gamma-rays with inverse Compton scatterings suffers more stringent Klein–Nishina suppression. The sources with TeV emission have more chance to be cosmic ray PeVatrons (e.g. HESS Collaboration et al., 2016; Albert et al., 2020a; Tibet AS Collaboration et al., 2021).
The Large High Altitude Air Shower Observatory (LHAASO) is a hybrid extensive air shower array for cosmic-ray and gamma-ray studies. Relying on the unprecedented sensitivity to gamma-rays around hundreds TeV, the Kilometer Square Array (KM2A) of LHAASO detected 12 gamma-ray sources above 100 TeV (Cao et al., 2021). They also observed PeV gamma-rays from the direction of Cygnus region and Crab nebula (The LHAASO Collaboration et al., 2021). These LHAASO gamma-ray sources provide us a group of target sources to find out the cosmic ray PeVatrons. We should look for neutrino signals from these sources to pin down the answer.
The IceCube neutrino observatory is a cubic-kilometer array in the deep ice at the South Pole and currently the most sensitive detector for neutrinos from TeV to PeV. IceCube has carried out some approaches to search for neutrino sources from known Galactic sources, but only gives upper limits to the flux. First, in the Source List Search (SLS), they select some known astrophysical sources to be the Neutrino Source Candidates (NSCs), and searches for neutrino signals from them individually (e.g. Aartsen et al., 2019). The signals are not significant enough. Second, since stacking may help to enhance signal to noise ratio and discover weak signals, IceCube also tries to search for neutrinos over some catalogs of known sources, i.e., Stacked Source Search (SSS) (e.g. Aartsen et al., 2020a). Still, only upper limits are given to the neutrino flux so far. However, as neutrinos are produced together with gamma-rays in the hadronic interactions, one can derive the upper limits of neutrino flux by that of hadronic gamma-ray flux, and hence constrain the contribution of hadronic process.
With the goal of identifying the Galactic cosmic ray Pevatrons from the LHAASO detected 100 TeV sources, in this work we use the neutrino measurements of NSCs in the vicinity of LHAASO sources, and constrain the hadronic contributions to gamma-ray emissions. In section 2, we introduce the neutrino source searches used in this paper and the criteria to select the NSCs. In section 3, we show the method to derive the upper limits on hadronic gamma-ray flux. In section 4, we compare the gamma-ray observations with upper limits of hadronic gamma-ray flux. In section 5, we discuss previous works and evaluate the uncertainties in the analyses. We finally give conclusions in section 6.
2 Source Selection
IceCube uses track-like neutrino events to measure the astrophysical neutrino flux from NSCs. The median location errors of these neutrinos range from 0.25 degree (above PeV) to 1 degree (sub-TeV) (Aartsen et al., 2020a), while most LHAASO sources represent diffuse structures with angular extensions as large as 1 degree except for the Crab Nebula and LHAASO J2108+5157 (Cao et al., 2021). Astrophysical neutrinos from the directions of LHAASO sources probably have the same origins with those of gamma-rays.
We select the NSCs within 1 degree from the measured center of a LHAASO source (see Table 1). The NSCs are taken from three SLSes: the ten-year search (Aartsen et al., 2020a), the eight-year search (Aartsen et al., 2019) and the combined search by ANTARES & IceCube (Albert et al., 2020b). The upper limits of neutrino flux given by SLSes depend on the hypotheses on spectral shapes (usually assumed as a single power law) and point-source hypothesis. We also choose the NSCs from two SSSes: the TeV Pulsar Wind Nebulae (PWNe) search (Aartsen et al., 2020b) and the Galactic catalog searches (Aartsen et al., 2017a) including five catalogs (one Milagro catalog, one HAWC catalog and three Supernova Remnant (SNR) catalogs). The upper limits given by SSSes depend on not only the spectral shapes and assumed source extensions, but also the weighting factors of neutrino flux from individual sources in the certain catalog. The weighting factor is the fraction of neutrino flux from individual source and depends on the weighting scheme used. The details about the weighting schemes are explained in Appendix A.
Nine LHAASO sources have NSCs in the neighborhood. In order to compare the gamma-ray emission with neutrino emission in the range of TeV to PeV, we utilize previous TeV gamma-ray measurements of the certain NSCs to obtain the energy spectra at lower energies. The details about the TeV gamma-ray observations of the NSCs are described in Appendix B.
3 Method
In hadronuclear scenarios, the differential flux of gamma-rays and neutrinos () are related as
| (1) |
where represents the neutrino flavor, and is the number ratio of charged to neutral pions. For an spectrum, the upper limit on hadronic gamma-ray flux at 100 TeV can be expressed as
| (2) |
where is the 90% upper limit of neutrino flux.
Gamma-rays are partially absorbed in the propagation through interstellar radiation field (ISRF) and cosmic microwave background (CMB) due to pair productions (). Such absorption is considered in the conversion of neutrino upper limit into gamma-ray upper limit, if the distance to the NSC is available. The ISRF energy density is taken from Popescu et al. (2017). Gamma-ray absorption around the source is not considered.
4 Results
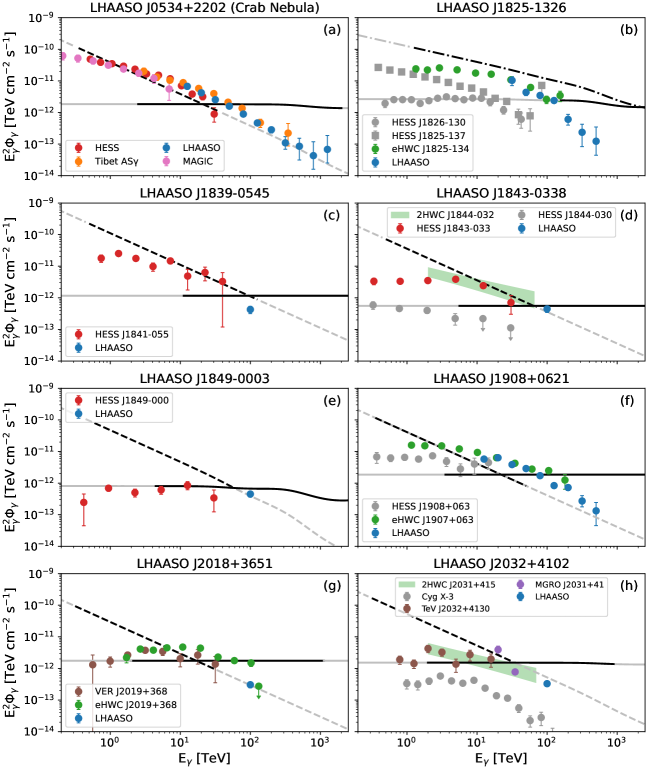
The constraints on the hadronic gamma-ray emissions derived from SLSes are shown in Figure 1. If there are more than one NSCs associated with the LHAASO source, we only show the upper limit derived from the NSC closest to the center. The upper limit for spectrum is generally consistent with or higher than the observed gamma-ray flux around 100 TeV in each panel. The upper limits for and are also generally consistent with the observed gamma-ray flux from 10 TeV to 100 TeV but much higher at the energies below 10 TeV (see panel b, c, d, f, and g). We also show in the figure the energy range corresponding to where 90% of signal neutrino events will concentrate in. This energy range is determined by the assumed neutrino spectrum, as well as the effective area of the neutrino detector. The gamma-ray absorption due to ISRF and CMB is not significant around 100 TeV.
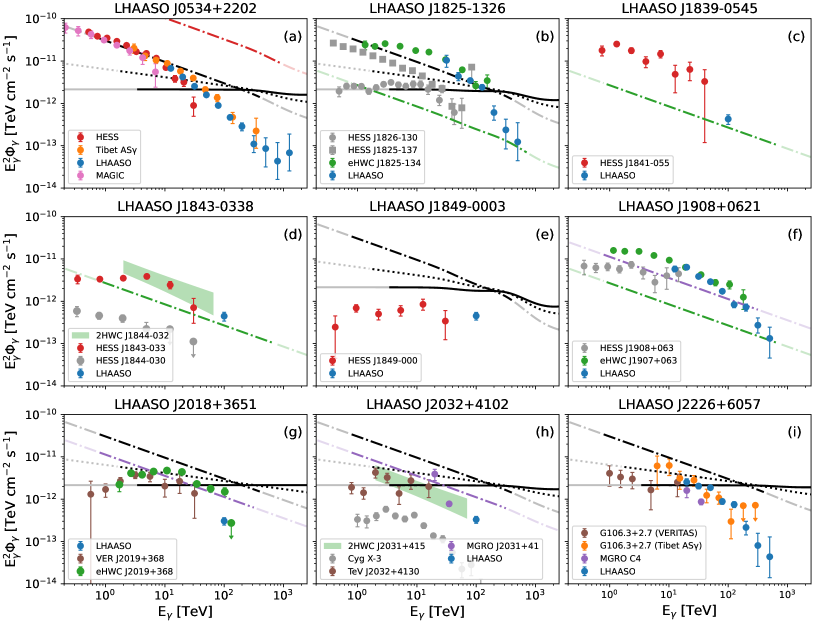
The constraints on the hadronic gamma-ray emissions derived from SSSes are shown in Figure 2. The hadronic gamma-ray flux from individual source in the catalog should be lower than the upper limit derived from the stacking neutrino flux. The upper limit given by the HAWC catalog set strong constraints on LHAASO J1825-1326 (panel b) and LHAASO J1908+0621 (panel f) above 100 TeV. The leptonic component is even dominant around 200 TeV. For the TeV PWNe, the only shown are the upper limits for inverse age weighting, because they are lower than those for the other weighting schemes, and give stronger constraints on the hadronic gamma-rays (Aartsen et al., 2020b). The constraints above are reliable when the hypotheses in the SSSes are consistent with the real case. In the HAWC catalog search, the sources are assumed to be extended and the neutrino flux following an spectrum is assumed to be proportional to the gamma-ray flux at pivot energy for each source. The assumption on neutrino flux ratio brings large uncertainty to the upper limit estimate (see subsection 5.2).
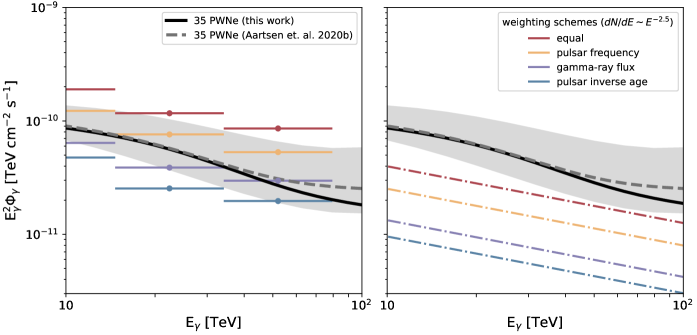
We further estimate the cumulative gamma-ray flux from TeV PWNe with LHAASO observations and compare it to the upper limits given by the TeV PWNe search in the Figure 3. In the TeV PWNe search, Aartsen et al. (2020b) compared the differential upper limits for different weightings with the cumulative gamma-ray flux extrapolated from TeV observations to constrain the hadronic component from TeV to 100 TeV. Six of these PWNe are associated with LHAASO sources, while seven of them are not detected but in the data taken region of LHAASO-KM2A (sky declination band ). With the observations at 100 TeV, we correct the extrapolated gamma-ray spectrum as the black solid line in Figure 3 (details in Appendix C). The cumulative gamma-ray flux at 100 TeV is 26% lower than the extrapolated value (grey dashed line) but still consistent with the uncertainty (grey shaded area).
5 Discussion
5.1 Compare with previous works
We compare the neutrino spectrum model of Crab Nebula in Kappes et al. (2007) with the neutrino observation results in the ten-year search. First of all, the upper limit on neutrino flux (with a certain spectral shape) is related to the upper limit on the signal event number as
| (3) |
where is the effective area for neutrinos from the direction of source ( is the neutrino energy and is the decliantion of source). The effective area is available in the IceCube muon-track data from 2008 to 2018 (IceCube Collaboration et al., 2021).
In the seven-year search one has and for the spectra of and , respectively (Aartsen et al., 2017b). The two values both decrease in the ten-year search (Aartsen et al., 2020a, and , respectively). Note that the local pre-trial p-value for Crab Nebula is larger in the ten-year search (from 0.34 in the seven-year search to 0.49), indicating more background like. Therefore, we assume that using Kappes model decreases between two searches. For the Kappes model a value is derived from the seven-year limit (Aartsen et al., 2017b) with Equation 3, which can be considered as the upper limit for ten-year search, and hence results in a flux limit (red line in Figure 4) by Equation 3 and Equation 1.

We fit the gamma-ray observations with a log-parabola model (black line in Figure 4). The number of hadronic gamma-rays in the central 90% energy range contributes to the total gamma-rays at most, while the energy of hadronic gamma-rays contributes at most. Thus, the current observations suggest that hadronic contribution can not account for the bulk of the gamma-ray emission from Crab Nebula.
Furthermore, there have been many discussion in the literatures on the hadronic gamma-ray and neutrino emission from potential Galactic PeVatrons and the Galactic plane, say, for PWNe (e.g. Amato et al., 2003), for SNRs (e.g. Mandelartz & Becker Tjus, 2015), for young massive star clusters (YMCs) (e.g. Anchordoqui et al., 2007), and for diffuse Galactic gamma-ray and neutrino emission (Ahlers & Murase, 2014; Neronov et al., 2014). Some TeV gamma-ray sources have been well studied to evaluate the probability of being PeVatrons, like the Cygnus Region (e.g. Anchordoqui et al., 2007), MGRO J2019+37 (e.g. Beacom & Kistler, 2007) and MGRO J1908+06 (e.g. Halzen et al., 2017). However, the LHAASO detected TeV sources provide a group of sample sources for candidate PeVatrons. The high sensitivity of LHAASO at 100 TeV ranges also help to put stringent constraint on the PeVatron models. A wide range of parameter space in the Crab Nebula model by Amato et al. (2003) can be constrained by LHAASO observation at 100 TeV.
5.2 Uncertainties in analysis
The upper limit on the hadronic gamma-ray flux depends on the hypotheses of source extension. As the signals are not that significant over the background, the upper limit ratio for Extended-Source (ES) hypothesis approximates as , where is the upper limit for Point-Source (PS) hypothesis, is the angular size of extended source and is the angular size of point spread function. The angular size is defined as and , where is the source extension and is given by Halzen et al. (2017). Three LHAASO sources (LHAASO J1825-1326, LHAASO J1908+0621 and LHAASO J2226+6057) have extension measurements with Gaussian template. They are , and respectively (Cao et al., 2021). If their neutrino counterparts have the same extensions, their upper limits will be 10%, 35% and 15% higher in comparison with the PS hypothesis. The upper limits given by SLSes will be harder to constrain the hadronic component for extended sources (panel b-h of Figure 1), while source extensions have been considered in the SSSes (e.g., HAWC sources in the Galactic catalog searches are assumed to be extended).
The upper limit on the hadronic gamma-ray flux also relies on the hypotheses of spectral shapes. A Bayesian analysis of the IceCube muon-track data from 2008 to 2018 is carried out to test the impact of spectral shapes on the upper limits (Huang & Li, 2021, in prep). The hadronic component is assumed to follow the best-fit gamma-ray spectrum with a scaling factor. Five LHAASO sources are tested: LHAASO J0534+2202 (Crab Nebula), LHAASO J1825-1326, LHAASO J1908+0621, LHAASO J2018+3651 and LHAASO J2226+6057. Only the hadronic gamma-ray component of Crab Nebula is well constrained to be no more than 70% of total gamma-ray flux. As for other sources, the upper limits on hadronic gamma-ray flux are higher than the flux observed.
The weighting schemes used in the SSSes influence strongly the upper limit estimate. In the TeV PWNe search, the upper limit for the equal weighting is around 3 times of the one for the gamma-ray flux weighting (see the right panel of Figure 3). In the stacking search for neutrinos from AGN and starburst galaxies, the upper limits for the equal weighting vary from 0.9 to 6.1 times of the upper limits for the gamma-ray flux weighting when changing source samples. In the HAWC catalog search, the neutrino flux from each source is assumed to be proportional to the gamma-ray flux at the pivot energy. If the upper limits derived from the HAWC catalog search (green lines in Figure 2) increase by a factor of six, we cannot simply use the upper limit on the stacking neutrino flux to constrain the hadronic gamma-ray flux from LHAASO J1908+0621 and LHAASO J1825-1326.
Kappes et al. (2007) approximate the neutrino and gamma-ray relation as , especially for primary proton spectrum being () with a high energy exponential cutoff. If using this approximation, our upper limits on hadronic gamma-ray flux will be increased by 34% (17%) for the () spectrum.
The radiation background around LHAASO sources also influence the constraints on hadronic gamma-ray component. The gamma-ray sources associated with young massive stars may have a denser infrared background compared with ISRF. The higher optical depths around 100 TeV induce the lower upper limits on the hadronic gamma-ray flux observed. In photon-rich environment, interactions should also be considered in addition to the interactions.
6 Conclusions
We adopt the neutrino observation results in the directions within one degree from LHAASO sources, and transfer the neutrino upper limits into those of hadronic gamma-ray flux. The upper limits derived from the SLSes are marginally consistent with the gamma-ray flux for most LHAASO sources and cannot constrain the hadronic contributions stringently. The upper limits derived from the SSSes set strong constraints on the hadronic components above 100 TeV. These constraints depend on hypotheses of not only the spectral shapes and source extensions but also the weighting schemes.
The main conclusions of this paper are summarized below:
i) The hadronic gamma-ray component contributes no more than 62% for the Crab Nebula.
ii) LHAASO J1825-1326 and LHAASO J1908+0621 are leptonic dominant up to 200 TeV, following the assumption that each source in the HAWC catalog has an intrinsic extension degree and follows an spectrum with neutrino flux proportional to its gamma-ray flux at pivot energy.
iii) The cumulative gamma-ray flux from TeV PWNe is lower by 26% at 100 TeV than the extrapolation from low energy before LHAASO measurement, leaving larger room for hadronic dominated emission.
The constraints on hadronic gamma-ray flux will be stronger as the neutrino statistics increase in the following 10 years. For IceCube, the time evolution of the discovery potential is close to ( is the observation time) (Aartsen et al., 2017b). We take the discovery potential in the ten-year point source search as the baseline, corresponding to the data from 2008 to 2018. IceCube will be able to discover the point-like neutrino source two times fainter by 2028. If the intrinsic gamma-ray spectrum of LHAASO J1849-0003 follows up to PeV, the neutrino observations with sensitivity two times better will offer more clues to answer the origins of these high energy gamma-rays.
A stacking search for astrophysical neutrinos from the twelve LHAASO sources is required, which will increase the significance of signals and constrain the hadronic component more strictly. As for the LHAASO sources in the southern sky (), the joint search of IceCube and ANTARES will improve the sensitivity by a factor compared to both individual analyses (Albert et al., 2020b). The instrumented volume of high energy neutrino detectors will be three times larger when KM3NeT/ARCA (two blocks) (Adrián-Martínez et al., 2016) and Baikal-GVD (15 clusters) (Safronov, 2020) fully operate in the next 5 to 10 years.
Acknowlegdments
We thank Qinrui Liu, Jon Dumm and Ruo-Yu Liu for useful discussions. This work is supported by the Natural Science Foundation of China (No. 11773003, U1931201).
References
- Aartsen et al. (2017a) Aartsen, M. G., Ackermann, M., Adams, J., et al. 2017a, ApJ, 849, 67, doi: 10.3847/1538-4357/aa8dfb
- Aartsen et al. (2017b) Aartsen, M. G., Abraham, K., Ackermann, M., et al. 2017b, ApJ, 835, 151, doi: 10.3847/1538-4357/835/2/151
- Aartsen et al. (2019) Aartsen, M. G., Ackermann, M., Adams, J., et al. 2019, European Physical Journal C, 79, 234, doi: 10.1140/epjc/s10052-019-6680-0
- Aartsen et al. (2020a) —. 2020a, Phys. Rev. Lett., 124, 051103, doi: 10.1103/PhysRevLett.124.051103
- Aartsen et al. (2020b) —. 2020b, ApJ, 898, 117, doi: 10.3847/1538-4357/ab9fa0
- Abdo et al. (2007) Abdo, A. A., Allen, B., Berley, D., et al. 2007, ApJ, 664, L91, doi: 10.1086/520717
- Abdo et al. (2009) Abdo, A. A., Allen, B. T., Aune, T., et al. 2009, ApJ, 700, L127, doi: 10.1088/0004-637X/700/2/L127
- Abeysekara et al. (2016) Abeysekara, A. U., Alfaro, R., Alvarez, C., et al. 2016, ApJ, 817, 3, doi: 10.3847/0004-637X/817/1/3
- Abeysekara et al. (2017) Abeysekara, A. U., Albert, A., Alfaro, R., et al. 2017, ApJ, 843, 40, doi: 10.3847/1538-4357/aa7556
- Abeysekara et al. (2018) Abeysekara, A. U., Archer, A., Aune, T., et al. 2018, ApJ, 861, 134, doi: 10.3847/1538-4357/aac4a2
- Abeysekara et al. (2020) Abeysekara, A. U., Albert, A., Alfaro, R., et al. 2020, Phys. Rev. Lett., 124, 021102, doi: 10.1103/PhysRevLett.124.021102
- Acciari et al. (2009) Acciari, V. A., Aliu, E., Arlen, T., et al. 2009, ApJ, 703, L6, doi: 10.1088/0004-637X/703/1/L6
- Adrián-Martínez et al. (2016) Adrián-Martínez, S., Ageron, M., Aharonian, F., et al. 2016, Journal of Physics G Nuclear Physics, 43, 084001, doi: 10.1088/0954-3899/43/8/084001
- Aharonian et al. (2019) Aharonian, F., Yang, R., & de Oña Wilhelmi, E. 2019, Nature Astronomy, 3, 561, doi: 10.1038/s41550-019-0724-0
- Aharonian et al. (2006) Aharonian, F., Akhperjanian, A. G., Bazer-Bachi, A. R., et al. 2006, A&A, 457, 899, doi: 10.1051/0004-6361:20065351
- Aharonian et al. (2008) Aharonian, F., Akhperjanian, A. G., Barres de Almeida, U., et al. 2008, A&A, 477, 353, doi: 10.1051/0004-6361:20078516
- Aharonian et al. (2009) Aharonian, F., Akhperjanian, A. G., Anton, G., et al. 2009, A&A, 499, 723, doi: 10.1051/0004-6361/200811357
- Ahlers & Murase (2014) Ahlers, M., & Murase, K. 2014, Phys. Rev. D, 90, 023010, doi: 10.1103/PhysRevD.90.023010
- Albert et al. (2020a) Albert, A., Alfaro, R., Alvarez, C., et al. 2020a, ApJ, 896, L29, doi: 10.3847/2041-8213/ab96cc
- Albert et al. (2020b) Albert, A., André, M., Anghinolfi, M., et al. 2020b, ApJ, 892, 92, doi: 10.3847/1538-4357/ab7afb
- Albert et al. (2021) Albert, A., Alfaro, R., Alvarez, C., et al. 2021, ApJ, 907, L30, doi: 10.3847/2041-8213/abd77b
- Albert et al. (2008) Albert, J., Aliu, E., Anderhub, H., et al. 2008, ApJ, 674, 1037, doi: 10.1086/525270
- Aliu et al. (2014) Aliu, E., Aune, T., Behera, B., et al. 2014, ApJ, 783, 16, doi: 10.1088/0004-637X/783/1/16
- Amato et al. (2003) Amato, E., Guetta, D., & Blasi, P. 2003, A&A, 402, 827, doi: 10.1051/0004-6361:20030279
- Amenomori et al. (2019) Amenomori, M., Bao, Y. W., Bi, X. J., et al. 2019, Phys. Rev. Lett., 123, 051101, doi: 10.1103/PhysRevLett.123.051101
- Anchordoqui et al. (2007) Anchordoqui, L. A., Beacom, J. F., Goldberg, H., Palomares-Ruiz, S., & Weiler, T. J. 2007, Phys. Rev. D, 75, 063001, doi: 10.1103/PhysRevD.75.063001
- Beacom & Kistler (2007) Beacom, J. F., & Kistler, M. D. 2007, Phys. Rev. D, 75, 083001, doi: 10.1103/PhysRevD.75.083001
- Cao et al. (2021) Cao, Z., Aharonian, F. A., An, Q., et al. 2021, Nature, 594, 33, doi: 10.1038/s41586-021-03498-z
- Ge et al. (2020) Ge, C., Liu, R.-Y., Niu, S., Chen, Y., & Wang, X.-Y. 2020, arXiv e-prints, arXiv:2012.11531. https://arxiv.org/abs/2012.11531
- H. E. S. S. Collaboration et al. (2018a) H. E. S. S. Collaboration, Abdalla, H., Aharonian, F., et al. 2018a, VizieR Online Data Catalog, J/A+A/621/A116
- H. E. S. S. Collaboration et al. (2018b) H. E. S. S. Collaboration, Abdalla, H., Abramowski, A., et al. 2018b, A&A, 612, A1, doi: 10.1051/0004-6361/201732098
- H. E. S. S. Collaboration et al. (2020) H. E. S. S. Collaboration, Abdalla, H., Adam, R., et al. 2020, A&A, 644, A112, doi: 10.1051/0004-6361/202038851
- Halzen et al. (2017) Halzen, F., Kheirandish, A., & Niro, V. 2017, Astroparticle Physics, 86, 46, doi: 10.1016/j.astropartphys.2016.11.004
- HESS Collaboration et al. (2016) HESS Collaboration, Abramowski, A., Aharonian, F., et al. 2016, Nature, 531, 476, doi: 10.1038/nature17147
- Huang & Li (2021, in prep) Huang, T.-Q., & Li, Z. 2021, in prep
- HURVICH & TSAI (1991) HURVICH, C. M., & TSAI, C.-L. 1991, Biometrika, 78, 499, doi: 10.1093/biomet/78.3.499
- IceCube Collaboration et al. (2021) IceCube Collaboration, Abbasi, R., Ackermann, M., et al. 2021, arXiv e-prints, arXiv:2101.09836. https://arxiv.org/abs/2101.09836
- Kappes et al. (2009) Kappes, A., Halzen, F., & Murchadha, A. Ó. 2009, Nuclear Instruments and Methods in Physics Research A, 602, 117, doi: 10.1016/j.nima.2008.12.049
- Kappes et al. (2007) Kappes, A., Hinton, J., Stegmann, C., & Aharonian, F. A. 2007, ApJ, 656, 870, doi: 10.1086/508936
- Mandelartz & Becker Tjus (2015) Mandelartz, M., & Becker Tjus, J. 2015, Astroparticle Physics, 65, 80, doi: 10.1016/j.astropartphys.2014.12.002
- McCollough et al. (2016) McCollough, M. L., Corrales, L., & Dunham, M. M. 2016, ApJ, 830, L36, doi: 10.3847/2041-8205/830/2/L36
- Mel’Nik & Dambis (2009) Mel’Nik, A. M., & Dambis, A. K. 2009, MNRAS, 400, 518, doi: 10.1111/j.1365-2966.2009.15484.x
- Moskalenko et al. (2006) Moskalenko, I. V., Porter, T. A., & Strong, A. W. 2006, ApJ, 640, L155, doi: 10.1086/503524
- Neronov et al. (2014) Neronov, A., Semikoz, D., & Tchernin, C. 2014, Phys. Rev. D, 89, 103002, doi: 10.1103/PhysRevD.89.103002
- Popescu et al. (2017) Popescu, C. C., Yang, R., Tuffs, R. J., et al. 2017, MNRAS, 470, 2539, doi: 10.1093/mnras/stx1282
- Safronov (2020) Safronov, G. 2020, arXiv e-prints, arXiv:2012.03373. https://arxiv.org/abs/2012.03373
- Sinitsyna & Sinitsyna (2020) Sinitsyna, V. G., & Sinitsyna, V. Y. 2020, in Journal of Physics Conference Series, Vol. 1468, Journal of Physics Conference Series, 012092, doi: 10.1088/1742-6596/1468/1/012092
- Terrier et al. (2008) Terrier, R., Mattana, F., Djannati-Atai, A., et al. 2008, in American Institute of Physics Conference Series, Vol. 1085, American Institute of Physics Conference Series, ed. F. A. Aharonian, W. Hofmann, & F. Rieger, 312–315, doi: 10.1063/1.3076669
- The LHAASO Collaboration et al. (2021) The LHAASO Collaboration, Cao, Z., Aharonian, F., et al. 2021, Science, 373, 425, doi: 10.1126/science.abg5137
- Tibet AS Collaboration et al. (2021) Tibet AS Collaboration, Amenomori, M., Bao, Y. W., et al. 2021, Nature Astronomy, doi: 10.1038/s41550-020-01294-9
| LHAASO source | Neutrino Source | Distance | Angular Distance | Extension | Neutrino Source Search | ||||
| Candidate | [kpc] | [deg] | [deg] | ||||||
| LHAASO J0534+2202 | Crab Nebula | 2.0a | 0.13 | PS | 3.7 | — | — | 0.76 | Ten-yeard |
| 0.13 | PS | 4.74 | — | — | — | Eight-yeare | |||
| 0.13 | PS | 10.7 | 11.8 | 10.7 | — | TeV PWNeg | |||
| 0.10 | PS | — | — | 117 | — | SNR with PWNh | |||
| LHAASO J1825-1326 | HESS J1826-130 | 4.0a | 0.44 | PS | 13 | — | 25 | — | |
| HESS J1825-137 | 3.9a | 0.39 | 0.461 | 10.7 | 11.8 | 10.7 | — | TeV PWNe | |
| 1HWC J1825-133 | 3.9a | 0.21 | 0.5 | — | — | 0.948 | — | HAWC Hotspotsh | |
| LHAASO J1839-0545 | HESS J1841-055 | — | 0.52 | PS | 4.8 | — | — | 3.28 | Ten-year |
| 1HWC J1838-060 | — | 0.29 | 0.5 | — | — | 0.948 | — | HAWC Hotspots | |
| LHAASO J1843-0338 | HESS J1843-033 | — | 0.35 | PS | 2.5 | — | — | 1.09 | Ten-year |
| 1HWC J1844-031c | — | 0.60 | 0.5 | — | — | 0.948 | — | HAWC Hotspots | |
| 1HWC J1842-046c | — | 0.98 | 0.5 | — | — | 0.948 | — | HAWC Hotspots | |
| LHAASO J1849-0003 | HESS J1849-000 | 7a | 0.09 | PS | 2.2 | — | — | 1.01 | Ten-year |
| IGR J18490-0000 | 7a | 0.11 | 0.09 | 10.7 | 11.8 | 10.7 | — | TeV PWNe | |
| LHAASO J1908+0621 | MGRO J1908+06 | — | 0.21 | PS | 5.7 | — | — | 2.11 | Ten-year |
| 0.10 | PS | 7.62 | — | — | — | Eight-year | |||
| 0.49 | 1.3 | — | — | 3.98 | — | Milagro Sixh | |||
| 1HWC J1907+062c | — | 0.29 | 0.5 | — | — | 0.948 | — | HAWC Hotspots | |
| LHAASO J2018+3651 | MGRO J2019+37 | — | 0.09 | PS | 4.0 | — | — | 0.69 | Ten-year |
| 0.38 | PS | 4.54 | — | — | — | Eight-year | |||
| 0.08 | 0.75 | 10.7 | 11.8 | 10.7 | — | TeV PWNe | |||
| 0.16 | 0.64 | — | — | 3.98 | — | Milagro Six | |||
| LHAASO J2032+4102 | 2HWC J2031+415 | 1.8a | 0.47 | PS | 9.2 | — | — | 1.42 | Ten-year |
| Cyg OB2 | 1.5b | 0.18 | PS | 7.64 | — | — | — | Eight-year | |
| Cyg X-3 | 7.4c | 0.10 | PS | 8.20 | — | — | — | Eight-year | |
| MGRO J2031+41 | — | 0.39 | 1.5 | — | — | 3.98 | — | Milagro Six | |
| TeV J2032+4130 | 1.8a | 0.46 | 0.158 | 10.7 | 11.8 | 10.7 | — | TeV PWNe | |
| LHAASO J2226+6057 | Boomerang | 0.8a | 0.30 | 0.22 | 10.7 | 11.8 | 10.7 | — | TeV PWNe |
Appendix A Weighting Schemes
The TeV PWNe search gave the upper limits of stacking neutrino flux from 35 identified TeV PWNe under four weighting schemes (Aartsen et al., 2020b). Neutrino flux from each source in the catalog is assumed to be the same in the equal weighting, proportional to gamma-ray flux at in the gamma-ray flux weighting, proportional to inverse age of pulsar in the inverse age weighting and proportional to pulsar frequency in the frequency weighting.
The Galactic catalog searches gave the upper limit of stacking neutrino flux over five Galactic catalogs respectively (Aartsen et al., 2017a). In the Milagro catalog, neutrino flux from each source is assumed to follow the model of Kappes et al. (2009). In the HAWC catalog, neutrino flux from each source is assumed to be proportional to the gamma-ray flux at pivot energy. In the other three SNR catalogs, neutrino flux from each source is assumed to be equal.
Appendix B TeV Gamma-ray Observations
LHAASO J1825-1326
We take the gamma-ray spectrum of eHWC J1825-134 instead of that of 1HWC J1825-133, because 1HWC J1825-133 is reported as 2HWC J1825-134 in the 2HWC catalog (Abeysekara et al., 2017), while 2HWC J1825-134 is only 0.07 degree from eHWC J1825-134 () (Abeysekara et al., 2020). The flux data points of HESS J1826-130 are raised by a factor of 2.37 from the original values, if we consider a 2-d Gaussian intrinsic extension of with the integration region of (H. E. S. S. Collaboration et al., 2020).
LHAASO J1839-0545
We only take the spectrum of HESS J1841-055, because 1HWC J1838-060 overlaps with the extension of HESS J1841-055 and its differential flux normalization is compatible with the previous measurements of HESS J1841-055 (Abeysekara et al., 2016). The flux data points of HESS J1841-055 are raised by a factor of 1.14 based on its intrinsic extension of () along the major (minor) axis and the integration region of (Aharonian et al., 2008).
LHAASO J1843-0338
We take the observation of 2HWC J1844-032, because 1HWC J1844-031c is reported as 2HWC J1844-032 in the 2HWC gamma-ray catalog (Abeysekara et al., 2017).
LHAASO J1849-0003
We only take the spectrum of HESS J1849-000, because HESS J1849-000 is in spatial coincidence with IGR J18490-0000 (Terrier et al., 2008).
LHAASO J1908+0621
We take the spectrum of eHWC J1907+063. 1HWC J1907+062c is reported as 2HWC J1908+063 (Abeysekara et al., 2017), while 2HWC J1908+063 is a point source only 0.17 degree from eHWC J1907+063 (56 TeV) (Abeysekara et al., 2020). The flux data points of HESS J1908+063 are raised by a factor of 1.51 for its intrinsic extension of and the integration region of (Aharonian et al., 2009).
LHAASO J2018+3651
We take the spectrum of VER J2019+368 because it constitutes the bulk of the emission of MGRO J2019+37 (Abeysekara et al., 2018). The flux data points of VER J2019+368 is raised by a factor of 2.53 based on its intrinsic extension of () along the major (minor) axis and the integration region of . We also use the observation of eHWC J2019+368 because its angular distance to LHAASO J2018+3651 is only 0.17 degree and it also has 100 TeV measurements Abeysekara et al. (2020).
LHAASO J2032+4102
The energy spectrum of TeV J2032+4130 is raised by different factors of 1.79, 4.64 and 2.72 for the flux data points below , between and , and above respectively, according to its intrinsic extensions at different energy bands (Aliu et al., 2014).
LHAASO J2226+6057
The VERITAS flux data points of G106.3+2.7 are raised by a factor of 1.59 based on its intrinsic extension of () along the major (minor) axis with an integration region of (Acciari et al., 2009).
For the NSCs not mentioned above, we simply take their gamma-ray measurements without adjustments.
Appendix C Gamma-ray Flux from TeV PWNe
There are 6 PWNe associated with LHAASO sources. We fit the gamma-ray spectra of these sources from TeV to sub-PeV. The best spectral fits are selected among the single power law (PL) model , the exponential cutoff power law (ECPL) model and the log-parabola (LOGP) model based on the corrected Akaike Information Criterion () (HURVICH & TSAI, 1991). Both the gamma-ray measurements of the identified PWNe and the associating LHAASO sources are used in the fitting except for HESS J1825-137. The observations by LHAASO are not considered for HESS J1825-137, because HESS J1825-137 is just one of three sources composing the gamma-ray hotspot and the gamma-ray flux at 100 TeV is not dominated by this PWN (Albert et al., 2021). The best-fit parameters are shown in Table 2 (row 1-6).
There are 7 PWNe in the data taken region ( is declination angle) but not discovered by KM2A half-array. The upper limit on the gamma-ray flux is between 100 TeV and 178 TeV (Cao et al., 2021). We fit the upper limit of energy flux at the 100-178 TeV bin with the ECPL model, following the spectral index used in the TeV PWNe search (Aartsen et al., 2020b). The best-fit cutoff energies are also the upper limits of cutoff energies . The best-fit is negative for SNR G054.1+00.3, so we just follow its spectrum in the TeV PWNe search. The upper limits of for the other 6 sources are shown in Table 2 (row 7-13).
The correction for the interstellar absorption is necessary for the 12 PWNe in Table 2. The distances to 8 PWNe are available from TeVCat. As for the other 4 PWNe, we place them at the border of the ISRF model (a cylinder with radius 24 kpc and half-height 10 kpc) given by Popescu et al. (2017) to get the maximum absorption to gamma-rays around 100 TeV. So we can get a conservative upper limit on gamma-ray flux from these PWNe before absorption. The formula to calculate gamma-ray opacity follows the equations in section 3 of Moskalenko et al. (2006). This upper limit is also hold when the gamma-rays from LHAASO sources are not from the PWNe, but the SNRs or YMCs associated (e.g. Aharonian et al., 2019; Ge et al., 2020).
As for the other 22 PWNe outside the data taken region, we simply use the same spectra in the TeV PWNe search (Aartsen et al., 2020b). The sum of gamma-ray spectra obtained above is shown as the black solid line in Figure 3.
| PWN | Model | Distance | |||
|---|---|---|---|---|---|
| [TeV] | [kpc] | ||||
| Crab Nebula | 2.86 | 0.20 | — | LOGP | 2.0 |
| HESS J1825-137 | 2.42 | — | 31 | ECPL | 3.9 |
| IGR J18490-0000 | 1.99 | — | — | PL | 7.0 |
| MGRO J2019+37 | 2.2 | 0.83 | — | LOGP | 24.8∗ |
| TeV J2032+4130 | 2.36 | 0.41 | — | LOGP | 1.8 |
| Boomerang | 2.29 | 0.35 | — | LOGP | 0.8 |
| CTA1 | 2.2 | — | 214 | ECPL | 1.4 |
| Geminga | 2.23 | — | 74 | ECPL | 0.25 |
| 2HWC J0700+143 | 2.17 | — | 196 | ECPL | 17.2∗ |
| HESS J1831-098 | 2.1 | — | 188 | ECPL | 30.9∗ |
| HESS J1837-069 | 2.54 | — | 80 | ECPL | 6.6 |
| MAGIC J1857.2+0263 | 2.2 | — | 119 | ECPL | 29.7∗ |