T-Grating on Nano-Cavity Array based Refractive Index Sensor
Abstract
We report a refractive index sensor comprising of unique T grating on top of periodic nano-cavities. The sensor has two resonant modes sensitive to different regions of the structure with low inter-region interference, hence allows simultaneous detection of two different analytes or more accurate detection of a single analyte. The sensor also provides a self-referencing feature for a broad range of refractive index, from 1.3 to 1.5. Using the FDTD method, the sensitivities of 801.7 nm RIU-1 and 1386.8 nm RIU-1 have been recorded for the two modes respectively. The versatility of the structure makes the sensor a prominent candidate for biochemical and other sensing applications.
1 Introduction
Surface plasmon polaritons (SPPs) involve non-radiative evanescent surface waves excited by the coherent and collective oscillations of the conduction electrons on a metal surface at the metal-dielectric interface [1]. This oscillation of conduction band electrons generated by the interaction between photons and surface electrons is often referred to as the surface plasmons (SPs). SPs can be localized or propagating in nature [2]. Localized surface plasmons (LSPs) are non-propagating plasmonic motions trapped within conductive subwavelength nano-particles (NPs) while propagating surface plasmons (PSPs) travels along the metal-dielectric interface of a nano-structure [3]. The coupling between photons and surface electrons, known as surface plasmon resonance (SPR), is exceedingly dependent on the dielectric environment surrounding the metal surface [4], size and geometry of the nano-structure [5], and angle of photon incidence [6].
Alongside SPR, the incorporation of other resonance modes in a hybrid structure has recently developed a great interest in the field of photonics. These structures supporting multi resonance mode like SPR and (i) Surface Enhanced Raman Scattering (SERS) [7], (ii) Guided Mode Resonance (GMR) [8], (iii) Fabry-Perot (FP) [9] resonances have been investigated previously. Among these resonances, FP-like resonance is very popular due to its narrowband application [10]. In FP nano-plasmonic cavities, the photon is trapped between two parallel mirrors constituting standing waves and selective wavelengths create resonance depending on the length of the cavity [11]. As the optical path inside the cavity is dependent on the refractive index of the dielectric material inside [12], the resonating wavelength is also very sensitive to the refractive index of the dielectric material [13].
Over the past decade, a strong interest in plasmonic structures has been grown as extensive research has been conducted on perfect absorber [14, 15, 16], laser [17, 18, 19], label free biosensing [20, 21, 22], optical filter[23], nano-resonator[24], short range data transfer in photonic integrated circuits (PICs) [25], demultiplexer [26], buffer [24], polarizer [27] and refractive index sensor[28, 29, 30, 31, 32, 33, 34]. In SPR based refractive index (RI) sensors, phase matching condition for resonance can be satisfied by prism coupling or grating coupling [35]. In prism and grating coupled configurations, different wavelengths at a particular angle (spectral scheme) or the same wavelength at different angles (angular scheme) can be coupled with resonant modes depending on the refractive indices of the analyte [36, 37]. In recent years, many spectral scheme based one dimensional (1D) grating coupled highly sensitive refractive index sensors have been proposed [38, 39, 40, 41]. The major advantage of this configuration is the miniaturization of the structure and it has been possible because of the capability of sub-wavelength grating formation by advanced lithography process [42]. Real-time monitoring of the variation of concentration of an analyte or even multiple binding events of biomolecules on the grating surface is realizable by grating coupled configuration [43, 44, 45, 46].
Unlike a single analyte based refractive index sensor, the research area of incorporating both SPR and FP-like resonances in a single structure for simultaneous multiple analyte detection has been less explored. Previously, an optical fiber based refractive index sensor was suggested for simultaneous detection of maximum three analytes but with a limited refractive index sensing window of 1.331.35 and a high inter-channel interference which results in a more erroneous detection system [47]. Another reported work proposed a suspended core fiber based multi-analyte sensor with loss spectra interrogation scheme where the difference between refractive indices of the analytes had to be at least 0.03 unit for a better sensing performance which in turn shrunk the RI performance window [48]. Some previously reported self-referencing RI sensors have the same problem with inter-region interference on the individual performance of single mode deteriorating their self-referencing performance [49, 50].
In this paper, we propose a novel plasmonic refractive index sensor with a unique T-shaped grating on top of periodic rectangular cavities. The T-shaped grating and nano-cavities create two active regions enabling simultaneous detection of two different analytes. The grating structure introduces two L-shaped cavities on top of each nano-cavity which entraps incident photon resulting in a better coupling. Two individual resonant conditions couple electromagnetic (EM) field at different regions of the structure at different phase matching conditions allowing the two resonant modes to perform with significantly less inter-region interference than most of the reported multi-analyte and self-referencing bio-sensors.
The numerically calculated sensitivities of SPR and FP-like resonant modes are 801.7 nm RIU-1 and 1386.8 nm RIU-1 respectively. The inter-region interference adds 5.8 nm RIU-1 and 0 nm RIU-1 induced sensitivity to the resonant modes respectively between 1.33 to 1.37 RI range which allows performing more accurate multi-analyte detection for relatively broader RI range of interest than the previously reported multi-analyte sensors. For the self-referencing scheme, the sensitivities of the active mode and the reference mode are 800 nm RIU-1 and 2.82 nm RIU-1 respectively considering silicon dioxide as reference.
Furthermore, the capability and usability of the sensor for simultaneous detection of multi-analyte and self-referencing modes have been briefly analyzed and verified.
2 Sensor Design
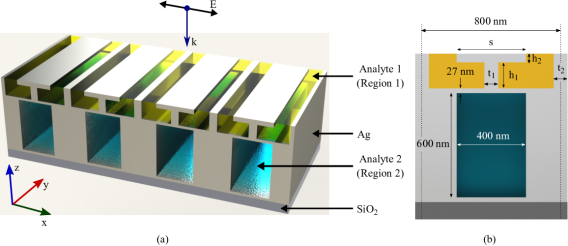
The 3D and 2D schematic view of the proposed sensor is shown in fig. 1(a) and 1(b), respectively. The sensor comprises of T-shaped 1D grating on top of periodic nano-cavities embedded into bulk Ag body on SiO2 substrate. These nano-cavities of width 400 nm and height 600 nm defining region 2 will house one analyte. On the upper side of the structure, horizontal Ag slab of span s and thickness h2 is placed upon vertical Ag slab of height h1 and thickness t1 to resemble the letter T introducing two L-shaped cavities under the horizontal slab. The reason behind the inclusion of a cavity is that it entraps incident photons under the horizontal silver slab enabling low loss photon-electron interaction and thus resulting in strong SPP coupling in the nano-cavity region [51]. The T-shaped structure is then bounded by Ag walls of thickness t2. This outer part of the sensor depicted by region 1 can be submerged into another analyte which can be the same or different from the previous one. The period of the structure is set to 800nm. Other structural parameters are set to be variable and the effects of these parameters are to be studied in the later section. A silver layer which thickness is less than the skin depth, separates the two distinctive analyte regions so that the injected electromagnetic wave can penetrate the layer and interact with both of the analyte regions [52].
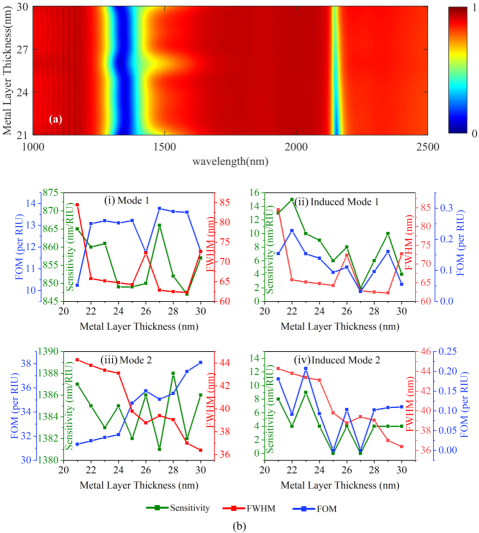
To determine the optimum thickness of the Ag layer in the sensor, the reflection spectrum for various Ag layer thickness is plotted in fig. 2(a). Notably, with the increase in the metal layer thickness, the resonant modes do not show any significant spectral shift. But the mode 2 resonance weakens due to the increase of the Ag layer thickness which is expected because of the attenuation of EM field in Ag [53]. The individual and induced sensing performance do not show any specific trend for various thickness of Ag layer as depicted in fig. 2(b)(i-iv). However, for 27 nm thickness, overall better performance can be seen. So the optimum thickness of the Ag layer was determined as 27 nm. The structure is illuminated from the above with a transverse magnetic (TM) polarized plane wave at normal incidence along the negative z axis.
The proposed structure can be fabricated by employing the standard top-down method of nanofabrication [54, 55]. First of all, 630 nm of a bulk silver layer can be grown/deposited on a SiO2 implementing physical vapor deposition technique. Then periodic deep trenches of 600 nm are formed by lithography technique and utilizing reactive ion etching (RIE) of the bulk silver layer and hence, region 2 can be formed. Afterward, the trench region can be filled with a sacrificial photoresist layer and on top of it, a 27 nm thick silver layer can be deposited [56]. Then by employing patterning and deposition techniques available in the standard top-down fabrication process, the aforementioned grating structure can be fabricated. Lastly, the sacrificial photoresist can be removed using acetone and the proposed structure can be obtained.
3 Analysis methodology
For a grating coupled configuration, the phase matching relation given by Eq. (1) characterizes the SPP excitation at the grating-dielectric interface [57].
| (1) |
Here, is the grating period, is the wavelength of the light, is the angle of the incidence and is the refractive index of the dielectric medium. From the phase-matching condition, it is evident that the refractive index of the dielectric has some direct influence on resonant wavelength manipulation. This specific property can be utilized to construct an SPP based refractive index sensor.
For a plasmonic refractive index sensor, two types of interrogation schemes are used: angular interrogation and spectral interrogation [58]. In the spectral interrogation scheme for a specific change of refractive index of the surrounding material, there is a certain shift of resonant wavelength in the reflection spectrum. The ratio of the shift of resonance wavelength and the change in RI is denoted by sensitivity [59].
| (2) |
The selectivity of the sensor is determined by the ratio of sensitivity to the full-width at half-maximum (FWHM) termed as figure of merit (FOM) [54] which characterizes the overall sensing performance.
| (3) |
In this work, the finite difference time domain (FDTD) method is used with proper boundary conditions to model the sensor structure and analyze the electromagnetic response. To ensure the accuracy of the simulation, the mesh size is selected to be as low as 0.2 nm. The Lorentz-Drude model provided by Rakić et al [60] is used to derive the optical parameters of Ag.
4 Results and optimization
4.1 Reflection spectrum and field profile:
The reflection spectrum of the sensor plotted in fig. 3 shows two distinctive resonant modes defined as mode 1 and mode 2 where mode 1 corresponds to SPR and can be approximated by using the phase matching condition described by eq. 1 and mode 2 corresponds to the FP-like resonance which can be estimated by the following resonance condition [61]:
| (4) |
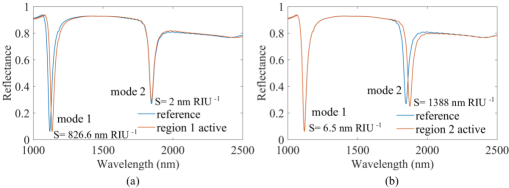
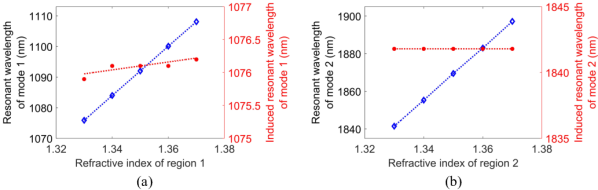
Here ka is the wave-vector inside the metal-dielectric-metal (MDM) cavity, is the phase change of the reflected wave and m is an integer denoting the FP mode. Noteworthy, because of the scattering introduced by the grating and propagation loss due to SPP inside the MDM nano-plasmonic cavity, this resonant condition may not be fully satisfied. An interesting feature of the proposed structure is that mode 1 and mode 2 are sensitive only to the RI of region 1 and region 2 respectively. It is to be noted that the spectral distance between the modes is high enough to be fairly distinguishable irrespective of the RI of any region. The insignificant spectral shift for one mode due to the RI shift of the neighboring region is defined by the induced sensitivity of that mode. Fig. 3(a) depicts that for a change in RI of only region 1, mode 1 shows the sensitivity as high as 826.6 nm RIU-1 while the induced sensitivity of mode 2 is only 2 nm RIU-1. As plotted in fig. 3(b), mode 2 exhibits the sensitivity as high as 1388 nm RIU-1 while the induced sensitivity of mode 1 is as low as 6.5 nm RIU-1 for a change in RI of region 2 alone. Hence a simultaneous spectral interrogation for two different analytes or more reliable sensing of a single analyte or even self-referencing of the structure is possible by employing these two mutually independent resonant modes.
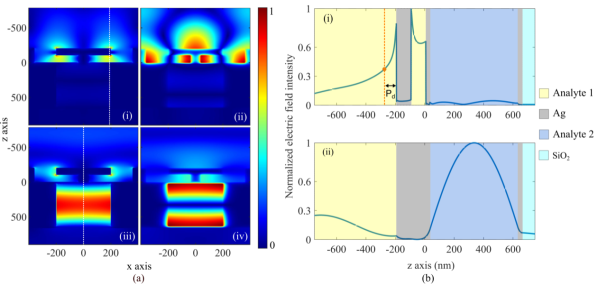
Field distributions from fig. 4 give us an analogy behind the individuality of the two resonance modes. The electric field and magnetic field profile of mode 1 in figs. 4(a,i) and 4(a,ii) show high confinement of electric and magnetic fields around the L-shaped cavity (region 1) due to trapped photon-electron interaction while almost zero electromagnetic field perturbation in region 2, enabling a low induced spectral response of mode 2 for a change in RI of region 1. On the contrary, the field distributions of mode 2 in figs. 4(a,iii) and 4(a,iv) depict confined electromagnetic field in region 2 but due to the off-resonant electromagnetic field distribution around the L-shaped cavity, a relatively higher induced spectral response of mode 1 (6.5 nm RIU-1) is observed than that of mode 2 (2 nm RIU-1).
To have a deeper understanding of the distinctive resonant characteristics of the sensor, a 1D line plot of corresponding normalized electric field distribution from fig. 4(a,i) at x = 195 nm is illustrated in fig. 4(b,i). Interestingly, for mode 1 resonance, the electric field is highly confined within the L-shaped cavity and outside the grating region, the evanescent field decays to its 37% of the maximum value at the interface within 81.63 nm (penetration depth, Pd) of the analyte 1 region outside the grating while only 4.6% of the maximum electric field is confined in region 2. Similarly, for mode 2 resonance, the 1D line plot corresponding to the electric field distribution of fig. 4(a,iii) at x = 0 nm is depicted in fig. 4(b,ii). Notably, the electric field is confined to region 2 and the field intensity is in good agreement with previously reported intensity profiles within FP cavities, which further confirms mode 2 as an FP-like resonance [62, 63]. Here, for both resonant modes, the field intensity distribution is highly confined to the corresponding region of analytes conveying the potential inter-region interference suppressing capability of the proposed sensor structure.
It is to be noted that the induced sensitivity for a broad spectral region of interest introduces some error in the individual operation of the resonance modes but for our proposed sensor this induced error is significantly lower than previously reported simultaneous multi-analyte and self-referenced sensors [49, 47, 50]. It is possible to reduce the induced error even further by optimizing the structural parameters of the T-shaped grating.
4.2 Characterization of T-shaped grating parameters:
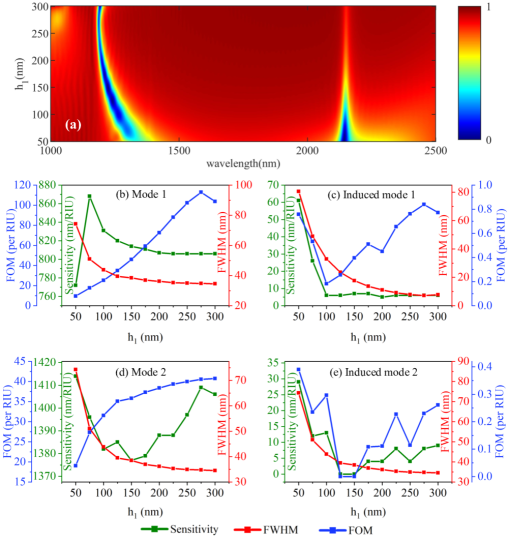
Optimizing the T-shaped grating parameters can provide a better spectral response while providing lower induced sensitivities for the two separate modes. To study the influence of grating parameters on overall sensing performance, the grating parameters have been swept each at a time while keeping others fixed. During optimization, the RI of each region is considered 1.33. At first, the effect of h1 on the reflection spectra is observed. In fig. 5(a), the resonant wavelength of mode 1 undergoes blueshift as h1 increases and the strong field confinement occurs at h1 = 150 nm. As increasing cavity height results in increasing the cavity volume, higher photon energy is required for the resonance, so the blueshift occurs. On the contrary, mode 2 does not experience any significant spectral shift but the resonance weakens as h1 increases. From fig. 5(b)-(c) it can be seen that with the increase of h1 the FWHM decreases which means that with the increase of the cavity height, narrow-band coupling occurs and a less electric field is confined. However, for mode 2, the decrease of the FWHM shown in fig. 5(d)-(e) and can be explained by the reflectance dependence of the FP cavity modes[64, 65]:
| (5) |
Where FWHM is the FWHM of the FP-like cavity mode and r is the reflectance of that mode. The induced sensitivity for mode 1 in fig. 5(c) drops from 60 nm RIU-1 to 6 nm RIU-1 when h1 increases from 50 nm to 100 nm and remains fixed beyond h1 = 100 nm. On the contrary, the induced sensitivities of mode 2 in fig. 5(e) does not follow any trend with the increase of h1 but at h1 = 125 nm and 150 nm the mode 2 induced sensitivity drops to 0 nm RIU-1. At h1 = 150 nm, the lowest induced mode 2 sensitivity can be achieved while other individual sensing parameters are high enough to provide a better overall sensing performance.
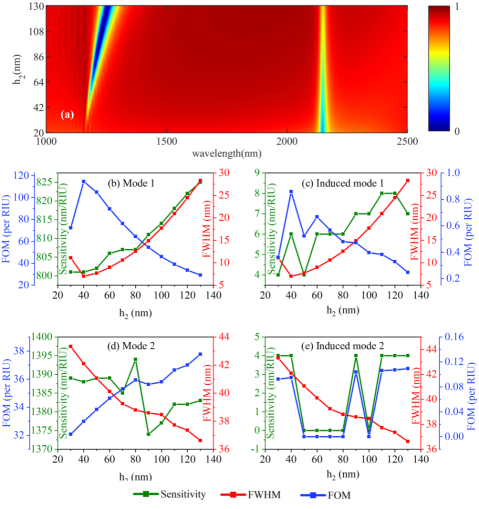
The reflection spectrum for the various h2 is plotted in fig. 6(a). For h2 < 30 nm mode 1 resonance does not occur as the horizontal slab thickness becomes smaller than the skin depth of Ag and most of the incident electric field penetrates through the slab and strongly couples to region 2. At h2 > 30 nm, a strong coupling has been observed with the increase of h2 while mode 2 resonance weakens gradually as most of the electric field confines at region 1. Comparing with h1, horizontal axis thickness (h2) has considerably less significant impact on shifting the mode 1 resonant wavelength.While h2 increases as depicted in fig. 6(b)-(c), the electric field of mode 1 couples more strongly in the horizontal slab, and thus energy dissipation increases causing a wider FWHM profile for mode 1. As mode 1 exhibits strong coupling with the increasing h2, mode 2 weakens rendering low energy dissipation and narrower FWHM profile as seen in fig. 6(d)-(e).
From fig. 6(b), with the increase of h2, individual FOM of mode 1 increases up to h2 = 40 nm then gradually decreases while individual FOM of mode 2 in fig. 6(d) gradually improves. The induced sensitivity for both mode 1 (fig. 6(c)) and mode 2 (fig. 6(e)) does not follow any significant trend with the increase of h2 but at h2 = 50 nm induced sensitivity of mode 2 is 0 nm RIU-1 while induced mode 1 sensitivity is 4 nm RIU-1 with high individual sensing parameters of each mode.
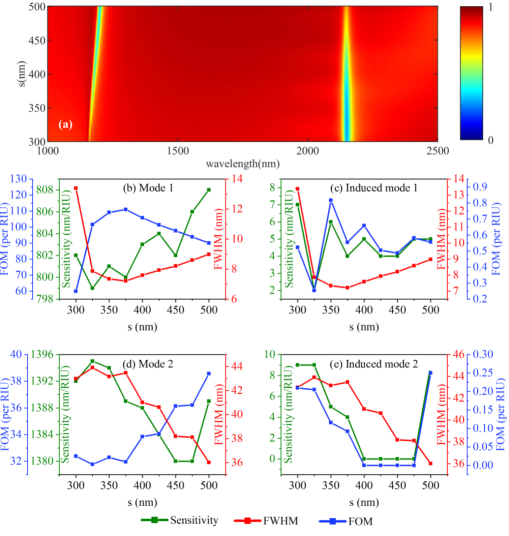
The effect of various horizontal slab span (s) on the reflection spectrum in fig. 7(a) shows that with the increase of s the surface area for SPR coupling increases which results in better confinement of electric and magnetic field, so the resonance for mode 1 strengthens. As the total energy is constant, strong coupling at mode 1 results in weak coupling at mode 2. The effect of s is less significant on the resonant wavelength compared to h1 and even h2. As shown in fig. 7(b)-(c), for s>370 nm the FWHM increases for mode 1 which is because increased value of s results in narrowing the area between the ridge of the horizontal slab and neighbouring wall. So, the electric field confinement and energy dissipation increases and thus, the FWHM broadens. On the contrary, from fig. 7(d)-(e), the FWHM of mode 2 decreases eventually with the increase of s which infers that electric field confinement reduces with the increasing s.
In fig. 7(b), FOM for individual operation of mode 1 increases with s up to s = 375 nm and then decreases while mode 2 FOM in fig. 7(d), gradually increases. The induced sensitivity of mode 2 is 0 nm RIU-1 from s = 400 nm to s = 475 nm as depicted in fig. 7(e). In terms of both induced and individual sensing parameters, overall optimum performance can be achieved when s = 400 nm.
4.3 Optical response with optimum grating parameters:
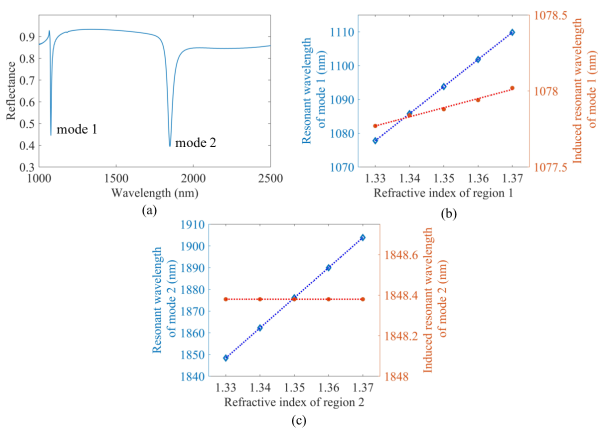
According to the previous discussion, the T-shaped grating parameters have been studied to find the optimum dimensions of the proposed sensor for further reduction of induced sensitivities with better individual sensing performance and reasonable electric field confinement in both regions. Fig. 8(a) is showing the reflection spectrum of the optimized sensor with h1 = 150 nm, h2 = 50 nm, s = 400 nm, t1 = 80 nm and t2 = 80 nm. The reflection spectrum has been plotted considering 1.33 as the RI of both analytes where the FWHMs 7.78 nm and 41.29 nm have been recorded for mode 1 and mode 2 respectively which also improve overall FOM of the proposed sensor.
Furthermore, the resonant modes hold following linear relations with the RI of both regions as plotted in fig. 8(b) and 8(c).
| (6) | ||||
Here, () denotes the resonant wavelength for individual operation of mode 1 (mode 2) and () is the induced resonant wavelength of mode 1 (mode 2) when RI of region 1 is fixed at 1.33 and n1 (n2) is the RI of region 1 (region 2). When the refractive indices of the regions change simultaneously, the resonant wavelength of each mode includes both of its individual and induced performance. Hence,
| (7) | ||||
From Eqs. (6) and (7), following expression can be derived:
| (8) | ||||
Here, Eq. (8) can be used to detect the simultaneous change in RI of both regions mitigating the error introduced by induced sensitivity. From Eq. (3), the calculated FOMs of mode 1 and mode 2 are 103.05 RIU-1 and 33.58 RIU-1 respectively. Moreover, the refractive index sensing performance of the sensor incorporating gold (palik)[66], instead of silver was investigated. The variation of resonant wavelength position with refractive of the corresponding regions are depicted in fig. 9(a) and 9(b) for mode 1 and mode 2 respectively. Interestingly, we find analogous results for gold where mode 2 exhibits no induced resonant wavelength shift due to the corresponding refractive index variation (fig. 9(b)). Thus, we can justify the proposition of our structure to minimize the induced sensitivity and accurately detect the refractive index of both analytes simultaneously.
Furthermore, both the individual and induced resonant modes hold the following linear relations with the RI of the corresponding regions.
| (9) | ||||
Employing the similar calculations, the error in refractive index calculation can also be minimized by using the following relations.
| (10) | ||||
Here the variables in denotes similar parameters described earlier. As the two sets of results are in well agreement with each other, the accuracy of the resonant modes for refractive index ranging from 1.33 to 1.37 can also be achieved for gold as a structural material of the proposed sensor. The simultaneous sensing performance comparison of the proposed sensor where Ag is the structural material with other previously reported sensors is included in table 1.
| Structure | Sensitivity (nm/RIU) | FWHM (nm) | FOM (RIU-1) | RI range | Reference |
| Bragg grating based gold coated multi-channel fiber | 200 | 0.285 | 700 | – | [67] |
| Cascaded single-mode fiber (SMF) with thin-core fiber (TCF) | 30.29 and 79.335 | – | – | 1.3331.3786 | [68] |
| Side coupled metal- dielectric-metal slot cavity | 1131 | 1.001.10 | [69] | ||
| Cross rectangular cavity with metal-insulator-metal (MIM) | 980 and 1040 | 4.95 and 5.22 | 197.6 and 198.9 | – | [70] |
| Polymeric micro-ring resonator | 200 | 0.15 | 1333.33 | – | [71] |
| Whispering gallery resonator | 240 | 1 | 240 | – | [72] |
| T-shaped grating on top of periodic nano-cavities | 801.7 and 1386.8 | 7.78 and 41.29 | 103.05 and 33.58 | 1.331.37 | this work |
5 Performance evaluation of the sensor
The capability of the structure to perform as a biosensor has been studied under three different conditions: (i) simultaneous sensing of two analytes at two different regions, (ii) more reliable sensing of one analyte and (iii) self-referencing detection to eliminate environmental noises. Following performance verification was done with the optimum grating structure with h1 = 150 nm, h2 = 50 nm and s = 400 nm.
5.1 Simultaneous multi-analyte detection
Hemoglobin is an iron-containing protein that resides in red blood cells. It binds oxygen from the lungs and delivers it throughout the body by red blood cells. Insufficient hemoglobin causes deficiency of oxygen inside the body and the condition is known as anemia. A low level of hemoglobin is also an indicator of other complications: iron-deficiency, unusual hemolysis (breaking down of red blood cells) or vitamin deficiency. Pregnant women and newborn infants may suffer from anemia. Low blood oxygen level may have the symptoms of weakness, headache, dizziness, chest pain, pale skin and shortness of breath. Again, a high level of hemoglobin indicates polycythemia i.e. denser blood than usual which can cause blood clots, strokes and heart attacks. So, the concentration of hemoglobin should be monitored reliably. The RI of hemoglobin in an aqueous solution changes linearly with the concentration at room temperature and can be fitted with the following equation where and denote RI of the solution and concentration of hemoglobin in it respectively [73].
| (11) |
Diabetes is a chronic disease that affects the metabolic system of the body. Diabetic patients suffer from hyperglycemia (high blood sugar) as the body cannot produce the required insulin. A long-lasting excess sugar concentration in blood may cause heart diseases, kidney complications and vision loss. Diabetic patients are needed to be under regular supervision for blood sugar level. Excess glucose is spilled into the urine causing frequent urination. So, blood glucose can be monitored by diagnosing urine sugar level. RI of urine () changes almost linearly with the concentration () of dissolved glucose[74] and can be expressed by the following equation:
| (12) |
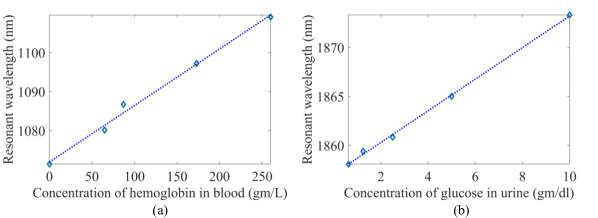
For the simultaneous detection of the concentrations of hemoglobin and glucose, the RI of region 1 was altered according to the different concentrations of hemoglobin while the RI of region 2 was varied for corresponding concentrations of glucose in urine. Here is to be noted that, the diameter of a single molecule of hemoglobin is 5 nm [75] which is 30 times smaller than the L-shaped cavity height under T-shaped grating, so the assumption of homogeneous concentration for bulk RI sensing is valid. The simulated results for hemoglobin and glucose are depicted in Fig. 10(a) and 10(b) respectively where resonant wavelengths hold the following linear relations:
| (13) | ||||
With a typical optical spectrum analyzer (OSA) having a spectral resolution of 0.05 nm [76], the proposed sensor can detect a hemoglobin concentration as low as 0.03 gm per deciliter using it as region 1 analyte while the average concentration of hemoglobin for a middle-aged human is 13 to 15 gm/deciliter [77]. Using as region 2 analyte, minimum 0.03 gm/dl or 0.17 mmol/dl urine glucose can be detected while the accuracy range for commercial glucometers is ± 83 mmol/dl.
5.2 Improving accuracy
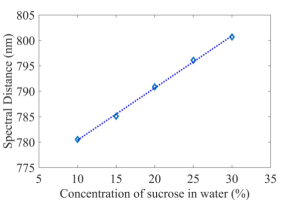
Sensing the RI of the same analyte simultaneously with two resonant modes provides improved accuracy. With the increase in RI of the same surrounding material, the resonant modes undergo a redshift, but for having different sensitivity, each mode shifts at a different but specific rate resulting in broadening the spectral distance between them. Considering this spectral distance shift for different RI of the surrounding medium as a sensing parameter, two-stage verification, hence more reliable performance can be harnessed. To investigate the reliable sensing performance, the proposed structure has been studied to detect sucrose concentration in an aqueous medium. The refractive index data for five different concentrations of sucrose has been derived from a reported literature [78]. As seen in fig. 11, the relation between spectral distance and sucrose concentration holds a linear relation depicted by:
| (14) |
Here, is the spectral distance between the resonant modes in nm and is the percentage of sucrose in the solution. This sensor can reliably detect % change in the concentration of sucrose in an aqueous medium.
5.3 Self-reference mode
While optical refractive index sensors are powerful and efficient tools for bio-chemical sensing and binding event monitoring [79], being highly sensitive to the local index of the surrounding medium of the metal surface introduces heavy environmental noise in their optical response due to light intensity fluctuation [80], temperature variation [81], the humidity of the unstable environment [82]. However, these evaluation difficulties can be avoided by coupling electromagnetic fields in different regions of a sensor structure at different phase-matching conditions where one region is physically separated from the environment. Thus a self-referenced refractive index sensor can be designed and fabricated which is immune to the unsteady environmental parameters. As discussed earlier, in our proposed sensor the mode 2 couples to region 2 which is physically separated from region 1 by a thin silver film, hence utilizing this unique property, the sensor has enormous potential as a self-referenced RI sensor.
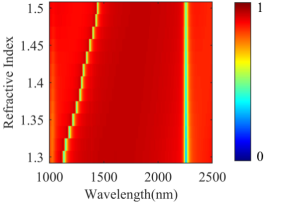
To explore the self-referencing capability of the sensor, a set of simulations has been executed under different refractive indices ranging from 1.3 to 1.5 for region 1 while region 2 was filled with SiO2. As seen in fig. 12, under this broad range of refractive index, the resonant wavelength of mode 2 remains almost fixed with some insignificant fluctuation while mode 1 resonant wavelength undergoes a redshift which is expected because of the dielectric loading [83]. The self-referencing performance comparison of the proposed sensor with other previously reported self-referencing sensor is included in table 2.
| Structure | Active Mode Sensitivity (nm/RIU) | Ref. Mode Sensitivity (nm/RIU) | Active Mode FWHM (nm) | Active Mode FOM (RIU-1) | RI Range | Reference |
| Titanium oxide (TiO2) grating on thin gold (Au) film | 693.88 | 23.33 | 27.5 | 25.23 | 1.321.35 | [49] |
| Ag grating on top of SiO2 substrate | 445 | – | – | – | 1.3291.359 | [84] |
| Si3N4 on top of Ag thin film on SiO2 substrate | 580 | 40 | – | – | 1.331.34 | [50] |
| U-shaped cavities side- coupled to a metal– dielectric–metal (MDM) waveguide | 917 | – | 5.09 | 180 | 1.0001.015 | [85] |
| Metallic grating structure | 470 | – | 15.16 | 31 | 1.331.35 | [86] |
| T-shaped grating on nano-cavity | 800 | 2.82 | 7.78 | 103.05 | 1.31.5 | this work |
6 Conclusion
Refractive index sensor with multi-analyte sensing feature has always been a center of research interest. In this paper, a refractive index sensor based on a novel grating structure on top of periodic nano-cavities has been proposed and numerically analyzed. Due to the generation of two individual resonance modes originating from SPR and FP-like resonant mode respectively, a phenomenal sensing performance with insignificant inter-region interference has been found for a broad refractive index window ranging from 1.3 to 1.5 which is larger than most of the similar reported sensors. Average sensitivities for individual performance were found as high as 801.7 nm RIU-1 and 1386.8 nm RIU-1 respectively. The potential application of the sensor for multi-analyte and self-referenced sensing have been numerically verified. Due to its versatility, we believe, the proposed sensor is a prominent candidate for biochemical sensing application.
Funding
BUET CASR Research Projects Under Higher Training & Research Programme (CASR Meeting No.: 339, Resolution No.: 62, Meeting Date: 07/04/2021)
Disclosure
The authors declare no conflicts of interest.
Data Availability Statement
Data underlying the results presented in this paper are not publicly available at this time but may be obtained from the authors upon reasonable request.
References
- [1] U. Fano. The Theory of Anomalous Diffraction Gratings and of Quasi-Stationary Waves on Metallic Surfaces (Sommerfeld’s Waves). Journal of the Optical Society of America, 31(3):213, mar 1941.
- [2] Matthew E. Stewart, Christopher R. Anderton, Lucas B. Thompson, Joana Maria, Stephen K. Gray, John A. Rogers, and Ralph G. Nuzzo. Nanostructured plasmonic sensors, feb 2008.
- [3] Yizhuo Chu and Kenneth B. Crozier. Experimental study of the interaction between localized and propagating surface plasmons. Optics Letters, 34(3):244, feb 2009.
- [4] Saeid Nazem, Mohammad Malekmohammad, and Mahmood Soltanolkotabi. Theoretical and experimental study of a surface plasmon sensor based on Ag-MgF2 grating coupler. Applied Physics B: Lasers and Optics, 126(5):96, may 2020.
- [5] Jing Jiang, Xinhao Wang, Shuang Li, Fei Ding, Nantao Li, Shaoyu Meng, Ruifan Li, Jia Qi, Qingjun Liu, and Gang Logan Liu. Plasmonic nano-arrays for ultrasensitive bio-sensing, aug 2018.
- [6] Ayushi Paliwal, Monika Tomar, and Vinay Gupta. Refractive Index Sensor Using Long-Range Surface Plasmon Resonance with Prism Coupler. Plasmonics, 14(2):375–381, apr 2019.
- [7] Kuang-Li Lee, Chia-Yu Hung, Ming-Yang Pan, Tsung-Yeh Wu, Sen-Yeu Yang, and Pei-Kuen Wei. Dual Sensing Arrays for Surface Plasmon Resonance (SPR) and Surface-Enhanced Raman Scattering (SERS) Based on Nanowire/Nanorod Hybrid Nanostructures. Advanced Materials Interfaces, 5(21):1801064, nov 2018.
- [8] Alexander L. Fannin, Brett R. Wenner, Jeffery W. Allen, Monica S. Allen, and Robert Magnusson. Properties of mixed metal–dielectric nanogratings for application in resonant absorption, sensing, and display. Optical Engineering, 56(12):121905, apr 2017.
- [9] Wenqi Zhu, Ting Xu, Haozhu Wang, Cheng Zhang, Parag B. Deotare, Amit Agrawal, and Henri J. Lezec. Surface plasmon polariton laser based on a metallic trench Fabry-Perot resonator. Science Advances, 3(10), 2017.
- [10] Paramjit Rana, C. Mukherjee, S.K. Mishra, Rajiv Kamparath, S.P. Sahoo, Jaya Mukherjee, and V.S. Rawat. Multilayer dielectric coated Fabry Perot spectral beam combiner for high power, narrowband, widely tunable laser applications. Optics & Laser Technology, 128:106210, aug 2020.
- [11] H. Kogelnik and T. Li. Laser Beams and Resonators. Applied Optics, 5(10):1550, oct 1966.
- [12] Federico Della Valle, Aldo Ejlli, Ugo Gastaldi, Giuseppe Messineo, Edoardo Milotti, Ruggero Pengo, Giuseppe Ruoso, and Guido Zavattini. The PVLAS experiment: measuring vacuum magnetic birefringence and dichroism with a birefringent Fabry–Perot cavity. The European Physical Journal C, 76(1):24, jan 2016.
- [13] K. H. Breeden and J. B. Langley. Fabry-Perot cavity for dielectric measurements. Review of Scientific Instruments, 40(9):1162–1163, sep 1969.
- [14] Yuan Fong Chou Chau, Chung Ting Chou Chao, Hung Ji Huang, Usman Anwar, Chee Ming Lim, Nyuk Yoong Voo, Abdul Hanif Mahadi, N. T.R.N. Kumara, and Hai Pang Chiang. Plasmonic perfect absorber based on metal nanorod arrays connected with veins. Results in Physics, 15:102567, dec 2019.
- [15] Mehdi Askari. A near infrared plasmonic perfect absorber as a sensor for hemoglobin concentration detection. Optical and Quantum Electronics, 53(2):1–14, 2021.
- [16] Yubin Zhang, Zao Yi, Xinyue Wang, Peixin Chu, Weitang Yao, Zigang Zhou, Shubo Cheng, Zhimin Liu, Pinghui Wu, Miao Pan, and Yougen Yi. Dual band visible metamaterial absorbers based on four identical ring patches. Physica E: Low-dimensional Systems and Nanostructures, 127:114526, 2021.
- [17] Rupert F. Oulton, Volker J. Sorger, Thomas Zentgraf, Ren-Min Ma, Christopher Gladden, Lun Dai, Guy Bartal, and Xiang Zhang. Plasmon lasers at deep subwavelength scale. Nature, 461(7264):629–632, oct 2009.
- [18] Yuan Jin, John L Reno, and Sushil Kumar. Phase-locked terahertz plasmonic laser array with 2 w output power in a single spectral mode. Optica, 7(6):708–715, 2020.
- [19] Ximin Cui, Xiaolong Zhu, Lei Shao, Jianfang Wang, and Anders Kristensen. Plasmonic color laser printing inside transparent gold nanodisk-embedded poly (dimethylsiloxane) matrices. Advanced Optical Materials, 8(1):1901605, 2020.
- [20] Nidhi Nath and Ashutosh Chilkoti. Label-free biosensing by surface plasmon resonance of nanoparticles on glass: Optimization of nanoparticle size. Analytical Chemistry, 76(18):5370–5378, sep 2004.
- [21] Yuzhang Liang, Zhiyong Yu, Lixia Li, and Ting Xu. A self-assembled plasmonic optical fiber nanoprobe for label-free biosensing. Scientific reports, 9(1):1–7, 2019.
- [22] Caterina Ciminelli, Francesco Dell’Olio, Donato Conteduca, and Mario Nicola Armenise. Integrated photonic and plasmonic resonant devices for label-free biosensing and trapping at the nanoscale. physica status solidi (a), 216(3):1800561, 2019.
- [23] Tae-Woo Lee, Da Eun Lee, and Soon-Hong Kwon. Dual-Function Metal–Insulator–Metal Plasmonic Optical Filter. IEEE Photonics Journal, 7(1):1–8, feb 2015.
- [24] Xicheng Yan, Tao Wang, Xu Han, Shuyuan Xiao, Youjiang Zhu, and Yunbo Wang. High Sensitivity Nanoplasmonic Sensor Based on Plasmon-Induced Transparency in a Graphene Nanoribbon Waveguide Coupled with Detuned Graphene Square-Nanoring Resonators. Plasmonics, 12(5):1449–1455, oct 2017.
- [25] Jin Tae Kim and Sung-Yool Choi. Graphene-based plasmonic waveguides for photonic integrated circuits. Optics Express, 19(24):24557, nov 2011.
- [26] Ebrahim Forati and George W. Hanson. Surface plasmon polaritons on soft-boundary graphene nanoribbons and their application in switching/demultiplexing. Applied Physics Letters, 103(13):133104, sep 2013.
- [27] A. Farmani, M. Miri, and M. H. Sheikhi. Design of a high extinction ratio tunable graphene on white graphene polarizer. IEEE Photonics Technology Letters, 30(2):153–156, 2018.
- [28] Ayon Sarker, Shamima Akter Mitu, Purbayan Das, and Sajid Muhaimin Choudhury. Structurally tunable gear-shaped plasmonic sensor. Optics Express, 28(24):36070, nov 2020.
- [29] Chunlian Cen, Hang Lin, Jing Huang, Cuiping Liang, Xifang Chen, Yongjian Tang, Zao Yi, Xin Ye, Jiangwei Liu, Yougen Yi, and Shuyuan Xiao. A Tunable Plasmonic Refractive Index Sensor with Nanoring-Strip Graphene Arrays. Sensors, 18(12):4489, dec 2018.
- [30] Xuewei Zhang, Yunping Qi, Peiyang Zhou, Hanhan Gong, Bingbing Hu, and Chunman Yan. Refractive Index Sensor Based on Fano Resonances in Plasmonic Waveguide With Dual Side-Coupled Ring Resonators. Photonic Sensors, 8(4):367–374, dec 2018.
- [31] Xiangxian Wang, Jiankai Zhu, Huan Tong, Xudong Yang, Xiaoxiong Wu, Zhiyuan Pang, Hua Yang, and Yunping Qi. A theoretical study of a plasmonic sensor comprising a gold nano-disk array on gold film with a sio 2 spacer. Chinese Physics B, 28(4):044201, 2019.
- [32] Alexander L Fannin, Brett R Wenner, Jeffery W Allen, Monica S Allen, and Robert Magnusson. Properties of mixed metal–dielectric nanogratings for application in resonant absorption, sensing, and display. Optical Engineering, 56(12):121905, 2017.
- [33] M. H. Elshorbagy, A. Cuadrado, B. García-Cámara, R. Vergaz, J. A. Gómez-Pedrero, and J. Alda. Ultra-narrow spectral response of a hybrid plasmonic-grating sensor. IEEE Sensors Journal, 20(7):3520–3528, 2020.
- [34] A Jeddi Golfazani, A Alipour, M Bakhshipour, Ali Farmani, and Ali Mir. Analytical and numerical models of a highly sensitive mdm plasmonic nano-structure in near-infrared range. Plasmonics, pages 1–6, 2020.
- [35] Stefan A. Maier. Plasmonics: Fundamentals and Applications. Springer US, New York, NY, 2007.
- [36] Myungjae Lee, Heonsu Jeon, and Sunghwan Kim. A Highly Tunable and Fully Biocompatible Silk Nanoplasmonic Optical Sensor. Nano Letters, 15(5):3358–3363, may 2015.
- [37] Ayon Sarker, Shamima Akter Mitu, Purbayan Das, and Sajid Muhaimin Choudhury. Structurally tunable gear-shaped plasmonic sensor. Optics Express, 28(24):36070–36083, 2020.
- [38] Sumera Afsheen, Tahir Iqbal, Muhammad Aftab, Almas Bashir, Aqsa Tehseen, Muhammad Yaqoob Khan, and Mohsin Ijaz. Modeling of 1D Au plasmonic grating as efficient gas sensor. Materials Research Express, 6(12), 2019.
- [39] Mashnoon Alam Sakib, S. M.Enamul Hoque Yousuf, Sourov Das Gupta, and Md Zahurul Islam. Proposition and Numerical Analysis of a Plasmonic Sensing Structure of Metallo-Dielectric Grating and Silver Nano-slabs in a Metal-Insulator-Metal Configuration. Plasmonics, 13(6):2205–2213, 2018.
- [40] Jiankai Zhu, Xiangxian Wang, Yuan Wu, Yingwen Su, Tianxu Jia, Hua Yang, Liping Zhang, Yunping Qi, and Xiaolei Wen. Plasmonic refractive index sensors based on one-and two-dimensional gold grating on a gold film. Photonic Sensors, 10(4):375–386, 2020.
- [41] Yue Su, Zhaoxin Geng, Xiaoqing Lv, Weihao Fang, Shicai Wang, Zhengtai Ma, and Weihua Pei. Self-referenced plasmonic biosensor with gold grating on thin gold film. AIP Advances, 11(3):035216, 2021.
- [42] Thomas L Koch, Frederick W Ostermayer Jr, Donald M Tennant, and Jean-Marc Verdiell. Grating fabrication using electron beam lithography, May 9 1995. US Patent 5,413,884.
- [43] N. Darwish, D. Caballero, M. Moreno, A. Errachid, and J. Samitier. Multi-analytic grating coupler biosensor for differential binding analysis. Sensors and Actuators, B: Chemical, 144(2):413–417, 2010.
- [44] Anand M Shrivastav, Uroš Cvelbar, and Ibrahim Abdulhalim. A comprehensive review on plasmonic-based biosensors used in viral diagnostics. Communications biology, 4(1):1–12, 2021.
- [45] Ajay Kumar Agrawal, Akanksha Ninawe, and Anuj Dhawan. Non-uniform narrow groove plasmonic nano-gratings for spr sensing and imaging. IEEE Access, 9:10136–10152, 2021.
- [46] Junrong Li, Alain Wuethrich, Abu AI Sina, Han-Hao Cheng, Yuling Wang, Andreas Behren, Paul N Mainwaring, and Matt Trau. A digital single-molecule nanopillar sers platform for predicting and monitoring immune toxicities in immunotherapy. Nature communications, 12(1):1–12, 2021.
- [47] Rana Tabassum and Ravi Kant. Cascaded wavelength multiplexed refractive index sensors in optical fibers based on surface plasmon resonances. Journal of Applied Physics, 128(7):073101, aug 2020.
- [48] Nelson D. Gomez-Cardona, Erick Reyes-Vera, and Pedro Torres. Multi-Plasmon Resonances in Microstructured Optical Fibers: Extending the Detection Range of SPR Sensors and a Multi-Analyte Sensing Technique. IEEE Sensors Journal, 18(18):7492–7498, sep 2018.
- [49] Anuj K. Sharma and Ankit Kumar Pandey. Self-referenced plasmonic sensor with TiO 2 grating on thin Au layer: simulated performance analysis in optical communication band. Journal of the Optical Society of America B, 36(8):F25, aug 2019.
- [50] Mohammad Abutoama and Ibrahim Abdulhalim. Self-referenced biosensor based on thin dielectric grating combined with thin metal film. Optics Express, 23(22):28667, nov 2015.
- [51] Ankit Bisht, Jorge Cuadra, Martin Wersäll, Adriana Canales, Tomasz J. Antosiewicz, and Timur Shegai. Collective Strong Light-Matter Coupling in Hierarchical Microcavity-Plasmon-Exciton Systems. Nano Letters, 19(1):189–196, jan 2019.
- [52] Jiří Homola, editor. Surface Plasmon Resonance Based Sensors, volume 4 of Springer Series on Chemical Sensors and Biosensors. Springer Berlin Heidelberg, Berlin, Heidelberg, 2006.
- [53] A Bouhelier, Th Huser, H Tamaru, H-J Güntherodt, DW Pohl, Fadi I Baida, and D Van Labeke. Plasmon optics of structured silver films. Physical Review B, 63(15):155404, 2001.
- [54] S. M. Enamul Hoque Yousuf, Mashnoon Alam Sakib, and Md Zahurul Islam. A High-Performance Plasmonic Nanosensor Based on an Elliptical Nanorod in an MIM Configuration. IEEE Sensors Journal, 18(15):6145–6153, aug 2018.
- [55] Alejandro Sánchez-Postigo, Alejandro Ortega-Moñux, Jordi Soler Penadés, Ahmed Osman, Milos Nedeljkovic, Zhibo Qu, Yangbo Wu, Íñigo Molina-Fernández, Pavel Cheben, Goran Z Mashanovich, and J. Gonzalo Wangüemert-Pérez. Suspended germanium waveguides with subwavelength-grating metamaterial cladding for the mid-infrared band. Optics Express, 29(11):16867–16878, 2021.
- [56] Mohamad Nejat and Najmeh Nozhat. Multi-band mim refractive index biosensor based on ag-air grating with equivalent circuit and t-matrix methods in near-infrared region. Scientific reports, 10(1):1–12, 2020.
- [57] Minseok Seo, Jeeyoung Lee, and Myeongkyu Lee. Grating-coupled surface plasmon resonance on bulk stainless steel. Optics Express, 25(22):26939–26949, 2017.
- [58] Jiří Homola. On the sensitivity of surface plasmon resonance sensors with spectral interrogation. Sensors and Actuators B: Chemical, 41(1-3):207–211, 1997.
- [59] Elisabeth Galopin, Joanna Niedziółka-Jönsson, Abdellatif Akjouj, Yan Pennec, Bahram Djafari-Rouhani, Adnane Noual, Rabah Boukherroub, and Sabine Szunerits. Sensitivity of plasmonic nanostructures coated with thin oxide films for refractive index sensing: Experimental and theoretical investigations. Journal of Physical Chemistry C, 114(27):11769–11775, jul 2010.
- [60] Aleksandar D. Rakić, Aleksandra B. Djurišić, Jovan M. Elazar, and Marian L. Majewski. Optical properties of metallic films for vertical-cavity optoelectronic devices. Applied Optics, 37(22):5271, aug 1998.
- [61] XF Li and Siu Fung Yu. Long-wavelength optical transmission of extremely narrow slits via hybrid surface-plasmon and fabry–pérot modes. Journal of Applied Physics, 108(1):013302, 2010.
- [62] Lukas Neumeier, Romain Quidant, and Darrick E Chang. Self-induced back-action optical trapping in nanophotonic systems. New Journal of Physics, 17(12):123008, 2015.
- [63] Guoguo Kang, Ismo Vartiainen, Benfeng Bai, and Jari Turunen. Enhanced dual-band infrared absorption in a fabry-perot cavity with subwavelength metallic grating. Optics express, 19(2):770–778, 2011.
- [64] Max Born and Emil Wolf. Principles of optics: electromagnetic theory of propagation, interference and diffraction of light. Elsevier, 2013.
- [65] CR Kitchin. Astrophysical Techniques. Citeseer, 2003.
- [66] Edward D Palik. Handbook of optical constants of solids, volume 3. Academic press, 1998.
- [67] Barbora Špačková, Marek Piliarik, Pavel Kvasnička, Christos Themistos, Muttukrishnan Rajarajan, and Jiří Homola. Novel concept of multi-channel fiber optic surface plasmon resonance sensor. Sensors and Actuators, B: Chemical, 139(1):199–203, may 2009.
- [68] Lili Sun, Juan Qin, Zhengrong Tong, Weihua Zhang, and Mingju Gong. Simultaneous measurement of refractive index and temperature based on down-taper and thin-core fiber. Optics Communications, 426:506–510, nov 2018.
- [69] Kunhua Wen, Yihua Hu, Li Chen, Jinyun Zhou, Liang Lei, and Ziming Meng. Single/Dual Fano Resonance Based on Plasmonic Metal-Dielectric-Metal Waveguide. Plasmonics, 11(1):315–321, feb 2016.
- [70] Hongxue Fu, Shilei Li, Yilin Wang, Gang Song, Pengfei Zhang, Lulu Wang, and Li Yu. Independently Tunable Ultrasharp Double Fano Resonances in Coupled Plasmonic Resonator System. IEEE Photonics Journal, 10(1):1–9, feb 2018.
- [71] Gun Duk Kim, Geun Sik Son, Hak Soon Lee, Ki Do Kim, and Sang Shin Lee. Integrated photonic glucose biosensor using a vertically coupled microring resonator in polymers. Optics Communications, 281(18):4644–4647, sep 2008.
- [72] Chen Chen, Xun Hou, and Jinhai Si. Design of a multi-analyte resonant photonic platform for label-free biosensing. Nanotechnology, 30(27):275501, apr 2019.
- [73] Ekaterina N. Lazareva and Valery V. Tuchin. Measurement of refractive index of hemoglobin in the visible/NIR spectral range. Journal of Biomedical Optics, 23(03):1, mar 2018.
- [74] Syed Ismail Ahmad. Studies on some biophysical aspects of human renal excretory fluid. INFLIBNET, 2010.
- [75] Harold P. Erickson. Size and Shape of Protein Molecules at the Nanometer Level Determined by Sedimentation, Gel Filtration, and Electron Microscopy. Biological Procedures Online, 11(1):32–51, dec 2009.
- [76] Rongqing Hui and Maurice O’Sullivan. Fiber optic measurement techniques. Academic Press, 2009.
- [77] W. W. HAWKINS, E. SPECK, and V. G. LEONARD. Variation of the hemoglobin level with age and sex. Blood, 9(10):999–1007, oct 1954.
- [78] TC Hwang. Experiments in physical chemistry. Gaulih Book Co., Taipei, 1561:1562–1563, 1994.
- [79] Lion Augel, Yuma Kawaguchi, Stefan Bechler, Roman Körner, Jörg Schulze, Hironaga Uchida, and Inga A. Fischer. Integrated Collinear Refractive Index Sensor with Ge PIN Photodiodes. ACS Photonics, 5(11):4586–4593, nov 2018.
- [80] Yujia Wang, Chengwei Sun, Hongyun Li, Qihuang Gong, and Jianjun Chen. Self-reference plasmonic sensors based on double Fano resonances. Nanoscale, 9(31):11085–11092, 2017.
- [81] J. Homola, H.B. Lu, and S.S. Yee. Dual-channel surface plasmon resonance sensor with spectral discrimination of sensing channels using dielectric overlayer. Electronics Letters, 35(13):1105, 1999.
- [82] David Montero, Carmen Vázquez, Ingo Möllers, Jon Arrúe, and Dieter Jäger. A Self-Referencing Intensity Based Polymer Optical Fiber Sensor for Liquid Detection. Sensors, 9(8):6446–6455, aug 2009.
- [83] Tigran V Shahbazyan and Mark I Stockman. Plasmonics: theory and applications. Springer, 2013.
- [84] A. Karabchevsky, O. Krasnykov, I. Abdulhalim, B. Hadad, A. Goldner, M. Auslender, and S. Hava. Metal grating on a substrate nanostructure for sensor applications. Photonics and Nanostructures - Fundamentals and Applications, 7(4):170–175, dec 2009.
- [85] Xiaobin Ren, Kun Ren, and Chengguo Ming. Self-Reference Refractive Index Sensor Based on Independently Controlled Double Resonances in Side-Coupled U-Shaped Resonators. Sensors, 18(5):1376, apr 2018.
- [86] Yujia Wang, Chengwei Sun, Hongyun Li, Qihuang Gong, and Jianjun Chen. Self-reference plasmonic sensors based on double Fano resonances. Nanoscale, 9(31):11085–11092, 2017.