subsecref \newrefsubsecname = \RSsectxt \RS@ifundefinedthmref \newrefthmname = theorem \RS@ifundefinedlemref \newreflemname = lemma
Ray-tracing Analysis for Cross-polarization Scattering Diagnostic on MAST-Upgrade Spherical Tokamak
Abstract
A combined Doppler backscattering/cross-polarization scattering (DBS/CPS) system is being deployed on MAST-U, for simultaneous measurements of local density turbulence, turbulence flows, and magnetic turbulence. In this design, CPS shares the probing beam with the DBS and uses a separate parallel-viewing receiver system. In this study, we utilize a modified GENRAY 3D ray-tracing code, to simulate the propagation of the probing and scattered beams. The contributions of different scattering locations along the entire beam trajectories are considered, and the corresponding local wavenumbers are estimated using the wave-vector matching criterion. The wavenumber ranges of the local that are detectable to the CPS system are explored for simulated L- and H-mode plasmas.
I Introduction
One significant feature of the spherical tokamaks (STs), such as MAST-U,[1] is the high ratio of the plasma kinetic energy to the magnetic energy (i.e., high ). Although STs are more economically favorable than conventional high-field tokamaks, the high may also introduce more violent electromagnetic fluctuations and turbulent transport. These magnetic fluctuations are predicted to be associated with kinetic ballooning modes[2] (KBMs) and microtearing modes[3, 4] (MTMs), and can determine the edge plasma transport and thus pedestal structure. Therefore, to characterize and predict the transport process induced by these electromagnetic turbulence in high plasmas, the local measurements of internal magnetic fluctuations are highly desirable.
A novel diagnostic technique, combining Doppler backscattering (DBS) and cross-polarization scattering (CPS), has been deployed on MAST-U. This setup enables simultaneous measurements of local internal density and magnetic fluctuations at the radial locations where KBMs and MTMs have been predicted to be unstable in previous ST experiments. The DBS diagnostic (a.k.a. Doppler reflectometry) measures intermediate-to-high wavenumber density fluctuations and their propagation velocities.[5, 6, 7] The CPS technique, on the other hand, measures internal magnetic fluctuations based on the scattering of an incident microwave beam into the orthogonal polarization by magnetic fluctuations.[8, 6, 9, 10] Specifically, the perturbed current induced in the plasma by the incident electromagnetic wave, , can be written as[11, 12]
where is the plasma frequency, is the electron gyro-frequency, is the local plasma density, is the local magnetic field, is the vacuum permittivity, and is the unperturbed conductivity tensor. Here, the first term on the right-hand side represents the scattered current of the same polarization (parallel to ) by density fluctuations; the second term corresponds to the CPS current (orthogonal to ) due to the magnetic fluctuations. One may note that the unperturbed conductivity tensor is reduced to in isotropic plasmas. So, the CPS wave power depends not only on local magnetic fluctuation but also the local mean density.
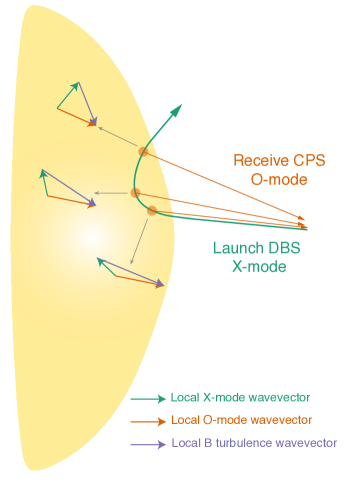
The CPS diagnostic on the MAST-U shares the probing beam with the DBS diagnostic, but uses a separate, parallel-viewing receiver antenna. In principle, the CPS process occurs along the entire beam trajectory once the wavevector and frequency matching conditions are satisfied. The frequency matching condition is satisfied easily, since the frequency of magnetic turbulence is about 3–4 orders of magnitude less than that of the probing mm-wave, i.e., , where is the O-mode frequency, is the X-mode frequency, and is the frequency of the matched magnetic turbulence. The wavevector matching, however, is not trivial for the CPS process. LABEL:Fig:diag-cps demonstrates examples in which the incident X-mode DBS wave was scattered into the O-mode CPS wave at three different locations. To be received by the CPS system, the wavevector of the scattered CPS wave () should aim towards the CPS antenna. At a given scattering center, if the wavevector of the incident DBS wave () is known, then the wavevector of the local turbulence () can be obtained via the wavevector matching condition, i.e., . The matched wavenumber for the local turbulence varies substantially as the scattering location is changed (LABEL:Fig:diag-cps). As a result, the interpretation of the CPS measurements can be challenging. A thorough understanding of the trajectories of incident and scattered microwave beams is required to evaluate the probed wavenumber and the location of the scattering centers.
In this paper, we present the calculation of the wavenumber values at multiple scattering locations by using modified GENRAY,[13] a 3D ray-tracing code, for the combined DBS/CPS system on the MAST-U. The wavenumbers for matched local magnetic turbulence are explored in both L-mode and H-mode plasmas. Some effects and challenges that may affect the CPS signals are also briefly discussed.
II GENRAY ray-tracing Analysis for combined DBS and CPS diagnostics
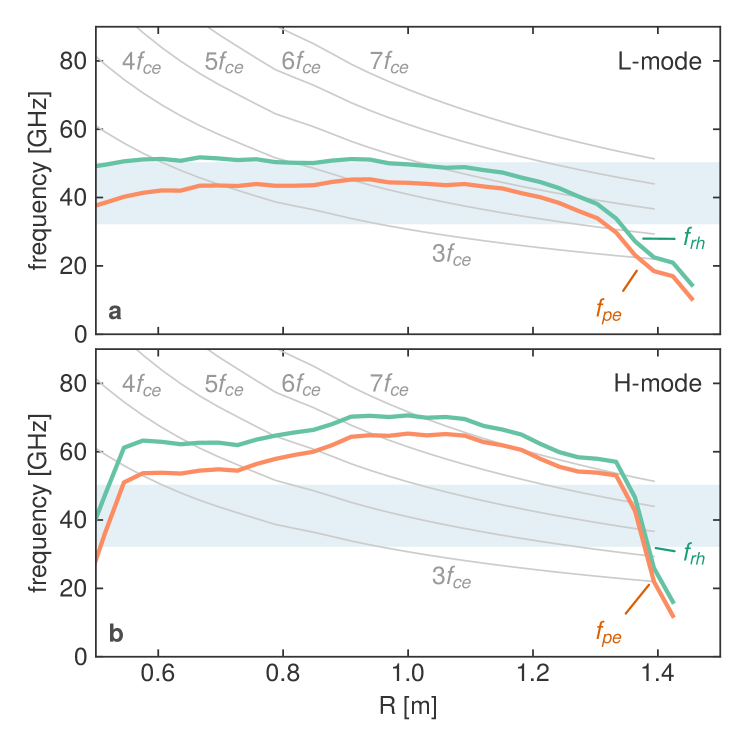
The typical cutoff and resonance frequencies that may be present in MAST-U[1] are shown in LABEL:Fig:cutoff-prof. The right-hand frequency () and the plasma frequency () correspond to the cutoff frequency for the X-mode wave and O-mode wave, respectively. The shaded area indicates the frequency range of the DBS launch waves. In an L-mode plasma, the probing beam covers the mid-radius region of the plasma, and the cutoff radii for the X-mode () and O-mode () beams are well separated (LABEL:Fig:cutoff-prof(a)). The O-mode launch will lead to a measurement of inner region in the L-mode plasma. In the H-mode plasma, the probing beam can only cover the steep gradient region at the pedestal, and the cut-off radii of the X-mode and O-mode are close (LABEL:Fig:cutoff-prof(b)). One may note that, if an O-mode wave is launched to the plasma from the low-field side, the scattered X-mode wave can only be receivable when the radius of the cross-polarization scattering is greater than the right-hand cut-off radius. This indicates that the effective measurement region of the CPS diagnostic is the outer region of the plasma with its inner bound at the cutoff layer of the X-mode wave.
In this study, the wavenumbers of the local magnetic turbulence measured by CPS are analyzed using ray-tracing calculations based on a 3D ray tracing code, GENRAY.[13] An example of procedure is described as follows. First, an X-mode DBS probing beam ( GHz) is launched into the plasma at a certain angle with respect to the horizontal plane, and here four degrees of vertical angles are chosen, i.e., . Since the scattering into O-mode can occur at any position along the entire DBS ray, we then choose 7 scattering centers that are uniformly distributed along each probing ray. In the next step, the O-mode CPS ray is launched towards the CPS receiver at each of the scattering centers. On the MAST-U the CPS receiver is at the same location as the DBS launching system in the vessel ( m and m). The ray-tracing calculations are iterated to ensure that these O-mode rays can reach the CPS receiver.[12] In our calculations, we choose 2 mm as the minimum tolerable offset between the CPS receiver and the end-points of each rays. The scattered wavevector of the local magnetic turbulence at each CPS locations can be calculated using the wavevector matching conditions shown earlier, i.e., . Here, the local O- and X-mode wavevector and are written as , where is the refractive index for O- or X-mode wave given by GENRAY calculations and is the vacuum wavenumber. In following subsections, we will show the results of the ray-tracing analysis in both L-mode and H-mode plasmas.
II.1 Ray-tracing results in L-mode plasmas
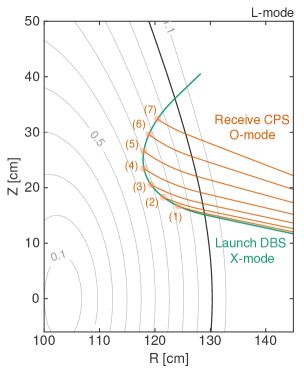
LABEL:Fig:Lmode shows the ray paths of the X-mode DBS probing beam with the vertical launch angle , as well as the O-mode CPS rays in an L-mode plasma. The green curve represents the trajectory of the incident X-mode DBS ray. The 7 chosen scattering centers are uniformly distributed along the probing ray (orange circles in LABEL:Fig:Lmode), and all these points are inside the separatrix. The O-mode CPS rays that can potentially be collected by the CPS receiver are shown as orange curves in LABEL:Fig:Lmode. The O-mode rays are less refracted than the X-mode ray. Thus, the O-mode rays shown in LABEL:Fig:Lmode do not follow the X-mode ray back to the receiver.
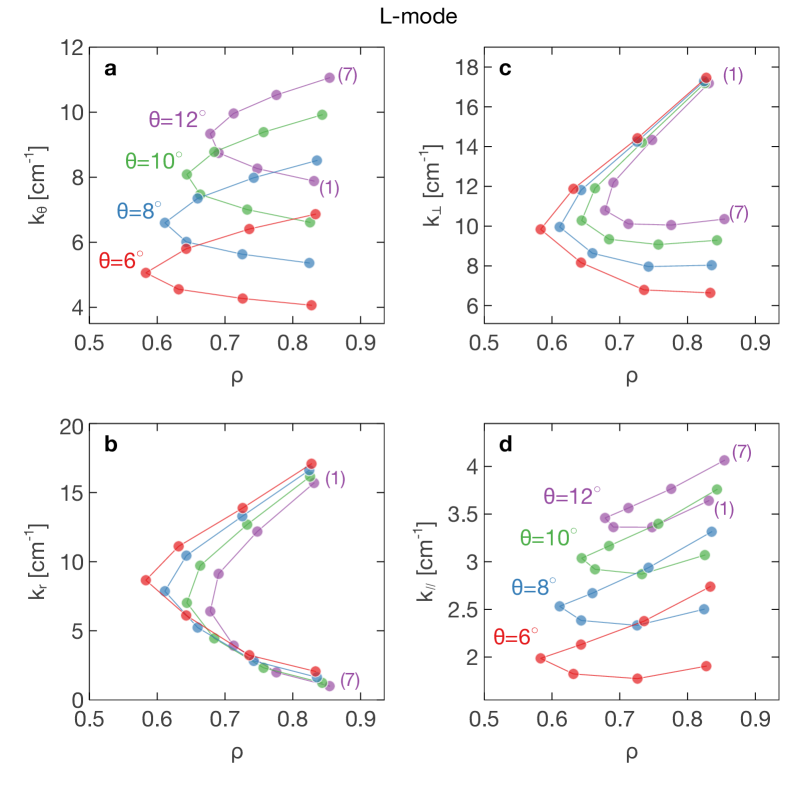
LABEL:Fig:cps_k_Lmode shows the calculated wavenumbers of the local magnetic turbulence in the L-mode plasma corresponding to four different vertical launch angles of the probing ray. The 7 scattering centers also corresponds to those displayed in LABEL:Fig:Lmode. As the chosen scattering center moves along the X-mode probing ray, e.g., from No. 1 to 7, the poloidal wavenumber increases (LABEL:Fig:cps_k_Lmode(a)) and the radial wavenumber decreases (LABEL:Fig:cps_k_Lmode(b)). In other words, the matched wavevector of the local turbulence is oriented more poloidally () at the later part of the X-mode probing ray, and more radially () if the CPS occurs at the early part of the probing ray. Here, both of the radial and poloidal wavevectors lie in the perpendicular plane: the radial wavevector is normal to the flux surface; the poloidal wavevector is tangential to the magnetic flux surface and orthogonal to both radial and parallel wavevectors, i.e., . The perpendicular wavenumbers are also greater when the CPS location at the later part of the incident DBS ray (LABEL:Fig:cps_k_Lmode(c)). The matched parallel wavenumber does not change monotonically but the variation is relatively small for different locations of the scattering centers (LABEL:Fig:cps_k_Lmode(d)).
II.2 Ray-tracing results in H-mode plasmas
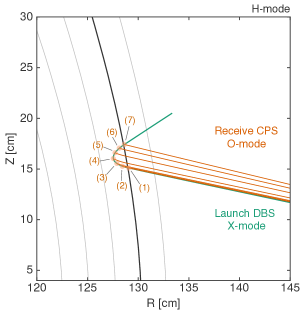
LABEL:Fig:Hmode shows the propagation of the X-mode DBS probing beam with the vertical launch angle , and the resultant O-mode CPS rays in an H-mode plasma. Similar to L-mode case, the green curve represents the trajectory of the incident X-mode DBS ray, and the orange curves represent the detectable O-mode rays launched from 7 chosen scattering centers. The scattering centers are close to the separatrix due to the high density. One may also note that the cutoff layer of the O-mode ray is close to that of the X-mode ray in H-mode plasmas (LABEL:Fig:cutoff-prof(b)). Some O-mode CPS rays are almost overlapped with part of the X-mode probing ray (No. 1–3 in LABEL:Fig:Hmode), i.e., these CPS rays likely follow the backscattering path of the X-mode ray. However, the CPS O-mode ray emitted from the turning point of the incident X-mode ray (No. 4 in LABEL:Fig:Hmode) does not overlap with the backscattering ray, although the O-mode cutoff is close to the X-mode cutoff in the H-mode case (LABEL:Fig:cutoff-prof(b)).
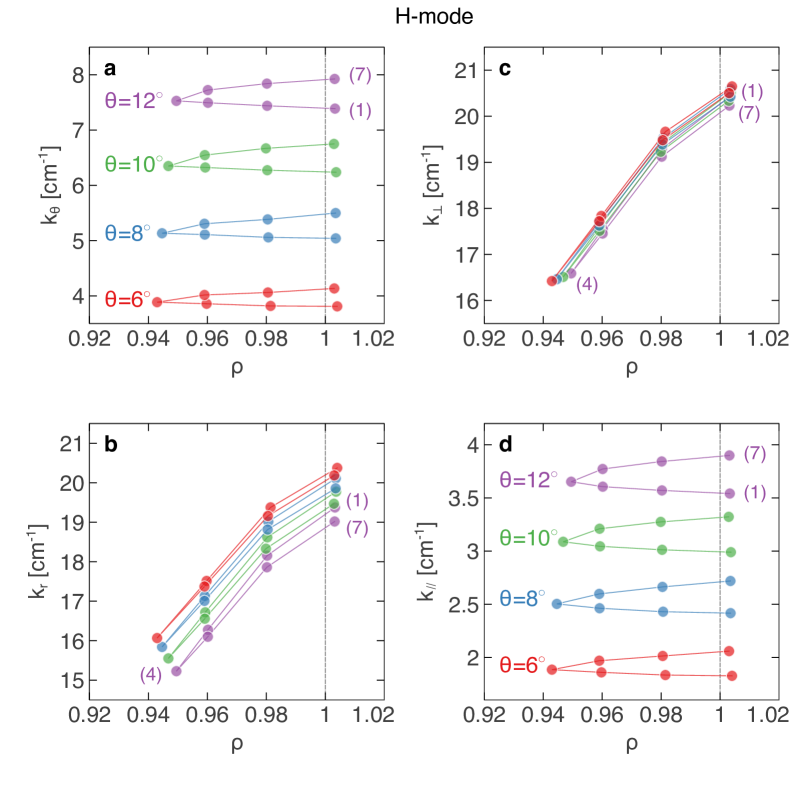
LABEL:Fig:cps_k_Hmode shows the calculated wavenumbers of the local magnetic turbulence in the H-mode plasma corresponding to four different vertical launch angles of the probing ray. The 7 scattering centers also corresponds to those displayed in LABEL:Fig:Hmode. As the chosen scattering center moves along the X-mode probing ray from No. 1 to 7, the poloidal wavenumber increases (LABEL:Fig:cps_k_Hmode(a)), but the radial wavenumber does not show a monotonic trend (LABEL:Fig:cps_k_Hmode(b)). Also, the is greater than by a factor of 2–3, and therefore the perpendicular wavenumbers is dominated by the radial wavenumber (LABEL:Fig:cps_k_Hmode(c)). The matched parallel wavenumber does not change monotonically but the variation is relatively small for different locations of the scattering centers (LABEL:Fig:cps_k_Hmode(d)).
III Some considerations on CPS signals
The signals received by the CPS system are determined by several factors. Besides the local magnetic fluctuation and the mean density as discussed in LABEL:Sec:Introduction, the CPS signals are also affected by the wavenumbers detected at the different scattering centers, the receiver antenna pattern and orientation, the polarization misalignment, etc. In this section, we briefly discuss these effects on the CPS signals and their implications for our measurements.
The CPS signal level depends on the matched wavenumber of the local magnetic turbulence. For example, the nonlinear gyrokinetic simulations[14] show that the magnetic fluctuations’ power spectrum of the MTM turbulence is peaked at certain poloidal wavenumber range () but obeys the power law for the radial wavenumber spectrum ( where ). Hence, the strongest MTM contributions to the CPS signals locate at and . Moreover, the parallel wavenumber of magnetic turbulence is much smaller than its perpendicular counterpart, i.e., . If the wavevectors of the launched and received microwave are not well aligned to match , then the scattered power will drop substantially. Specifically, for a Gaussian beam, this wavenumber mismatch leads to a decrease in the scattered power by a factor of , where is the mismatch of the parallel wavenumber and is the beam radius.[15] Since the combined DBS/CPS diagnostic on MAST-U employs a 2D steering optical system, the mismatch of the parallel wavenumber can be largely reduced by using the toroidal steering.
The CPS signal level is affected by the receiver antenna pattern and orientation as well. As measured in the lab, the launched DBS microwave is a Gaussian beam with a beam radius of cm (i.e., the radius where the beam power drops to of the maximum power). Since the receiver CPS antenna is of the same design of the launching DBS antenna, the scattered power that can be coupled to the receiver antenna is determined by the convolution of the Gaussian beam profile and the scattered wave power, which is proportional to . Here, is the distance from the scattering center to the receive beam axis. Due to this convolution effect, the received CPS signal will also be affected by interference from multiple scattering centers. These scattering points probably have different wavenumbers, local mean densities, magnetic turbulence levels, and Doppler shifts. The Doppler shifts can be used to separate signals from different locations. Also, by employing the toroidal steering system, the matching can be achieved for a single scattering location, hence the signal from certain location can be enhanced over others.
Another effect that challenges the cross-polarization scattering measurement is the mismatch between the polarization of the launched beam and the plasma magnetic field pitch angle. The mismatch effect on the CPS signal have been discussed in earlier studies.[12, 8, 9] Assuming an X-mode beam is launched, the mismatch of polarization can result in a leaked O-mode component that propagates beyond the X-mode cutoff layer, and give rise to an backscattering at the O-mode cutoff layer. The backscattering leads to a density fluctuation signal and hence contaminates the CPS signals. Also, the pitch angle of the magnetic field is much larger in spherical tokamaks than that in conventional tokamaks. Thus the mismatch effect is more deleterious in STs, since the power of the unwanted/leaked O-mode component is proportional to , where is the mismatch angle. For the combined DBS/CPS system in MAST-U, this polarization matching issue has been addressed in CPS measurements by using a remotely tunable polarizer to exclude the contamination of the leaked mm-wave component.
IV Summary and future work
In this study, the ray-tracing analysis of the cross-polarization scattering processes has been performed for the combined DBS/CPS diagnostics on the MAST-U spherical tokamak, using the GENRAY 3D ray-tracing code. Both the L-mode and H-mode cases have been considered, in which O-mode CPS rays are emitted along the entire probing X-mode ray of DBS. The matched wavenumbers of local magnetic turbulence are greater in the H-mode than those in the L-mode, due to the large radial wavenumbers in the H-mode case. The large radial wavenumbers probably lead to smaller received CPS signal level. Some effects and challenges that may affect the CPS signals are also discussed briefly. To improve the detectable CPS signal level, a better match of the parallel wavenumber should be pursued by deploying a 2D launch/receive antenna system. Also, the mismatch between the incident beam’s polarization and the magnetic pitch angle should always be avoided to prevent the contamination due to the backscattered density fluctuations.
Furthermore, a full-wave simulation may be useful for a better understanding of several effects that may complicate the interpretation of CPS signals, e.g., the diffraction of the mm-wave beam, the size of scattering volume, and interference of signals from different locations. Thus, the 2D and 3D full-wave simulations will be pursued as the next step for a synthetic CPS diagnostic.
Acknowledgements.
The authors thank Dr. N. A. Crocker and Dr. Peng Shi for helpful discussions. This material is based upon work supported by the U.S. Department of Energy, Office of Science, Office of Fusion Energy Sciences under Award DE-SC0019005.Data availability
The data that support the findings of this study are available from the corresponding author upon reasonable request.
References
- Harrison et al. [2019] J. Harrison, R. Akers, S. Allan, J. Allcock, J. Allen, L. Appel, M. Barnes, N. Ben Ayed, W. Boeglin, C. Bowman, J. Bradley, P. Browning, P. Bryant, M. Carr, M. Cecconello, C. Challis, S. Chapman, I. Chapman, G. Colyer, S. Conroy, N. Conway, M. Cox, G. Cunningham, R. Dendy, W. Dorland, B. Dudson, L. Easy, S. Elmore, T. Farley, X. Feng, A. Field, A. Fil, G. Fishpool, M. Fitzgerald, K. Flesch, M. Fox, H. Frerichs, S. Gadgil, D. Gahle, L. Garzotti, Y.-C. Ghim, S. Gibson, K. Gibson, S. Hall, C. Ham, N. Heiberg, S. Henderson, E. Highcock, B. Hnat, J. Howard, J. Huang, S. Irvine, A. Jacobsen, O. Jones, I. Katramados, D. Keeling, A. Kirk, I. Klimek, L. Kogan, J. Leland, B. Lipschultz, B. Lloyd, J. Lovell, B. Madsen, O. Marshall, R. Martin, G. McArdle, K. McClements, B. McMillan, A. Meakins, H. Meyer, F. Militello, J. Milnes, S. Mordijck, A. Morris, D. Moulton, D. Muir, K. Mukhi, S. Murphy-Sugrue, O. Myatra, G. Naylor, P. Naylor, S. Newton, T. O’Gorman, J. Omotani, M. O’Mullane, S. Orchard, S. Pamela, L. Pangione, F. Parra, R. Perez, L. Piron, M. Price, M. Reinke, F. Riva, C. Roach, D. Robb, D. Ryan, S. Saarelma, M. Salewski, S. Scannell, A. Schekochihin, O. Schmitz, S. Sharapov, R. Sharples, S. Silburn, S. Smith, A. Sperduti, R. Stephen, N. Thomas-Davies, A. Thornton, M. Turnyanskiy, M. Valovič, F. Van Wyk, R. Vann, N. Walkden, I. Waters, H. Wilson, and the MAST-U Team and the EUROfusion MST1 Team, Nuclear Fusion 59, 112011 (2019).
- Diallo et al. [2013] A. Diallo, G. J. Kramer, D. R. Smith, R. Maingi, R. E. Bell, W. Guttenfelder, B. P. LeBlanc, M. Podestà, G. J. McKee, and R. Fonck, Physics of Plasmas 20, 012505 (2013).
- Dickinson et al. [2012] D. Dickinson, C. M. Roach, S. Saarelma, R. Scannell, A. Kirk, and H. R. Wilson, Physical Review Letters 108, 135002 (2012), publisher: American Physical Society.
- Smith et al. [2013] D. R. Smith, R. J. Fonck, G. R. McKee, D. S. Thompson, R. E. Bell, A. Diallo, W. Guttenfelder, S. M. Kaye, B. P. LeBlanc, and M. Podesta, Physics of Plasmas 20, 055903 (2013).
- Hirsch et al. [2001] M. Hirsch, E. Holzhauer, J. Baldzuhn, B. Kurzan, and B. Scott, Plasma Physics and Controlled Fusion 43, 1641 (2001).
- Hillesheim et al. [2015] J. C. Hillesheim, D. Dickinson, C. M. Roach, S. Saarelma, R. Scannell, A. Kirk, N. A. Crocker, W. A. Peebles, and H. M. and, Plasma Physics and Controlled Fusion 58, 014020 (2015).
- Peebles et al. [2010] W. A. Peebles, T. L. Rhodes, J. C. Hillesheim, L. Zeng, and C. Wannberg, Review of Scientific Instruments 81, 10D902 (2010).
- Barada et al. [2016] K. Barada, T. L. Rhodes, N. A. Crocker, and W. A. Peebles, Review of Scientific Instruments 87, 11E601 (2016).
- Rhodes et al. [2014] T. L. Rhodes, W. A. Peebles, N. A. Crocker, and X. Nguyen, Review of Scientific Instruments 85, 11D838 (2014).
- Zou et al. [1995] X. L. Zou, L. Colas, M. Paume, J. M. Chareau, L. Laurent, P. Devynck, and D. Gresillon, Physical Review Letters 75, 1090 (1995).
- Lehner, Rax, and Zou [1989] T. Lehner, J. M. Rax, and X. L. Zou, Europhysics Letters (EPL) 8, 759 (1989), publisher: IOP Publishing.
- Wang et al. [2018] G. Wang, T. L. Rhodes, N. A. Crocker, W. A. Peebles, and K. Barada, Review of Scientific Instruments 89, 10H113 (2018).
- Smirnov, Harvey, and Kupfer [1994] A. P. Smirnov, R. W. Harvey, and K. Kupfer, Bull. Amer. Phys. Soc. 39, 1626 (1994).
- Guttenfelder et al. [2012] W. Guttenfelder, J. Candy, S. M. Kaye, W. M. Nevins, E. Wang, J. Zhang, R. E. Bell, N. A. Crocker, G. W. Hammett, B. P. LeBlanc, D. R. Mikkelsen, Y. Ren, and H. Yuh, Physics of Plasmas 19, 056119 (2012), publisher: American Institute of Physics.
- Slusher and Surko [1980] R. E. Slusher and C. M. Surko, Physics of Fluids 23, 472 (1980).