Dynamical Cluster Approximation Study of Electron Localization in the Extended Hubbard Model
Abstract
We perform a detailed study of the phase transitions and mechanisms of electron localization in the extended Hubbard model using the dynamical cluster approximation on a cluster. We explore the interplay of charge order and Mott physics. We find that a nearest-neighbor Coulomb interaction causes “screening” effects close to the Mott phase transition, pushing the phase boundary to larger values of . We also demonstrate the different effects of on correlations in metallic and insulating regimes, and document the different correlation aspects of charge order and Mott states.
I Introduction
Understanding the effects of strong electron correlation and the associated localization of charged particles remains a challenge in condensed matter physics. As various exotic quantum states including high temperature superconductivity emerge in the vicinity of localized states, metal-insulator transitions Mott (1968); Imada et al. (1998); Dagotto (2005) are the subject of intense investigation. Dagotto (1994); Basov et al. (2017); Anderson (1987); Jördens et al. (2008)
The Hubbard model, where Coulomb interactions between electrons are assumed to be local, has been commonly used to study Mott localization and the related correlation-induced effects. Hubbard and Flowers (1963); Qin et al. (2021); Arovas et al. (2021) However, the approximation of purely local interactions may be severe in low-dimensional systems Schüler et al. (2013); Hansmann et al. (2013); Schüler et al. (2013); Wehling et al. (2011); Kotov et al. (2012); Seo (2000); Hotta (2012); Dressel and Drichko (2004); Jérome (2004); Merino and McKenzie (2001); Jérome (1991); Shibata et al. (2001); Seo (2000); Friend et al. (1999) where electron interactions are not fully screened. In these systems, non-local Coulomb interactions may lead to new physics that cannot be described by the Hubbard model. In particular, inter-site interactions are found to cause a strong modification of the effective onsite interactions resulting in a reduced Mott gap or even metallic behavior of otherwise insulating systems. Hansmann et al. (2013); Ayral et al. (2013) Moreover, they may lead to electron localization by charge ordering (CO).
The extended Hubbard model, where the nearest-neighbor Coulomb repulsion is included in addition to the local Hubbard interaction is a minimal model to study such effects. In it, the inclusion of energetically favors the breaking of translational symmetry with checkerboard charge ordering on a square lattice. Zhang and Callaway (1989); van Dongen (1994); Callaway et al. (1990)
Computational tools have played a crucial role in describing strong correlation physics in lattice systems. Various non-perturbative many-body methods have been developed. LeBlanc et al. (2015) Several of these are based on embedding schemes where the original lattice problem is mapped onto an auxiliary quantum impurity problem embedded in a self-consistently determined effective medium. The dynamical mean field theory (DMFT), Metzner and Vollhardt (1989); Georges et al. (1996); Vollhardt which utilizes such a mapping, has been successfully used to understand electron localization in the Hubbard model. Several extensions of DMFT have been developed to capture non-local spatial correlations effects. Maier et al. (2005); Kotliar et al. (2001); Rohringer et al. (2018); Rubtsov et al. (2008, 2009); Hafermann et al. (2009); Toschi et al. (2007); Rohringer et al. (2013); Ayral and Parcollet (2015, 2016); Stepanov et al. (2019)
Similarly, quantum embedding tools have been developed for the extended Hubbard model. This includes the extended DMFT (EDMFT), Chitra and Kotliar (2000); Sun and Kotliar (2002); Camjayi et al. (2008); Amaricci et al. (2010); Kapcia et al. (2017) and non-local perturbative techniques such as EDMFT+GW Sun and Kotliar (2002); Ayral et al. (2012, 2013); Huang et al. (2014) and the dual boson (DB) approach. Rubtsov et al. (2012); van Loon et al. (2014); Stepanov et al. (2016); Peters et al. (2019); Vandelli et al. (2020) In addition, cluster DMFT methods have been applied to explore two-dimensional (2D) extended Hubbard models on the square Merino (2007); Terletska et al. (2017); Merino (2007) and honeycomb lattices Wu and Tremblay (2014) in the context of CO as well as superconductivity. Jiang et al. (2018); Arita et al. (2004); Merino and McKenzie (2001)
In this paper, we extend our previous analyses for the two-dimensional (2D) extended Hubbard model Terletska et al. (2017, 2018); Paki et al. (2019) to larger values of , and explore the interplay of CO and Mott physics. We construct the phase diagram with three different phases: the metal, the -driven Mott insulator and the -induced CO phase, and perform a detailed analysis of model properties upon change of and . In the extended Hubbard model the electron localization emerges either via Mott localization or CO. These two ways of localization differ in behavior. For the Mott metal-insulator transition, an increase of leads to increasing correlation effects accompanied by a decrease in the double occupancy, an increase in the self-energy, and a decrease in the quasi-particle peak. For the CO phase transition, the double occupancy increases with . The -induced decrease in correlations is seen in the correlated metal and insulating regimes, where the self-energy decreases with increasing . Also, by exploring the properties of the CO insulating phase, we show that, unlike the Mott insulator, the CO insulator is weakly-correlated, with a band-like insulating gap opening in the spectrum. Merino (2007) We also study the noticeable “screening” effects where the local on-site interaction is effectively being reduced by non-local charge fluctuations, resulting in a shift of the Mott transition to larger values of . Hansmann et al. (2013)
II Model and Method
We consider the half-filled extended Hubbard model on a 2D square lattice defined by the Hamiltonian
| (1) |
where denotes creation (annihilation) operators of an electron with spin at the lattice site , is the number operator at site ; is the nearest-neighbor hopping amplitude; is the on-site interaction between electrons with opposite spins; is the inter-site interaction between two electrons on the neighboring sites, and denotes the chemical potential. The system is half-filled at , ( is the coordination number). Throughout the paper we set as the energy unit.
In the limiting case of , the Hamiltonian of Eq.1 describes the conventional Hubbard model with only local on-site electron-electron interaction. Hubbard and Flowers (1963) We limit our analysis to the unfrustrated Hubbard model with only nearest-neighbor hopping in the paramagnetic phase at half-filling with repulsive interactions .
For non-zero , Eq. 1 serves as the minimal model for describing CO induced by short-range Coulomb interactions. The emergence of CO in this model may be understood in terms of a simple energy argument: for large local interactions , it is energetically favorable for the systems to have a uniform arrangement of electrons with one electron per site so that the on-site Coulomb repulsion is minimized; in the opposite limit , the system prefers to CO in a checkerboard arrangement of doubly occupied and empty sites, such that the off-site repulsion between electrons on nearest-neighbor sites is minimized. In mean-field approximation, Bari (1971) a zero temperature phase transition from a Mott insulator to a CO insulator occurs at . Several beyond mean-field approaches have been applied to the extended Hubbard model, including the Monte Carlo on a finite size cluster, Zhang and Callaway (1989) perturbation theory, van Dongen (1994) variational cluster approximation, Aichhorn et al. (2004) the two-particle self-consistent approach, Davoudi and Tremblay (2007) and, more recently, effective medium quantum embedding methods. Chitra and Kotliar (2000); Bolech et al. (2003); Sun and Kotliar (2002); Camjayi et al. (2008); Sun and Kotliar (2002); Ayral et al. (2012, 2013); Huang et al. (2014); Rubtsov et al. (2012); van Loon et al. (2014); Stepanov et al. (2016); Peters et al. (2019); Vandelli et al. (2020); Merino (2007); Terletska et al. (2017); Wu and Tremblay (2014); Jiang et al. (2018); Arita et al. (2004); Amaricci et al. (2010); Kapcia et al. (2017)
In our study, we solve the Hubbard () and the extended Hubbard () model using the Dynamical Cluster Approximation (DCA) method, which is a momentum-space cluster extension of the DMFT. Maier et al. (2005) In the DCA, the lattice problem is mapped onto a periodic cluster of size embedded in a self-consistently determined dynamical effective medium.
In standard DCA for isotropic systems, Maier et al. (2005) the first Brillouin zone is divided into patches, each of which is denoted by a cluster momentum . The lattice self-energy within a patch is assumed to be constant and is approximated by the cluster self-energy with . The DCA self-consistency condition requires that at convergence, the cluster Green’s function and the coarse-grained (averaged over patches) lattice Green’s function are equal. The lattice Green’s function is constructed by using the cluster self-energy and is obtained by coarse-graining as . Here the summation is done over the momenta within the patch about the cluster momentum , with lattice momentum , and is the lattice dispersion of the model Eq. (1) on the 2D square lattice.
The effective cluster problem is then set up using the cluster-excluded Green’s function obtained via the Dyson’s equation . Solving the cluster problem for a given , one then gets the cluster Green’s function and cluster self-energy . The calculation is repeated iteratively until convergence is reached. For further details on the DCA and the numerical procedure, the reader is referred to Ref. Maier et al., 2005.
The major numerical work in solving the DCA self-consistency loop consists of solving the quantum cluster problem. Here we used the continuous time auxiliary field (CT-AUX) Gull et al. (2008a) method generalized to the systems with non-local density-density inter-site interactions .Terletska et al. (2017) As described in Refs. Wu and Tremblay, 2014; Arita et al., 2004, for square clusters, the DCA coarse-graining procedure renormalizes the nearest neighbor interactions as .
Our implementation of the DCA at finite also allows us to simulate the symmetry-broken CO phase, as long as the symmetry breaking is commensurate with the cluster. Maier et al. (2005); Fuchs et al. (2011) This enables an explicit study of not just the onset of the CO transition but also allows us to conduct simulations directly in the CO phase. For this, we consider a bipartite lattice structure with sublattices and . To enable the CO broken-symmetry analysis, we break the translation symmetry by adding a staggered chemical potential to our Hamiltonian of Eq. 1, i.e., , where and . In practice, we are interested in solution. We therefore start the simulations with a small on the first iteration of the DCA self-consistency loop and then set to zero on subsequent iterations. The system is then allowed to evolve freely, and will either converge to a state with a uniform distribution of electron density over lattice sites or fall into the CO state with a non-uniform charge distribution. Terletska et al. (2017)
Adding a staggered chemical potential breaks the translational symmetry of the lattice, leading to the doubling of the unit cell in real space. This implies that the size of the first Brillouin zone is halved, such that in the symmetry-broken CO phase the momentum space points and become degenerate. Following Ref. Fuchs et al., 2011, the broken translation symmetry introduces off-diagonal elements in DCA Green’s functions and self-energies . Consequently, the scalar DCA self-consistency equations become matrices. For example, the cluster Green’s function takes on the form
| (2) |
where is the momentum in the reduced Brillouin zone, and we omitted indices. The symmetry relations for the diagonal and the off-diagonal elements of the Green’s function are given as and , respectively. They hold for both the Green’s functions and for the self-energy. In the absence of CO, the off-diagonal elements vanish Terletska et al. (2018); Fuchs et al. (2011), and the Green’s function matrix becomes diagonal in momentum space.
The linear transformation Fuchs et al. (2011)
| (3) | ||||
allows to study the Green’s function or self-energy on each sublattice. Here is used for and sub-lattices, respectively.
III Results
III.1 phase diagram: DCA Hubbard model results
The purpose of this section is to set the stage for the discussion of the finite extended Hubbard model in Sec.III.2. For this, we first consider the paramagnetic half-filled Hubbard model on a square lattice. We focus on the temperature versus interaction strength phase diagram.
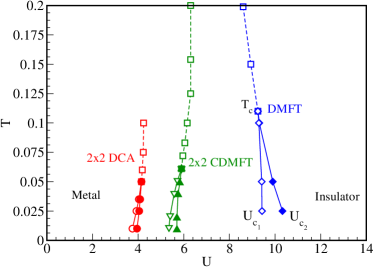
Fig. 1 shows the phase diagram for the half-filled 2D square lattice Hubbard model in the absence of the long-range order. At low temperatures, as the interaction strength increases, the system undergoes the first-order Mott-Hubbard transition between a metal and Mott insulator. Georges et al. (1996) The first-order coexistence region is delineated by two spinodal lines, and . The metallic solution exists for , and the insulating solution is stable for . As temperature increases, the coexistence region narrows, the metallic and insulating spinodals cross at a critical point and the transition becomes continuous. The region above displays a crossover between metal and insulator. Above , various types of crossover lines have been identified depending on the criteria used. Georges et al. (1996); Rozenberg et al. (1995); Terletska et al. (2011); Vučičević et al. (2013, 2015); Sordi et al. (2012); Park et al. (2008)
For comparison purposes and to demonstrate the effect of non-local correlations beyond the DMFT, we present the results obtained by DMFT in addition to our DCA data. We also show the results of Ref. Walsh et al., 2019 obtained by the real space CDMFT approach for a cluster. Park et al. (2008); Walsh et al. (2019) The DCA data show that when the non-local correlations are taken into account the Mott transition remains first order, but with significantly modified phase transition boundaries as compared to the DMFT results. These findings are in agreement with other beyond-DMFT methods, including the CDMFT of Refs. Park et al., 2008; Walsh et al., 2019 and second order dual fermion results. van Loon et al. (2018) This indicates that the non-local short-range anti-ferromagnetic fluctuations that are captured in the DCA significantly reduce the critical value of and at which a transition occurs. Schäfer et al. (2015) In addition, all beyond-DMFT methods show a positive slope of the coexistence region in the phase diagram of Fig. 1, which is different from the DMFT results. This change of slope has been explained by an entropy argument, with the low temperature insulating solution having a smaller entropy than the metal. Park et al. (2008)
We find that the critical value of in DCA Gull et al. (2008b)is substantially reduced compared to the DMFT value of Park et al. (2008); van Loon et al. (2018); Rohringer et al. (2018) and agrees with the trend seen in the CDMFT results, Park et al. (2008); Walsh et al. (2019) as well as with other non-local methods Schäfer et al. (2015), such as the VCA Balzer et al. (2009) and dual fermions. van Loon et al. (2018) We also find that the critical end point temperature in DCA is substantially reduced when the non-local correlations are taken into account. Our results for are similar to the recent CDMFT results Walsh et al. (2019) where was reported. While DCA and CDMFT agree at large , Maier et al. (2005) for smaller cluster sizes the results are expected to be different due to different embedding schemes.
All beyond DMFT methods Schäfer et al. (2015) show that non-local correlations modify the shape of the transition lines, reduce substantially the critical values of for the MIT, and shrink the size of the coexistence region. While there is some difference in the values of for various cluster extensions of DMFT, all of the non-local methods are consistent that non-local anti-ferromagnetic correlations are strong in 2D Hubbard models and can have a dramatic effect on the Mott transition. Schäfer et al. (2015)
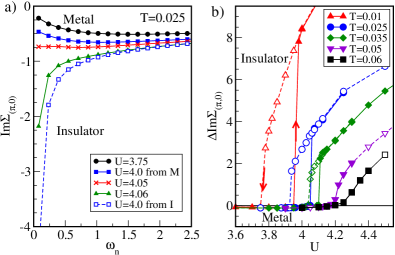
We now discuss the details of the construction of Fig. 1. The phase transition boundaries of Fig. 1 are constructed from the analysis of the self-energy behavior presented in Fig. 2. To distinguish between metal and insulator, we consider the self-energy at as in Ref. Park et al., 2008. We confirm that for this procedure gives the same results as using the local self-energy. The Mott insulating state is identified by a divergence of the imaginary part of the self-energy at the lowest Matsubara frequency. This indicates that a pole is developed at zero frequency and the gap opens in the spectrum. We use the following metric to distinguish between metal and insulator: if the state is metallic, and insulating otherwise. Fig. 2 demonstrates such changes in the behavior from metal (e.g., at ) to insulator (e.g., at ) at as increases. The self-energy here is obtained starting from the metallic solution, and as increases, the self-energy gets larger indicating increase of the correlations in the system, and diverges at larger values. Since is below the critical temperature , a coexistence region exists between the metallic and insulating spinodals. To demonstrate the coexistence of metallic and insulating solutions, we show the results for obtained starting from the metallic (solid lines) and insulating solutions (dashed lines), respectively.
To identify the spinodal and phase boundaries, based on definitions of metal and insulator, we introduce a shorthand notation , which is negative for a metal and positive for an insulator. Fig. 2-b) shows as function of interactions’ strength at several temperatures obtained for the increasing (closed symbols) and decreasing (open symbols) values of . For , shows hysteresis loops, which are indications of a first-order transition. The discontinuous jumps signal the disappearance of the metallic state at and insulating state at , respectively. The locations of the spinodal lines and are then determined by performing sweeps of at different temperatures. The hysteresis loops are widest at the lowest temperatures (e.g., ), decrease in size as temperature is increased (), and vanish at and above the second order critical end point (as seen from the data for ). Above the second order critical point , the dependence of the one-particle quantities becomes smooth. This region defines the crossover region. Georges et al. (1996); Rozenberg et al. (1995); Terletska et al. (2011); Vučičević et al. (2013, 2015); Sordi et al. (2012)
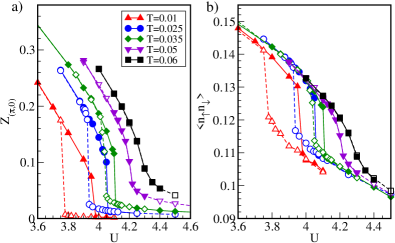
We show in Fig. 3 the results for the quasi-particle weight and the double occupancy at several temperatures versus the interaction strength . The -dependent behavior of these quantities also serves as an indicator of the correlation-induced nature of the Mott transition. We observe that the quasi-particle weight gets suppressed as increases, indicating that the quasi-particles acquire a large renormalized mass as the interaction strength increases. The double-occupancy also decreases with as the Mott insulator energetically favors singly occupied over the double-occupied states. As the temperature increases, the double occupancy increases, and it takes larger values of for the Mott transition to occur. Both and demonstrate hysteresis behavior at , and can also be used to extract the phase boundary of the phase diagram from Fig. 1. Walsh et al. (2019)
III.2 phase diagram: DCA extended Hubbard model results
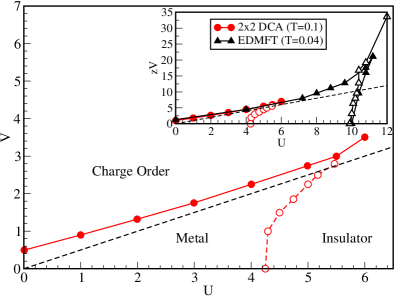
To understand the effects brought about by inter-site nearest-neighbor interactions , we now present results for the extended Hubbard model. First, we show in Fig. 4 the phase diagram in the presence of both local on-site interaction and nearest-neighbor interactions obtained by DCA. Due to the sign problem, especially pronounced at larger and , we limit our analysis to a temperature and , and values below and not far from the Mott transition. Fig. 4 shows that the phase diagram of the extended Hubbard model at half-filling features three phases: the isotropic metal, the Mott insulator, and a charge ordered state. Similarly to the case of , as the strength increases, the crossover from metal to Mott insulator occurs. However, with increasing , the metal-insulator crossover boundary (shown by red open symbols, dashed line) occurs at larger values of due to the “screening” effects induced by a competition between and . Hansmann et al. (2013); Schüler et al. (2013); van Loon et al. (2014) In addition to the isotropic metallic and Mott insulating phases, the extended Hubbard model exhibits a new -induced CO phase. The corresponding phase boundary (shown by filled circles) separates the parameter space where symmetry is broken and the checkerboard arrangement of electrons with nonequivalent electron density on two sub-lattices and is energetically favorable. The values of at which the system favors charge ordering increases with increasing local interactions . The DCA-determined phase boundary for the CO phase transition (obtained from the staggered density ) is found to be higher than the mean-field prediction Bari (1971)(shown by the dashed line).
Our results for the phase diagram and the trends in behavior of the phase boundaries are in agreement with the results obtained by other methods for the 2D extended Hubbard model, including ED, Medvedeva et al. (2017) EDMFT-based, Sun and Kotliar (2002); Huang et al. (2014); Ayral et al. (2013) and DB van Loon et al. (2014) methods. In particular, the previous studies also find that the Mott metal-insulator crossover line at finite has a positive slope, indicating that the crossover occurs at larger values of . Hansmann et al. (2013) In addition, Refs. Sun and Kotliar, 2002; Huang et al., 2014; Ayral et al., 2013; van Loon et al., 2014; Medvedeva et al., 2017 also find that the CO boundary is above the mean field solution. The major difference with our findings is metal-insulator Mott crossover boundary position. We find smaller values of compared to the methods where EDMFT is a starting point. This discrepancy is due to the DMFT starting point that substantially overestimates the critical value of for the Mott transition. The inset of Fig. 4 shows a comparison between DCA and EDMFT Medvedeva et al. (2017). We note that the DCA cluster has only two distinct nearest neighbors (the one to the left is identical to the one to the right), and we therefore plot data for with for DCA and for EDMFT. Finite size effects of this system are analyzed in. Terletska et al. (2017) In addition to the agreement with EDMFT (after rescaling of ), we find that the DCA Mott transition line remains substantially below the one from EDMFT, and that the slope of the Mott line becomes much less steep, indicating a much larger regime where suppresses the Mott transition.
a) Metal to Mott insulator crossover boundary: -induced effects
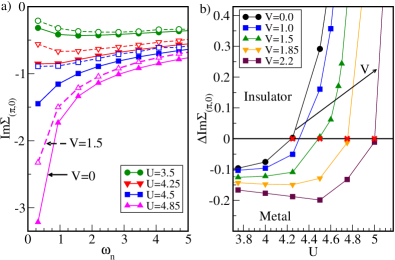
In this subsection, we examine more closely the effect of on the driven metal to Mott insulator crossover boundary (shown by red open symbols in Fig. 4). In low-dimensional systems, large screening contributions from non-local interactions have been postulated. Hansmann et al. (2013); Huang et al. (2014); Ayral et al. (2013) In fact, non-local Coulomb interactions can dramatically reduce the effective on-site interactions, Schüler et al. (2013) and therefore stabilize the metallic behavior against the transition to a Mott insulator. To demonstrate this, we now examine in detail how the finite non-local interactions affect the position of the metal to Mott insulator crossover boundary of Fig. 4. The position of this crossover line is determined by the same procedure we used for Hubbard model. The crossover points are determined from the change in sign of as increases, with for a metal, and for an insulator. First, to demonstrate the effect of on the self-energy, we plot in Fig. 5-a) as a function of Matsubara frequency for several values of at (filled symbols) and (open symbols). As seen from Fig. 5-a), as increases, the self-energy increases and changes behavior from metal-like () to insulator-like (U=4.5, 4.85). The metal to Mott insulator crossover occurs at . However, the corresponding self-energy at finite (shown by open symbols, dashed lines) is smaller compared to . Consequently, at finite the crossover from the metal to insulator boundary of the 2D extended Hubbard model is pushed to larger . This is also seen in Fig. 5-b), where we plot as function of for several values of . We see that the critical value of for which the crossover occurs increases with increasing values of the non-local interaction .
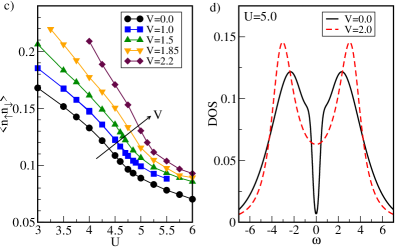
The induced screening effects can also be detected in other quantities. In Fig. 5-c) we plot the -evolution of the double occupancy for increasing values of . The inter-site interactions favor the increase of the double occupancy at a given site. As a result, it then requires larger values of to suppress the double occupancy to localize electrons in the Mott insulating phase. Finally, the non-local interaction driven metallicity near the Mott transition is also observed in Fig. 5-d). Here, for comparison we plot the density of state (DOS) versus frequency for and at . We used the Pade approximation to perform the analytical continuation. Fig. 5-d) shows that the insulating gap at the Fermi energy gets filled up at finite , and the system becomes more metallic.
In the following, we demonstrate how non-local Coulomb interactions affect the correlations and screening in the extended Hubbard model. Ref. Schüler et al., 2013, using a variational principle, mapped the generalized extended Hubbard model with non-local Coulomb interactions onto an effective Hubbard model with on-site interactions being reduced according to , where is a weighted average of non-local interactions. Using this approximation, this work found that non-local Coulomb interactions, in general, can significantly weaken the local interaction effects in various low-dimensional sp-electron materials in a wide range of doping. Schüler et al. (2013) In particular, it has been shown that in graphene, benzene and silicene, the non-local interactions -induced screening effects decrease the effective local interactions by more than factor of two, which in turn leads to stabilization of the metallic-like phase against the gapped (spin-liquid or anti-ferromagnetic Mott) insulating phases in these materials.
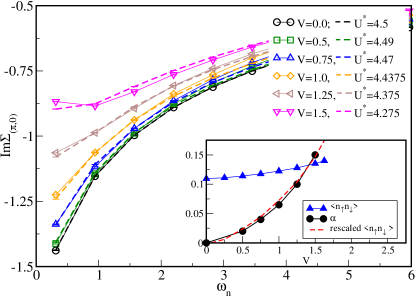
In Fig. 6, we explore this behavior and demonstrate the -induced screening in the 2D half-filled extended Hubbard model. For this we focus on the non-local interaction effects on the Mott insulating phase at . First, we plot the imaginary part of the self-energy as a function of Matsubara frequency for different values of the non-local interaction (open symbols). We find that gradually reduces the self-energy, corresponding to a decrease in correlation effects. As increases, the system gradually becomes less insulating due to -induced screening effects. To demonstrate further that the non-local interaction effectively reduces the local interaction , we plot in Fig. 6 the corresponding DCA data for . Here is estimated by fitting the finite results for the self-energy with corresponding self-energy data obtained from Hubbard model with . Comparing the finite data with the data for the self-energy in Fig. 6, we see that the self-energy of the extended Hubbard model with finite (we limit our analysis to below the CO phase) is well-described by the results of a Hubbard model with only local interaction . We find that the effective decreases with increasing . In particular, the data shows that the non-local interaction significantly weakens the effective local interaction, according to , where is a renormalized pre-factor for . It was shown in Ref. Schüler et al. (2013) that the renormalization of the inter-site interactions can be modeled by the pre-factor related to the density-density correlation function. We analyze the dependence of the renormalized pre-factor , extracting it directly from our estimates as . As shown in the inset of Fig. 6, we find that and the double occupancy at a given site both increase with in a similar way (our best-fits indicate quadratic behavior with , with , and , respectively). To highlight a similar dependence of these quantities, we also show the rescaled double occupancy data (red dashed line) obtained as , with the parameters being determined from the above quadratic-fits of the original data.
b) Charge order phase boundary and effect of on self-energy
Now we focus on the CO phase boundary (Fig. 4) as a function of at fixed values of and . The induced CO transition is characterized by a checkerboard arrangement of electrons on the cluster sites and, hence, can be detected by a staggered density, , calculated in the DCA as follows:
| (4) |
The staggered electron density describes the difference between the occupancies on the two sub-lattices and and serves as a natural order parameter for the CO phase transition, i.e., in the uniform phase, and for the charge ordered phase.
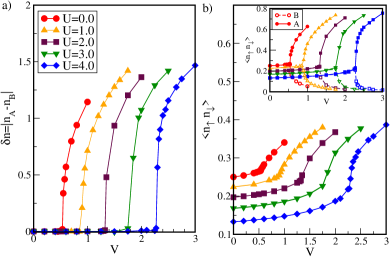
In Fig. 7 , we show the order parameter as a function of at fixed values of at fixed temperature obtained with site cluster DCA. At fixed , increasing the non-local interaction eventually results in CO as signalled by a non-zero staggered density . For larger values of , the critical values of at which the transition to the CO phase occurs, increase as well. This results in the positive slope of the CO boundaries of Fig. 4.
Similarly, the CO can be detected from the double occupancy shown in Fig. 7 . Notice, that in contrast to the driven Mott transition (see Fig. 3-b), where the double occupancy is suppressed with ), the CO transition is characterized by an overall increase of the double occupancy as increases at fixed . In the inset of Fig. 7 , we also show the dependence of for sub-lattices and . At fixed for below the CO transition, the double occupancies on sub-lattices and are identical. Once the CO is established, the double occupancy on the two sub-lattices become different.
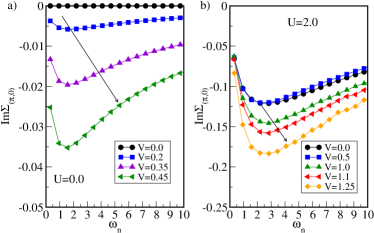
In order to further study the effects of the charge fluctuations on the single-particle dynamics, in Fig. 8 we consider the effect of the inter-site interaction on the self-energy for different values of corresponding to a good metal, correlated metal, and the Mott insulator regimes. Here we plot the evolution of the imaginary part of the self-energy as a function of Matsubara frequency for . The values of are chosen below the CO transition boundary. We begin with Fig. 8 a) and b) for and , respectively. In this case we find that as grows, increases and remains metallic. For this parameter regime, the effect of becomes very similar to the increase of the effective local interactions by . A similar increase in the self-energy with for small values of has been observed in Ref. Wu and Tremblay, 2014, where for small values of the Fermi liquid behavior persisted with increasing values of . In Fig. 8 and , we show the results for larger values of and , corresponding to the correlated metal and the Mott insulator, respectively. As increases, the magnitude of the self-energy decreases, indicating that the system becomes less insulating as a result of the screening effect of . A similar screening effect and decrease in correlations in the presence of has been also observed in other studies of extended Hubbard models. Wu and Tremblay (2014); Ayral et al. (2013); Chitra and Kotliar (2000)
c) -induced CO insulator to Metal to Mott-insulator transitions
So far we have mainly focused on the correlation induced electron localization driven either by the non-local interaction in the CO phase, or by the local interaction in the Mott insulating case. In this subsection, we will compare these two insulating phases, and we will show that correlations can also act to induce metallic behavior.
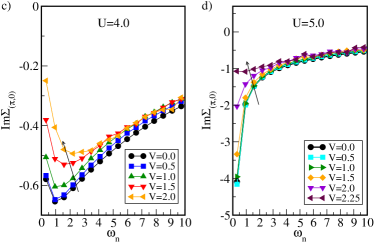
In Fig. 9 we illustrate the correlation induced metallic behavior for the -driven CO to metal, and metal to Mott insulator transitions at fixed . In the left panel of Fig. 9 we show the evolution of the DOS as the strength of changes at fixed . The DOS is obtained via analytical continuation of using the Pade approximation. The data demonstrates how evolves from the CO insulator to metal and the Mott insulator behavior with increasing values of . At the system is in a CO insulator state with a gap in the DOS (top panel, left column), with the . As increases, the CO gap in the DOS gets narrower, and it closes in the metallic phase (middle panel of the left column) for and . Further increasing to and eventually leads to the Mott insulating behavior with an interaction-driven gap opening in the DOS. Such correlation-driven metallic behavior has been reported to appear in other systems featuring an electron localized insulating phase to start with. This includes systems on bipartite lattices with a staggered potential leading to a band-insulator Garg et al. (2006); Wang et al. (2020); Paris et al. (2007) and systems with disorder Lee et al. (2016); Lombardo et al. (2006).
The corresponding Pade input data on the Matsubara axis for the imaginary part of the local Green’s function are shown in the right column of Fig. 9 (b-panel). For both the CO and Mott insulators, is small and turns towards zero for consistent with the gap opening in the DOS. For the metallic case, remains finite for , indicating a finite quasiparticle weight at the Fermi energy.
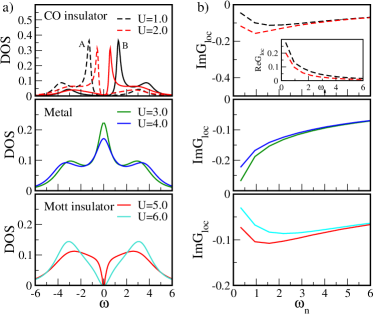
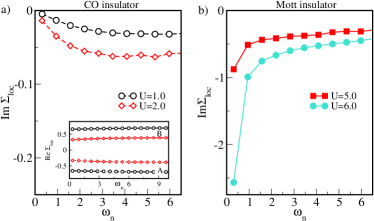
To further compare the CO insulator and the Mott insulator, in Fig. 10 we show the Matsubara axis data for the imaginary part of the local self-energy , which is a measure of the strength of correlations. The corresponding data for the local Green’s function are shown in Fig. 9-b). For the CO phase (Fig. 10-a), indicates that the band gap opening is due to the large (shown in inset of Fig. 10-a), and the CO behaves as a weakly correlated band-insulator. In contrast, for the Mott insulator at large (Fig. 10-b) panel), while (not shown), the imaginary part, , is large (indicating an increased scattering rate and stronger correlations) and turns towards . These results clearly show the difference in the nature of the insulating CO and Mott states, characterizing the former as a band insulator and the latter as a correlation-driven Mott insulator.
IV Conclusions
In conclusion, using DCA on a cluster, we have performed a comprehensive study of the effects of non-local correlations and interactions on the metal-insulator transitions in a 2D half-filled extended Hubbard model. We have done an analysis of the phase diagrams and the related properties for both the paramagnetic Hubbard model and the finite extended Hubbard model. At , we have constructed the phase diagram, where we compare the DMFT, DCA, and CDMFT results. We have demonstrated that in the 2D Hubbard model, the non-local correlations beyond DMFT are important; they suppress the coexistence region and significantly reduce the critical at which the transition happens, and the critical temperature below which the first-order transition occurs.
For the finite case, we used the DCA formalism for an extended unit cell, and constructed the phase diagram for a 2D extended Hubbard model at . Exploring the effects on the Mott metal-insulator crossover, we have shown that a finite nearest-neighbor interaction pushes the Mott metal-insulator crossover boundary to larger values. We have also demonstrated that in addition to the -driven Mott localization of electrons, non-local interactions can also localize electrons via CO. We have presented a careful study of the and dependence of the order parameter, the double occupancy, self-energy and density of states. We have also shown that non-local interactions can have different effects on the self-energy behavior, depending on the values of the local interaction . At larger values of , the non-local interaction introduces strong screening effects with the system becoming more metallic and the self-energy mimicking the behavior of the standard -only Hubbard model with a reduced effective local on-site interaction.
To further highlight the emergence of competing states as a function of correlations and in the extended Hubbard model, we have demonstrated that in addition to localization, the electron interaction can lead to a metallic phase between the Mott and CO insulating states. Such a behavior has been argued to appear in other bipartite lattices with band-insulating phases as well as in systems with disorder. Garg et al. (2006); Wang et al. (2020); Paris et al. (2007); Lee et al. (2016); Lombardo et al. (2006)
Finally, comparing the and -induced localization of electrons, we have shown that unlike the Mott transition, the CO transition is associated with an increase of the double occupancy and a suppression of the self-energy. The gap in the charge ordered phase is not associated with strong correlation effects, but rather with a large real part of the self-energy consistent with a band-insulator.
Acknowledgements.
This work used the Extreme Science and Engineering Discovery Environment (XSEDE), which is supported by National Science Foundation grant number ACI-1548562, through allocation DMR130036. The analysis of the results was partially conducted at the Center for Nanophase Materials Sciences, which is a DOE Office of Science User Facility. HT is supported by the National Science Foundation under Grant No. DMR-1944974. EG acknowledges NSF DMR 2001465. SI is sponsored by the Simons Foundation via the Simons collaboration on many-electron problem.References
- Mott (1968) N. F. Mott, Rev. Mod. Phys. 40, 677 (1968).
- Imada et al. (1998) M. Imada, A. Fujimori, and Y. Tokura, Rev. Mod. Phys. 70, 1039 (1998).
- Dagotto (2005) E. Dagotto, Science 309, 257 (2005).
- Dagotto (1994) E. Dagotto, Rev. Mod. Phys. 66, 763 (1994).
- Basov et al. (2017) D. N. Basov, R. D. Averitt, and D. Hsieh, Nature Materials 16, 1077 (2017).
- Anderson (1987) P. W. Anderson, Science 235, 1196 (1987).
- Jördens et al. (2008) R. Jördens, N. Strohmaier, K. Günter, H. Moritz, and T. Esslinger, Nature 455, 204 (2008).
- Hubbard and Flowers (1963) J. Hubbard and B. H. Flowers, Proceedings of the Royal Society of London. Series A. Mathematical and Physical Sciences 276, 238 (1963).
- Qin et al. (2021) M. Qin, T. Schäfer, S. Andergassen, P. Corboz, and E. Gull, arXiv: 2104.00064 (2021).
- Arovas et al. (2021) D. P. Arovas, E. Berg, S. Kivelson, and S. Raghu, arXiv: 2103.12097 (2021).
- Schüler et al. (2013) M. Schüler, M. Rösner, T. O. Wehling, A. I. Lichtenstein, and M. I. Katsnelson, Phys. Rev. Lett. 111, 036601 (2013).
- Hansmann et al. (2013) P. Hansmann, T. Ayral, L. Vaugier, P. Werner, and S. Biermann, Phys. Rev. Lett. 110, 166401 (2013).
- Wehling et al. (2011) T. O. Wehling, E. Şaşıoğlu, C. Friedrich, A. I. Lichtenstein, M. I. Katsnelson, and S. Blügel, Phys. Rev. Lett. 106, 236805 (2011).
- Kotov et al. (2012) V. N. Kotov, B. Uchoa, V. M. Pereira, F. Guinea, and A. H. Castro Neto, Rev. Mod. Phys. 84, 1067 (2012).
- Seo (2000) H. Seo, Journal of the Physical Society of Japan 69, 805 (2000).
- Hotta (2012) C. Hotta, Crystals 2, 1155 (2012).
- Dressel and Drichko (2004) M. Dressel and N. Drichko, Chemical Reviews, Chemical Reviews 104, 5689 (2004).
- Jérome (2004) D. Jérome, Chemical Reviews 104, 5565 (2004).
- Merino and McKenzie (2001) J. Merino and R. H. McKenzie, Phys. Rev. Lett. 87, 237002 (2001).
- Jérome (1991) D. Jérome, Science 252, 1509 (1991).
- Shibata et al. (2001) Y. Shibata, S. Nishimoto, and Y. Ohta, Phys. Rev. B 64, 235107 (2001).
- Friend et al. (1999) R. H. Friend, R. W. Gymer, A. B. Holmes, J. H. Burroughes, R. N. Marks, C. Taliani, D. D. C. Bradley, D. A. D. Santos, J. L. Brédas, M. Lögdlund, and W. R. Salaneck, Nature 397, 121 (1999).
- Ayral et al. (2013) T. Ayral, S. Biermann, and P. Werner, Phys. Rev. B 87, 125149 (2013).
- Zhang and Callaway (1989) Y. Zhang and J. Callaway, Phys. Rev. B 39, 9397 (1989).
- van Dongen (1994) P. G. J. van Dongen, Phys. Rev. B 50, 14016 (1994).
- Callaway et al. (1990) J. Callaway, D. P. Chen, D. G. Kanhere, and Q. Li, Phys. Rev. B 42, 465 (1990).
- LeBlanc et al. (2015) J. P. F. LeBlanc, A. E. Antipov, F. Becca, I. W. Bulik, G. K.-L. Chan, C.-M. Chung, Y. Deng, M. Ferrero, T. M. Henderson, C. A. Jiménez-Hoyos, E. Kozik, X.-W. Liu, A. J. Millis, N. V. Prokof’ev, M. Qin, G. E. Scuseria, H. Shi, B. V. Svistunov, L. F. Tocchio, I. S. Tupitsyn, S. R. White, S. Zhang, B.-X. Zheng, Z. Zhu, and E. Gull (Simons Collaboration on the Many-Electron Problem), Phys. Rev. X 5, 041041 (2015).
- Metzner and Vollhardt (1989) W. Metzner and D. Vollhardt, Phys. Rev. Lett. 62, 324 (1989).
- Georges et al. (1996) A. Georges, G. Kotliar, W. Krauth, and M. J. Rozenberg, Rev. Mod. Phys. 68, 13 (1996).
- (30) D. Vollhardt, “Dynamical mean-field theory of strongly correlated electron systems,” in Proceedings of the International Conference on Strongly Correlated Electron Systems (SCES2019).
- Maier et al. (2005) T. Maier, M. Jarrell, T. Pruschke, and M. H. Hettler, Rev. Mod. Phys. 77, 1027 (2005).
- Kotliar et al. (2001) G. Kotliar, S. Y. Savrasov, G. Pálsson, and G. Biroli, Phys. Rev. Lett. 87, 186401 (2001).
- Rohringer et al. (2018) G. Rohringer, H. Hafermann, A. Toschi, A. A. Katanin, A. E. Antipov, M. I. Katsnelson, A. I. Lichtenstein, A. N. Rubtsov, and K. Held, Rev. Mod. Phys. 90, 025003 (2018).
- Rubtsov et al. (2008) A. N. Rubtsov, M. I. Katsnelson, and A. I. Lichtenstein, Phys. Rev. B 77, 033101 (2008).
- Rubtsov et al. (2009) A. N. Rubtsov, M. I. Katsnelson, A. I. Lichtenstein, and A. Georges, Phys. Rev. B 79, 045133 (2009).
- Hafermann et al. (2009) H. Hafermann, G. Li, A. N. Rubtsov, M. I. Katsnelson, A. I. Lichtenstein, and H. Monien, Phys. Rev. Lett. 102, 206401 (2009).
- Toschi et al. (2007) A. Toschi, A. A. Katanin, and K. Held, Phys. Rev. B 75, 045118 (2007).
- Rohringer et al. (2013) G. Rohringer, A. Toschi, H. Hafermann, K. Held, V. I. Anisimov, and A. A. Katanin, Phys. Rev. B 88, 115112 (2013).
- Ayral and Parcollet (2015) T. Ayral and O. Parcollet, Phys. Rev. B 92, 115109 (2015).
- Ayral and Parcollet (2016) T. Ayral and O. Parcollet, Phys. Rev. B 93, 235124 (2016).
- Stepanov et al. (2019) E. A. Stepanov, V. Harkov, and A. I. Lichtenstein, Phys. Rev. B 100, 205115 (2019).
- Chitra and Kotliar (2000) R. Chitra and G. Kotliar, Phys. Rev. Lett. 84, 3678 (2000).
- Sun and Kotliar (2002) P. Sun and G. Kotliar, Phys. Rev. B 66, 085120 (2002).
- Camjayi et al. (2008) A. Camjayi, K. Haule, V. Dobrosavljevic, and G. Kotliar, Nature Physics 4 (2008), 10.1038/nphys1106.
- Amaricci et al. (2010) A. Amaricci, A. Camjayi, K. Haule, G. Kotliar, D. Tanasković, and V. Dobrosavljević, Phys. Rev. B 82, 155102 (2010).
- Kapcia et al. (2017) K. J. Kapcia, S. Robaszkiewicz, M. Capone, and A. Amaricci, Phys. Rev. B 95, 125112 (2017).
- Ayral et al. (2012) T. Ayral, P. Werner, and S. Biermann, Phys. Rev. Lett. 109, 226401 (2012).
- Huang et al. (2014) L. Huang, T. Ayral, S. Biermann, and P. Werner, Phys. Rev. B 90, 195114 (2014).
- Rubtsov et al. (2012) A. Rubtsov, M. Katsnelson, and A. Lichtenstein, Annals of Physics 327, 1320 (2012).
- van Loon et al. (2014) E. G. C. P. van Loon, A. I. Lichtenstein, M. I. Katsnelson, O. Parcollet, and H. Hafermann, Phys. Rev. B 90, 235135 (2014).
- Stepanov et al. (2016) E. A. Stepanov, E. G. C. P. van Loon, A. A. Katanin, A. I. Lichtenstein, M. I. Katsnelson, and A. N. Rubtsov, Phys. Rev. B 93, 045107 (2016).
- Peters et al. (2019) L. Peters, E. G. C. P. van Loon, A. N. Rubtsov, A. I. Lichtenstein, M. I. Katsnelson, and E. A. Stepanov, Phys. Rev. B 100, 165128 (2019).
- Vandelli et al. (2020) M. Vandelli, V. Harkov, E. A. Stepanov, J. Gukelberger, E. Kozik, A. Rubio, and A. I. Lichtenstein, Phys. Rev. B 102, 195109 (2020).
- Merino (2007) J. Merino, Phys. Rev. Lett. 99, 036404 (2007).
- Terletska et al. (2017) H. Terletska, T. Chen, and E. Gull, Phys. Rev. B 95, 115149 (2017).
- Wu and Tremblay (2014) W. Wu and A.-M. S. Tremblay, Phys. Rev. B 89, 205128 (2014).
- Jiang et al. (2018) M. Jiang, U. R. Hähner, T. C. Schulthess, and T. A. Maier, Phys. Rev. B 97, 184507 (2018).
- Arita et al. (2004) R. Arita, S. Onari, K. Kuroki, and H. Aoki, Phys. Rev. Lett. 92, 247006 (2004).
- Terletska et al. (2018) H. Terletska, T. Chen, J. Paki, and E. Gull, Phys. Rev. B 97, 115117 (2018).
- Paki et al. (2019) J. Paki, H. Terletska, S. Iskakov, and E. Gull, Phys. Rev. B 99, 245146 (2019).
- Bari (1971) R. A. Bari, Phys. Rev. B 3, 2662 (1971).
- Aichhorn et al. (2004) M. Aichhorn, H. G. Evertz, W. von der Linden, and M. Potthoff, Phys. Rev. B 70, 235107 (2004).
- Davoudi and Tremblay (2007) B. Davoudi and A.-M. S. Tremblay, Phys. Rev. B 76, 085115 (2007).
- Bolech et al. (2003) C. J. Bolech, S. S. Kancharla, and G. Kotliar, Phys. Rev. B 67, 075110 (2003).
- Gull et al. (2008a) E. Gull, P. Werner, O. Parcollet, and M. Troyer, EPL (Europhysics Letters) 82, 57003 (2008a).
- Fuchs et al. (2011) S. Fuchs, E. Gull, L. Pollet, E. Burovski, E. Kozik, T. Pruschke, and M. Troyer, Phys. Rev. Lett. 106, 030401 (2011).
- Walsh et al. (2019) C. Walsh, P. Sémon, D. Poulin, G. Sordi, and A.-M. S. Tremblay, Phys. Rev. B 99, 075122 (2019).
- Rozenberg et al. (1995) M. J. Rozenberg, G. Kotliar, H. Kajueter, G. A. Thomas, D. H. Rapkine, J. M. Honig, and P. Metcalf, Phys. Rev. Lett. 75, 105 (1995).
- Terletska et al. (2011) H. Terletska, J. Vučičević, D. Tanasković, and V. Dobrosavljević, Phys. Rev. Lett. 107, 026401 (2011).
- Vučičević et al. (2013) J. Vučičević, H. Terletska, D. Tanasković, and V. Dobrosavljević, Phys. Rev. B 88, 075143 (2013).
- Vučičević et al. (2015) J. Vučičević, D. Tanasković, M. J. Rozenberg, and V. Dobrosavljević, Phys. Rev. Lett. 114, 246402 (2015).
- Sordi et al. (2012) G. Sordi, P. Sémon, K. Haule, and A. M. S. Tremblay, Scientific Reports 2, 547 (2012).
- Park et al. (2008) H. Park, K. Haule, and G. Kotliar, Phys. Rev. Lett. 101, 186403 (2008).
- van Loon et al. (2018) E. G. C. P. van Loon, M. I. Katsnelson, and H. Hafermann, Phys. Rev. B 98, 155117 (2018).
- Schäfer et al. (2015) T. Schäfer, F. Geles, D. Rost, G. Rohringer, E. Arrigoni, K. Held, N. Blümer, M. Aichhorn, and A. Toschi, Phys. Rev. B 91, 125109 (2015).
- Gull et al. (2008b) E. Gull, P. Werner, X. Wang, M. Troyer, and A. J. Millis, EPL (Europhysics Letters) 84, 37009 (2008b).
- Balzer et al. (2009) M. Balzer, B. Kyung, D. Sénéchal, A.-M. S. Tremblay, and M. Potthoff, EPL (Europhysics Letters) 85, 17002 (2009).
- Medvedeva et al. (2017) D. Medvedeva, S. Iskakov, F. Krien, V. V. Mazurenko, and A. I. Lichtenstein, Phys. Rev. B 96, 235149 (2017).
- Garg et al. (2006) A. Garg, H. R. Krishnamurthy, and M. Randeria, Phys. Rev. Lett. 97, 046403 (2006).
- Wang et al. (2020) J. Wang, L. Zhang, R. Ma, Q. Chen, Y. Liang, and T. Ma, Phys. Rev. B 101, 245161 (2020).
- Paris et al. (2007) N. Paris, K. Bouadim, F. Hebert, G. G. Batrouni, and R. T. Scalettar, Phys. Rev. Lett. 98, 046403 (2007).
- Lee et al. (2016) H. Lee, H. O. Jeschke, and R. Valentí, Phys. Rev. B 93, 224203 (2016).
- Lombardo et al. (2006) P. Lombardo, R. Hayn, and G. I. Japaridze, Phys. Rev. B 74, 085116 (2006).