Long live the disk: lifetimes of protoplanetary disks in hierarchical triple star systems
and a possible explanation for HD 98800 B
Abstract
The gas dissipation from a protoplanetary disk is one of the key processes affecting planet formation, and it is widely accepted that it happens on timescales of a few million years for disks around single stars. Over the last years, several protoplanetary disks have been discovered in multiple star systems, and despite the complex environment in which they find themselves, some of them seem to be quite old, a situation that may favor planet formation. A clear example of this is the disk around HD 98800 B, a binary in a hierarchical quadruple stellar system, which at a 10 Myr age seems to still be holding significant amounts of gas. Here we present a 1D+1D model to compute the vertical structure and gas evolution of circumbinary disks in hierarchical triple star systems considering different stellar and disk parameters.
We show that tidal torques due to the inner binary together with the truncation of the disk due to the external companion strongly reduce the viscous accretion and expansion of the disk. Even allowing viscous accretion by tidal streams, disks in these kind of environments can survive for more than 10 Myr, depending on their properties, with photoevaporation being the main gas dissipation mechanism. We particularly apply our model to the circumbinary disk around HD 98800 B and confirm that its longevity, along with the current non-existence of a disk around the companion binary HD 98800 A, can be explained with our model and by this mechanism.
1 Introduction
Stellar multiplicity is the most common outcome of star formation (Duchêne & Kraus, 2013; Bate, 2018) and it has been shown that the younger a stellar object is, the greater the probability that is part of a multiple stellar system (Reipurth et al., 2014; Tobin et al., 2016).
As a by-product of their formation, young stellar objects are surrounded by disks of gas and dust called protoplanetary disks, in where planet formation begins. Since the spectacular image of HL Tau (ALMA Partnership et al., 2015) more than five years ago, the number of resolved disks around stellar objects of different kinds and ages has grown significantly. But protoplanetary disks have been found not only around single stars. Several surveys discovered many of them in binaries and even in higher multiplicity star systems (Correia et al., 2006; Cox et al., 2017; Cieza et al., 2019; Manara et al., 2019; Akeson et al., 2019; Zurlo et al., 2020).
Some of the most recent and spectacular examples are the “cosmic pretzel” disk around the young [BHB2007] 11 binary system (Alves et al., 2019), the old polar circumbinary disk in the hierarchical quadruple star system HD 98800 (Kennedy et al., 2019), and the spectacular disks imaged in the triple-star system GW Orionis (Kraus et al., 2020).
The evolution and lifetimes of disks in binary or multiple star systems are quite different from those of a protoplanetary disk around a single star. Circumbinary disks in close-in binaries are especially affected in the inner regions, which are cleared out as a competition between the torques exerted by the inner binary that push the disk farther out, and the viscous evolution trying to close this cavity (Artymowicz & Lubow, 1994, 1996; del Valle & Escala, 2012). The size of the cavity is estimated to be between 2 and 5 times the inner binary separation, increasing with the binary eccentricity (Artymowicz & Lubow, 1994; Thun et al., 2017; Hirsh et al., 2020; Ragusa et al., 2020).
On the other hand, circumstellar disks orbiting only one of the stars in a binary system, are truncated by the tidal effect produced by the outer star (Artymowicz & Lubow, 1994). This truncation imposes a zero-flux edge condition at a distance from the central star estimated to be a function of the mass ratio and separation of the binary (Papaloizou & Pringle, 1977; Pichardo et al., 2005).
For circumstellar disks, a mechanism that significantly contributes to a faster disk dispersal is photoevaporation. This phenomenon is produced by the central star (Alexander et al., 2006; Gorti et al., 2009) but also from possible external sources if the environment presents OB stars (Clarke, 2007; Anderson et al., 2013; Winter et al., 2020), or the star suffers close encounters (Winter et al., 2018). The resulting circumstellar disk lifetimes are tipically below 10 Myr (Fedele et al., 2010; Pfalzner et al., 2014). These effects also influence disk evolution in multiple stellar systems. In particular, circumbinary disks are expected to live longer than circumstellar disks (Alexander, 2012), but truncated circumstellar disks in wide binaries could dissipate faster (Cieza et al., 2009; Kraus et al., 2012). In this context, two questions are still under debate: i) how does photoevaporation affect disc evolution in hierarchical triple stellar systems, and ii) how do the above-mentioned processes affect planet formation altogether?
Despite the complex dynamical environment where disks in binaries and triples form and evolve, planets can still form in them (Marzari & Thebault, 2019). Indeed, more than 150 exoplanets have been discovered around binary star systems and more than 30 in multiple star systems of different kinds (Schwarz et al., 2016). Moreover, it has also been suggested that the frequency of planets in binary systems, particularly gas giants, can be as high as around single stars, except in the case of very close-in binaries (Martin, 2018; Bonavita & Desidera, 2020).
Hydrodynamical simulations play a key role in modeling with great detail the gas and dust evolution in protoplanetary disks. However, the high computational cost that these type of simulations require makes not yet feasible to follow the whole disk evolution. For the moment, and despite their simplifications, 1D models close this gap, allowing us to study the evolution of protoplanetary disks until they completely dissipate.
In this work we focus on describing the time evolution of protoplanetary disks in hierarchical triple star systems with a new 1D+1D model that considers viscous accretion, irradiation and X-ray photoevaporation from the inner binary. Our general aim is to compare their evolution with their circumbinary counterparts, and determine their global characteristics and dissipation timescales, for different stellar parameters.
A specific goal of this work is to understand the longevity of disks in hierarchical stellar systems. We then apply our model to the particular case of the disk in the hierarchical quadruple star system HD 98800, which constitutes the ideal astrophysical testbed to do it, as it is uncertain how a nearly 10 Myr old disk still has significant amounts of gas (Ribas et al., 2018).
This paper is organized as follows. In sec. 2 we describe our model for the evolution of disks in triple star systems. We then define our general setup of initial conditions in sec. 3. We describe our general results in sec 4 including a comparison between triple-star and binary-star disk evolution in sec. 4.1, and a description of the stellar parameters dependency in sec. 4.2. In sec. 5 we describe the particular case of the system HD 98800, and apply our model to the disk around HD 98800 B. We present a discussion in sec. 6 and conclude with some key aspects of our findings in sec. 7.
2 Model for the gas disk evolution in a hierarchical triple star system
Here we present PLANETALP-B, a 1D+1D code that computes the time evolution of a gaseous disk in a hierarchical triple star system. PLANETALP-B is an extension of our code PLANETALP (Ronco et al., 2017; Guilera et al., 2017, 2019, 2020; Venturini et al., 2020a, b), a global model of disk evolution and planet formation that computes the growth of planets immersed in a circumstellar protoplanetary disk that evolves in time. This first version of PLANETALP-B, which can also be applied for the study of circumbinary disks and circumstellar disks around one of the stars in a wide binary star system, only focuses on their gaseous component evolution.
2.1 The vertical disk structure
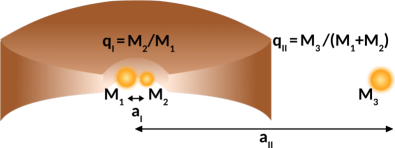
Our subject of study is a disk in a hierarchical triple star system, this is, a circumbinary disk affected by an external stellar companion. Figure 1 shows an schematic view of this configuration which, due to the axi-symmetrical nature of our model, will always consider circular and coplanar orbits for the inner binary, the circumbinary disk and the outer stellar companion. Moreover, despite the disk being subject to a time dependent gravitational potential due to the stellar orbital motions, we consider the disk to be rotating in a gravitational potential given by the total mass of the inner binary system, and neglecting the gravitational perturbations of the external companion. We will discuss the limitations of these considerations in sec. 6.
To compute the vertical structure of a disk in this environment we assume an axi-symmetric, irradiated disk in hydrostatic equilibrium. We follow Guilera et al. (2017, 2019, 2020) which use the same methodology described in Alibert et al. (2005); Migaszewski (2015) for a circumstellar case, but considering extra tidal heating terms in the energy equation due to the effects of the inner binary and the external companion (Lodato et al., 2009; Fontecilla et al., 2019). The complete set of equations is given by:
| (1) | |||||
| (2) | |||||
| (3) |
where , , , and represent the pressure, density, radiative heat flux, temperature and vertical coordinate of the disk, respectively. is the viscosity (Shakura & Sunyaev, 1973), where is a dimensionless parameter, is the square of the locally isothermal sound speed, is the Keplerian frequency at a given radial distance from the central binary, and is its mass. We consider that the heat in the circumbinary disk is vertically transported by radiation or convection following the standard Schwarzschild criterion, as described in Guilera et al. (2019).
The terms and in eq. 2 represent the tidal heating dissipated in the form of radiation due to the inner binary and the outer stellar companion, respectively. is the Keplerian frequency at the inner binary separation, , given by , and is the Keplerian frequency at the separation between the inner binary system and the external companion star, , computed as , where , the total mass of the stellar system.
The quantities and represent the torques due to the inner binary and outer stellar companion, respectively. The classical expression for proposed by Armitage & Natarajan (2002)111For a detailed discussion on this prescription we refer the reader to Petrovich & Rafikov (2012); Rafikov & Petrovich (2012); Rafikov (2016). for could be overestimating the tidal torque contribution on the disks outside the Lindblad resonances, which may modify the surface density profiles (Tazzari & Lodato, 2015). Thus, following Tazzari & Lodato (2015); Fontecilla et al. (2019) we consider an exponential cutoff for the tidal torques outside this region, computed as:
| (4) | |||||
| (5) |
where is a dimensionless normalization parameter that can adopt different values between 0.001 and 1, (Armitage & Natarajan, 2002; Alexander, 2012; Vartanyan et al., 2016; Shadmehri et al., 2018).
The variable represents the mass ratio between and , and the mass ratio between and . Finally, and ,
with the Hill radius of the secondary star in the binary system, is the Hill radius of the third star and is the height scale of the disk. As in Fontecilla et al. (2019) we consider and being the radii of the outermost and innermost Lindblad resonances, and and being the widths of the Gaussian smoothing.
Note that, if the case of study is that of a circumstellar disk, , while if it is a circumbinary disk, only , and if it is a circumstellar disk affected by an external star companion, only .
The boundary conditions at the surface of the disk , , , , considering the effects of the inner binary and outer star, are given by
| (6) | |||||
| (7) | |||||
| (8) | |||||
where is the optical depth, K is the background temperature, and is the equilibrium accretion rate. In addition to the surface boundary conditions, due to symmetry we consider that the heat flux in the midplane of the disk should be .
Since we now have an inner binary system, the temperature associated with the stellar irradiation is considered as
| (9) |
i.e. we are adding up the fluxes due to each star, making the approximation that both are located at their centre of mass, where
| (10) | |||||
and and are the radius and effective temperature of the primary () and the secondary () star of the inner binary system. is the radial coordinate, and . The individual stellar masses, with their corresponding stellar radii and temperatures, are obtained from Baraffe et al. (2015). Note here that our model does not consider the possible effect of self-shadowing if the disk becomes non-flared nor the possible irradiation from the third star.
Eq. 1 to 3 of the vertical structure are computed using a shooting method with a Runge-Kutta-Fehlberg integrator, while eq. 6 to eq. 8 are solved by a multidimensional Newton-Raphson algorithm. Solving these equations allows us to obtain the mean viscosity , where is the gas surface density, required to solve the radial evolution of the disk.
It is worth noting that the detailed computation of the vertical structure and the thermodynamical quantities of circumbinary disks in hierarchical triple star systems can be particularly useful for future transfer radiative calculations.
2.2 Time evolution of the radial disk structure
In order to compute the time evolution of the gas surface density, we solve the classical 1D diffusion equation (Pringle, 1981) including the terms corresponding to the torques injected by the binaries, already described in the previous subsection,
| (11) |
where is the temporal coordinate, the mean viscosity at the mid-plane of the disk, the gas surface density and the sink term due to the X-ray photoevaporation. The latter is computed following the analytical prescriptions derived by Owen et al. (2012) from radiation-hydrodynamic models (Owen et al., 2011, 2012). The total mass loss rate depends on the X-ray luminosity of the central star, which in our case is actually a binary. Therefore, we use
| (12) |
where and are the X-ray luminosities of the stars of the inner binary system, which can be computed following Preibisch et al. (2005),
| log | (13) | ||||
who derived this correlation between X-ray luminosity and stellar mass for young () low-mass stars . Then, as described in Appendix B of Owen et al. (2012), for primordial disks (or disks without holes) the total mass-loss rate is given by
| (14) | |||||
while for disks with holes or transition disks is given by
| (15) | |||||
These approximations were derived for circumstellar disks which can present both kinds of morphologies at different epochs. However, circumbinary disks always present inner cavities and thus, we only compute the X-ray mass loss rate following eq. 15.
From the normalised radial mass-loss profiles derived by Owen et al. (2012) and presented in their Appendix B, and by computing (from eq. 15 in our case), we can compute that verifies
| (16) |
As in Rosotti & Clarke (2018), we are not considering the possible contribution from the external companion to the photoevaporation rate of the circumbinary disk. The choice to only consider X-ray photoevaporation in our model is due to the fact that this type of irradiation has yielded much higher photoevaporation rates than the EUV rates (Ercolano & Owen, 2010; Owen et al., 2011; Picogna et al., 2019). Moreover, Kunitomo et al. (2021) recently showed that this is the predominant disk dispersal mechanism for low-mass stars (), compared to EUV and FUV photoevaporation (see their Fig. 11).
An important point to mention here is that, in the 1D approach, the form of the eqs. 4 and 5 completely prevents viscous gas accretion onto the stars. However, as shown by Artymowicz & Lubow (1996) and many others (e.g., Cuadra et al., 2009; Dunhill et al., 2015; Tang et al., 2017), accretion onto the stars still happens via tidal streams, a mechanism that can only be captured in 2D and 3D simulations. This mass loss rate is not constant but modulated by the binary orbit. While MacFadyen & Milosavljević (2008) estimated that this accretion could be in average of the one expected in the absence of the binary, D’Orazio et al. (2013); Farris et al. (2014) suggested that it could reach up to 30-60. The results of Ragusa et al. (2016) are in agreement with these previous works when the disk is thick. However, these authors find that it is possible to suppress all mass accretion if the disk becomes sufficiently thin. Due to the uncertainties on the amount of this mass loss, our model allows that a certain fraction of the expected accretion rate is accreted by the inner binary. In a similar way as Alexander (2012) did, we compute the accretion rate as at every radial bin between and (where is the radius of the inner cavity), and adopt the maximum value of in that region, considering it as an upper limit.
The disk radial structure is solved using an implicit Crank-Nicholson method, from to using 2000 radial bins logarithmically equally spaced. We set boundary conditions of zero torque, which is equivalent to having zero density at the boundaries. We note here that the boundary conditions are applied to the radial bins corresponding to and . However, as we show in the next sections, the tidal torques included in the model naturally truncate the disk at different locations. A validation of our 1D+1D model for the case of circumbinary disks is presented in appendix A, comparing our results to those of Vartanyan et al. (2016).
3 Initial Conditions and general Setup
The initial gas surface density profile for our protoplanetary disk is given by
| (17) |
where is the characteristic radius of the disk and the gas surface density exponent. is a normalization parameter that depends on the disk mass.
The inner and outer radii of our circumbinary disk are set initially equal to the star separations, (inner binary) and (outer binary). However, the inner and outer radii of the disk will naturally evolve (expand and contract, respectively) as a consequence of the tidal torques induced by the inner binary and the external star (represented by the term that includes and in eq. 11).
We define a general setup of initial conditions, in where we fix the protoplanetary disk parameters and only vary the stellar ones. As shown in Table 1, we perform simulations for a fixed disk of , with au, ,222These are typical values obtained for circumstellar disks (Andrews et al., 2010) and . Our fiducial simulation (T1) considers (), au, (), and au. We also perform simulations with different (and thus, different and ), different , and different and in order to test the results dependency on these parameters. The total mass of the inner binary system is always set to , so the disk dynamical time is the same for all models.
| Stellar Parameters | Simulation results () | ||||||||||
| Simulation | [] | [] | [au] | [] | [au] | [Myr] | [au] | [au] | |||
| Binary Test Case | B1 | 0.5 | 0.5 | 1 | 0.5 | — | — | — | 4.47 | 1.65 | — |
| Fiducial Case | T1 | 0.5 | 0.5 | 1 | 0.5 | 1 | 1 | 100 | 3.58 | 1.65 | 34.50 |
| dependency | T2 | 0.67 | 0.33 | 0.5 | 0.5 | 1 | 1 | 100 | 3.38 | 1.32 | 34.50 |
| T3 | 0.91 | 0.09 | 0.1 | 0.5 | 1 | 1 | 100 | 2.80 | 0.85 | 34.50 | |
| dependency | T4 | 0.5 | 0.5 | 1 | 0.5 | 0.5 | 0.5 | 100 | 3.80 | 1.65 | 42.30 |
| T5 | 0.5 | 0.5 | 1 | 0.5 | 0.1 | 0.1 | 100 | 4.17 | 1.65 | 63.5 | |
| dependency | T6 | 0.5 | 0.5 | 1 | 1.5 | 1 | 1 | 100 | 3.57 | 4.82 | 34.50 |
| T7 | 0.5 | 0.5 | 1 | 2.5 | 1 | 1 | 100 | 3.38 | 7.85 | 34.50 | |
| dependency | T8 | 0.5 | 0.5 | 1 | 0.5 | 1 | 1 | 500 | 4.35 | 1.65 | 168 |
| T9 | 0.5 | 0.5 | 1 | 0.5 | 1 | 1 | 1000 | 4.36 | 1.65 | 300 | |
4 General Results
In this section we first present the main differences between the disk evolution of our fiducial case in a triple-star system with the same disk in a binary star system, not affected by an external companion. We then describe the results and general characteristics of the simulations of Table 1, where we consider different stellar parameters for triple star systems.
4.1 Disk evolution: triple-star vs close binary-star systems
It has been previously shown that circumbinary disks dissipate at a lower rate than circumstellar disks (Alexander, 2012) However, what happens to disks in triple star systems? To address this question we performed two simulations: our fiducial case T1 (see Table 1), which represents a circumbinary disk in a triple hierarchical system, and B1, which is exactly the same but ignoring the external star, thus, representing an isolated circumbinary disk. We recall that, in terms of our model, the latter is achieved by setting .
4.1.1 Without accretion by tidal streams
In order to focus on how the disk density profile changes with time,
we first do not allow any gas accretion via streams to occur in these simulations. Recall from the end of sec. 2.2 that, in 1D models, the form of the torque given by eq. 4 prevents any mass loss by viscous accretion unless accretion by tidal streams is allowed. Thus, the disk only losses mass by photoevaporation. Since the mass loss rate due to the X-ray photoevaporative winds only depends on the X-ray luminosity of the central object (see eq. 15), and since T1 and B1 systems, have the same disk mass and the same inner stellar pair, the dissipation timescale for both disks is exactly the same. However, the shapes of the density profiles are quite different. In terms of our model, a gas disk has completely dissipated when its mass in our simulations is lower than . If, as in this case, the disk mass only evolves due to X-ray photoevaporation, the dissipation timescale can be directly estimated without the need of performing simulations, by computing in eq. 12 and then in eq. 15. For both B1 and T1, and , thus we obtain yr-1 and both disks dissipate in Myr.
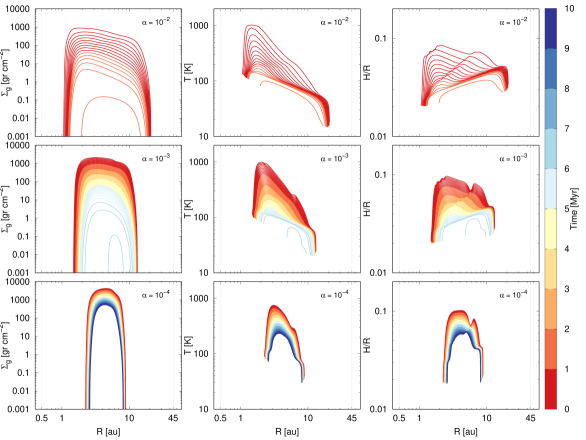
Figure 2 shows the time evolution of the gas surface density (top), temperature (middle) and aspect ratio (bottom) profiles for the disk of our fiducial case (T1) in a hierarchical triple star system (left column) compared to the same disk in a binary system (B1) (right column), and, for both cases, without any mass loss by viscous accretion.
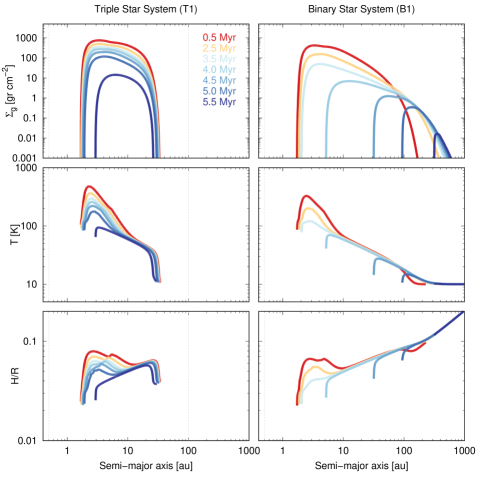
The differences between disk profiles in the triple and binary systems are remarkable. At early times (0.5 Myr of evolution, red profiles), and due to the injection of angular momentum by the inner binary, the inner radius of the gas disk expands, creating an inner cavity of up to au ( as it is expected from previous studies, e.g. Artymowicz & Lubow, 1994) for both cases, while the outer radius presents different values. In T1, the effect of the outer stellar companion located at 100 au, prevents the disk expansion beyond 35 au, which represents and which is in agreement with previous studies (Papaloizou & Pringle, 1977; Pichardo et al., 2005). This situation is different for the circumbinary case, B1, where the disk can freely expand up beyond 100 au. As a natural consequence of this expansion, the maximum value reached by the gas surface density profile is lower than for the one in the triple star system for about a factor of 0.5 and this difference increases with time, although the mass for both cases evolve at the same rate (i.e. each comparable, same color, profile between T1 and B1 presents the same amount of mass).
While the gas density profiles in T1 evolve slowly in a confined region, without significantly changing their shape, in B1 the gas disk is pushed further out generating a growing cavity as a simultaneous consequence of photoevaporation and the disk expansion due to the angular momentum conservation (see Fig. 3 for a comparison between the evolution of the inner cavity sizes). In addition, the gas surface density profiles in B1 decay faster than in T1, thus decreasing the local available mass of gas inside 35 au. As an example, at 4 Myr the gas surface density at 10 au is 10 gr cm-2 for B1 while it is 200 gr cm-2 for T1. This situation could favor gas giant planet formation in triple star systems, in where a protoplanet can spend more time embedded in the gas disk, compared to a circumbinary disks. However, it is important to note that higher gas surface densities can also enhance inward migration of low and intermediate mass planets.
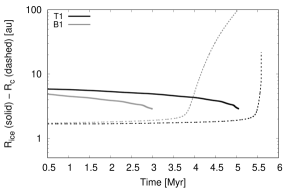
An interesting point here is that, as a consequence of the higher gas surface density profiles for T1, the mid-plane temperature and aspect ratio profiles of the same disk are higher than the ones of B1. These quantities could play an important role in the solid component evolution of these protoplanetary disks, and thus, in the process of planet formation since higher gas densities also implies higher dust densities. As an example, the location of the water ice line (170 K), beyond which an increment in the solid surface density is expected, is always further out in T1 compared to B1, and it also lasts for longer, as it can be seen in Figure 3. This situation may lead to the formation of ice cores in T1 for longer timescales and at larger distances than in B1. In addition, higher aspect ratios reduce the migration rate of low-mass and intermediate-mass planets (e.g. Paardekooper et al., 2011; Jiménez & Masset, 2017) and increase the pebble isolation mass (e.g. Lambrechts et al., 2014). These two effects could help planet formation in hierarchical triple star systems more than in binaries.
On the other hand, we note that while the temperature radial profiles are similar in both cases, i.e. they decrease as we move away from the central binary, the aspect ratio profiles present more differences. This is particularly important for self-shadowing, although we reiterate here that this effect is not included in the disk thermodynamics of our model. In any case, self-shadowing would be stronger in the case of the triple than in the circumbinary star system. In the latter case, the decrease in the aspect ratio could generate an effect of self-shadowing until au, leading to a cooler disk between au and au than the previously computed. This effect would be negligible after 2.5 Myr. For the disk in the triple star system, the self-shadowing would affect until 20 au at early times, and persist until 4.5 Myr of the disk evolution.
4.1.2 With accretion by tidal streams
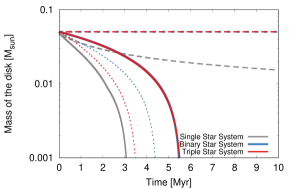
In this section, and in order to understand how the differences between the T1 and B1 profiles affect the disk dissipation timescales, we now allow some mass loss due to viscous accretion via streams to occur. For this comparison we adopt an efficiency of 30, which is an intermediate value between those found by MacFadyen & Milosavljević (2008) and D’Orazio et al. (2013). The general shape and size of the gas, temperature and aspect ratio profiles are very similar to the ones with no mass loss by viscous accretion presented in Figure 2. However, they no longer dissipate on the same timescale – the disk in B1 dissipates in 4.47 Myr while the one in T1 dissipates in 3.58 Myr, an 80% of the circumbinary disk lifetime. The reason is quite simple and is directly related to the behaviour of the gas disk profiles. As described at the end of section 2.2, the mass loss rate due to the accretion by tidal streams is proportional to inside , which is always greater in T1. Thus, the mass removal is higher for the disk in the triple star system though still slow enough to possibly allow planet formation.
Figure 4 shows the time evolution of the mass of the disk in the triple star system T1 in red, the disk in the binary system B1 in blue, and, as a reference, the time evolution of the corresponding circumstellar333The inner radius of the circumstellar disk is also defined at 0.5 au, as for the case of B1 and T1, in order to be consistent with the comparison. Moreover, to have exactly the same mass loss rate due to the X-ray photoevaporation, the central star is assumed to have the same X-ray luminosity as the inner binary system of B1 and T1. disk in grey, which for the purposes of our model is computed with . Both the solid and long dashed lines represent cases in which accretion via streams was not considered, and the short dashed lines represent cases in which we consider an accretion efficiency of 30% by streams. Particularly, the long dashed lines represent cases in which photoevaporation is not included. In this figure it can be clearly seen that, if photoevaporation is not included, the mass loss by viscous accretion is completely suppressed in B1 and T1, and thus, the disks would remain intact forever. This is, as mentioned before, a consequence of the form of the torques for 1D models. Then, if we now consider photoevaporation, both the disks in B1 and T1 dissipate on the same timescale because they are only losing mass due to this mechanism. The dissipation timescale changes between B1 and T1, as previously described, when we also allow mass loss by viscous accretion by tidal streams with an efficiency of 30%. The mass disk evolution is, in this case, represented by the short dashed lines. Although for the triple star system the dissipation timescale is shorter than for the binary case, it is still longer than for the corresponding circumstellar disk (solid grey line).
4.2 Stellar parameters dependency
We now describe the global results of the simulations of Table 1 for disks that evolve due to photoevaporation and viscous accretion by tidal streams with an efficiency of .
4.2.1 Dependence on the stellar mass ratios
In this section, we vary the masses of the stars, but always keeping the total mass of the inner stellar binary set to .
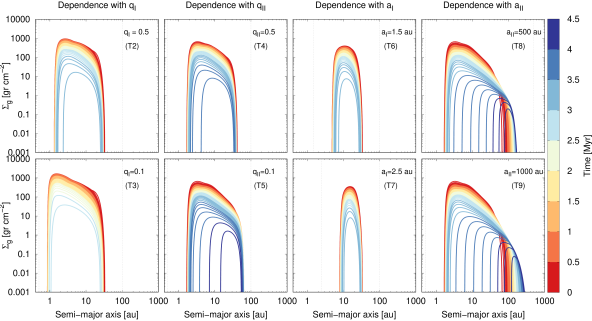
We first consider three different values for the mass ratio between components and . In models T1, T2 and T3, we set and , respectively. The mass ratio of the inner binary plays a key role in the models. On the one hand, enters in eq. 4. Thus, the higher the mass ratio, the greater the torque imparted by the binary to the disk, and consequently, the wider the inner cavity and the narrower the disk, since the external star always truncates the disk at au. The different cavity sizes of the disks can be appreciated in Table 1. On the other hand, different mass ratios imply different individual masses for the inner system, and, given the non-linear relation of X-ray luminosity with mass, a different total . Therefore, as grows, decreases, and consequently, it also does the mass loss rate due to photoevaporation (see eq. 15). Thus, the disk dissipates faster in systems with lower values of . The differences, however, are not very significant and can be found in Table 1. The time evolution of the density profiles of T2 and T3 can be seen in the first column of Figure 5.
To analyze the dependence of the results on , we performed two simulations, T4 and T5 with and , respectively, in addition to our fiducial case T1 with . Different values of do not play any role in the photoevaporation process since the masses of the inner binary do not change in these simulations and thus, the size of the inner cavity remains the same as for T1. What does change in this case is the mass of the external companion. The main effect of is that, as this parameter decreases, the torques exerted by the outer companion to the disk are weaker (see eq. 5) and thus, the gas disk is able to expand more (see Table 1). This expansion consequently causes the surface density profiles to decrease, and therefore, there is less mass loss by viscous accretion by streams. The time evolution of the density profiles for these cases can be seen in the second column of Figure 5.
4.2.2 Dependence on the semi-major axes
We now test the results dependency on and , keeping all the stellar masses fixed as in the fiducial case T1. We performed two simulations, T6 and T7, with au and au, in addition to our fiducial case T1, with au. The effect produced by the increase of the inner binary separation is to create a wider inner cavity due to a higher injection of angular momentum to the disk (see eq. 4). Consequently, the disk is confined to evolve in an outer and narrower region since the external stellar companion, located at 100 au, truncates the disk at 35 au. Despite the widths of the three cases being different, the dissipation timescales are practically the same, as it can be appreciated in Table 1. This happens because the larger the cavity, the smaller the gas surface density at the location in where is computed, but the higher the viscosity as it increases at greater distances from the central star. This increment in is a consequence of its proportionally dependence on and . Therefore remains roughly constant and the accretion rates are very similar for the three cases, while at the same time the photo-evaporation affects the disk equally in the three cases.
Finally, we run two simulations with different values for . Apart from T1 that has au, T8 and T9 have au and au, respectively. In this case, the effect of increasing the separation between the inner binary and the outer stellar companion allows the disk to evolve in a more extended region. This expansion of the disk reduces the gas surface densities compared to T1, producing lower mass loss rates due to viscous accretion by streams, which, as already mentioned, is proportional to . Therefore, the dissipation timescales of these disks are longer than the one of T1 ( Myr). However the differences between the dissipation timescales of T8 and T9 are insignificant (see Table 1). Recall from sec. 4.1.2, that B1, which represents the circumbinary disk case, dissipates in Myr. Thus, disks in triple star systems with sizes larger than 500 au tend to evolve and dissipate in the same way and on similar timescales as the corresponding circumbinary case.
5 The quadruple hierarchical system HD 98800
HD 98800 is a hierarchical quadruple stellar system part of the TW Hya association (Soderblom et al., 1996; Torres et al., 2008; Ducourant et al., 2014). It is formed by two spectroscopic binaries, Aa-Ab (a single-line spectroscopic binary, or SB1) and Ba-Bb (a double-line spectroscopic binary, or SB2) (Torres et al., 1995), and by a narrow circumbinary disk that orbits the well characterized system Ba-Bb. The system Ba-Bb is formed by two stars of 0.6M⊙ and 0.7M⊙, with a semi-major axis of about 0.5 au, with a high eccentricity estimated to be 0.78 (Boden et al., 2005). The orbit of the system Aa-Ab is instead more uncertain, although it could have a total mass similar to that of Ba-Bb, of 1.3M⊙ (Tokovinin, 1999), but probably with a lower mass ratio being an SB1 (Torres et al., 1995). The estimated separation between both binary systems is 45 au and their mutual orbit presents an eccentricity of about 0.4 (Tokovinin et al., 2014). Additionally, the inclination of the outer binary Aa-Ab with respect to the circumbinary disk was estimated to be , and even more, the circumbinary disk is in a polar configuration with respect to Ba-Bb (Kennedy et al., 2019).
The age of this quadruple system is estimated to be between 7 and 10 Myr (Kastner et al., 1997; Prato et al., 2001; Barrado Y Navascués, 2006; Ducourant et al., 2014), which is quite old for a protoplanetary disk. Since moreover there was no detected emission at near-IR wavelengths, the circumbinary disk in HD 98800 B was thought to be a debris disk for many years (Olofsson et al., 2012). Recently, Ribas et al. (2018) were able to resolve the disk with VLA 8.8 mm observations and came to the conclusion that due to its small size, large fractional luminosity, and spectral index consistent with black body emission, the disk should still retain significant amounts of gas, estimated by the authors to be around 5 M, where M is the mass of Jupiter (see Sec. 2 of Ribas et al., 2018, for further details). If this is the case, the question that naturally arises is: How is it possible that the disk still exists in such a complex environment? Ribas et al. (2018) suggested that the disk is long lived because it is only evolving due to photoevaporation, with its viscous evolution stopped or significantly slowed down by the torques of both binaries. In this section, we apply our model to this particular case to quantitatively test their hypothesis.
5.1 Modeling the circumbinary disk in HD 98800 B
As mentioned above, HD 98800 is a quadruple star system. However, in order to model the circumbinary disk around Ba-Bb using PLANETALP-B, we consider the outer binary Ab-Aa as a single body. This is a good approximation for its gravitational effect given the large separation between the binaries, and also the orbit of this component has not been resolved yet. Moreover, due to the axial symmetry of our model, we need to adopt an important simplification: circular and coplanar orbits for both star systems and the disk. We discuss these simplifications in section 6.
We model the time evolution of the disk around HD 98800 B by considering stars of masses 0.7M⊙ and 0.6M⊙ for the system Ba-Bb, so their mass ratio is , and a total mass of 1.3M⊙ for the system Aa-Ab. We consider two different setups for the orbital parameters. Setup 1 adopts the observed semi-major axes of the system, namely au and au, but in a circular and coplanar configuration due to the geometrical limitations of our model. For Setup 2 we adopt the extreme values au and au, that correspond to the maximum and minimum expansion of the Ba-Bb and B-A orbits (apocenter and pericenter), considering their observed eccentricities of 0.78 and 0.4, respectively, but again, in a circular and coplanar configuration. This range of parameters should capture some of the effects we miss by not having eccentric orbits in the models, allowing us to get realistic estimates on the minimum dissipation timescale of the system.
Unlike in sec. 4, we now fix the stellar and orbital parameters of the system and consider different disk parameters such as different values for , , and different accretion efficiency fractions , shown in table 2. As in our previous simulations of sec. 4, we keep a fixed exponent for the initial density profile of and a fixed characteristic radius of au.
Kastner et al. (2004) was able to measure the X-ray luminosity of HD 98800 B, which is erg s-1. This value is an order of magnitude lower than the one we would get with our approach erg s-1 following eqs. 12 and 13, which has important consequences for the disk evolution. As explained in Sec. 4.1, if only X-ray photoevaporation is considered, and no mass loss due to accretion by tidal streams is allowed, the dissipation timescale can be directly estimated without the need of performing simulations. Using as measured by (Kastner et al., 2004) we obtain disk lifetimes much greater than 10 Myr for disk masses of , while using as computed with eqs. 12 and 13, we obtain disk lifetimes of 7.5 Myr, 3.7 Myr, and 0.7 Myr, for the same disk masses. The latter values can be considered as lower limits for the HD 98800 B disk lifetime.
Taking advantage of the fact that this system has a measured X-ray luminosity, we then run the simulations only considering as estimated by Kastner et al. (2004). Due to the uncertainties in the mass loss rates due to stream accretion, we also consider different values for the accretion efficiency , as shown in Table 2. In appendix B we analyze the case in where the accretion efficiency fraction is not set as a constant value but as a function of the aspect ratio of the disk, as proposed by Ragusa et al. (2016).
Figure 6 shows the time evolution of the gas surface density profiles (left column), temperature profiles (middle column) and aspect ratio profiles (right column) every 0.1 Myr represented by the colorscale, for Sim 4 (top), Sim 5 (middle) and Sim 6 (bottom) of the Setup 1 (see Table 2) with an accretion efficiency of 30 (). These are the results for a disk of with different values in the rows. As mentioned before, our simulations end when the disk has completely dissipated, defined as a gas disk mass lower than , or when it reaches 10 Myr.
The viscosity parameter , which is the only difference between the simulations of Fig. 6, plays an important role in two different aspects. First, it is responsible for shaping the gas surface density, temperature and disk aspect ratio profiles, and consequently determining the size and width of the disk, and second, it directly affects the dissipation timescales when some accretion is allowed via streams.
Regarding sizes, the higher the value of , the wider the disk, which expands in both directions, towards the central binary and towards the outer star. The boundaries for each case, and , can be appreciated in Table 2. These values correspond to the gas disk profile at 0.05 Myr of evolution and measured at gr cm-2, and were computed for the case in where no viscous accretion via streams is allowed. However they do not change significantly for the cases in where it is allowed, and thus, for simplicity, we only show in Table 2 the sizes of the disks for the efficiency cases, both for Setup 1 and 2.
The time evolution of the gas surface density profiles for disks with and behave in a similar way to the ones described before for but with different dissipation timescales.
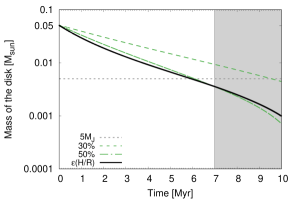
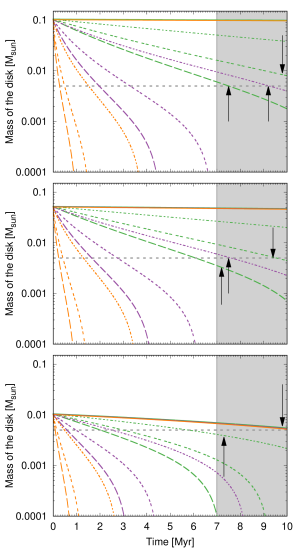
Table 2 also shows the dissipation timescales for each of the performed simulations, both for Setup 1 and Setup 2. Those simulations in which the disk dissipates only after the minimum estimated age of HD 98800, 7 Myr, are highlighted in bold both, for the Setup 1 and Setup 2. However, only those additionally marked with an are the ones that also fit the estimated mass 5M of the disk around HD 98800 B (Ribas et al., 2018). The latter can be also seen in Fig. 7, which shows the time evolution of the mass of the disk for all Setup 1 simulations. The bottom panel shows the results for Sim 1, Sim 2 and Sim 3 with a disk of , the middle panel for Sim 4, Sim 5 and Sim 6 with a disk of and the top panel for Sim 7, Sim 8 and Sim 9 with a disk of . Green curves represent simulations with , purple with and orange with . Solid lines represent simulations with accretion efficiencies of 0, short dashed lines with 10, middle dashed lines with 30 and long dashed lines with 50. The horizontal grey dashed line is marking the current estimated mass of HD 98800 B (Ribas et al., 2018) and the shaded area its probable age. The curves marked with black arrows are the ones highlighted with an in Table 2.
From Table 2 and Figure 7 it can be deduced that, despite the complex configuration of HD 98800, and assuming our simplified model for HD 98800, we found several cases that would explain the existence of the massive disk after 7 Myr, even with high mass accretion efficiencies via streams, and with relatively low initial masses. However, moderate to low viscosities are needed for the low initial mass cases. It is interesting to remark though, that low viscosity values are the ones that better reproduced some of the ring structures in the DSHARP disks (Dullemond et al., 2018).
As shown by the results in Table 2, both for Setup 1 and 2, highly viscous disks that are allowed to lose mass via tidal streams with efficiency, dissipate in less than 3.81 Myrs even for the most conservative simulations (the most massive disk in Setup 1).
| Disk | Setup 1 | Setup 2 | ||||||||||||
| Parameters | Efficiency | Efficiency | ||||||||||||
| [] | [] | [] | [Myr] | [Myr] | [Myr] | [Myr] | [] | [] | [Myr] | [Myr] | [Myr] | [Myr] | ||
| Sim 1 | 0.01 | 2.18 | 0.51 | 10∗ | 2.78 | 1.24 | 0.82 | 2.25 | 0.49 | 1.75 | 0.77 | 0.51 | ||
| Sim 2 | 0.01 | 3.38 | 0.30 | 10∗ | 8.31 | 4.49 | 3.21 | 3.15 | 0.31 | 4.46 | 2.17 | 1.50 | ||
| Sim 3 | 0.01 | 5.12 | 0.18 | 10∗ | 10∗ | 9.26 | 7.19 | 4.21 | 0.22 | 8.15 | 4.41 | 3.18 | ||
| Sim 4 | 0.05 | 2.06 | 0.55 | 10 | 3.59 | 1.51 | 0.97 | 2.01 | 0.56 | 2.15 | 0.90 | 0.59 | ||
| Sim 5 | 0.05 | 2.96 | 0.32 | 10 | 10∗ | 6.27 | 4.27 | 2.85 | 0.33 | 6.22 | 2.77 | 1.86 | ||
| Sim 6 | 0.05 | 4.48 | 0.21 | 10 | 10 | 10∗ | 10∗ | 3.89 | 0.24 | 6.17 | 4.26 | |||
| Sim 7 | 0.1 | 2.02 | 0.57 | 10 | 3.81 | 1.57 | 1.01 | 1.96 | 0.59 | 2.55 | 0.94 | 0.61 | ||
| Sim 8 | 0.1 | 2.84 | 0.33 | 10 | 10∗ | 6.81 | 4.58 | 2.72 | 0.35 | 6.78 | 2.96 | 1.98 | ||
| Sim 9 | 0.1 | 4.23 | 0.21 | 10 | 10 | 10∗ | 10∗ | 3.77 | 0.25 | 6.77 | 4.62 | |||
5.2 Could the potential disk around HD 98800 A have already been photoevaporated?
Given the similar total stellar masses for systems A and B, the lack of a disk in system A is intriguing. We do know, however, that the X-ray luminosity of HD 98800 A is about four times higher than HD 98800 B (Kastner et al., 2004), which implies a shorter lifetime for a disk around it. Here we will test this idea quantitatively with our model.
| Setup 1 | ||||
| Efficiency | ||||
| [Myr] | [Myr] | [Myr] | [Myr] | |
| Sim 1 | 4.20⋆ | — | — | — |
| Sim 2 | 4.20⋆ | 3.88 | — | — |
| Sim 3 | 4.20⋆ | 3.87⋆ | 3.26 | 2.85 |
| Sim 4 | — | — | — | |
| Sim 5 | 6.99⋆ | — | — | |
| Sim 6 | 8.06 | 6.14⋆ | ||
| Sim 7 | — | — | — | |
| Sim 8 | 8.53 | — | — | |
| Sim 9 | 7.48 | |||
We will assume for simplicity that the binary and initial disk in system A have the same parameters as those in B. It is important to remark that, because the system Aa-Ab was classified as an SB1 instead of SB2 (Torres et al., 1995), its actual mass ratio should be lower than that of B. As shown in sec. 4.2.1, a smaller value of leads to a faster disk dispersal. Therefore, our choice of , even if not very realistic, is conservative as it makes the disk in the A system last for longer.
We compute the time evolution of disks around binary A for orbital Setup I, with , and using the parameters of Table 2 that resulted in dissipation timescales longer than 7 Myr for system B (highlighted in boldface). Table 3 presents the dissipation timescales for these new simulations. Those in boldface represent disks that dissipated in less than 7 Myr, and those additionally marked with a ⋆ are the ones that, together with the results of Table 2 (and assuming both disks, A and B, have initially the same mass) better fit the current mass and age of HD 98800 B, and the current non-existence of a disk around system A. For the disk around system A, moderate to low mass disks are needed to allow its dissipation timescale in less than 7 Myr, the minimum age estimated for the quadruple system.
6 Discussion
Here we discuss some important aspects about our model of evolution of disks in triple hierarchical star systems and the possible influence in planet formation.
6.1 General limitations of our model
One of the most important hypotheses in our model, consequence of its one-dimensional nature, is the axisymmetry of the disk. This characteristic does not properly reproduce the details of the disk structure, which is clearly non-axisymmetric due to the non-keplerian potential of the central binary. Even if this approximation might not be the most appropriate to describe the shape of the cavity and the inner regions of circumbinary disks (Dunhill et al., 2015; Miranda et al., 2017; Thun et al., 2017; Thun & Kley, 2018; Poblete et al., 2019), heavily affected by the inner binary, it works well in the outer regions where the binary potential can be approximated by the potential caused by a point mass. In addition, in the particular case of HD 98800 B, we remark that Kennedy et al. (2019) showed that the disk is largely axisymmetrical.
The second important assumption in our model is the circular and coplanar nature of the orbits of the inner binary, and of the circumbinary disk and external companion with respect to the inner binary. On the one hand, binaries on circular orbits produce the most eccentric cavities (Thun et al., 2017), a feature that we cannot reproduce with our 1D+1D model. Although the development of an eccentric cavity affects gas accretion, which results to be variable and modulated by the inner binary orbit, we still take this accretion on average into account. For our modelling of the disk around HD 98800 B this is not an issue though, as the observed binary is not actually circular.
On the other hand, although a full coplanar orbital configuration in a hierarchical triple star system could seem unlikely at first sight, a very recent analysis of the system TWA3 that hosts a circumbinary disk, shows that this could be the case (Czekala et al., 2021). Moreover, we do not expect significant changes in our results for the disk around HD 98800 B, which in fact presents a polar configuration with respect to the inner binary system Ba-Bb (Kennedy et al., 2019), since Franchini et al. (2019) showed that for a polar configurations, the main effect on the disk is a reduced inner cavity due to weaker inner torques. It is possible though, that the irradiation and photoevaporation mechanisms affecting the circumbinary disk are different due to its polar configuration, since the solid angle intercepted by the disk is different. However, we still do not count with models capable of predicting the effects of irradiation and photoevaporation on disks from binary star systems, even less if they have polar orbits with respect to their disks. Thus, we could not predict if this configuration would contribute or not to a faster disk dispersal.
6.2 Effects that could accelerate disk dispersal
Photoevaporation from the central star is perhaps one of the most important mechanisms affecting mass removal in protoplanetary disks and as shown previously is clearly important for circumbinary disks. Disks in hierarchical triple star systems could have, in addition to the irradiation from the inner binary system, an extra source of X-ray radiation: the external companion. However, as described by Rosotti & Clarke (2018), the irradiation from the external star could be somehow important only if their separation is lower than the radius at which X-ray heating is effective (which is about 100 au Owen et al., 2012). For the particular case of HD 98800 B then, the irradiation from the external binary system Aa-Ab could affect somehow its evolution. However, 3D radiation-hydrodynamics simulations not yet developed would be necessary to evaluate this effect.
Another mechanism that could also affects disks in general, contributing to a faster disk dispersal, is external photoevaporation from close stellar encounters (Winter et al., 2018) or due to OB massive stars nearby (Clarke, 2007; Anderson et al., 2013; Winter et al., 2020). Shadmehri et al. (2018) considered this latter effect in the evolution of circumbinary disks and found that it can significantly affect the disk masses and lifetimes depending on the intensity of the external UV radiation flux. We plan to include this effect in future works. However it is important to remark that, at least for the Hya association, external photoevaporation does not seem to be relevant, since even with an estimated age of 10 Myr still presents disks with detected gas, such as HD 98800 B (Ribas et al., 2018) and TWA 3, where 12CO and 13CO were detected for the first time (Czekala et al., 2021).
6.3 Effects on Planet formation
One of the most important results of this work is that disks in hierarchical triple star systems can survive for several Myr, even when allowing gas accretion by tidal streams. This situation, together with the fact that surface density values in triples are, in general, higher than the ones of their circumbinary counterparts (see Fig. 2), could favor planet formation even more than in circumbinary disks. In addition, the location of the iceline in triple star systems is always beyond the corresponding one in the circumbinary disk case as we shown in sec. 4.1.1. Thus, for equal initial mass disks and dust-to-gas ratio in circumbinary and triple disks, higher surface densities and larger initial locations of the icelines could favor the formation of ice cores at larger distances. This comparison between disks in binaries and in triples is analogue to the one between circumstellar and circumbinary disks, where the latter have higher gas surface densities. The fact that planet formation in triples, as in binaries, could be favored at larger distances is in line with the idea that planets in circumbinary disks form far away and then migrate inward parking near the stability limit (Pierens & Nelson, 2007; Thun & Kley, 2018), as it may have happened for the discovered Kepler circumbinary planets.
A possible problem that circumbinary disks in triple star systems could have to achieve planet formation, is their truncation by the external companion. Even in the case of having a disk in a binary and in a triple with the same initial mass of gas and solids, the truncation of the disk in the triple avoids the continuous supply of dust and pebbles from the outer region of the disk that could be quickly lost due to radial drift, unlike what happens in circumbinary disks not affected by an external companion. This situation was recently studied by Zagaria et al. (2021), who found that the dust in circumstellar disks around one of the stars in a binary star system drifts faster than in disks not affected by an outer stellar companion.
Nevertheless, an interesting situation could occur for disks with large (see panels T6 and T7 of Fig. 5) and low viscosities (see bottom row of Fig. 6). In these cases, the gas surface density shows quasi-gaussian radial profiles with a well defined maximum. As it was recently shown by Guilera et al. (2020), a maximum in the gas surface density is related with a pressure maximum and it represents a preferential location for the dust/pebble trap, planetesimal formation by streaming instability and planet formation by hybrid accretion of pebbles and planetesimals. Moreover, the well defined pressure maximum can act as a planet migration trap, thus, favoring planet formation.
7 Conclusions
We present PLANETALP-B, a 1D+1D model able to compute the time evolution of the gaseous component of circumbinary disks in triple hierarchical stellar systems in circular and coplanar orbits. Our model considers viscous accretion, irradiation from the central binary and X-ray photoevaporation. This model can also be applied to the study of the evolution of circumbinary disks around close-in binaries, or the evolution of circumstellar disks around one of the stars in a wide binary star system. The general goal of this work is to compare the evolution of circumbinary disks in binaries and triple hierarchical stellar systems and to characterize their particular features and lifetimes. A particular goal is to try to understand how it is possible that some disks in these complex stellar environments survive for longer than typical protoplanetary disks.
Our main results are briefly summarized as follows
-
•
The gas disk profiles in binaries and triples are quite different and these differences are mainly related to the size of the inner cavities and the outer radius of the disks. While disks in triples evolve almost confined in a radial range, disks in binaries migrate and expand radially.
-
•
Disks in triple star systems dissipate faster than their circumbinary counterparts when accretion by tidal streams is considered, as a natural consequence of their higher surface density profiles. However, the difference in their dissipation timescales is only about 20.
-
•
Disks in triple star systems last for longer timescales than their circumstellar counterparts, even when considering an efficiency for the accretion by tidal streams of 30%.
-
•
Disks in triple star systems dissipate faster for lower values of , though the differences are not significant. The opposite happens for lower values of .
-
•
Higher values of provoke larger inner cavities. However, the mass loss rate due to viscous accretion by tidal streams remains similar as a consequence of a balance produced between the gas surface density and the viscosity. This effect compensates the dissipation timescales which are almost the same for the considered cases.
-
•
The main effect of higher values of is that the dissipation timescales are longer. Disks with au tend to dissipate in the same timescales than their corresponding circumbinary disks.
-
•
For the particular analysis of the disk around HD 98800 B, and under certain disk parameters (intermediate to high mass disks and moderate to low viscosities), we are able to explain its estimated age and mass. Simultaneously, we are also able to explain the absence of a disk around the binary system A.
Thus, our study helps characterizing the main features of disks in hierarchical triple star systems and sheds light on the process of planet formation in these complex environments.
References
- Akeson et al. (2019) Akeson, R. L., Jensen, E. L. N., Carpenter, J., et al. 2019, ApJ, 872, 158, doi: 10.3847/1538-4357/aaff6a
- Alexander (2012) Alexander, R. 2012, ApJ, 757, L29, doi: 10.1088/2041-8205/757/2/L29
- Alexander et al. (2006) Alexander, R. D., Clarke, C. J., & Pringle, J. E. 2006, MNRAS, 369, 229, doi: 10.1111/j.1365-2966.2006.10294.x
- Alibert et al. (2005) Alibert, Y., Mordasini, C., Benz, W., & Winisdoerffer, C. 2005, A&A, 434, 343, doi: 10.1051/0004-6361:20042032
- ALMA Partnership et al. (2015) ALMA Partnership, Brogan, C. L., Pérez, L. M., et al. 2015, ApJ, 808, L3, doi: 10.1088/2041-8205/808/1/L3
- Alves et al. (2019) Alves, F. O., Caselli, P., Girart, J. M., et al. 2019, Science, 366, 90, doi: 10.1126/science.aaw3491
- Anderson et al. (2013) Anderson, K. R., Adams, F. C., & Calvet, N. 2013, ApJ, 774, 9, doi: 10.1088/0004-637X/774/1/9
- Andrews et al. (2010) Andrews, S. M., Wilner, D. J., Hughes, A. M., Qi, C., & Dullemond, C. P. 2010, ApJ, 723, 1241, doi: 10.1088/0004-637X/723/2/1241
- Armitage & Natarajan (2002) Armitage, P. J., & Natarajan, P. 2002, ApJ, 567, L9, doi: 10.1086/339770
- Artymowicz & Lubow (1994) Artymowicz, P., & Lubow, S. H. 1994, ApJ, 421, 651, doi: 10.1086/173679
- Artymowicz & Lubow (1996) —. 1996, ApJ, 467, L77, doi: 10.1086/310200
- Baraffe et al. (2015) Baraffe, I., Homeier, D., Allard, F., & Chabrier, G. 2015, A&A, 577, A42, doi: 10.1051/0004-6361/201425481
- Barrado Y Navascués (2006) Barrado Y Navascués, D. 2006, A&A, 459, 511, doi: 10.1051/0004-6361:20065717
- Bate (2018) Bate, M. R. 2018, MNRAS, 475, 5618, doi: 10.1093/mnras/sty169
- Boden et al. (2005) Boden, A. F., Sargent, A. I., Akeson, R. L., et al. 2005, ApJ, 635, 442, doi: 10.1086/497328
- Bonavita & Desidera (2020) Bonavita, M., & Desidera, S. 2020, Galaxies, 8, 16, doi: 10.3390/galaxies8010016
- Cieza et al. (2009) Cieza, L. A., Padgett, D. L., Allen, L. E., et al. 2009, ApJ, 696, L84, doi: 10.1088/0004-637X/696/1/L84
- Cieza et al. (2019) Cieza, L. A., Ruíz-Rodríguez, D., Hales, A., et al. 2019, MNRAS, 482, 698, doi: 10.1093/mnras/sty2653
- Clarke (2007) Clarke, C. J. 2007, MNRAS, 376, 1350, doi: 10.1111/j.1365-2966.2007.11547.x
- Correia et al. (2006) Correia, S., Zinnecker, H., Ratzka, T., & Sterzik, M. F. 2006, A&A, 459, 909, doi: 10.1051/0004-6361:20065545
- Cox et al. (2017) Cox, E. G., Harris, R. J., Looney, L. W., et al. 2017, ApJ, 851, 83, doi: 10.3847/1538-4357/aa97e2
- Cuadra et al. (2009) Cuadra, J., Armitage, P. J., Alexander, R. D., & Begelman, M. C. 2009, MNRAS, 393, 1423, doi: 10.1111/j.1365-2966.2008.14147.x
- Czekala et al. (2021) Czekala, I., Ribas, Á., Cuello, N., et al. 2021, arXiv e-prints, arXiv:2102.11875. https://arxiv.org/abs/2102.11875
- del Valle & Escala (2012) del Valle, L., & Escala, A. 2012, ApJ, 761, 31, doi: 10.1088/0004-637X/761/1/31
- D’Orazio et al. (2013) D’Orazio, D. J., Haiman, Z., & MacFadyen, A. 2013, MNRAS, 436, 2997, doi: 10.1093/mnras/stt1787
- Duchêne & Kraus (2013) Duchêne, G., & Kraus, A. 2013, ARA&A, 51, 269, doi: 10.1146/annurev-astro-081710-102602
- Ducourant et al. (2014) Ducourant, C., Teixeira, R., Galli, P. A. B., et al. 2014, A&A, 563, A121, doi: 10.1051/0004-6361/201322075
- Dullemond et al. (2018) Dullemond, C. P., Birnstiel, T., Huang, J., et al. 2018, ApJ, 869, L46, doi: 10.3847/2041-8213/aaf742
- Dunhill et al. (2015) Dunhill, A. C., Cuadra, J., & Dougados, C. 2015, MNRAS, 448, 3545, doi: 10.1093/mnras/stv284
- Ercolano & Owen (2010) Ercolano, B., & Owen, J. E. 2010, MNRAS, 406, 1553, doi: 10.1111/j.1365-2966.2010.16798.x
- Farris et al. (2014) Farris, B. D., Duffell, P., MacFadyen, A. I., & Haiman, Z. 2014, ApJ, 783, 134, doi: 10.1088/0004-637X/783/2/134
- Fedele et al. (2010) Fedele, D., van den Ancker, M. E., Henning, T., Jayawardhana, R., & Oliveira, J. M. 2010, A&A, 510, A72, doi: 10.1051/0004-6361/200912810
- Fontecilla et al. (2019) Fontecilla, C., Haiman, Z., & Cuadra, J. 2019, MNRAS, 482, 4383, doi: 10.1093/mnras/sty2972
- Franchini et al. (2019) Franchini, A., Lubow, S. H., & Martin, R. G. 2019, ApJ, 880, L18, doi: 10.3847/2041-8213/ab2fd8
- Gorti et al. (2009) Gorti, U., Dullemond, C. P., & Hollenbach, D. 2009, ApJ, 705, 1237, doi: 10.1088/0004-637X/705/2/1237
- Guilera et al. (2019) Guilera, O. M., Cuello, N., Montesinos, M., et al. 2019, MNRAS, 486, 5690, doi: 10.1093/mnras/stz1158
- Guilera et al. (2017) Guilera, O. M., Miller Bertolami, M. M., & Ronco, M. P. 2017, MNRAS, 471, L16, doi: 10.1093/mnrasl/slx095
- Guilera et al. (2020) Guilera, O. M., Sándor, Z., Ronco, M. P., Venturini, J., & Miller Bertolami, M. M. 2020, arXiv e-prints, arXiv:2005.10868. https://arxiv.org/abs/2005.10868
- Hirsh et al. (2020) Hirsh, K., Price, D. J., Gonzalez, J.-F., Ubeira-Gabellini, M. G., & Ragusa, E. 2020, MNRAS, 498, 2936, doi: 10.1093/mnras/staa2536
- Jiménez & Masset (2017) Jiménez, M. A., & Masset, F. S. 2017, MNRAS, 471, 4917, doi: 10.1093/mnras/stx1946
- Kastner et al. (2004) Kastner, J. H., Huenemoerder, D. P., Schulz, N. S., et al. 2004, ApJ, 605, L49, doi: 10.1086/420769
- Kastner et al. (1997) Kastner, J. H., Zuckerman, B., Weintraub, D. A., & Forveille, T. 1997, Science, 277, 67, doi: 10.1126/science.277.5322.67
- Kennedy et al. (2019) Kennedy, G. M., Matrà, L., Facchini, S., et al. 2019, Nature Astronomy, 3, 230, doi: 10.1038/s41550-018-0667-x
- Kraus et al. (2012) Kraus, A. L., Ireland, M. J., Hillenbrand, L. A., & Martinache, F. 2012, ApJ, 745, 19, doi: 10.1088/0004-637X/745/1/19
- Kraus et al. (2020) Kraus, S., Kreplin, A., Young, A. K., et al. 2020, Science, 369, 1233, doi: 10.1126/science.aba4633
- Kunitomo et al. (2021) Kunitomo, M., Ida, S., Takeuchi, T., et al. 2021, ApJ, 909, 109, doi: 10.3847/1538-4357/abdb2a
- Lambrechts et al. (2014) Lambrechts, M., Johansen, A., & Morbidelli, A. 2014, A&A, 572, A35, doi: 10.1051/0004-6361/201423814
- Lodato et al. (2009) Lodato, G., Nayakshin, S., King, A. R., & Pringle, J. E. 2009, MNRAS, 398, 1392, doi: 10.1111/j.1365-2966.2009.15179.x
- MacFadyen & Milosavljević (2008) MacFadyen, A. I., & Milosavljević, M. 2008, ApJ, 672, 83, doi: 10.1086/523869
- Manara et al. (2019) Manara, C. F., Tazzari, M., Long, F., et al. 2019, A&A, 628, A95, doi: 10.1051/0004-6361/201935964
- Martin (2018) Martin, D. V. 2018, Populations of Planets in Multiple Star Systems, ed. H. J. Deeg & J. A. Belmonte, 156, doi: 10.1007/978-3-319-55333-7_156
- Marzari & Thebault (2019) Marzari, F., & Thebault, P. 2019, Galaxies, 7, 84, doi: 10.3390/galaxies7040084
- Migaszewski (2015) Migaszewski, C. 2015, MNRAS, 453, 1632, doi: 10.1093/mnras/stv1739
- Miranda et al. (2017) Miranda, R., Muñoz, D. J., & Lai, D. 2017, MNRAS, 466, 1170, doi: 10.1093/mnras/stw3189
- Olofsson et al. (2012) Olofsson, J., Juhász, A., Henning, T., et al. 2012, A&A, 542, A90, doi: 10.1051/0004-6361/201118735
- Owen et al. (2012) Owen, J. E., Clarke, C. J., & Ercolano, B. 2012, MNRAS, 422, 1880, doi: 10.1111/j.1365-2966.2011.20337.x
- Owen et al. (2011) Owen, J. E., Ercolano, B., & Clarke, C. J. 2011, MNRAS, 412, 13, doi: 10.1111/j.1365-2966.2010.17818.x
- Paardekooper et al. (2011) Paardekooper, S.-J., Baruteau, C., & Kley, W. 2011, MNRAS, 410, 293, doi: 10.1111/j.1365-2966.2010.17442.x
- Papaloizou & Pringle (1977) Papaloizou, J., & Pringle, J. E. 1977, MNRAS, 181, 441, doi: 10.1093/mnras/181.3.441
- Petrovich & Rafikov (2012) Petrovich, C., & Rafikov, R. R. 2012, ApJ, 758, 33, doi: 10.1088/0004-637X/758/1/33
- Pfalzner et al. (2014) Pfalzner, S., Steinhausen, M., & Menten, K. 2014, ApJ, 793, L34, doi: 10.1088/2041-8205/793/2/L34
- Pichardo et al. (2005) Pichardo, B., Sparke, L. S., & Aguilar, L. A. 2005, MNRAS, 359, 521, doi: 10.1111/j.1365-2966.2005.08905.x
- Picogna et al. (2019) Picogna, G., Ercolano, B., Owen, J. E., & Weber, M. L. 2019, MNRAS, 487, 691, doi: 10.1093/mnras/stz1166
- Pierens & Nelson (2007) Pierens, A., & Nelson, R. P. 2007, A&A, 472, 993, doi: 10.1051/0004-6361:20077659
- Poblete et al. (2019) Poblete, P. P., Cuello, N., & Cuadra, J. 2019, MNRAS, 489, 2204, doi: 10.1093/mnras/stz2297
- Prato et al. (2001) Prato, L., Ghez, A. M., Piña, R. K., et al. 2001, ApJ, 549, 590, doi: 10.1086/319061
- Preibisch et al. (2005) Preibisch, T., Kim, Y.-C., Favata, F., et al. 2005, ApJS, 160, 401, doi: 10.1086/432891
- Pringle (1981) Pringle, J. E. 1981, ARA&A, 19, 137, doi: 10.1146/annurev.aa.19.090181.001033
- Rafikov (2016) Rafikov, R. R. 2016, ApJ, 827, 111, doi: 10.3847/0004-637X/827/2/111
- Rafikov & Petrovich (2012) Rafikov, R. R., & Petrovich, C. 2012, ApJ, 747, 24, doi: 10.1088/0004-637X/747/1/24
- Ragusa et al. (2020) Ragusa, E., Alexander, R., Calcino, J., Hirsh, K., & Price, D. J. 2020, MNRAS, 499, 3362, doi: 10.1093/mnras/staa2954
- Ragusa et al. (2016) Ragusa, E., Lodato, G., & Price, D. J. 2016, MNRAS, 460, 1243, doi: 10.1093/mnras/stw1081
- Reipurth et al. (2014) Reipurth, B., Clarke, C. J., Boss, A. P., et al. 2014, in Protostars and Planets VI, ed. H. Beuther, R. S. Klessen, C. P. Dullemond, & T. Henning, 267, doi: 10.2458/azu_uapress_9780816531240-ch012
- Ribas et al. (2018) Ribas, Á., Macías, E., Espaillat, C. C., & Duchêne, G. 2018, ApJ, 865, 77, doi: 10.3847/1538-4357/aad81b
- Ronco et al. (2017) Ronco, M. P., Guilera, O. M., & de Elía, G. C. 2017, MNRAS, 471, 2753, doi: 10.1093/mnras/stx1746
- Rosotti & Clarke (2018) Rosotti, G. P., & Clarke, C. J. 2018, MNRAS, 473, 5630, doi: 10.1093/mnras/stx2769
- Schwarz et al. (2016) Schwarz, R., Funk, B., Zechner, R., & Bazsó, Á. 2016, MNRAS, 460, 3598, doi: 10.1093/mnras/stw1218
- Shadmehri et al. (2018) Shadmehri, M., Ghoreyshi, S. M., & Alipour, N. 2018, ApJ, 867, 41, doi: 10.3847/1538-4357/aae2b5
- Shakura & Sunyaev (1973) Shakura, N. I., & Sunyaev, R. A. 1973, A&A, 24, 337
- Soderblom et al. (1996) Soderblom, D. R., Henry, T. J., Shetrone, M. D., Jones, B. F., & Saar, S. H. 1996, ApJ, 460, 984, doi: 10.1086/177026
- Tang et al. (2017) Tang, Y., MacFadyen, A., & Haiman, Z. 2017, MNRAS, 469, 4258, doi: 10.1093/mnras/stx1130
- Tazzari & Lodato (2015) Tazzari, M., & Lodato, G. 2015, MNRAS, 449, 1118, doi: 10.1093/mnras/stv352
- Thun & Kley (2018) Thun, D., & Kley, W. 2018, A&A, 616, A47, doi: 10.1051/0004-6361/201832804
- Thun et al. (2017) Thun, D., Kley, W., & Picogna, G. 2017, A&A, 604, A102, doi: 10.1051/0004-6361/201730666
- Tobin et al. (2016) Tobin, J. J., Kratter, K. M., Persson, M. V., et al. 2016, Nature, 538, 483, doi: 10.1038/nature20094
- Tokovinin et al. (2014) Tokovinin, A., Mason, B. D., & Hartkopf, W. I. 2014, AJ, 147, 123, doi: 10.1088/0004-6256/147/5/123
- Tokovinin (1999) Tokovinin, A. A. 1999, Astronomy Letters, 25, 669
- Torres et al. (2008) Torres, C. A. O., Quast, G. R., Melo, C. H. F., & Sterzik, M. F. 2008, Young Nearby Loose Associations, ed. B. Reipurth, Vol. 5, 757
- Torres et al. (1995) Torres, G., Stefanik, R. P., Latham, D. W., & Mazeh, T. 1995, ApJ, 452, 870, doi: 10.1086/176355
- Vartanyan et al. (2016) Vartanyan, D., Garmilla, J. A., & Rafikov, R. R. 2016, ApJ, 816, 94, doi: 10.3847/0004-637X/816/2/94
- Venturini et al. (2020a) Venturini, J., Guilera, O. M., Ronco, M. P., & Mordasini, C. 2020a, arXiv e-prints, arXiv:2008.05497. https://arxiv.org/abs/2008.05497
- Venturini et al. (2020b) Venturini, J., Ronco, M. P., & Guilera, O. M. 2020b, Submmited to Space Science Review
- Winter et al. (2018) Winter, A. J., Clarke, C. J., Rosotti, G., et al. 2018, MNRAS, 478, 2700, doi: 10.1093/mnras/sty984
- Winter et al. (2020) Winter, A. J., Kruijssen, J. M. D., Longmore, S. N., & Chevance, M. 2020, Nature, 586, 528, doi: 10.1038/s41586-020-2800-0
- Zagaria et al. (2021) Zagaria, F., Rosotti, G. P., & Lodato, G. 2021, MNRAS, 504, 2235, doi: 10.1093/mnras/stab985
- Zurlo et al. (2020) Zurlo, A., Cieza, L. A., Pérez, S., et al. 2020, MNRAS, 496, 5089, doi: 10.1093/mnras/staa1886
Appendix A Validation of our 1D+1D model: vertical structure and gas evolution for circumbinary disks
In order to validate our 1D+1D model for the vertical structure and the time evolution of the gas in circumbinary disks added in PLANETALP-B, we compare our results against those of Vartanyan et al. (2016), only for their case with (their Fig. 5 and 6).
We first compute the vertical structure of the disk using the same stellar and disk parameters they considered but computing the irradiation of the disk following our Eq. 9 and 10. The disk and stellar parameters are au, , , , and central binary of total mass .
As it was also noticed by Shadmehri et al. (2018), the binary torque equation in Vartanyan et al. (2016) is a bit different from the classical one from Armitage & Natarajan (2002). In order to properly compare our model with that of Vartanyan et al. (2016), we use here the same expression they used, with a factor (see their Eq. 3).
We then compute the time evolution of the gaseous component by solving Eq. 11 without photoevaporation from the central star, this is, . The initial profile used by Vartanyan et al. (2016) is a narrow initial peak distribution in the shape of a ring given by
| (A1) |
where au, is the initial radius of the disk, and au, is its width.
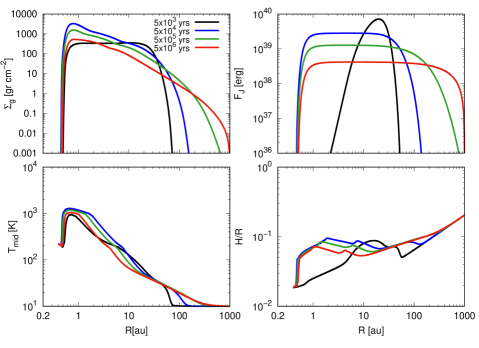
Figure 8 shows the gas surface density (top left panel), viscous angular momentum Flux profiles computed as , with the specific angular momentum (top right panel), mid plane temperature (bottom left panel) and the aspect ratio (bottom right) for the comparison case and at the same times showed by Vartanyan et al. (2016). The flux profiles can be compared with their Fig. 3 and the gas and temperature profiles can be compared with Fig. 6 of their work. The aspect ratio in Vartanyan et al. (2016) is only shown for a disk of (see their Fig.11), however it presents very similar characteristics to our case of .
As in Vartanyan et al. (2016), our disks would also be prone to self-shadowing caused by the tidal and viscous heating enhancement of the mid plane temperature and thus the aspect ratio of the inner regions of the disk. This effect can be clearly appreciated in the bottom left and right panels of Fig. 8, in where beyond au, H/R presents a flared structure, but between au and 20 au H/R increases as R gets smaller. This effect could change the temperature in this region, which could be lower in fact. As pointed out by Vartanyan et al. (2016), taking into account the self-shadowing in 1D+1D models is extremely hard and is completely out of the scope of this work.
In general, our results look very similar to those of Vartanyan et al. (2016) despite some minor differences mainly related to the fact that our irradiation model is different. We particularly reproduce quite well the inner cavity of the disk, that expands almost up to 0.5 au, between 2–3 times the binary separation, and the very early plateau distribution in the flux.
Appendix B Accretion efficiency as a function of the aspect ratio
The evolution of circumbinary disks, studied by means of 1D models, predicts that viscous accretion of material is not possible. As mentioned before, this result is due to the particular way of modeling the viscous torques. Instead, 2D and 3D simulations have shown that viscous accretion can happen via gas tidal streams inside the cavity with accretion rates that could be similar or higher than those of single star systems. However, this scenario can drastically change when the disks become thin. Ragusa et al. (2016) found that when the aspect ratio of the disk () is 0.1 the accretion efficiency is not affected by the tidal torques of the inner binary, however, for thinner disks with 0.1, the accretion efficiency linearly decays as
| (B1) |
Here we compute again the time evolution of the circumbinary disk of Sim 6 - Setup I (see Table 2) but instead of considering a fixed value for the accretion efficiency as we did in sec. 5.1, we follow eq. B1.
Figure 9 shows the time evolution of the mass of the disk of Sim 6 (the solid black line) computed following eq. B1 and compared to the cases computed with a fixed value of the accretion efficiency of 30 () and of 50 (), in short and long dashed lines, respectively. As it can be seen, the more realistic approach derived by Ragusa et al. (2016) is in good agreement with an accretion efficiency of 50% regardless of the aspect ratio of the disk.