GEPI, Observatoire de Paris, PSL University, CNRS, 5 Place Jules Janssen, 92190 Meudon, France
Department of Physics & Astronomy, Johns Hopkins University, Baltimore, MD 21218, USA
Anton Pannekoek Institute for Astronomy, University of Amsterdam, Science Park 904, 1098 XH Amsterdam, The Netherlands
Cosmic Dawn Center (DAWN)
Niels Bohr Institute, University of Copenhagen, Jagtvej 128, 2100 Copenhagen Ø, Denmark
DTU Space, National Space Institute, Technical University of Denmark, DK-2800 Kongens Lyngby, Denmark
INAF – IASF/Milano, via Corti 12, I-20133 Milano, Italy
Department of Physics & Astronomy and Leicester Institute of Space & Earth Observation, University of Leicester, University Road, Leicester LE1 7RH, UK
Gamma-ray bursts as probes of
high-redshift Lyman- emitters and radiative transfer models
Abstract
Aims. We present the updated census and statistics of Lyman- emitting long gamma-ray bursts host galaxies (LAE-LGRBs). We investigate the properties of a sub-sample of LAE-LGRBs and test the shell model commonly used to fit Lyman- (Ly) emission line spectra.
Methods. To perform the census we use all the LGRB host galaxies with relevant information presented in the literature or publicly available. Among the LAE-LGRBs detected to date, we select a golden sample of four LAE-LGRBs (GRBs: 011211, 021004, 060926, 070110) allowing us to retrieve information on the host galaxy properties and of its interstellar medium gas, through the combination of the analysis of their afterglow and host galaxy observations. We fit their Ly spectra using the shell model, and constrain its parameters with the observed values.
Results. The census results in 29 LAE-LGRBs detected to date. Among them, we present five new Ly emission detections in host-galaxy spectra and the corresponding unpublished VLT/X-shooter data (GRBs: 060926, 070110, 081121, 081222 and 100424A). From the comparison of the statistics and properties of LAE-LGRBs to those of LAE samples in the literature, we find evidences of Ly suppression in dusty systems, and a fraction of LAE-LGRBs among the overall LGRB hosts lower than that found for Lyman-break galaxy (LBG) samples at similar redshift range. This result can be explained by the different selection criteria of the parent samples and by the shallower spectral observations of LGRB samples compared to LBG ones. However, we find that LAE-LGRBs are representative of Ly emission from the bulk of UV-selected galaxies at . We find that the golden sample of LAE-LGRBs studied here are complex systems characterized by multiple emission blobs and by signs of possible galaxy interactions. The fitting procedure recovers the HI column densities () measured from the afterglow spectra, and the other properties described by the shell-model parameters in the two low- cases, but it fails in doing so in the other two with high . The afterglows of most LGRBs and LAE-LGRBs show , implying that statistically the bulk of Ly photons expected to be produced by massive stars in the star-forming region hosting the GRB will be surrounded by such opaque lines of sight. We therefore interpret our results in the context of more sophisticated models and of different dominant Ly emitting regions. We also compare LAE-LGRBs to LAE Lyman continuum (LyC) leakers in the literature in terms of properties identified as possible indirect indicators of LyC leakage. We find that only one LGRB (GRB 021004) would be a likely strong LyC leaker and discuss the validity of such indicators at high redshift.
Key Words.:
gamma-ray burst: general – galaxies: star formation – galaxies: ISM – galaxies: evolution – galaxies: high-redshift - line: profiles1 Introduction
Due to its brightness and rest-frame wavelength, the Lyman- (Ly) emission line is one of the most used features to detect high-redshift galaxies (e.g., Ouchi et al. 2009; Sobral et al. 2015; Zitrin et al. 2015; Bagley et al. 2017). The natural connection of this line with the UV emission from star-forming regions makes it an interesting proxy to study the escape of Lyman continuum (LyC; ¡912 Å). Indeed, recent studies, such as those of Verhamme et al. (2015, 2017), show that this line is one of the most reliable indirect indicators of ionizing photon leakage.
To escape a galaxy, the Ly photons produced in star-forming regions have to pass through the gas where they are embedded. As this radiation resonantly scatters in the presence of neutral hydrogen and is easily absorbed by dust, the journey of photons in the interstellar and circumgalactic medium (ISM and CGM, respectively) can be complex. Nevertheless, different properties can favour their escape such as low neutral-hydrogen (HI) column densities, low dust content or suitable ISM geometries and kinematics (e.g., Kunth et al. 1998; Shapley et al. 2003; Verhamme et al. 2008; Wofford et al. 2013; Henry et al. 2015; Rivera-Thorsen et al. 2015). As a consequence, the Ly line flux and profile reflect the signatures of the physical and dynamical properties of the gas and dust content of the Ly emitters and their surrounding environment. Interpreting the line is complex, and radiative transfer models which take into account the different sources of distortion of the intrinsic profile are necessary to recover the physical meaning of the observed line. A simple and successful model, commonly used to reproduce the Ly shape, is the shell model (e.g., Ahn 2004; Verhamme et al. 2006; Schaerer et al. 2011; Gronke et al. 2015). It consists of an homogeneous expanding shell of neutral hydrogen and dust surrounding a central emitting source.
While successful in reproducing the line profile (see e.g., Verhamme et al. 2008; Lidman et al. 2012; Yang et al. 2017; Gronke 2017), it is important to test whether the best-fit parameters values of the shell model correspond to the real characteristics of the Ly-emitting galaxies. Orlitová et al. (2018) highlighted discrepancies between modelling results and observed double-peaked Ly lines, by constraining independently 5 out of the 7 shell-model parameters with ancillary data, for twelve Green Pea (GP) galaxies at 0.2. In particular, the constrained model neither reproduces the observed blue peak of the line correctly nor, in half of the cases, the red peak. For the prediction of the parameters in the unconstrained case, the main discrepant values are the redshift, the and the velocity expansion of the shell. Similar discrepancies for the were also found by Hashimoto et al. (2015) for double peak Ly profiles of galaxies at 2.2. This work emphasises that the use of the shell model to interpret the Ly line and retrieve physical properties, such as , must proceed cautiously to avoid misinterpretation. It also suggests that considering an homogeneous shell to describe star-forming regions and their surrounding gas could be too simplistic.
The simultaneous availability of the information needed to constrain the model parameters is rare, especially at high redshift. Two individual studies of lensed galaxies at redshift allowed to interpret the Ly line using partially constrained shell model (Schaerer & Verhamme 2008; Dessauges-Zavadsky et al. 2010). The fitting of the Ly line is in good agreement with the observation in the study of Dessauges-Zavadsky et al. (2010), while it requires different expansion velocities for the front and the back of the modelled shell in Schaerer & Verhamme (2008).
Gamma-ray bursts (GRBs) can be a useful additional tool to investigate Ly emission and test the shell model at high redshift. GRBs are the most extreme cosmic electromagnetic phenomena (see Gehrels & Razzaque 2013 for a review). Their brightness makes them powerful probes through the cosmic history since they can be detected up to the highest redshifts (the spectroscopic record holder is GRB 080423 at ; Salvaterra et al. 2009; Tanvir et al. 2009). In the case of long GRBs (LGRBs), the energy powering the bursts is released during the core-collapse of massive stars (e.g., Hjorth et al. 2003). In addition, several studies indicate that LGRBs have the tendency to occur in dwarf galaxies with high specific star-formation rates and prefer low-metallicity environments, typically sub-solar (e.g., Perley et al. 2016b; Japelj et al. 2016; Graham & Fruchter 2017; Vergani et al. 2017; Palmerio et al. 2019). This makes LGRB hosts likely representative of the common galaxies at high redshift, including during the epoch of reionization (Salvaterra et al. 2011, 2013; Tanvir et al. 2019).
The bright afterglows associated with LGRBs provide ideal background lights to probe systematically and at any redshift the ISM, CGM and inter-galactic medium (IGM) along the line of sight of this population of faint galaxies. The absorption present in the afterglow spectra directly traces the environment of the star-forming regions and also outflows or inflows even for the faintest objects. Once the afterglow has faded, the host galaxy can be directly observed through photometry and spectroscopy. This offers the interesting possibility of combining information on the cold and warm gas with the emission properties of the GRB host galaxy (e.g., Vergani et al. 2011; Chen 2012; Friis et al. 2015; Wiseman et al. 2017; Arabsalmani et al. 2018).
In this work, (i) we update the statistics of Ly-emitting (LAE111In the literature Ly-emitting galaxies are usually defined as Ly emitters (LAEs) when their rest-frame Ly emission equivalent width ((Ly)) is above a certain threshold (typically 20 Å) because historically they were selected from narrow band observations. In this study, we qualify Ly-emitting galaxies as LAEs independently of their ((Ly)).) LGRB host galaxies and compare their properties with those of LGRB hosts in general, and of LAEs and LyC leakers in the literature; (ii) we use a golden sample of four LAE-LGRBs at allowing the combination of the emission properties of the host galaxies with the information on the ISM probed by the afterglow, to investigate the properties of such systems and test the Ly radiative transfer modelling.
The paper is organized as follows. In Section 2, we present a statistical study on LAEs in LGRB hosts. We describe the physical properties of the host galaxies of our golden sample in Section 3 and the Ly radiative transfer model results in Section 4. In section 5, we discuss the differences between model predictions and observations, and we compare LAE-LGRBs to LGRB hosts in general and to LAEs and LyC-leaker galaxies in the literature. We draw our conclusions in Section 6.
All errors are reported at 1 confidence unless stated otherwise. We consider a cosmology with the cosmological parameters provided in Planck Collaboration et al. (2016): , and .
2 LAE detections in LGRB systems
2.1 Previous studies and approach
The early studies of high-redshift GRB host galaxies, based on the first sample of five objects, (Kulkarni et al. 1998; Fynbo et al. 2002; Møller et al. 2002; Fynbo et al. 2003; Vreeswijk et al. 2004), seemed to indicate that all GRB hosts were LAEs. A subsequent systematic study, based on the larger TOUGH sample (Hjorth et al. 2012; sixty-nine LGRB host galaxies), has been carried out by Milvang-Jensen et al. (2012). They targeted a sub-sample of twenty LGRB hosts in the redshift range for VLT/FORS1 (Appenzeller et al. 1998) spectral observations. They found seven LGRB hosts with significant Ly emission (3 detection), corresponding to 35% LAEs.
The first step of our work is to update the census of LAE-LGRBs. To this end we considered two approaches: (i) a determination of the LAE statistics considering spectroscopic samples of LGRB host galaxies or afterglows; (ii) the search for LAE-LGRBs in the literature and from the host-galaxy spectra available in the ESO archive222http://archive.eso.org/cms.html. In both cases, we consider a minimum value of for the LGRBs, which corresponds to the atmospheric UV cutoff at 310 nm and is the lower-redshift limit allowing the detection of the Ly line in the VLT/X-shooter spectra333In our study the VLT/X-shooter spectrograph (Vernet et al. 2011) is particularly interesting for its wide spectral coverage (from nm to 2500 nm) allowing the simultaneous detection of absorption lines in the ISM of the host galaxy and associated nebular emission lines for a large range of redshifts, with a medium spectral resolution of R .. The samples considered for point (i) are the TOUGH, the X-shooter host-galaxy sample (Krühler et al. 2015, XHG in the following) and the X-shooter afterglow sample (Selsing et al. 2019; XAFT in the following).
We stress that the census presented in the following sections (especially in Sect. 2.5) may not reflect the general statistics of LAEs among LGRB host galaxies. In addition to issues concerning the completeness of the samples and of the observations, the spectra are generally not homogeneous in terms of exposure times, instruments and observing conditions. Nonetheless, sometimes it is possible to define a common flux limit, as in the case of Milvang-Jensen et al. (2012) sample. The case of afterglow spectra is even more complex as, in addition to inhomogeneous follow-up and target brightness, the Ly absorption along the GRB line of sight could affect the Ly emission detection and profile.
2.2 Data reduction
To perform the census, we reduced archival data of several X-shooter spectra of GRB host galaxies. We describe here the method applied for the data reduction. All observations of the host galaxies, the telluric stars, and the spectrophotometric standards were reduced in the same way using the version 2.8.5 of the X-shooter data reduction pipeline (Modigliani et al. 2010). Before processing the spectra through the pipeline, the cosmic-ray hits and bad-pixels were removed following the method of van Dokkum (2001). Then, we subtracted the bias from all raw frames and divided them by the master flat field. We traced the echelle orders and calibrated the data in spatial and wavelength units using arc-line lamps. The flux calibration was done using spectrophotometric standards (Vernet et al. 2009) and a correction for flexure was applied. Lastly, the sky-subtraction and the rectification and merging of the orders was done to obtain the final two-dimensional spectra. Additionally, the spectra were corrected for the Milky Way (MW) extinction using the extinction curve from Pei (1992). The values are obtained from the NASA Extragalactic Database (NED) and correspond to the extinction map of Schlafly & Finkbeiner (2011). The wavelengths of the extracted 1D-spectra were converted in the vacuum reference and corrected for the Earth’s rotation and revolution around the Sun (heliocentric correction). To optimally select the extraction regions we chose the spatial extension of the brightest emission line and applied this 1D extraction throughout the whole spectrum. When the Ly line is detected, we selected the extraction region according to the spatial extension of this line which can be larger than Balmer lines due to resonant scattering. Emission line fluxes were determined by fitting a Gaussian function to the data, setting the continuum flux density in a region close to the emission line. We also numerically integrated the flux over the line width as a comparison to control the consistency of the values and uncertainties. For the asymmetric line-profile of the Ly line, we use a skewed Gaussian parametrized as described in Vielfaure et al. (2020). When lines of interest were not detected, we estimated a 3 upper limit. For upper limits of nebular emissions, we use a FWHM in agreement with other nebular lines detected in the spectrum. For Ly line, similarly to Milvang-Jensen et al. (2012), we select the same width for all upper limits which is 900 km s-1 centered at 300 km s-1. The fluxes have been corrected for slit loss by calculating the flux difference between the observation of a telluric star (close in time and space to the observation of the GRB host, and with the same instrumental setup) to the tabulated values444The tabulated values of the magnitudes for the telluric stars have been taken from https://www.eso.org/sci/facilities/paranal/decommissioned/isaac/tools/spectra/Bstars.txt and http://simbad.u-strasbg.fr/simbad/ expected to be measured.
2.3 The TOUGH sample
We first focus on the TOUGH sample of 69 GRBs. The TOUGH Ly study (Milvang-Jensen et al. 2012) targeted the 20 GRBs with a redshift in the range , as known at the time of the Ly observing campaign. Subsequently as part of other TOUGH campaigns (Jakobsson et al. 2012; Krühler et al. 2012) and later work (Krühler et al. 2015) the redshift completeness of TOUGH has increased to 60/69 (Krühler et al. 2015). With respect to Milvang-Jensen et al. (2012), this includes adding redshifts for eleven TOUGH GRBs in the range (GRB: 050714B, 050819, 050915A, 051001, 060805A, 060814, 070103, 070129, 070224, 070328 and 070419B); all these hosts have VLT/X-shooter spectra.
We reduced the X-shooter data, as described in Sect. 2.2, to look for the detection of Ly emission. We find no LAEs among these eleven additional host galaxies. The new statistic of LAEs among LGRB host galaxies of the TOUGH sample is therefore .
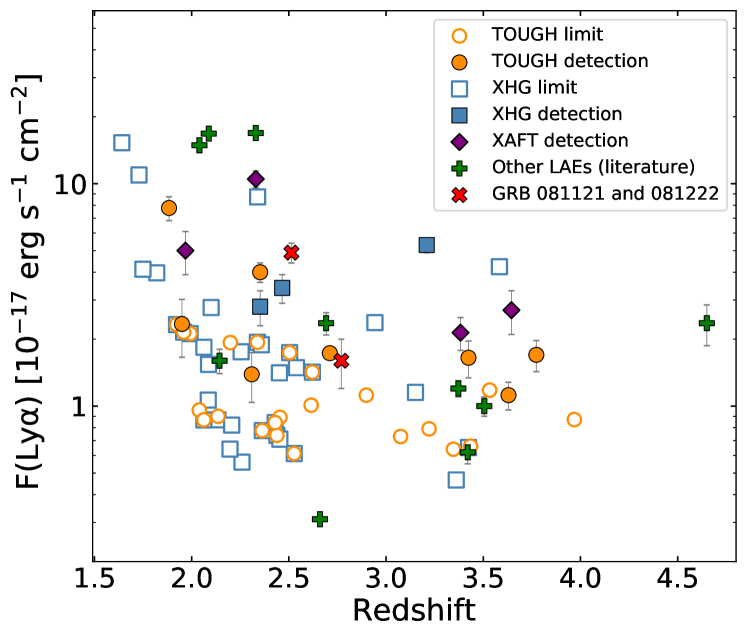
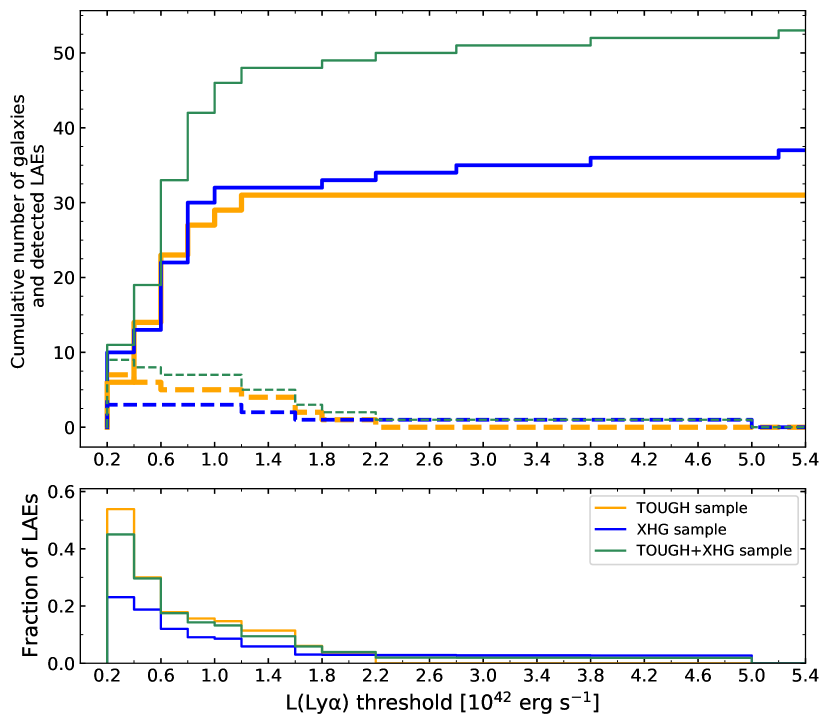
Taking into account the fact that the spectra have different flux limits (see Fig. 1 and 2), we determine the statistics of Ly detection above a flux cut of (corresponding to the lowest Ly detection of the TOUGH sample), a luminosity cut of (corresponding to the flux cut at the median redshift of the TOUGH sample, ), and the fraction of LAEs among the sample with a rest-frame Ly EW Å. To estimate the uncertainty on these statistics, based on the sample sizes, we perform a bootstrap method employing random resamples with replacement of the number of LAEs among the LGRBs considered for each cut. The results are reported in Table 1.
In principle, we can look for Ly emission also at . This would add three further objects from the TOUGH sample. They lack host galaxy spectral observations but these have afterglow spectra available in the literature (GRB 050904: Totani et al. 2006; GRB 060522: Tanvir et al. 2019; GRB 060927: Fynbo et al. 2009). They show no Ly emission but formal limits have not been determined.
2.4 The XHG and XAFT samples
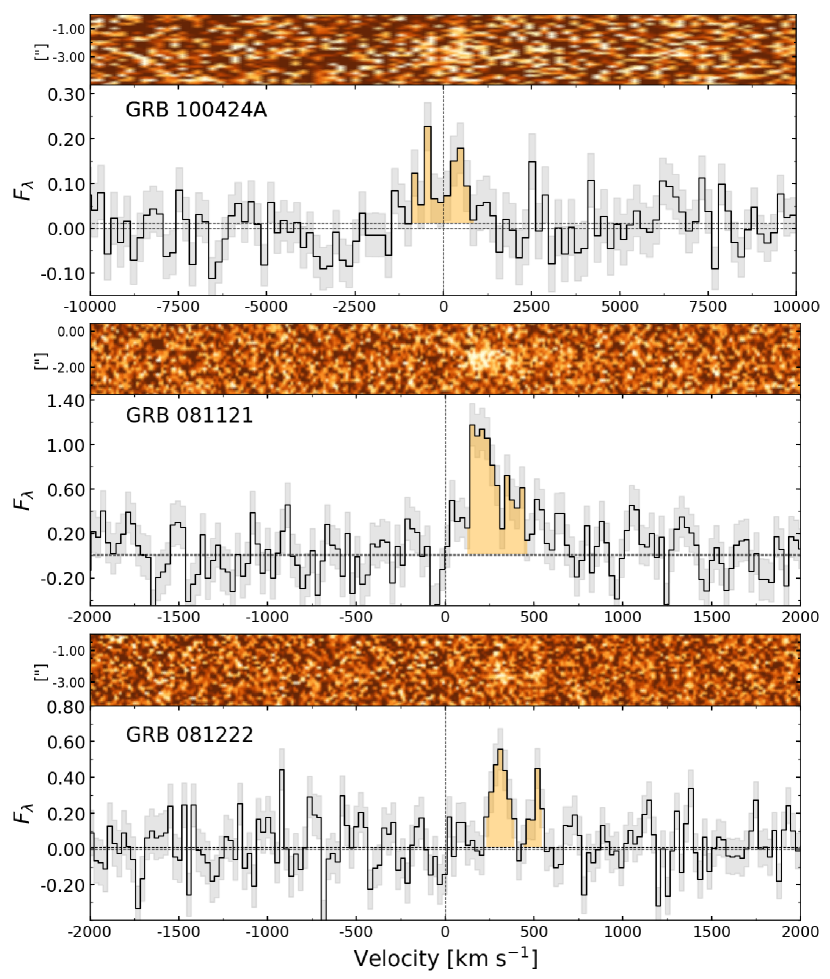
Krühler et al. (2015) presented the UVB-arm spectra for only three objects at of their XHG sample. Therefore, we reduce all the UVB spectra of the sample (following the procedure described in Sect. 2.2) and inspect them to look for Ly emission. We find three LAEs among the 37 host galaxy spectra at , corresponding to (see also Fig. 1). They are GRB 060926, GRB 070110 and GRB 100424A (also reported in Malesani et al. 2013). We will focus in more details on GRB 060926 and GRB 070110 in Sections 3.3 and 3.4. The unpublished 1D and 2D spectra of the host of GRB 100424A, showing its Ly detection, are reported in Fig. 3. The flux of the line corrected for Galactic extinction and slit loss is erg s-1 cm-2. The flux limits are much less homogeneous than for the TOUGH sample. We apply the same cuts as for the TOUGH sample and summarize the statistics in Table 1.
Finally, focusing on the XAFT sample, Selsing et al. (2019) report the detection of four LAEs (GRBs 121201A, 150915A, 151021A, 170202A) among their X-shooter afterglow sample of 41 LGRBs, corresponding to .
2.5 Overall detections
| Sample | ftot | ff | fL | f |
|---|---|---|---|---|
| TOUGH | (7/31) | (7/25) | (7/18) | (5/30) |
| XHG | (3/37) | (3/16) | (3/16) | (2/28) |
| TOUGH + XHG | (9/53) | (9/33) | (9/25) | (6/42) |
The results of the three samples presented above are detailed in the tables of Appendix A. By merging them and removing the overlapping cases, we find 14 LAEs out of 84 LGRB host and afterglow spectra. The statistics on the LAE-LGRBs (restricted to the host galaxy spectra only) are summarized in Table 1.
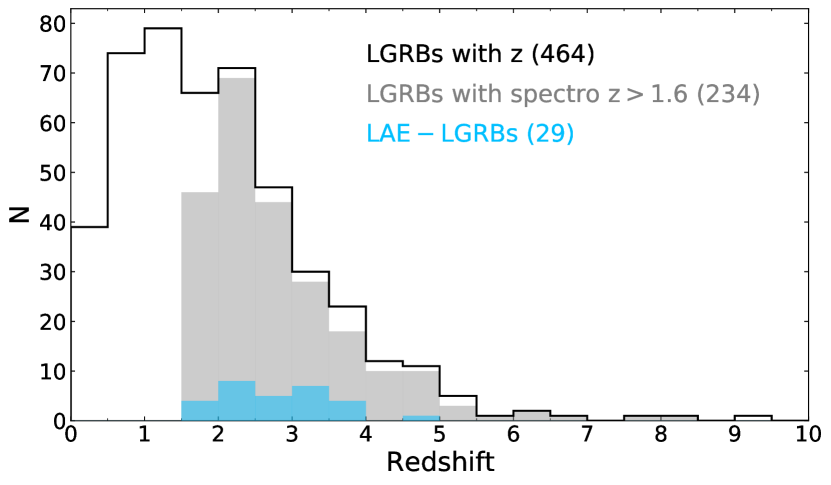
To complete the census, we should add to this merged sample the complementary LAE-LGRBs individually reported in the literature. To this purpose, we selected from two GRB databases666 http://www.astro.caltech.edu/grbox/grbox.php and http://www.mpe.mpg.de/~jcg/grbgen.html, maintained by D. Perley and J. Greiner, all LGRBs detected until December 1, 2020, with a spectroscopic redshift . This results in 234 LGRBs (see Fig. 4) with 193 having a spectrum covering the Ly line and for which it is possible for us to verify whether the Ly emission is detected. For those not included in the sample presented in the previous sections, we searched the literature for articles or Gamma-ray Coordinates Network (GCN777https://gcn.gsfc.nasa.gov/) Circulars claiming a detection of Ly line. If unpublished spectra were available in the ESO archive, we retrieved and reduced them.
Overall we found thirteen additional LAE-LGRBs from the literature, and two LAE-LGRBs from unpublished data: GRB 081121 at and 081222 . Both objects have X-shooter spectra (Prog. ID: 097.D-0672; PI: S.D. Vergani). We reduced the data following the procedure described in Sect. 2.2. Their Ly emission is shown in Fig. 3. The measured Ly fluxes of GRB 081121 and 081222 corrected for Galactic extinction and slit loss are and , respectively. Additionally to the Ly line, GRB 081121 shows the presence of the [OII] doublet, [OIII]5007 and H lines. Residual sky lines contaminate strongly the [OIII]4959 line and partially H. We determine erg s-1 cm-2, erg s-1 cm-2 and erg s-1 cm-2 (all corrected for Galactic extinction and slit loss).
In total, to date, there are 29 confirmed LAE-LGRBs (see Fig. 1 and 4). Eleven of them have Å, five are below this threshold and the continuum flux measurement is lacking for the rest of them. Table 15 of the Appendix gives a summary of the LAE-LGRBs and their Ly fluxes. These fluxes should be considered as lower limits. It is well known (Fynbo et al. 1999, e.g.,; Steidel et al. 2011, e.g.,; Wisotzki et al. 2016, e.g.,; Leclercq et al. 2017, e.g.,) that a significant fraction of the Ly emission of high-redshift galaxies takes place in Ly halos extending several kpc away of the galaxy. In our measurements we consider only the flux falling in the slit, without any correction taking into account the spatial distribution of the Ly emission of our objects (unknown for almost all of them).
2.6 Comparison of LAE-LGRB properties to LGRBs that are not LAEs and LAEs that are not LGRB hosts
LGRB host galaxies are selected in principle only based on the fact that they host a LGRB explosion. Therefore, they are star-forming systems, with a young star formation, and preferentially with sub-solar metallicity (see e.g., Lyman et al. 2017; Palmerio et al. 2019). In the following, we look at LAE-LGRB statistics and compare it to those of LAEs in galaxy surveys at a similar redshift range to see if these systems have an enhanced or suppressed Ly emission compared to the general population of star-forming galaxies. We also compare the properties of the LAE-LGRBs to those of LGRB host galaxies not showing Ly emission (Fig. 5) to try to identify possible driving factors of Ly escape. We stress that in some cases only a small fraction of objects in our samples have available information to be used for such comparison. We refer the reader to Tables in Appendix A for the values and references of properties discussed in the following and shown in Fig. 5.
In the survey of galaxies at presented by Steidel et al. (2004), 40% of galaxies with available spectra show the presence of Ly emission (are LAEs) and 10% have (Ly) Å (Erb et al. 2014). Reddy et al. (2008) found 65% LAEs for LBGs at , and 23% with (Ly) Å. Pentericci et al. (2010) found a fraction of 50% LAEs in their selected GOOD-MUSIC LBG sample at , and 18% with (Ly) Å. The LAE statistics of the TOUGH and XHG samples presented in previous sub-sections of Sect. 2 is lower than that of those studies (see Table 1, column ftot). However, the selection criteria of the parent sample are not the same and may contribute to this difference. Most of the above-mentioned studies are based on galaxies with magnitude brighter than mag. This corresponds to the median value of the TOUGH sample, and about a half of TOUGH LAEs are fainter galaxies. If we apply this selection to the TOUGH sample (hence reduced to 17 objects) we obtain a fraction of LAEs and LAEs having (Ly) Å. Those numbers should be considered as lower limits as the Ly flux limit reached by the Steidel et al. (2003, 2004) spectroscopic survey is deeper than ours (typically erg s-1 cm-2 instead of erg s-1 cm-2). The fraction of LAEs in the TOUGH sample could be as high as 47%, assuming that all the objects with flux limit values above that of the weakest detected Ly are all LAEs. Therefore, the lower statistics found for LGRB samples than for galaxy surveys could be explained by the different Ly flux limits. The magnitude selection of Pentericci et al. (2010) reaches mag. Applying the same cut to the TOUGH sample would not change so much the results compared to the mag cut.
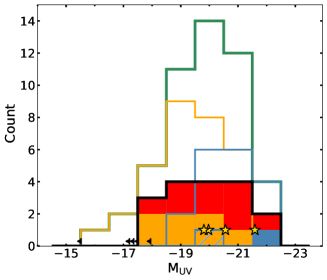
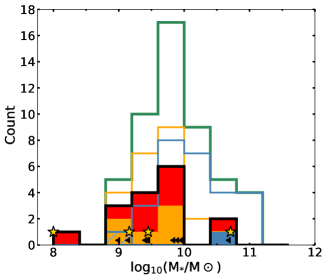
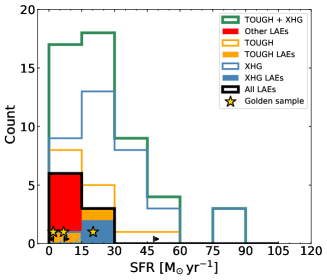
We do not find any particular correlation of the LGRB host galaxy properties (stellar mass, SFR, metallicity, UV magnitude, dust extinction or HI column density along LGRB line of sight) with Ly luminosity or , but our results are limited by the poor statistics. As shown in Fig. 5, whenever the information on the SFR of LAE-LGRBs is available, its value is below 30 , except for GRB 080602 which has a lower limit of 48 (Palmerio et al. 2019). If we focus on stellar masses, we see that LAE-LGRBs are associated preferentially with stellar masses , as also found by Pentericci et al. (2010) for LBG samples at . However, due to the poor statistics we cannot conclude if this is an intrinsic properties of LAEs or a consequence of the characteristics of the parent samples.
The low fraction of LAEs in the XHG sample is likely due to the difference in the MUV and stellar mass range covered by the TOUGH and XHG samples. Indeed, by construction, the latter is biased towards LGRBs with highly extinguished afterglows (Krühler et al. 2015), that on average may originate in more massive and dusty galaxies. Over the 30 objects of the XHG sample having information on E(B-V) (even if with large errors), 70% have E(B-V) values higher than the most extinguished LAE-LGRB in the sample. This is consistent with the fact that dust is considered having a significant impact on Ly suppression (Neufeld 1990; Laursen et al. 2009) and that LAEs are preferentially found in systems with low extinction (e.g., Shapley et al. 2003; Pentericci et al. 2007, 2010; Matthee et al. 2016). The metallicities of the LAE-LGRBs also support this trend as their values are among the lowest values of the TOUGH and XHG sample (see Appendix A).
| GRB host | Redshift | Exposure time (s) | Slit width | PA | Obs. date | Seeing | Airmass | ||||
|---|---|---|---|---|---|---|---|---|---|---|---|
| UVB | VIS | NIR | UVB | VIS | NIR | () | (”) | ||||
| GRB 011211 | 2.1434 | 1.0 | 0.9 | 0.9 | 101 | 2010-03-18 | 0.5 | 1.4 | |||
| GRB 021004 | 2.3298 | 1.6 | 1.5 | 1.5 | 41 | 2009-11-21 | 1.3 | 1.4 | |||
| GRB 060926 | 3.2090 | 1.0 | 0.9 | 0.9 | 47 | 2010-04-18 | 0.8 | 1.3 | |||
| GRB 070110 | 2.3523 | 1.0 | 0.9 | 0.9 | 42 | 2010-10-29 | 0.8 | 1.4 | |||
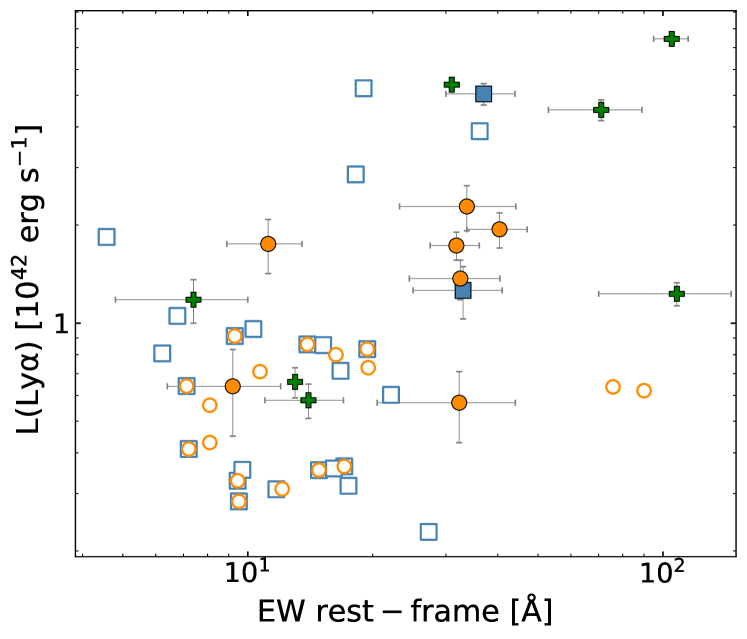
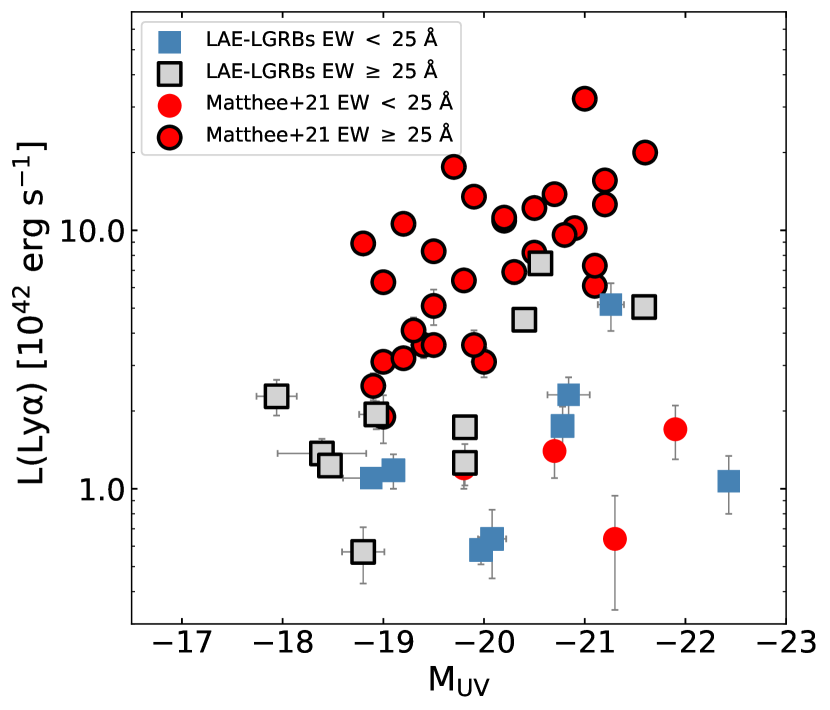
Matthee et al. (2021) predicted that the bulk of Ly population of UV galaxies with at should be below erg s-1, and the fraction of LAEs with Å should be of %. We can see in Fig. 6 that most of the THOUGH unbiased sample of LGRB hosts is below this limit. This is due to the fact that LGRB samples have no pre-selection except for the LGRB explosions. Therefore, LAE-LGRBs are representative of Ly emission from the bulk of UV-selected galaxies at . Furthermore, the fraction of LAEs with Å among the TOUGH sample is of , in agreement with Matthee et al. (2021) expectations for UV-selected galaxies.
3 The golden sample
| GRB host | H | H | [OII] | [OIII] | [OIII]/[OII] | SFR |
|---|---|---|---|---|---|---|
| [] | [] | [] | [] | [] | ||
| GRB 011211 | ¡ 0.4* | ¡1.2 | ¡ 1.6 | ¿ 1.7 | ¡ 2.0 | |
| GRB 021004 | * | ¡ 1.7 | ¿ 10 | |||
| GRB 060926 | * | |||||
| GRB 070110 | * |
| GRB host | F(Ly) | Ly red-peak shift | ||||
|---|---|---|---|---|---|---|
| [] | [Å] | [] | [] | [] | ||
| GRB 011211 | ¿ 0.16 | ¡ 10.4 | ||||
| GRB 021004 | ||||||
| GRB 060926 | ||||||
| GRB 070110 |
One of the strengths of GRBs is that they give us the possibility to combine the information on the host galaxy gas retrieved from the afterglow spectra with that obtained through direct host galaxy observations, once the afterglow faded. This advantage can be useful to characterize LAE-LGRBs and to test Ly models.
For this purpose, we selected from the census presented in Sect. 2 a golden sample of LAE-LGRBs fulfilling the following criteria:
-
(i)
Availability of both afterglow and host galaxy spectra;
- (ii)
-
(iii)
Detection of other host galaxy emission lines in order to determine the systemic redshift of the galaxy, the intrinsic Ly and galaxy properties.
We stress the importance of X-shooter observations to fulfill point (iii), thanks to its wide spectral coverage from nm to 2500 nm.
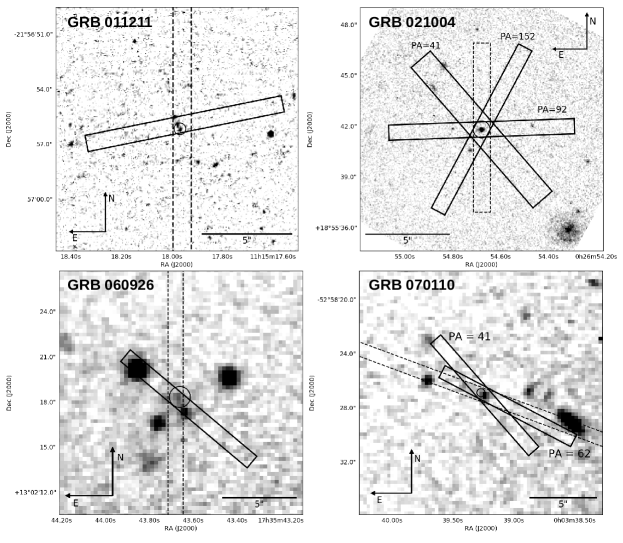
We find only four objects fulfilling the above-mentioned criteria: GRBs 011211, 021004 (reported independently in the literature), 060926 (part of the XHG sample), and 070110 (part of both the XHG and TOUGH sample). The images of their fields, with the slits used to obtain the afterglow and host-galaxy spectra, are shown in Fig. 7. We reduced the X-shooter spectra of the four GRB hosts (see log of the observations in Table 8) and measured the emission line fluxes (reported in Table 9 and 10) accordingly to the procedure described in Sect. 2.2. These fluxes only represent the Ly photons falling in the slit, without applying any correction to take into account the two-dimensional spatial extension of the Ly emission. If we consider a 2D-Gaussian approximation, the resulting fluxes would be on average a factor 2 higher. The Ly fluxes of these host galaxies have previously been reported in Milvang-Jensen et al. (2012). Our measurements using X-shooter spectra provide lower values but consistent within the uncertainties (at 2 or 3 ). This is a good agreement, taking into account that different observing techniques and slit position angles may cover different parts of the diffuse Ly emission.
For each host galaxy we determined the star-formation rate (SFR) (or put limits on it), and the Ly properties by the following method. We used the H flux (measured or converted from the H flux, assuming H; Osterbrock 1989) to derive the H luminosity corrected for Milky Way extinction (). We converted the H luminosity into SFR using the relation from Kennicutt (1998), scaled to the Chabrier (2003) initial mass function as:
| (1) |
We cannot retrieve information on the dust extinction of the four host galaxies from the emission lines, due to the detection of only one of the Balmer lines (H or H) in the spectra. Therefore, the SFR values are determined without applying any host-galaxy dust correction and should be considered as lower limits.
Under the assumption that the Ly and the Balmer lines originate from the same regions and are produced by the same recombination process, it is possible to infer the intrinsic properties of the Ly emission line from the H or H lines. We determined the (Ly) from a Gaussian fit of the H (or H) line profile that we corrected for instrumental dispersion. In case B recombination, the theoretical ratio between the Ly and the H lines is 8.7 (Brocklehurst 1971). Using this value and assuming no extinction, we converted the Balmer flux to intrinsic Ly flux (). We determined the (Ly) as the ratio of the observed Ly flux to the intrinsic one. Following the consideration on Ly fluxes reported above, the (Ly) values should be considered as lower limits. The rest-frame Ly equivalent width ()) is determined by dividing the rest-frame Ly flux by the Ly continuum level.
We will detail more on the analysis of the data of each GRB in the following sections. The fluxes of the identified lines, the SFR, and the Ly emission characteristics are reported in Tables 9 and 10.
In general, we remark that the Ly emission line profile and velocity spread of our sample (see next sections) are typical of LAEs at . Similarly to those of the XLS- sample of LAEs presented in Matthee et al. (2021), they show an asymmetric profile with a prominent peak redshifted from the systemic redshift of the host by km s-1, and extending over km s-1. However, the velocity shift of the ISM absorption lines detected in the afterglow spectra with respect to the systemic velocity of the galaxies ( km s-1) are not as high as the the XLS- sample ( km s-1), likely testifying of a more static environment.
3.1 GRB 011211
The photometry of the afterglow and host galaxy of GRB 011211 has been published in Jakobsson et al. (2003). The detection of Ly emission through narrow-band filters was reported by Fynbo et al. (2003). The host galaxy of GRB 011211 has a multi-component morphology (Jakobsson et al. 2003; Fynbo et al. 2003). The GRB site is in the southeast part of the system, while the Ly emission peaks in the central-north part of the system and extends over the entire system.
We present here the X-shooter observation of the host galaxy (Prog. ID: 084.A-0631; PI: S. Piranomonte, see Table 8), not previously published. At the afterglow position, we clearly identify the [OIII] doublet and Ly line (see Fig. 8). From the [OIII], we derive a redshift of . The Ly peak is redshifted by compared to the host galaxy redshift. The observed Ly line properties are reported in Table 10. The spatial extension of the Ly line in the 2D spectrum is 25, compared to 18 for the brightest nebular emission line [OIII]. From the upper limit on the H flux we determine a . Perley et al. (2013) obtained an average dust attenuation of mag from the host galaxy Spectral Energy Distribution (SED) fitting.
The afterglow spectrum shows the detection of the GRB Damped Ly system (DLA) with (Vreeswijk et al. 2006), with many associated absorption lines. From the low-ionization state lines (LIS) redshift reported by Vreeswijk et al. (2006) we determine the velocity of the ISM with respect to the systemic redshift of the host galaxy, , with important uncertainties due to the low resolution of VLT/FORS2 spectra. The Ly emission peak would fall in the Ly absorption trough but is not detected in the afterglow spectra, likely due to a combination of line faintness, spectral resolution and noisy spectral region. From the power-law fitting of the afterglow, Jakobsson et al. (2003) determined mag along the line of sight.
3.2 GRB 021004
The afterglow and host galaxy of GRB 021004 have been intensively observed (see Fynbo et al. 2005 and references therein). Møller et al. (2002), showed the presence of Ly emission in the optical spectrum of the GRB afterglow, which was later confirmed by many other works (e.g., Mirabal et al. 2003; Starling et al. 2005). The host galaxy of GRB 021004 has a compact core with a faint second component and the GRB site is located at the center of its host (Fynbo et al. 2005). The X-shooter observation of the host galaxy (Prog. ID: 084.A-0631; PI: S. Piranomonte, see Table 8) has previously been published in Vergani et al. (2011). In Fig. 7, we show the image of GRB 021004 field with superimposed the slits used to observe the host galaxy and the afterglow. Vergani et al. (2011) report the detection of [OIII] emission line, at the same redshift as the GRB, from the galaxy eastward of the GRB host in the spectrum obtained with the slit position angle PA=92∘. Its proximity to the GRB host (projected distance of 14 kpc) may indicate a possible interaction between this galaxy and the GRB host.
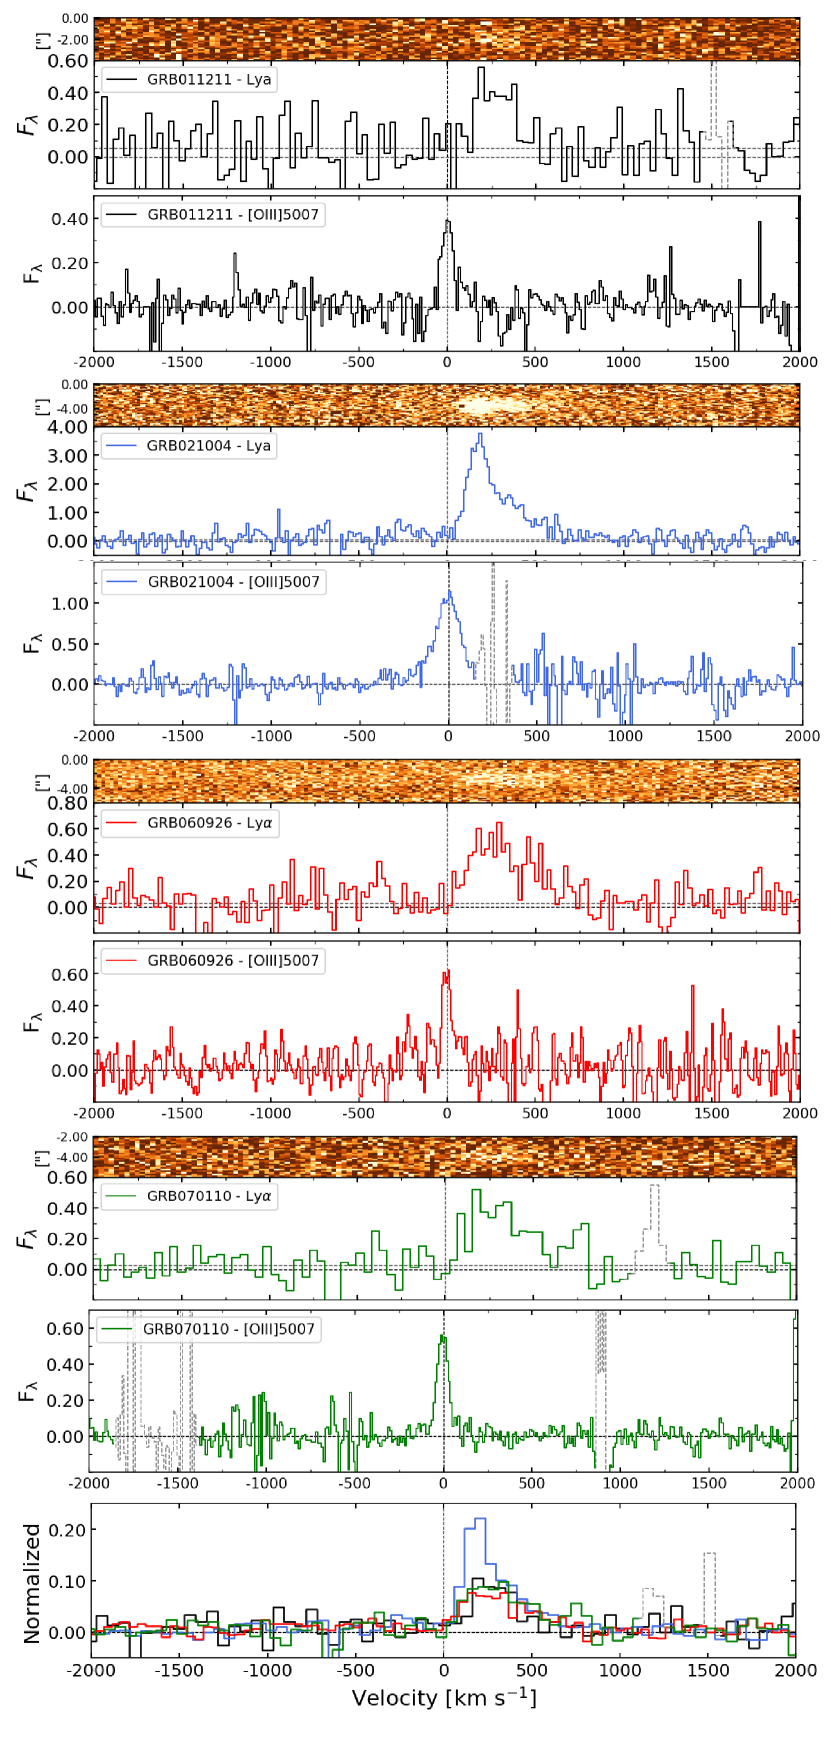
For our analysis we used the X-shooter spectrum obtained with slit PA of 41∘ that, due to its larger slit width, minimizes the loss of Ly flux. We reduced the spectrum following the procedure described in Sect. 2, and identify the [OIII] doublet, H and Ly emission lines (see Fig. 8). H falls exactly on a sky line and the [OII] doublet is not detected ( upper limit of ). We derive a redshift of for the host galaxy. We estimate the line fluxes and SFR following the procedure described in Sect. 3. We find a M (without host extinction correction). The Ly emission from the host galaxy is an asymmetric line redshifted by with an Å. The spatial extension of the Ly line in the 2D spectrum is 47, compared to 20 for the brightest nebular emission line [OIII]. The SED fitting performed by de Ugarte Postigo et al. (2005) determined mag, whereas Perley et al. (2013) report mag.
The Ly emission is also detected in the afterglow spectrum at the same velocity and with a similar shape profile as that detected in the host galaxy spectrum. The afterglow spectrum shows also the Ly absorption of the GRB sub-DLA system, with (Fynbo et al. 2005).
The VLT/UVES afterglow spectrum of GRB 021004 presents a plethora of absorption lines with complex velocity structures (Fiore et al. 2005; Chen et al. 2007; Castro-Tirado et al. 2010), spanning thousands of km s-1. Although a progenitor-star wind origin was claimed, this was firmly excluded (at least for some of these absorbing systems) by the detection of low-ionization transitions (see Chen et al. 2007). Here we focus only on the lowest velocity component, associated with the GRB sub-DLA, therefore likely representing the cold and warm ISM gas of the GRB host galaxy. Using the shift of the AlII and CII LIS from the systemic redshift of the galaxy, we determine a ISM velocity . From the spectral flux distribution of the afterglow at several epochs, de Ugarte Postigo et al. (2005) determined an average mag along the GRB line of sight.
3.3 GRB 060926
In the VLT/FORS1 image (Prog. ID: 079.A-0253(A); P.I.: P. Jakobsson) shown in Fig. 7, we see an offset between the GRB position and the brightest part of the system. Both are covered by the slit used for the host spectroscopic observations. In the X-shooter host galaxy observations obtained under program 085.A-0795(A) (presented here for the first time; PI: H. Flores; see Table 8), we identify the [OIII], [OII], H and Ly lines (see Fig. 8). These lines, except Ly, are used to derive a redshift of for the host galaxy which is consistent with the redshift derived in Krühler et al. (2015) with a different data set. Even with seeing conditions of 08, from the emission lines it is not possible to separate the different parts of the host galaxy systems. The spatial extension of the Ly line in the 2D spectrum is 27, compared to 14 for the brightest nebular emission line [OIII].
Due to the high redshift of the host, the wavelength coverage of X-shooter does not allow us to observe the H line. We determine a SFR , assuming (Osterbrock 1989). As we do not have any information on the host extinction, the value inferred above should be considered as a lower limit of the SFR. The Ly emission from the host galaxy is an asymmetric line redshifted by from the systemic redshift. The observed Ly equivalent width and intrinsic properties are reported in Table 10.
The afterglow spectrum of GRB 060926 has been published in Fynbo et al. (2009). The Ly line is clearly detected in the trough of the DLA. From the SiII, AlII and CII LIS redshift, we determine a ISM velocity of . The HI column density derived from the fit of the Ly absorption (Fynbo et al. 2009) is among the highest values probed by GRB afterglow, .
3.4 GRB 070110
The near-infrared X-shooter spectrum of GRB 070110 host galaxy has been studied in Krühler et al. (2015), but the UVB spectrum has not been previously published. The [OIII], [OII], H and Ly lines are identified in the host galaxy spectrum (see Fig. 8), allowing a redshift determination of . The measured H flux corresponds to a SFR . The Ly emission from the host galaxy shows an asymmetric profile and is redshifted by from the systemic redshift (see also Table 10 for other Ly properties). The spatial extension of the Ly line in the 2D spectrum is 21, compared to 20 for the brightest nebular emission line [OIII].
The afterglow spectrum of GRB 070110 has been published in Fynbo et al. (2009). They report the detection of the Ly emission line in the trough of the GRB-DLA. From the SiII, AlII and CII LIS redshift, we determine an ISM velocity . The HI column density derived from the fit of the Ly absorption (Fynbo et al. 2009) is . Troja et al. (2007) determined mag along the GRB afterglow line of sight.
4 Modelling of the Lyman-alpha line
| Shell model results from unconstrained fitting | |||||||
|---|---|---|---|---|---|---|---|
| GRB host | (Ly) | (Ly) | |||||
| [] | [] | [Å] | |||||
| GRB 011211 | |||||||
| GRB 021004 | |||||||
| GRB 060926 | |||||||
| GRB 070110 | |||||||
| GRB host | RedshiftHG | (Ly) | (Ly) | Refs | ||||
|---|---|---|---|---|---|---|---|---|
| [] | [mag] | [] | [Å] | |||||
| GRB 011211 | 2.1434 | * | ¡ 64 | (1) | ||||
| GRB 021004 | 2.3298 | (2) | ||||||
| GRB 060926 | 3.2090 | - | - | |||||
| GRB 070110 | 2.3523 | (3) |
References: The values are reported in (1): Jakobsson et al. (2003); (2): de Ugarte Postigo et al. (2005); (3): Troja et al. (2007), see Sect. 3 for more details.
4.1 Description of the model
Following Vielfaure et al. (2020), we model the observed Ly line with the ”shell-model” fitting pipeline described in Gronke et al. (2015). This simplistic model consists of an expanding, homogeneous, spherical shell composed of uniformly mixed neutral hydrogen and dust (Ahn et al. 2003; Verhamme et al. 2006). The expanding geometry was motivated by the HI outflows which seem to be ubiquitous at both low- and high-redshifts (e.g., Shapley et al. 2003; Wofford et al. 2013; Rivera-Thorsen et al. 2015; Chisholm et al. 2015). The Ly emitting source is placed at the centre of the sphere filled with ionized gas and surrounded by a neutral and dusty shell. This source would correspond to the star-forming region hosting the LGRB. Such assumption is reasonable considering that LGRBs are produced by massive stars and are found in the central star-forming region of their host (typically at 1 kpc from the center, Lyman et al. 2017, e.g.,). The photons are collected in all directions after their scattering through the neutral shell.
The shell model is defined by seven parameters that we briefly detail here. Four parameters describe the shell properties:
-
•
the radial expansion velocity (). This parameter is physically linked to the broadening and the peak shift of the Ly line. For outflowing shell, the velocity expansion regulates the blue peak intensity by scattering the photons in the red wing of the line. A higher velocity of the gas increases these effects but suppresses the interaction of the photons with the neutral gas. See for example Verhamme et al. (2006) for more details on this effect. The of the neutral gas can be linked to the velocity shift of the LIS lines () when available.
-
•
The HI column density (). The effect of increasing is to broaden the line by shifting the Ly photons from the line center.
-
•
The dust optical depth () at wavelengths in the vicinity of Ly. The dust grains absorb and scatter the Ly photons. An increasing dust content will favor this process and affect the intensity of the line but can also affect its shape. An increasing boosts the interaction of the photons with dust so both parameters are linked.
-
•
The effective temperature of the gas (T). Its effect is complex and its impact on the width of the line and the position of the peak depends on the other parameter values.
We consider a Gaussian profile for the intrinsic Ly emission and an adjacent flat UV continuum, therefore three additional parameters are used:
-
•
the redshift of the emitter (z) corresponding to the center of the intrinsic Ly line;
-
•
the intrinsic equivalent width of the Ly line ();
-
•
the intrinsic FWHM of the Ly line ().
We refer the reader to Verhamme et al. (2006) and Gronke et al. (2015) for a more detailed description on the model and parameters. The observation of LGRB host galaxy and afterglow allows us to constrain these parameters even for faint star-forming galaxies. However, while host galaxy observations provide information for the overall galaxy, the afterglow constrains parameters along the LGRB line of sight. Therefore, by using the shell model with afterglow observations we assume that the LGRB region is the main source of Ly emission in the host, and that the LGRB line of sight probes gas properties characteristic of the environment surrounding the LGRB region. In the following, to differentiate between the parameters constrained by these two types of observation, we annotate with XOA the parameters related to optical afterglow observations and XHG the host galaxy ones. As a first step, we fit the observed Ly lines without constraints, as it would typically be done for the majority of high-z LAE observations, where most of the parameters can hardly be constrained observationally. Then, we fit the Ly profiles using the observational constraints, discussing as well the effects of constraining the parameters with only the host galaxy or afterglow observations.
4.2 Unconstrained Ly profile fitting
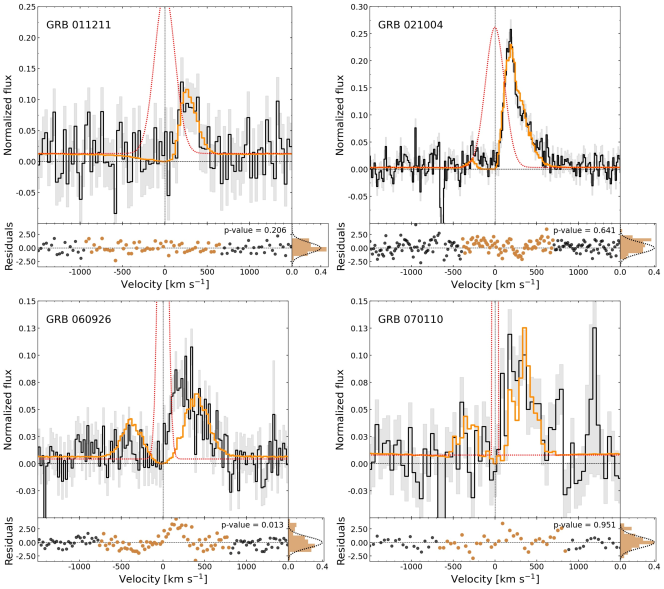
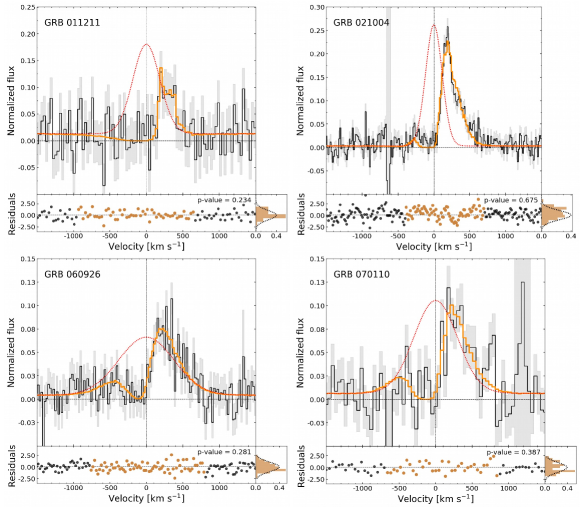
To evaluate the predictions of the shell model, we fit the observed Ly lines of the four LGRBs of the golden sample using an improved model grid and process originally described in Gronke et al. (2015), without considering any prior. The automatic fitting succeeds in reproducing the line profile satisfactory in all four cases. In Fig. 9, we present for each spectrum the best fit corresponding to the lowest . In all cases but GRB 011211 the models fit a blue peak which is not clearly seen in the spectra but consistent with the uncertainties. The distributions of normalized residuals presented at the bottom of each spectrum are consistent with a unit Gaussian distribution, indicating a good agreement between the models and the observations.
While the unconstrained shell model succeeds in reproducing the observed profiles, the comparison between the best shell parameters returned by the fitting (Table 11) and the corresponding values determined from the observations (Table 6) reveals important discrepancies for GRB 060926 and GRB 070110. Their observed HI column density is higher than the fit results, and the fitting values are largely overestimated.
The Ly escape fraction ((Ly); see Table 7) is also a by-product of the shell model and is found to be consistent (within the uncertainties) with the value determined from the observations (see Table 10) only in the case of GRB 070110. Particularly, (Ly) is discrepant for GRB 011211 and 021004 whereas the fit and best-fitting parameters are in agreement with the observations. The disagreement on (Ly) implies also that the H flux and subsequent SFR obtained by the fit are inconsistent with the values determined from the observations (see Tables 9 and 7). For GRB 011211 the H flux is less constrained (only upper limit) but a lower H flux would imply an increased difference. We caution, however, that the Ly escape fractions derived from the spectral fitting procedure is highly uncertain as it depends on the fitted value of which mostly has only minor effects on the spectral shape (see discussion in Gronke et al. 2015). The disagreement could also come from the lack of extinction correction of the observed H flux in our calculation of (Ly) and SFR (see Sect.3). An mag for both GRB 011211 and 021004 (considering an SMC extinction curve; Japelj et al. 2015) would result in consistent H and (Ly) values within .
| Values obtained from the unconstrained fitting results | ||||
|---|---|---|---|---|
| GRB host | (Ly) | SFR(H) | ||
| (1) | (2) | (3) | (4) | |
| 011211 | ||||
| 021004 | ||||
| 060926 | ||||
| 070110 | ||||
| Shell model results from constrained fitting | |||||||
| GRB host | log(T/K) | (Ly) | (Ly) | ||||
| [km s-1] | [km s-1] | [Å] | |||||
| GRB 011211 | |||||||
| GRB 021004 | |||||||
| GRB 060926 | |||||||
| GRB 070110 | |||||||
Notes. Same as Table 11 for models constrained with z, , , , and
4.3 Constrained Ly profile fitting
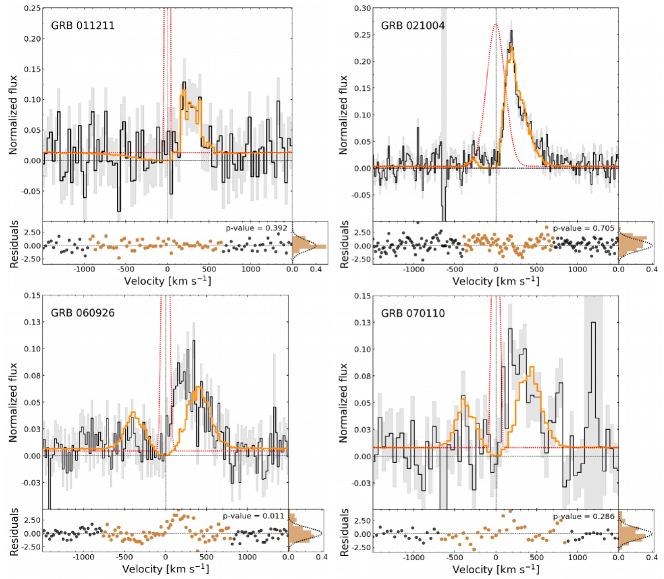
We then proceeded to fit the Ly using the observational constraints described in Sect. 3 and listed in Table 6, as priors. Using the afterglow and host galaxy spectra, as described in Sect. 3, we are able to constrain up to 6 out of the 7 parameters taken as input by the model. The host galaxy observations provide the information on the observed Ly line and the Balmer lines used to constrain the intrinsic Ly emission ((Ly) and (Ly)). They also provide the nebular emission lines used to constrain the redshift (). The afterglow observations constrain the gas properties: the hydrogen column density (), the velocity of the gas () and the information on the dust content (). It was not possible to constrain the HI temperature. The effect of this parameter on the final profile is complex and usually it is degenerated with the other parameters (Gronke et al. 2015). We let this parameter free for the 4 cases. For GRB 060926 we lack information about the dust extinction, and for GRB 011211 we have only upper limits for H. To be consistent with the constraints on the values derived from the afterglow, the dust extinctions are taken from the afterglow SED fitting reported in Sect. 3. The grid we use does not extend up to , so this value is not firmly constrained for GRB 060926 but constrained to the highest value of the grid which is 21.8. We report the results of the fitting in Table 8. In Fig. 10, the intrinsic Ly derived from the model and the best fit obtained with the lowest are superimposed to the data.
Not surprisingly, we find a good agreement between the fitting and the observations of the two hosts with lower (GRB 011211 and 021004). As shown by the residuals at the bottom of Fig. 10, the fit is worse than in the unconstrained case for GRB 070110 and fails to reproduce the Ly profile and parameters for GRB 060926, which has an extreme value of 22.6. In these two cases the models tend to fit a double peak profile with higher red peak velocity shift () than observed () and quasi-static HI shell () which results in a double peak profile. By relaxing the constraints, without considering priors for , we manage to fit the profile of GRB 070110 in a better way but the best-fitting becomes extremely narrow with an unrealistic value of .
We also performed two sets of fitting constraining separately the parameter values determined from the host galaxy and the afterglow observations. We find that the profiles of the fitting constrained with the host galaxy observations (, (Ly) and (Ly)) are very similar to the unconstrained cases, well reproducing the data (see Appendix C). Differently from the unconstrained case, the blue peak is not present, which is due to the constraint on (Ly). The predictions for the properties of the gas are also similar to the unconstrained cases. Especially, the values are lower than observed through LGRB line of sight. The fitting constrained with the afterglow observations (, , and ) only gives very similar results to the fully constrained case (see Appendix D). The models successfully reproduce the low cases but fail to reproduce the two cases with high values.
These results are in agreement with previous finding that the most constraining parameters are and (e.g., Gronke et al. 2015).
5 Discussion
5.1 Implications of the shell-model fits
The unconstrained fitting succeeds in reproducing all Ly profiles of the golden sample (and GRB 191004B; see Vielfaure et al. 2020). However, if we compare the parameter values resulting from the fitting with those observed, we find that for GRB 060926 and GRB 070110 there are important discrepancies. A fit performed constraining the parameters values with the observed ones does not succeed in reproducing the observed line profile of these two cases.
The provided by the unconstrained models for GRB 060926 and 070110 are very large and disagree with the we determined assuming that the Balmer photons and Ly photons are produced by recombination in the same regions. Such high values are usually returned by the shell model fitting to reproduce the line profile of the emitters having Ly peaks and wings substantially shifted from the systemic redshift. A similar discrepancy has also been found by Hashimoto et al. (2015) in the study of LAEs and in the Yang et al. (2016) and Orlitová et al. (2018) studies on low-redshift GP galaxies. The latter also reports a discrepancy between the systemic redshift derived from the models and the observed ones, whereas they agree in our case. Hashimoto et al. (2015) propose that other sources of Ly emission than star formation, such as gravitational cooling, could account for the large intrinsic width of the Ly emission line. Orlitová et al. (2018) try to explain the FWHM discrepancy considering complex kinematic structures (as testified by broad H and H wings observed in their GP spectra) but with negative results. They conclude that the discrepancy is a model failure and not a physical effect. From our data we cannot recover possible kinematic structures. A likely cause for the mismatch is a widening of the ”intrinsic” Ly spectrum due to radiative transfer effects (as discussed, e.g., in Yang et al. 2016). In fact, the study of Gronke et al. (2018) supports such a scenario (also see the recent study by Li et al. 2020, where km s-1 observed spectra were modeled with narrow intrinsic spectra). There, the authors post-process a hydrodynamic simulation of a galactic disk using Ly radiative transfer, and show that the spectrum is indeed widened compared to H due to ISM turbulence (cf. their figure 1 where the intrinsic spectrum of width 100 km s-1 is widened to 400 km s-1 due to radiative transfer effects within the gaseous disk)141414In Gronke et al. (2018), the subsequent effect of the “shell” can be taken quite literally as they consider cosmic-ray driven outflows which are likely smooth and cold (e.g., Girichidis et al. 2018) – like a shell. However, in general this can also be due to CGM effects, or, a lack of numerical resolution leading to a “shell” by smoothing out otherwise multiphase structure (Gronke et al. 2018).. This could in principle explain the effect seen here where the intrinsic width obtained from the shell-model fitting is much wider than the one inferred from the observations.
Another important discrepant value is . The fit returns lower values than those determined from the afterglow spectroscopy in half of our sample. The two GRBs of the discrepant cases have much higher than the other GRBs in the golden sample, with as opposed to values of . The Ly emission corresponds to a resonant transition making its escape unfavorable when the photons pass through a static high-HI density medium. In the shell model, impacts the Ly peak shift, with low values corresponding to small shifts and vice-versa. Indeed, when we constrain its value, the model is not able to reproduce the line profile for GRB 060926 and 070110, and results in a peak shifted to larger velocities (400 km s-1).
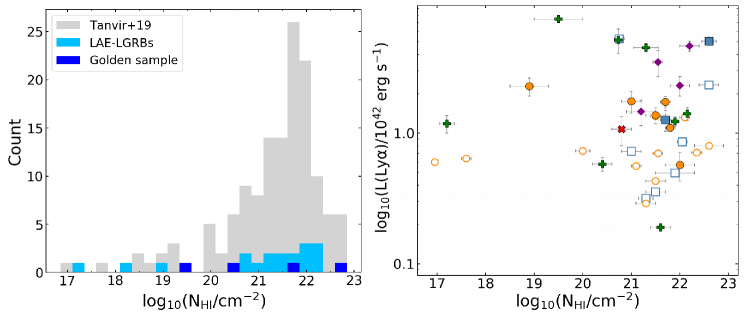
When considering all the LGRBs with a measured (reported in Tanvir et al. 2019), we see (Fig. 11) that such high values are common among LAE-LGRBs. Even if the fraction of LAE-LGRBs from sub-DLA/Lyman-limit systems (; ) seems to be higher (considering also the poor statistics) than that from DLA (; ), there is no strong evidence for Ly suppression associated with high . Also, the Ly luminosity seems not to depend on (see Fig. 11, right panel).
The discrepancy among the observed values and those found by the fitting, as well as the high values found among LAE-LGRBs, could be explained by the difference between the medium probed by Ly photons and the afterglow emission. LGRB lines of sight may go through regions with high , while Ly photons may have escaped through lower lines of sight from the GRB young star-forming region. This would imply an anisotropic environment. The theoretical studies of resonant line transfer through simplified anisotropic geometries (e.g., Dijkstra & Kramer 2012; Behrens et al. 2014; Eide et al. 2018) as well as turbulent medium with ionized channels (e.g., Kimm et al. 2019; Kakiichi & Gronke 2019) show that Ly spectra are shaped by the lowest density pathways. This predicts that in general, the column density probed by Ly is less or equal to the one observed along the line of sight, in agreement to what we find for the LAE-LGRB modelling presented here. To put constraints on the HI anisotropy is important also to the consequences this can have on the ionizing escape fraction of galaxies (e.g., Vielfaure et al. 2020). Already from this work where we find 2-3 in two of the cases, we can speculate that it is difficult to explain this large anisotropy by purely turbulent driving. For reasonable Mach numbers studies show only 1 dex difference (for of the sightlines; Safarzadeh & Scannapieco 2016) which suggests the need of radiative or mechanical feedback causing larger anisotropies (Kimm et al. 2019; Kakiichi & Gronke 2019; Cen 2020).
The study of LGRB lines of sight shows that, from a statistical point of view, low-density channels surrounding star-forming regions should be rare (Tanvir et al. 2019). This is consistent with LGRB progenitors being massive stars typically formed in dense molecular clouds and residing in gas-rich star-forming galaxies (e.g., Jakobsson et al. 2006). The observation of the time-variability of fine-structure transitions, in LGRB afterglow spectra, has shown that the distance of the dominant absorbing clouds ranges from 50 pc to 1 kpc (e.g., Vreeswijk et al. 2013). The neutral gas probed by LGRB afterglows should therefore be connected to the star-forming regions where LGRBs explode. Since these regions are also expected to be the main birthplaces of Ly photons, the properties of LGRB lines of sight could represent the average conditions of the environment surrounding Ly emission regions. If we consider the proportion of sub-DLA LGRBs as representative on average of the low-density channels through which the gas has favourable conditions for the Ly radiation to escape, they would correspond to 12% of all the possible lines of sight151515Interestingly, previous studies of anisotropic Ly escape show that such low opening angles can in principle be sufficient to set the properties of the isotropically emergent spectrum (Dijkstra et al. 2016; Eide et al. 2018; Kakiichi et al. 2018)..
Even if LGRBs sites pinpoint regions with high star-formation activity (and therefore a significant production of Ly photons), another possibility to explain the discrepancy is that most of the Ly photons that succeed to escape from the galaxy may not originate from the young star-forming regions probed by GRBs (as also proposed by Vreeswijk et al. 2004 for GRB 030323). One way to investigate both scenarios would be through galaxy simulations, studying the global, the line of sight and the Ly emission properties and comparing them to those determined by LGRB afterglow and host observations. This is beyond the scope of this paper and will be the object of a further paper.
The situation is even more complex if we look at the morphological properties of the host galaxies in more detail. The images of the host galaxies reveal a patchy and irregular morphology (see Fig. 7). The HST images obtained for GRB 021004 (Fynbo et al. 2005) shows that the GRB position is superimposed to the strongest UV emitting region. This is not the case for GRB 011211 (Fynbo et al. 2003), where the Ly emission envelops the entire galaxy but the peak of emission is clearly separated from the GRB position. Interestingly, this does not prevent the match between the shell model and the observations. A complex morphology is also found for other LAE-LGRB hosts (GRB 000926 Fynbo et al. 2002, GRB 050315 and GRB 061222A Blanchard et al. 2016). Such irregular and clumpy systems may represent mergers (e.g., Conselice et al. 2003) or just clumps of star formation. The presence of a companion galaxy 15 kpc away from the GRB 021004 host, and the high velocity absorption found in its afterglow spectra, may suggest interaction of the two galaxies and the presence of outflowing gas. In this light, the success of a very simple configuration as the one of the shell model in reproducing the Ly profile and the observed parameters is maybe surprising.
5.2 Comparison to LyC leakers
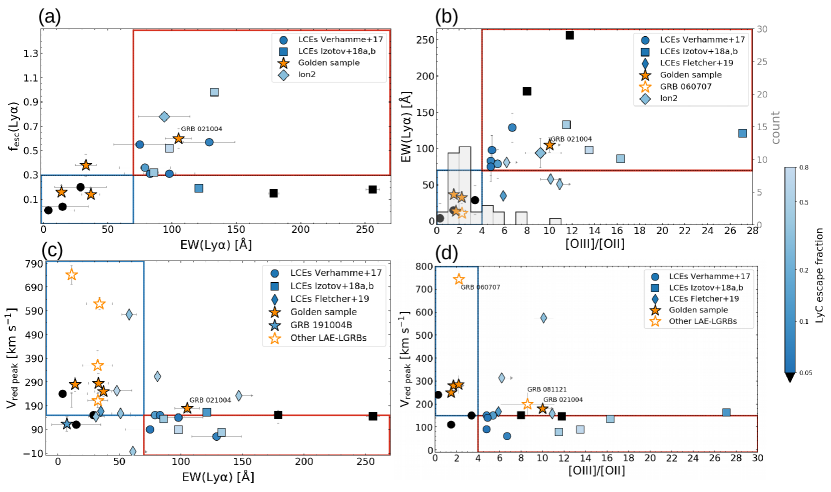
In Fig. 12, we compare properties of LAE-LGRBs to those of known LyC leakers in the literature. For this comparison, we consider the LyC leakers at reported by Fletcher et al. (2019) and Ion2 (, de Barros et al. 2016; Vanzella et al. 2016). We also consider those detected in the local Universe analysed in Verhamme et al. (2017) as well as the green peas studied in Izotov et al. (2018a, b). The properties compared are the Ly escape fraction, the rest-frame Ly equivalent width, the Ly red peak velocity () and also the [OIII]/[OII] ratio (O32). The last three properties have been proposed in the literature to correlate with ionizing and Ly photons leakage. Verhamme et al. (2017) have pointed out rest-frame EW(Ly) Å, (Ly) , km s-1 and O as good indirect indicators of high LyC leakage ( ¿5%). The O32 ratio is a proxy of the ionization state of the gas in the star forming regions and has been proposed as a marker of density-bounded HII regions (Jaskot & Oey 2014; Nakajima et al. 2013; Nakajima & Ouchi 2014; Stasińska et al. 2015). Its positive correlation with the escape fraction of ionizing and Ly photons leakage have been shown in several studies for local GPs or high-redshift LAEs (e.g., Nakajima & Ouchi 2014; Izotov et al. 2016, 2018a, 2018b; de Barros et al. 2016; Verhamme et al. 2017; Fletcher et al. 2019).
From the comparisons we see that, except for GRB 060707 and GRB 060605 that show very high , the LAE-LGRBs fall in the same parameter space as LyC leakers and follow the correlations between the indirect indicators found by Verhamme et al. (2017). Following the study of Verhamme et al. (2017) on low-redshift LyC leakers, we can cut these plots in two regions corresponding to strong LyC leakers ( %, red rectangle) and weak LyC leakers ( %, blue rectangle). All LAE-LGRBs fall in the category of the weak LyC leakers except GRB 021004 which appears systematically in good agreement with the region of the strong leakers. In panel (b) of Fig. 12, we also superimposed the distribution of [OIII]/[OII] ratio for the GRB sample of Krühler et al. (2015) and GRB 081121 reported here. We see that for the majority of the GRBs this ratio is around two, with seven cases at . GRB 021004 has a high value of and is the strongest LAE of our golden sample with a substantial (Ly) of 60%, in agreement with potentially high . Nevertheless, the Ly profile of GRB 021004 is a single peak with no residual flux at the Ly line center. This is not the typical line shape observed for confirmed LyC emitters which have the tendency to show double- or triple-peak profile (Verhamme et al. 2017; Rivera-Thorsen et al. 2017; Vanzella et al. 2020). Also our shell-model fitting suggests the column densities to be too large to allow LyC photons to escape. However, this model already predicted similar HI column density (/cm ) for four Green Pea galaxies out of the five with detected LyC emission reported in Yang et al. (2017), suggesting that LyC emission can escape through holes in the ISM even if the Ly photons probe denser neutral gas. The only LAE-LGRB for which LyC leakage has been detected along the LGRB line of sight ( =) is GRB 191004B (Vielfaure et al. 2020). However, in Fig. 12 (panel (c)) we can see that it does not fall in the high escape fraction region but in the lower left area. The reasons could be that (i) is lower at the scale of the galaxy than along the LGRB line of sight, and (ii) the indicators of strong LyC leakage evolves with redshift. As a comparison, the LyC emitters from Fletcher et al. (2019) are found out of the high escape region (red rectangle). They show lower rest-frame EW(Ly) and higher than the local LyC emitters whereas their escape fraction of ionising photons is significantly higher ( %). This could also suggest that strong LyC leakers span a wider parameters space than predicted by the study of local LyC emitters. Overall it is clear that this kind of studies are still limited by the poor statistic and the current results show the difficulty of characterizing LyC leakage based only on these properties.
6 Conclusions
In this paper we have studied the Ly emission of LGRB host galaxies. First, we provide a new census of LAEs among LGRB host galaxies. To date, there are 29 LAE-LGRBs. The fraction of LAEs among LGRB hosts varies from 10% to 40% depending on the sample and threshold considered. Such statistics are lower than those found for LBG samples at similar redshift range, but they become comparable when taking into account only LAEs with rest-frame EW(Ly) Å. These results can be explained by the different selection criteria of the parent samples and by the shallower spectral observations of LGRB samples compared to LBG ones. We compared the properties of LAE-LGRBs to those of LGRB hosts in general and find evidences of Ly emission suppression in dusty hosts. We showed that, since LGRB hosts are not selected following usual criteria and techniques used for Ly emission searches in star forming galaxies, they probe the regime of Ly emission of the bulk of the UV-selected galaxy population at intermediate (and possibly high) redshifts.
We then selected a sub-sample of four LGRBs that allowed the combination of the emission properties of the host galaxies with the information on the ISM probed by the afterglow. We fit the Ly emission of these galaxies using the shell model and we use the ancillary observational properties to constrain and test the model. We find that, without priors on the parameters, the shell model succeeds in reproducing the four profiles. However, the properties predicted by the model differ from the observed ones for the two cases (GRB 060926 and 070110) having a high . Similarly, constraining the model parameters using the values determined from the observations, the shell model succeeds in reproducing the two lower cases but fails for the two highest ones. These results may be due to the fact that (i) the of the gas probed by the LGRB afterglow () is not representative of that encountered by the Ly photons (); specifically we find , consistent with the picture that Ly photons escape preferentially through low-column density channels and (ii) as known, the shell model relies on a too simplistic gas configuration. A consistent scenario would be provided by a turbulent medium widening the intrinsic Ly spectrum, and an anisotropic HI distribution allowing the escape of Ly photons through lower density channels than probed by the LGRB sightline. Such a description is consistent with mechanical and radiative feedback mechanisms produced by starburst and supernova that clear out channels from the active regions within the galaxies. Nevertheless, we stress that the afterglows of most LGRBs and LAE-LGRBs show , implying that likely the Ly photons produced by massive stars will predominantly be surrounded by such high-density gas, and low-density channels should be rare ( 10%). Another possibility is that, even if dense star-forming regions produce a high fraction of Ly photons, most of Ly escaping photons come from less dense regions overall the galaxy. We will investigate further both scenarios in the future taking advantage of galaxy simulations.
Finally, we compared the properties of the LAE-LGRBs with those of LyC leakers in the literature. Specifically, we considered the commonly used Ly indirect indicators of LyC leakage at low redshift and find that only one LAE-LGRB (GRB 021004) has the corresponding values for being a strong LyC leaker. However (strong) LyC reported in the literature at , span a wider range of parameter values than those commonly considered to point towards strong LyC leakage, questioning the use of such indicators at least at high redshift.
The analysis presented in this paper needs larger statistics. To this purpose, we have been awarded X-shooter time to observe eleven more LAE-LGRBs reported in the census. In the future it will be possible to extend these studies to higher redshift. Indeed, new space GRB missions like Gamow Explorer (White 2020) and THESEUS161616https://www.isdc.unige.ch/theseus/ (Amati et al. 2018; pre-selected as M5 European Space Agency mission), in synergy with ELT and JWST observations, will enable us to perform similar studies at , and with better statistics.
Acknowledgements.
We thanks A. Verhamme for very useful discussions. This work is part of the BEaPro project (P.I.: S.D. Vergani) funded by the French Agence Nationale de la Recherche (ANR-16-CE31-0003) and supporting JBV PhD thesis. JBV is now supported by LabEx UnivEarthS (ANR-10-LABX-0023 and ANR-18-IDEX-0001). MG is supported by NASA through the NASA Hubble Fellowship grant HST-HF2-51409 and acknowledges support from HST grants HST-GO-15643.017-A, HST-AR-15039.003-A, and XSEDE grant TG-AST180036. The Cosmic Dawn Center is funded by the Danish National Research Foundation under grant no. 140. BMJ is supported in part by Independent Research Fund Denmark grant DFF - 7014-00017. Based on observations collected at the European Southern Observatory under ESO programmes: 079.A-0253, 084.A-0631, 084.A-0260, 084.A-0303, 084.D-0265,085.A-0009, 086.A-0073, 086.B-0954, 086.A-0533, 086.A-0874, 087.A-0055, 087.A-0451, 087.B-0737, 088.A-0051, 088.A-0644, 089.A-0067, 089.A-0120, 089.D-0256, 089.A-0868, 090.A-0088, 090.A-0760, 090.A-0825, 091.A-0342, 091.A-0703, 091.A-0877, 091.C-0934, 0091.C-0934, 092.D-0056, 092.D-0633, 092.A-0076, 092.A-0124, 092.A-0231, 093.A-0069, 094.A-0593, 094.A-0134, 095.A-0045, 095.B-0811, 096.A-0079, 097.A-0036, 097.D-0672, 098.D-0416, 098.A-0136, and 098.A-0055.References
- Ahn (2000) Ahn, S.-H. 2000, ApJ, 530, L9
- Ahn (2004) Ahn, S.-H. 2004, ApJ, 601, L25
- Ahn et al. (2003) Ahn, S.-H., Lee, H.-W., & Lee, H. M. 2003, MNRAS, 340, 863
- Amati et al. (2018) Amati, L., O’Brien, P., Götz, D., et al. 2018, Advances in Space Research, 62, 191
- Appenzeller et al. (1998) Appenzeller, I., Fricke, K., Fürtig, W., et al. 1998, The Messenger, 94, 1
- Arabsalmani et al. (2018) Arabsalmani, M., Le Floc’h, E., Dannerbauer, H., et al. 2018, MNRAS, 476, 2332
- Bagley et al. (2017) Bagley, M. B., Scarlata, C., Henry, A., et al. 2017, ApJ, 837, 11
- Behrens et al. (2014) Behrens, C., Dijkstra, M., & Niemeyer, J. C. 2014, A&A, 563, A77
- Berger & Rauch (2008) Berger, E. & Rauch, M. 2008, GCN, 8542, 1
- Blanchard et al. (2016) Blanchard, P. K., Berger, E., & fai Fong, W. 2016, ApJ, 817, 144
- Bolmer et al. (2019) Bolmer, J., Ledoux, C., Wiseman, P., et al. 2019, A&A, 623, A43
- Brocklehurst (1971) Brocklehurst, M. 1971, MNRAS, 153, 471
- Castro-Tirado et al. (2010) Castro-Tirado, A. J., Møller, P., García-Segura, G., et al. 2010, A&A, 517, A61
- Cen (2020) Cen, R. 2020, ApJ, 889, L22
- Chabrier (2003) Chabrier, G. 2003, PASP, 115, 763
- Chen et al. (2007) Chen, H., Prochaska, J. X., Ramirez‐Ruiz, E., et al. 2007, ApJ, 663, 420
- Chen (2012) Chen, H.-W. 2012, MNRAS, 419, 3039
- Chisholm et al. (2015) Chisholm, J., Tremonti, C. A., Leitherer, C., et al. 2015, ApJ, 811, 149
- Conselice et al. (2003) Conselice, C. J., Bershady, M. A., Dickinson, M., & Papovich, C. 2003, AJ, 126, 1183–1207
- Cucchiara et al. (2015) Cucchiara, A., Fumagalli, M., Rafelski, M., et al. 2015, ApJ, 804, 51
- de Barros et al. (2016) de Barros, S., Vanzella, E., Amorín, R., et al. 2016, A&A, 585, A51
- de Ugarte Postigo et al. (2005) de Ugarte Postigo, Castro-Tirado, A. J., Gorosabel, J., et al. 2005, A&A, 443, 841
- D’Elia et al. (2019) D’Elia, V., Fynbo, J. P. U., Izzo, L., et al. 2019, GCN, 25956, 1
- Dessauges-Zavadsky et al. (2010) Dessauges-Zavadsky, M., D’Odorico, S., Schaerer, D., et al. 2010, A&A, 510, A26
- Dijkstra et al. (2016) Dijkstra, M., Gronke, M., & Sobral, D. 2016, ApJ, 823, 74
- Dijkstra & Kramer (2012) Dijkstra, M. & Kramer, R. 2012, MNRAS, 424, 1672
- D’Avanzo et al. (2010) D’Avanzo, P., Perri, M., Fugazza, D., et al. 2010, A&A, 522, A20
- Eide et al. (2018) Eide, M. B., Gronke, M., Dijkstra, M., & Hayes, M. 2018, ApJ, 856, 156
- Elíasdóttir et al. (2009) Elíasdóttir, Á., Fynbo, J. P. U., Hjorth, J., et al. 2009, ApJ, 697, 1725
- Erb et al. (2014) Erb, D. K., Steidel, C. C., Trainor, R. F., et al. 2014, ApJ, 795, 33
- Fiore et al. (2005) Fiore, F., D’Elia, V., Lazzati, D., et al. 2005, ApJ, 624, 853
- Fletcher et al. (2019) Fletcher, T. J., Tang, M., Robertson, B. E., et al. 2019, ApJ, 878, 87
- Fox (2002) Fox, D. W. 2002, GCN, 1564, 1
- Friis et al. (2015) Friis, M., De Cia, A., Krühler, T., et al. 2015, MNRAS, 451, 167
- Fynbo et al. (2005) Fynbo, J. P. U., Gorosabel, J., Smette, A., et al. 2005, ApJ, 633, 317
- Fynbo et al. (2003) Fynbo, J. P. U., Jakobsson, P., Møller, P., et al. 2003, A&A, 406, L63
- Fynbo et al. (2009) Fynbo, J. P. U., Jakobsson, P., Prochaska, J. X., et al. 2009, ApJ, 185, 526
- Fynbo et al. (2002) Fynbo, J. P. U., Møller, P., Thomsen, B., et al. 2002, A&A, 388, 425
- Fynbo et al. (1999) Fynbo, J. U., Møller, P., & Warren, S. J. 1999, MNRAS, 305, 849
- Gehrels & Razzaque (2013) Gehrels, N. & Razzaque, S. 2013, Front. Phys., 8, 661
- Girichidis et al. (2018) Girichidis, P., Naab, T., Hanasz, M., & Walch, S. 2018, MNRAS, 479, 3042
- Graham & Fruchter (2017) Graham, J. F. & Fruchter, A. S. 2017, ApJ, 834, 170
- Gronke (2017) Gronke, M. 2017, A&A, 608, A139
- Gronke et al. (2015) Gronke, M., Bull, P., & Dijkstra, M. 2015, ApJ, 812, 123
- Gronke et al. (2018) Gronke, M., Girichidis, P., Naab, T., & Walch, S. 2018, ApJ, 862, L7
- Hartoog et al. (2015) Hartoog, O. E., Malesani, D., Fynbo, J. P. U., et al. 2015, A&A, 580, A139
- Hashimoto et al. (2015) Hashimoto, T., Verhamme, A., Ouchi, M., et al. 2015, ApJ, 812, 157
- Heintz et al. (2019) Heintz, K. E., Ledoux, C., Fynbo, J. P. U., et al. 2019, A&A, 621, A20
- Henry et al. (2015) Henry, A., Scarlata, C., Martin, C. L., & Erb, D. 2015, ApJ, 809, 19
- Hjorth et al. (2012) Hjorth, J., Malesani, D., Jakobsson, P., et al. 2012, ApJ, 756, 187
- Hjorth et al. (2003) Hjorth, J., Sollerman, J., Møller, P., et al. 2003, Nature, 423, 847
- Holland et al. (2006) Holland, S. T., Barthelmy, S. D., Burrows, D. N., et al. 2006, GCN, 5612, 1
- Izotov et al. (2016) Izotov, Y. I., Schaerer, D., Thuan, T. X., et al. 2016, MNRAS, 461, 3683
- Izotov et al. (2018a) Izotov, Y. I., Schaerer, D., Worseck, G., et al. 2018a, MNRAS, 474, 4514
- Izotov et al. (2018b) Izotov, Y. I., Worseck, G., Schaerer, D., et al. 2018b, MNRAS, 478, 4851
- Jakobsson et al. (2005) Jakobsson, P., Björnsson, G., Fynbo, J. P. U., et al. 2005, MNRAS, 362, 245
- Jakobsson et al. (2006) Jakobsson, P., Fynbo, J. P. U., Ledoux, C., et al. 2006, A&A, 460, L13
- Jakobsson et al. (2003) Jakobsson, P., Hjorth, J., Fynbo, J. P. U., et al. 2003, A&A, 408, 941
- Jakobsson et al. (2004) Jakobsson, P., Hjorth, J., Fynbo, J. P. U., et al. 2004, A&A, 427, 785
- Jakobsson et al. (2012) Jakobsson, P., Hjorth, J., Malesani, D., et al. 2012, ApJ, 752, 62
- Japelj et al. (2015) Japelj, J., Covino, S., Gomboc, A., et al. 2015, A&A, 579, A74
- Japelj et al. (2016) Japelj, J., Vergani, S. D., Salvaterra, R., et al. 2016, A&A, 590, A129
- Jaskot & Oey (2014) Jaskot, A. E. & Oey, M. S. 2014, ApJ, 791, L19
- Kakiichi et al. (2018) Kakiichi, K., Ellis, R. S., Laporte, N., et al. 2018, MNRAS, 479, 43
- Kakiichi & Gronke (2019) Kakiichi, K. & Gronke, M. 2019, arXiv e-prints, arXiv:1905.02480
- Kennicutt (1998) Kennicutt, Robert C., J. 1998, ARA&A, 36, 189
- Kimm et al. (2019) Kimm, T., Blaizot, J., Garel, T., et al. 2019, MNRAS, 486, 2215
- Kruehler & Schady (2017) Kruehler, T. & Schady, P. 2017, Figshare, https://doi.org/10.6084/m9.figshare.4776886.v3
- Krühler et al. (2015) Krühler, T., Malesani, D., Fynbo, J. P. U., et al. 2015, A&A, 581, A125
- Krühler et al. (2012) Krühler, T., Malesani, D., Milvang-Jensen, B., et al. 2012, ApJ, 758, 46
- Kulkarni et al. (1998) Kulkarni, S. R., Djorgovski, S. G., Ramaprakash, A. N., et al. 1998, Nature, 393, 35
- Kunth et al. (1998) Kunth, D., Mas-Hesse, J. M., Terlevich, E., et al. 1998, A&A, 334, 11
- Laursen et al. (2009) Laursen, P., Sommer-Larsen, J., & Andersen, A. C. 2009, ApJ, 704, 1640
- Leclercq et al. (2017) Leclercq, F., Bacon, R., Wisotzki, L., et al. 2017, A&A, 608, A8
- Li et al. (2020) Li, Z., Steidel, C. C., Gronke, M., & Chen, Y. 2020, arXiv e-prints, arXiv:2008.09130
- Lidman et al. (2012) Lidman, C., Hayes, M., Jones, D. H., et al. 2012, MNRAS, 420, 1946
- Lyman et al. (2017) Lyman, J. D., Levan, A. J., Tanvir, N. R., et al. 2017, MNRAS, 467, 1795
- Malesani et al. (2007) Malesani, D., Jaunsen, A. O., & Vreeswijk, P. M. 2007, GCN, 6015, 1
- Malesani et al. (2013) Malesani, D., Xu, D., Fynbo, J. P. U., et al. 2013, GCN, 14291, 1
- Matthee et al. (2021) Matthee, J., Sobral, D., Hayes, M., et al. 2021, arXiv e-prints, arXiv:2102.07779
- Matthee et al. (2016) Matthee, J., Sobral, D., Oteo, I., et al. 2016, MNRAS, 458, 449
- Milvang-Jensen et al. (2012) Milvang-Jensen, B., Fynbo, J. P. U., Malesani, D., et al. 2012, ApJ, 756, 25
- Mirabal et al. (2003) Mirabal, N., Halpern, J. P., Chornock, R., et al. 2003, 595, 15
- Modigliani et al. (2010) Modigliani, A., Goldoni, P., Royer, F., et al. 2010, SPIE Conference Series, Vol. 7737, The X-shooter pipeline, 773728
- Møller et al. (2002) Møller, P., Fynbo, J. P. U., Hjorth, J., et al. 2002, A&A, 396, L21
- Nakajima & Ouchi (2014) Nakajima, K. & Ouchi, M. 2014, MNRAS, 442, 900
- Nakajima et al. (2013) Nakajima, K., Ouchi, M., Shimasaku, K., et al. 2013, ApJ, 769, 3
- Neufeld (1990) Neufeld, D. A. 1990, ApJ, 350, 216
- Orlitová et al. (2018) Orlitová, I., Verhamme, A., Henry, A., et al. 2018, A&A, 616, A60
- Osterbrock (1989) Osterbrock, D. E. 1989, Astrophysics of gaseous nebulae and active galactic nuclei (ApJ)
- Ouchi et al. (2009) Ouchi, M., Ono, Y., Egami, E., et al. 2009, ApJ, 696, 1164
- Palmerio et al. (2019) Palmerio, J. T., Vergani, S. D., Salvaterra, R., et al. 2019, A&A, 623, A26
- Pei (1992) Pei, Y. C. 1992, ApJ, 395, 130
- Pentericci et al. (2007) Pentericci, L., Grazian, A., Fontana, A., et al. 2007, A&A, 471, 433
- Pentericci et al. (2010) Pentericci, L., Grazian, A., Scarlata, C., et al. 2010, A&A, 514, A64
- Perley et al. (2009) Perley, D. A., Cenko, S. B., Bloom, J. S., et al. 2009, AJ, 138, 1690
- Perley et al. (2016a) Perley, D. A., Krühler, T., Schulze, S., et al. 2016a, ApJ, 817, 7
- Perley et al. (2013) Perley, D. A., Levan, A. J., Tanvir, N. R., et al. 2013, ApJ, 778, 128
- Perley et al. (2016b) Perley, D. A., Tanvir, N. R., Hjorth, J., et al. 2016b, ApJ, 817, 8
- Planck Collaboration et al. (2016) Planck Collaboration, Ade, P. A. R., Aghanim, N., et al. 2016, A&A, 594, A13
- Prochaska et al. (2007) Prochaska, J. X., Chen, H.-W., Dessauges-Zavadsky, M., & Bloom, J. S. 2007, ApJ, 666, 267
- Reddy et al. (2008) Reddy, N. A., Steidel, C. C., Pettini, M., et al. 2008, ApJS, 175, 48
- Rivera-Thorsen et al. (2017) Rivera-Thorsen, T. E., Dahle, H., Gronke, M., et al. 2017, A&A, 608, L4
- Rivera-Thorsen et al. (2015) Rivera-Thorsen, T. E., Hayes, M., Östlin, G., et al. 2015, ApJ, 805, 14
- Safarzadeh & Scannapieco (2016) Safarzadeh, M. & Scannapieco, E. 2016, ApJ, 832, L9
- Salvaterra et al. (2011) Salvaterra, R., Ferrara, A., & Dayal, P. 2011, MNRAS, 414, 847
- Salvaterra et al. (2013) Salvaterra, R., Maio, U., Ciardi, B., & Campisi, M. A. 2013, MNRAS, 429, 2718
- Salvaterra et al. (2009) Salvaterra, R., Valle, M. D., Campana, S., et al. 2009, Nature, 461, 1258
- Savaglio (2006) Savaglio, S. 2006, New Journal of Physics, 8, 195
- Schaerer et al. (2011) Schaerer, D., Hayes, M., Verhamme, A., & Teyssier, R. 2011, A&A, 531, A12
- Schaerer & Verhamme (2008) Schaerer, D. & Verhamme, A. 2008, A&A, 480, 369
- Schlafly & Finkbeiner (2011) Schlafly, E. F. & Finkbeiner, D. P. 2011, ApJ, 737, 103
- Schulze et al. (2015) Schulze, S., Chapman, R., Hjorth, J., et al. 2015, ApJ, 808, 73
- Selsing et al. (2019) Selsing, J., Malesani, D., Goldoni, P., et al. 2019, A&A, 623, A92
- Shapley et al. (2003) Shapley, A. E., Steidel, C. C., Pettini, M., & Adelberger, K. L. 2003, ApJ, 588, 65
- Sobral et al. (2015) Sobral, D., Matthee, J., Darvish, B., et al. 2015, ApJ, 808, 139
- Starling et al. (2005) Starling, R. L. C., Wijers, R. a. M. J., Hughes, M. A., et al. 2005, MNRAS, 360, 305
- Stasińska et al. (2015) Stasińska, G., Izotov, Y., Morisset, C., & Guseva, N. 2015, A&A, 576, A83
- Steidel et al. (2003) Steidel, C. C., Adelberger, K. L., Shapley, A. E., et al. 2003, ApJ, 592, 728
- Steidel et al. (2011) Steidel, C. C., Bogosavljević, M., Shapley, A. E., et al. 2011, The Astrophysical Journal, 736, 160
- Steidel et al. (2004) Steidel, C. C., Shapley, A. E., Pettini, M., et al. 2004, ApJ, 604, 534
- Tanvir et al. (2009) Tanvir, N. R., Fox, D. B., Levan, A. J., et al. 2009, Nature, 461, 1254
- Tanvir et al. (2019) Tanvir, N. R., Fynbo, J. P. U., de Ugarte Postigo, A., et al. 2019, MNRAS, 483, 5380
- Thöne et al. (2011) Thöne, C. C., Campana, S., Lazzati, D., et al. 2011, MNRAS, 414, 479
- Totani et al. (2006) Totani, T., Kawai, N., Kosugi, G., et al. 2006, PASJ, 58, 485
- Troja et al. (2007) Troja, E., Cusumano, G., O’Brien, P. T., et al. 2007, ApJ, 665, 599
- van Dokkum (2001) van Dokkum, P. G. 2001, PASP, 113, 1420
- Vanzella et al. (2020) Vanzella, E., Caminha, G. B., Calura, F., et al. 2020, MNRAS, 491, 1093
- Vanzella et al. (2016) Vanzella, E., de Barros, S., Vasei, K., et al. 2016, ApJ, 825, 41
- Vergani et al. (2011) Vergani, S., Piranomonte, S., Petitjean, P., et al. 2011, Astron. Nachr., 332, 292
- Vergani et al. (2017) Vergani, S. D., Palmerio, J., Salvaterra, R., et al. 2017, A&A, 599, A120
- Verhamme et al. (2015) Verhamme, A., Orlitová, I., Schaerer, D., & Hayes, M. 2015, A&A, 578, A7
- Verhamme et al. (2017) Verhamme, A., Orlitová, I., Schaerer, D., et al. 2017, A&A, 597, A13
- Verhamme et al. (2008) Verhamme, A., Schaerer, D., Atek, H., & Tapken, C. 2008, A&A, 491, 89
- Verhamme et al. (2006) Verhamme, A., Schaerer, D., & Maselli, A. 2006, A&A, 460, 397
- Vernet et al. (2011) Vernet, J., Dekker, H., D’Odorico, S., et al. 2011, A&A, 536, A105
- Vernet et al. (2009) Vernet, J., Kerber, F., Mainieri, V., et al. 2009, Proc. IAU, 5, 535
- Vielfaure et al. (2020) Vielfaure, J. B., Vergani, S. D., Japelj, J., et al. 2020, A&A, 641, A30
- Vreeswijk et al. (2004) Vreeswijk, P. M., Ellison, S. L., Ledoux, C., et al. 2004, A&A, 419, 927
- Vreeswijk et al. (2013) Vreeswijk, P. M., Ledoux, C., Raassen, A. J. J., et al. 2013, A&A, 549, A22
- Vreeswijk et al. (2006) Vreeswijk, P. M., Smette, A., Fruchter, A. S., et al. 2006, A&A, 447, 145
- White (2020) White, N. E. 2020, arXiv e-prints, arXiv:2003.01592
- Wiseman et al. (2017) Wiseman, P., Perley, D. A., Schady, P., et al. 2017, A&A, 607, A107
- Wisotzki et al. (2016) Wisotzki, L., Bacon, R., Blaizot, J., et al. 2016, A&A, 587, A98
- Wofford et al. (2013) Wofford, A., Leitherer, C., & Salzer, J. 2013, ApJ, 765, 118
- Yang et al. (2016) Yang, H., Malhotra, S., Gronke, M., et al. 2016, ApJ, 820, 130
- Yang et al. (2017) Yang, H., Malhotra, S., Gronke, M., et al. 2017, ApJ, 844, 171
- Zitrin et al. (2015) Zitrin, A., Labbé, I., Belli, S., et al. 2015, ApJ, 810, L12
Appendix A Tables of the properties of the objects in the samples
The following tables present the LGRB host galaxies and afterglows from the TOUGH and XHG samples, the literature, and this work, for which the Ly emission line has been detected or an upper limit has been estimated.
GRB and Redshift are for the name of the LGRB and its redshift. When observations of the host galaxy or the optical afterglow are available,
we provide the name of the spectrographs used in the columns Hosts and OA, respectively.
”no” indicates that no observation is available. ”F1”/”F2” is for VLT/FORS1/2 and ”xsh” for VLT/X-shooter spectrograph.
Ly Host and Ly OA inform about the detection of the Ly line in the host or afterglow spectra, respectively. No information is provided when no spectra are available to verify the presence of the line.
F(Ly) and L(Ly) correspond to the Ly line flux and luminosity (respectively) retrieved from the literature (see references in column Refs) or derived in this work.
EW(Ly) corresponds to the rest-frame Ly equivalent width.
is for the neutral hydrogen column density determined from the GRB afterglow.
is the UV magnitude of the LGRB host galaxy.
is its stellar mass.
R is for the apparent magnitude of the host in the R band.
SFR is the star-formation rate.
is the specific star-formation rate.
E(B-V) is the host extinction.
is the oxygen abundance.
Z is the metallicity determined from the absorption lines detected in the GRB afterglow spectrum.
References: (1): Milvang-Jensen et al. (2012); (2): This work; (3): Schulze et al. (2015); (4): Perley et al. (2016b); (5): Tanvir et al. (2019); (6):Krühler et al. (2015); (7): Palmerio et al. (2019); (8): Selsing et al. (2019); (9): Vielfaure et al. (2020); (10): Jakobsson et al. (2003); (11): Fynbo et al. (2005); (12): Vreeswijk et al. (2004); (13): Jakobsson et al. (2004); (14): D’Avanzo et al. (2010); (15): Perley et al. (2013); (16): de Ugarte Postigo et al. (2005); (17): Kruehler & Schady (2017); (18): Jakobsson et al. (2006); (19): Bolmer et al. (2019); (20): Heintz et al. (2019); (21): Cucchiara et al. (2015); (22): Savaglio (2006); (23): Vreeswijk et al. (2006); (24): Prochaska et al. (2007); (25): Thöne et al. (2011); (26): Elíasdóttir et al. (2009); (27): Chen et al. (2007).
| GRB | Redshift | Host | OA | Ly Host | Ly OA | EW(Ly) | F(Ly) | L(Ly) | Refs |
|---|---|---|---|---|---|---|---|---|---|
| [Å] | [] | [] | |||||||
| 050315 | 1.9500 | F1 | no | yes | … | (1) | |||
| 050401 | 2.8983 | F1 | F2 | no | no | (1) | |||
| 050714B | 2.4383 | xsh | F1 | no | no | (2) | |||
| 050730 | 3.9686 | F1 | UVES | no | no | … | (1) | ||
| 050819 | 2.5042 | xsh | no | no | … | (2) | |||
| 050820A | 2.6147 | F1 | UVES | no | no | (1) | |||
| 050908 | 3.3467 | F1 | F1 | no | no | … | (1) | ||
| 050915A | 2.5273 | xsh | F1 | no | no | (2) | |||
| 050922C | 2.1992 | F1 | AlFOSC | no | no | … | (1) | ||
| 051001 | 2.4296 | xsh | F1 | no | no | (2) | |||
| 060115 | 3.5328 | F1 | F1 | no | no | … | (1) | ||
| 060526 | 3.2213 | F1 | F1 | no | no | (1) | |||
| 060604 | 2.1357 | F1, xsh | AlFOSC | no | no | (1) | |||
| 060605 | 3.7730 | F1 | PMAS | yes | no | (1) | |||
| 060607A | 3.0749 | F1 | UVES | no | no | … | (1) | ||
| 060707 | 3.4240 | F1, xsh | F1 | yes | no | (1) | |||
| 060714 | 2.7108 | F1 | F1 | no | yes | … () | 1.73 () | 1.10 () | (1), (18) |
| 060805A | 2.3633 | xsh | no | no | … | (2) | |||
| 060814 | 1.9223 | xsh | F1, F2 | no | no | (2) | |||
| 060908 | 1.8836 | F1 | F1, F2 | yes | no | (1) | |||
| 061110B | 3.4344 | F1 | F1 | no | no | (1) | |||
| 070103 | 2.6208 | xsh | F2 | no | no | (2) | |||
| 070110 | 2.3523 | F1, xsh | F1 | yes | yes | (1) | |||
| 070129 | 2.3384 | xsh | F1, F2 | no | no | (2) | |||
| 070224 | 1.9922 | xsh | no | no | … | (2) | |||
| 070328 | 2.0627 | xsh | no | no | … | (2) | |||
| 070419B | 1.9586 | xsh | F1 | no | no | (2) | |||
| 070506 | 2.3090 | F1 | F1 | yes | no | (1) | |||
| 070611 | 2.0394 | F1 | F2 | no | no | … | (1) | ||
| 070721B | 3.6298 | F1 | F2 | yes | yes | (1) | |||
| 070802 | 2.4541 | F1, xsh | F2 | no | no | (1) |
| GRB | R | Refs | SFR | E(B-V) | Z | Refs | |||||
| [ ] | [mag] | [)] | [mag] | [] | |||||||
| 050315 | … | 9.7 | (3),(4) | … | … | … | … | … | |||
| 050401 | 9.61 | (5),(3) | … | … | … | … | (24) | ||||
| 050714B | … | … | (3) | … | … | … | (6) | ||||
| 050730 | (5),(1) | … | … | … | … | (21) | |||||
| 050819 | … | … | (3) | … | … | … | (6) | ||||
| 050820A | 8.95 | (5),(1),(17) | 0.9 | … | … | (6),(21) | |||||
| 050908 | (5),(1) | … | … | … | … | … | |||||
| 050915A | … | 10.66 | (3),(17) | 1.9 | … | … | (6) | ||||
| 050922C | (5),(1) | … | … | … | … | (21) | |||||
| 051001 | … | 10.08 | (3),(4) | … | … | (6) | |||||
| 060115 | 9.43 | (5),(1) | … | … | … | … | (21) | ||||
| 060526 | 9.30 | (5),(1) | … | … | … | … | (25) | ||||
| 060604 | … | … | (3) | … | … | (6) | |||||
| 060605 | (5),(1) | … | … | … | … | … | |||||
| 060607A | (5),(3) | … | … | … | … | … | |||||
| 060707 | 9.99 | (5),(3) | … | … | (6),(21) | ||||||
| 060714 | 9.25 | (5),(3) | … | … | … | … | (21) | ||||
| 060805A | … | … | (3) | … | … | … | (6) | ||||
| 060814 | … | 10.00 | (3),(17) | … | (7),(6) | ||||||
| 060908 | … | 9.15 | (3),(4) | … | … | … | … | … | |||
| 061110B | (5),(1) | … | … | … | … | (21) | |||||
| 070103 | … | … | (3) | … | … | … | (6) | ||||
| 070110 | (5),(3) | … | (6),(21) | ||||||||
| 070129 | … | 10.15 | (3),(4) | … | … | (6) | |||||
| 070224 | … | … | (3) | … | … | … | … | ||||
| 070328 | … | 9.65 | (3),(17) | … | … | (6) | |||||
| 070419B | … | 9.84 | (3),(4) | … | … | (6) | |||||
| 070506 | … | (5),(3) | … | … | … | … | (21) | ||||
| 070611 | … | (5),(3) | … | … | … | … | … | ||||
| 070721B | (5),(1) | … | … | … | … | (21) | |||||
| 070802 | 9.69 | (5),(3) | … | (6),(26) |
| GRB | Redshift | Host | OA | Ly Host | Ly OA | EW(Ly) | F(Ly) | L(Ly) |
|---|---|---|---|---|---|---|---|---|
| [Å] | [] | [] | ||||||
| 050714B | 2.4383 | xsh, F1 | no | no | … | |||
| 050819 | 2.5042 | xsh | no | no | … | |||
| 050915A | 2.5275 | xsh | F1 | no | no | |||
| 051001 | 2.4295 | xsh, F1 | no | no | … | |||
| 060204B | 2.3393 | xsh | no | no | … | |||
| 060604 | 2.1355 | xsh, F1 | AlFOSC | no | no | |||
| 060707 | 3.4240 | xsh, F1 | F1 | no | no | … | ||
| 060805A | 2.3633 | xsh | no | no | … | |||
| 060814 | 1.9223 | xsh | F1, F2 | no | no | |||
| 060926 | 3.2090 | xsh | F1 | yes | yes | |||
| 061202 | 2.2543 | xsh | no | no | … | |||
| 070103 | 2.6208 | xsh, F2 | no | no | … | |||
| 070110 | 2.3523 | xsh | F2 | yes | yes | |||
| 070129 | 2.3384 | xsh | F1, F2 | no | no | |||
| 070224 | 1.9922 | xsh | no | no | … | … | ||
| 070328 | 2.0627 | xsh | no | no | … | |||
| 070419B | 1.9586 | xsh | F1 | no | no | … | ||
| 070521 | 2.0865 | xsh | no | no | … | … | ||
| 070802 | 2.4538 | xsh, F1 | F2 | no | no | |||
| 071021 | 2.4515 | xsh | no | no | … | … | ||
| 080207 | 2.0856 | xsh | no | no | … | |||
| 080602 | 1.8204 | xsh | no | no | … | |||
| 080605 | 1.6410 | xsh | F2 | no | no | |||
| 080804 | 2.2059 | xsh | UVES | no | no | |||
| 081210 | 2.0631 | xsh | no | no | … | |||
| 081221 | 2.2590 | xsh | no | no | … | |||
| 090113 | 1.7494 | xsh | no | no | … | … | ||
| 090201 | 2.1000 | xsh | no | no | … | … | ||
| 090323 | 3.5832 | xsh | F2 | no | no | |||
| 100424A | 2.4656 | xsh | no | yes | … | … | ||
| 110818A | 3.3609 | xsh | xsh | no | no | … | ||
| 111123A | 3.1513 | xsh | xsh | no | no | |||
| 120118B | 2.9428 | xsh | no | no | … | |||
| 120119A | 1.7291 | xsh | xsh | no | no | … | ||
| 120624B | 2.1974 | xsh | no | no | … | … | ||
| 120815A | 2.3587 | xsh | xsh | no | no | |||
| 130131B | 2.5393 | xsh | no | no | … |
| GRB | R | Refs | SFR | E(B-V) | Z | Refs | |||||
|---|---|---|---|---|---|---|---|---|---|---|---|
| [ ] | [mag] | [)] | [mag] | [] | |||||||
| 050714B | … | … | (3) | … | … | … | (6) | ||||
| 050819 | … | … | (3) | … | … | … | (6) | ||||
| 050915A | … | 10.66 | (3),(17) | -10.39 | … | … | (6) | ||||
| 051001 | … | 10.08 | (3),(4) | … | … | (6) | |||||
| 060204B | … | … | 9.81 | … | (17) | … | … | (6) | |||
| 060604 | … | … | … | (3) | … | … | (6) | ||||
| 060707 | 9.99 | (5),(3) | … | … | (6),(21) | ||||||
| 060805A | … | … | (3) | … | … | … | (6) | ||||
| 060814 | … | (3),(4) | … | (6),(7) | |||||||
| 060926 | 10.71 | … | (5) | … | … | (6),(21) | |||||
| 061202 | … | … | 9.64 | … | (17) | … | … | (6) | |||
| 070103 | … | … | (3) | … | … | … | (6) | ||||
| 070110 | (5) | … | (6),(21) | ||||||||
| 070129 | … | 10.15 | (3),(4) | … | … | (6) | |||||
| 070224 | … | … | (3) | … | … | … | … | (6) | |||
| 070328 | … | 9.65 | (3),(17) | … | … | (6) | |||||
| 070419B | … | 9.84 | (3),(4) | … | … | (6) | |||||
| 070521 | … | … | 10.5 | … | (17) | … | … | (6) | |||
| 070802 | 9.69 | (5),(3) | … | (6),(20) | |||||||
| 071021 | … | … | 10.10 | … | (17) | … | … | (6) | |||
| 080207 | … | … | 11.09 | (17) | … | (6) | |||||
| 080602 | … | … | … | (7) | … | (6),(7) | |||||
| 080605 | … | … | … | (7) | … | (6),(7) | |||||
| 080804 | … | 9.28 | … | (5) | … | (6),(21) | |||||
| 081210 | … | … | 10.07 | … | (17) | … | … | (6) | |||
| 081221 | … | … | 10.08 | … | (17 | … | … | (6) | |||
| 090113 | … | … | 9.90 | … | (17) | … | … | (6) | |||
| 090201 | … | … | 10.90 | … | (4) | … | … | (6) | |||
| 090323 | 10.30 | … | (5),(17) | … | … | … | (6) | ||||
| 100424A | … | … | … | (8) | … | … | (6) | ||||
| 110818A | 10.50 | … | (5),(17) | … | … | (6) | |||||
| 111123A | … | 11.17 | … | (3),(17) | … | … | (6) | ||||
| 120118B | … | … | … | … | … | … | (6) | ||||
| 120119A | … | 9.93 | … | (5),(17) | (6),(20) | ||||||
| 120624B | … | … | 10.84 | … | (17) | … | (6) | ||||
| 120815A | … | … | … | (5) | … | … | (6),(20) | ||||
| 130131B | … | … | … | … | … | … | … | … | (6) |
| GRB | Redshift | Host | OA | Ly Host | Ly OA | EW(Ly) | F(Ly) | L(Ly) | Refs |
|---|---|---|---|---|---|---|---|---|---|
| [Å] | [] | [] | |||||||
| 971214 | 3.4200 | Keck | no | yes | … | 13.0 | (1) | ||
| 000926 | 2.0400 | AlFOSC | NOT | yes | no | (1) | |||
| 011211 | 2.1434 | xsh | F1 | yes | no | (2) | |||
| 021004 | 2.3298 | xsh | UVES | yes | yes | (2) | |||
| 030323 | 3.3720 | no | F2 | … | yes | (1) | |||
| 030429 | 2.6600 | no | F1 | … | yes | … | 0.31 | (1) | |
| 061222A | 2.0880 | LRIS | no | yes | … | 31.0 | 16.80 | (1) | |
| 071031 | 2.6918 | no | F2 | … | yes | … | (1) | ||
| 081121 | 2.5134 | xsh | LDSS3 | yes | no | … | (2) | ||
| 081222 | 2.7700 | xsh | GMOS-S | yes | no | … | (2) | ||
| 090205 | 4.6500 | no | F1 | … | yes | … | (1) | ||
| 121201A | 3.3830 | no | xsh | … | yes | … | (2) | ||
| 150915A | 1.9680 | no | xsh | … | yes | … | (2) | ||
| 151021A | 2.3300 | no | xsh | … | yes | … | (2) | ||
| 170202A | 3.6450 | no | xsh | … | yes | … | (2) | ||
| 191004B | 3.5055 | xsh | xsh | yes | yes | (9) |
| GRB | R | Refs | SFR | E(B-V) | Z | Refs | |||||
|---|---|---|---|---|---|---|---|---|---|---|---|
| [ ] | [mag] | [)] | [mag] | [] | |||||||
| 971214 | … | … | … | … | … | … | … | … | (15) | ||
| 000926 | 9.64 | … | (5) | … | … | … | (15),(22) | ||||
| 011211 | 8.0 | (5),(10) | … | (2),(10),(23) | |||||||
| 021004 | 9.45 | (5),(11) | … | (2),(16),(27) | |||||||
| 030323 | (5),(12) | … | … | … | … | (12) | |||||
| 030429 | … | … | (5),(13) | … | … | … | … | (21) | |||
| 061222A | … | … | 9.55 | … | (4) | … | … | … | … | (15) | |
| 071031 | … | … | … | (5) | … | … | … | … | (21) | ||
| 081121 | … | … | 9.24 | … | (4) | … | … | … | (2) | ||
| 081222 | 9.61 | … | (5) | … | … | … | … | … | |||
| 090205 | (5),(14) | … | … | … | … | (21) | |||||
| 121201A | … | … | (5) | … | … | … | … | … | |||
| 150915A | … | … | … | (5) | … | … | … | … | (2) | ||
| 151021A | … | … | … | (5) | … | … | … | … | (19) | ||
| 170202A | … | … | … | (5) | … | … | … | … | (19) | ||
| 191004B | … | (5),(9) | … | … | … | (9) |
Appendix B Table summarizing the LAE-LGRB census.
| GRB | Redshift | Host | OA | Host | OA | Flux() | Sample | Refs |
|---|---|---|---|---|---|---|---|---|
| 971214 | 3.4200 | Keck | no | yes | - | - | (1), (2), (3), (8) | |
| 000926 | 2.0400 | AlFOSC | NOT | yes | no | - | (4), (8) | |
| 011211 | 2.1434 | xsh | F1 | yes | no | - | (2) | |
| 021004 | 2.3298 | xsh | UVES | yes | yes | - | (2) | |
| 030323 | 3.3720 | no | F2 | - | yes | - | (2), (6),(8) | |
| 030429 | 2.6600 | no | F1 | - | yes | 0.3 () | - | (7) |
| 050315 | 1.9500 | F1 | no | yes | - | TOUGH | (8) | |
| 060605 | 3.7730 | F1 | PMAS | yes | no | TOUGH | (8) | |
| 060707 | 3.4240 | F1, xsh | F1 | yes | no | TOUGH, XHGa | (8), (10) | |
| 060714 | 2.7108 | F1 | F1 | no | yes | 1.7 | TOUGHb | (8), (10), (11) |
| 060908 | 1.8836 | F1 | F1, F2 | yes | no | TOUGH | (8) | |
| 060926 | 3.2090 | xsh | F1 | yes | yes | XHG | (8), (10) | |
| 061222A | 2.0880 | LRIS | no | yes | - | 16.8 | - | (8), (12) |
| 070110 | 2.3523 | F1, xsh | F1 | yes | yes | TOUGH, XHG | (8), (10) | |
| 070223 | 1.6295 | LRIS | no | yes | - | - | - | (9) |
| 070506 | 2.3090 | F1 | F1 | yes | no | TOUGH | (8), (10) | |
| 070721B | 3.6298 | F1 | F2 | yes | yes | TOUGH | (8), (10) | |
| 071031 | 2.6918 | no | F2 | - | yes | - | (8), (10) | |
| 080810 | 3.3604 | LRIS | AlFOSC | yes | yes | - | - | (10), (23) |
| 081121 | 2.5134 | xsh | LDSS3 | yes | no | - | (20), (21) | |
| 081222 | 2.7700 | xsh | GMOS-S | yes | no | - | (17), (20) | |
| 090205 | 4.6500 | no | F1 | - | yes | - | (8), (13) | |
| 100316A | 3.1600 | no | OSIRIS | no | yes | - | - | (17) |
| 100424A | 2.4656 | xsh | no | yes | - | XHG | (15), (18) | |
| 121201A | 3.3830 | no | xsh | - | yes | XAFT | (16), (19) | |
| 150915A | 1.9680 | no | xsh | - | yes | XAFT | (16) | |
| 151021A | 2.3300 | no | xsh | - | yes | XAFT | (16) | |
| 170202A | 3.6450 | no | xsh | - | yes | XAFT | (16) | |
| 191004B | 3.5055 | xsh | xsh | yes | yes | - | (20), (22) |
a GRB 060707 is part of the XHG sample but the Ly is not detected in the X-shooter spectrum.
b For GRB 060714 the Ly line is only detected at 2.5 in the host galaxy observation of Milvang-Jensen et al. (2012) but is convincingly detected in the afterglow spectrum presented by Jakobsson et al. (2006), therefore we consider it as a detection and report the flux measured in the afterglow spectrum corrected for Galactic extinction.
References: (1): Kulkarni et al. (1998); (2): Fynbo et al. (2003); (3): Ahn (2000); (4): Fynbo et al. (2002); (5): Jakobsson et al. (2005); (6): Vreeswijk et al. (2004); (7): Jakobsson et al. (2004); (8): Milvang-Jensen et al. (2012); (9): Perley et al. (2016a); (10): Fynbo et al. (2009); (11): Jakobsson et al. (2006); (12): Perley et al. (2009); (13): D’Avanzo et al. (2010); (14): Hartoog et al. (2015); (15): Krühler et al. (2015); (16): Selsing et al. (2019); (17): Tanvir et al. (2019); (18): Malesani et al. (2013); (19): Cucchiara et al. (2015); (20): this work, (21): Berger & Rauch (2008), (22): D’Elia et al. (2019), (23): Wiseman et al. (2017)
Appendix C Results of the shell model with constraints from the GRB host galaxy.
| GRB host | log(T/K) | (Ly) | (Ly) | ||||
|---|---|---|---|---|---|---|---|
| [km s-1] | [km s-1] | [Å] | |||||
| GRB 011211 | |||||||
| GRB 021004 | |||||||
| GRB 060926 | |||||||
| GRB 070110 |
Notes. Same as Table 11.
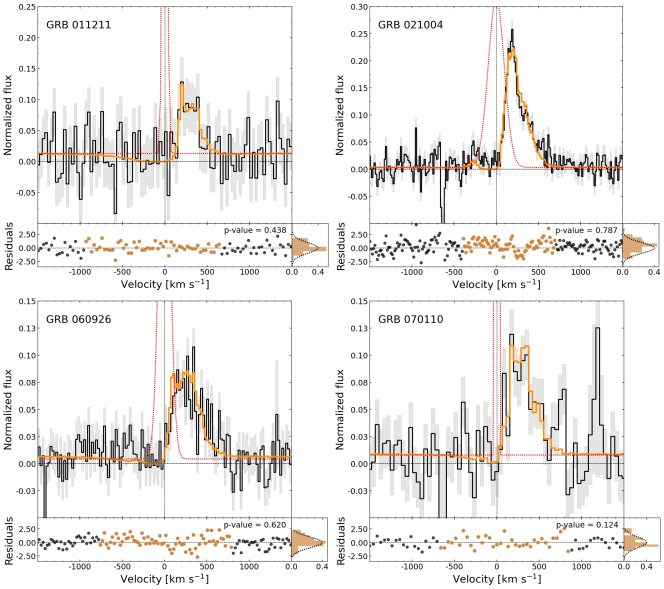
Appendix D Results of the shell model with constraints from the GRB afterglow.
| GRB host | log(T/K) | (Ly) | (Ly) | ||||
|---|---|---|---|---|---|---|---|
| [km s-1] | [km s-1] | [Å] | |||||
| GRB 011211 | |||||||
| GRB 021004 | |||||||
| GRB 060926 | |||||||
| GRB 070110 |
Notes. Same as Table 11.