Superfluid Liquid Helium Control for the
Primordial Inflation Polarization Explorer Balloon Payload
Abstract
The Primordial Inflation Polarization Explorer (PIPER) is a stratospheric balloon payload to measure polarization of the cosmic microwave background. Twin telescopes mounted within an open-aperture bucket dewar couple the sky to bolometric detector arrays. We reduce detector loading and photon noise by cooling the entire optical chain to 1.7 K or colder. A set of fountain-effect pumps sprays superfluid liquid helium onto each optical surface, producing helium flows of 50–100 cm3 s-1 at heights up to 200 cm above the liquid level. We describe the fountain-effect pumps and the cryogenic performance of the PIPER payload during two flights in 2017 and 2019.
I Introduction
Linear polarization of the cosmic microwave background (CMB) provides a window into the physics of the early universe. Gravitational waves created during an inflationary epoch interact with CMB photons at much later times to impart a distinctive pattern in linear polarization. For the simplest (single-field) inflation models, the amplitude of the polarized signal depends on the energy scale of inflation as
| (1) |
where is the power ratio of tensor (gravitational wave) to scalar (density) fluctuations sourced during inflation Lyth and Riotto (1999). In most large-field models of inflation, is predicted to be of order 0.01, corresponding to energy near the Grand Unified Theory scale, GeV.
Current upper limits BICEP2 Collaboration and Keck Array Collaboration (2018) correspond to fluctuations in surface brightness nK on angular scales of a few degrees (in units of CMB thermodynamic temperature). At millimeter wavelengths where CMB emission peaks, the sensitivity of bolometric detectors has reached the point where a dominant contribution to the system noise is photon noise from the random arrival of incident photons. The spectral density of photon noise in a single linear polarization from a source with emissivity at physical temperature is given by
| (2) |
where , is the Planck constant, is the Boltzmann constant, is the speed of light, is the observing frequency, is the detector area, is the solid angle, is the detector absorptivity, and is the power transmission through the optics Mather (1982). The noise at the detector may be referred to the surface brightness on the sky,
| (3) |
where is the observing bandwidth. Even an ideal noiseless detector ( and ) with a 20% fractional bandwidth at 200 GHz will have irreducible noise from CMB photons of order 20 K within each 1-second integration. Realistic instruments ( and ) perform correspondingly worse. Emission from the atmosphere and optical elements skyward of the detector further degrade sensitivity. Detecting signals at the few-nK level requires a combination of long integration times and multiple independent detectors. Observations at altitudes above 30 km minimize photon noise from the atmosphere, improving per-detector sensitivity by a factor of ten or more compared to the best ground-based sites. Additional reductions in photon noise of factors 1.5–4 can be achieved by cooling optical elements to cryogenic temperatures.
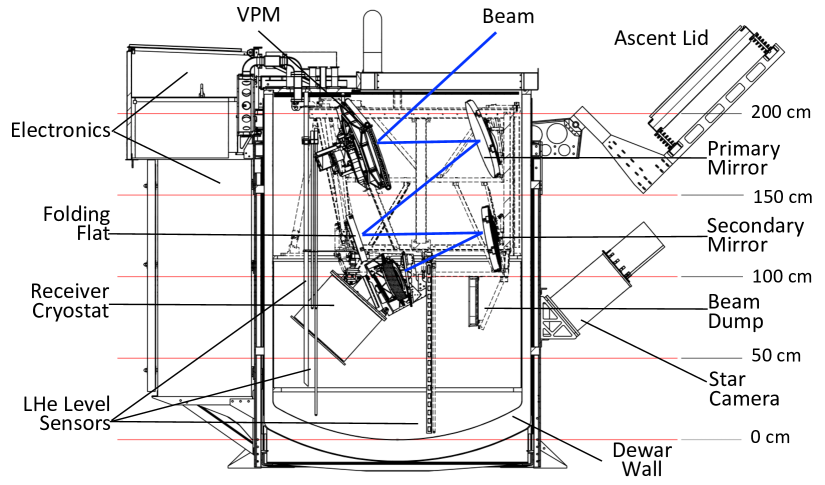
The Primordial Inflation Polarization Explorer (PIPER) is a stratospheric balloon payload to measure polarization of the CMB and diffuse astrophysical foregrounds in four frequency bands between 200 and 600 GHzKogut et al. (2012); Pawlyk et al. (2018). Figure 1 shows the payload. It consists of two co-pointed telescopes mounted within an open liquid helium bucket dewar. An ascent lid covers the dewar aperture during ground operations and opens at float altitude to allow the telescopes to view the sky. A variable-delay polarization modulator (VPM) on each telescope modulates linear and circular polarization to isolate the polarized signal while rejecting the much brighter unpolarized emissionChuss et al. (2012, 2014). A pair of element detector arrays operating at 100 mK within a vacuum receiver cryostat provide background-limited sensitivitySwitzer et al. (2019). A continuous adiabatic demagnetization refrigerator provides sub-K cooling for the detectors; its design and operation is described in Switzer et al. (2019). Electronics racks mounted on the dewar exterior frame provide detector readout, housekeeping, avionics, and telemetry. The entire payload rotates in azimuth about the dewar vertical axis; gyroscopes, magnetometers and a star camera provide pointing information for real-time control and post-flight pointing reconstruction.
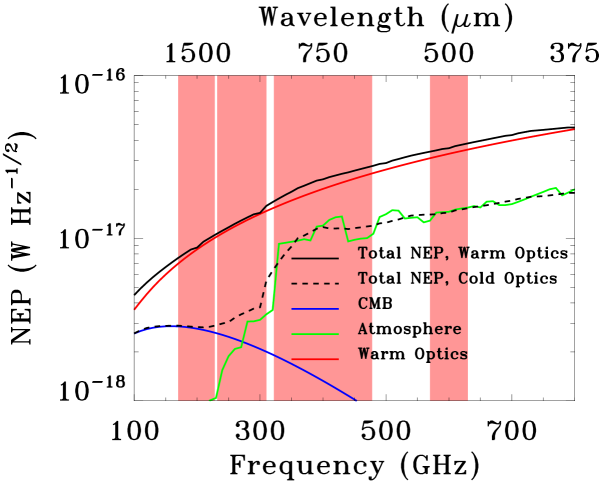
PIPER’s optical design has 4 reflective surfaces between the sky and the receiver: the VPM, primary mirror, folding flat, and secondary mirrorEimer et al. (2010). Figure 2 shows the photon noise from the CMB, atmosphere, and the reflective optics. Maintaining these elements at temperatures below 10K effectively eliminates their contribution to the photon noise, improving the noise equivalent power (NEP) by a factor of 3 compared to a comparable system with ambient temperature (250 K) optics. Achieving a comparable improvement with warm optics would require increasing the number of detectors by a factor of 9.
PIPER’s azimuth scan requires the beams to exit the dewar at an angle of 55∘ from the zenith. The open bucket dewar cannot be tipped more than a few degrees from vertical without compromising its performance; consequently, the VPM and primary mirrors must be located near the top of the dewar. Cooling from the efflux of boiloff gas alone is insufficient to maintain these elements at temperatures below 10 K. Maintaining the optics below 10 K requires a constant flow of liquid helium delivered directly to the PIPER mirrors.
PIPER operates at altitudes above 30 km. At the resulting ambient pressure of 1 kPa or less, liquid helium within the open bucket dewar boils at temperature below 1.7 K, well beneath the 2.2 K superfluid transition temperature. Liquid helium at temperatures below the point may be modeled as two weakly interacting fluids: a normal component and a superfluid component with zero viscosity and zero entropy. The low temperature and zero viscosity of the superfluid make standard mechanical pumps impractical. Superfluid pumps employing the thermomechanical effect provide a robust method to move macroscopic quantities of superfluid helium throughout the PIPER dewar without requiring moving parts and without injecting vibration or electromagnetic noise into the PIPER payload.
The thermomechanical effect in liquid helium was first described by Allen and Jones (1938) with a theoretical explanation by London (1938, 1939). Superfluid pumps have been used to cool optical elements in previous balloon flights Woody and Richards (1981); Peterson et al. (1985); Bernstein et al. (1990); Kogut et al. (2004); Singal et al. (2011) and have been demonstrated in space missions at zero gravityDiPirro and Castles (1986); DiPirro (2016). PIPER differs from these in several important aspects. Balloon-borne open-aperture optics cooled below 10 K provide a platform to enable millimeter through mid-infrared observations with near-space optical loads. The physical scale of the PIPER optics (50 cm diameter mirrors mounted 200 cm above the dewar floor) significantly exceeds the 6 cm diameter and 58 cm height of early balloon experimentsWoody and Richards (1981); Peterson et al. (1985); Bernstein et al. (1990), requiring a substantially greater cooling flow. The ARCADE-2 mission demonstrated 30 cm open-aperture at frequencies 3–90 GHzSingal et al. (2011); Fixsen et al. (2011). PIPER extends comparable open-aperture operation to larger apertures and frequencies 200–600 GHzPawlyk et al. (2018). The EXCLAIM balloon missionCataldo et al. (2021) plans to use a similar approach for 1 m optics at far-infrared wavelengths, while the BOBCAT programKogut et al. (2021) seeks to fly cold 3–4 meter optics. We describe the superfluid pumps for the PIPER balloon payload and discuss the thermal performance and cryogenic managment of the PIPER payload for two flights in 2017 and 2019. These pumps were originally developed for the ARCADE balloon payloadKogut et al. (2004); Singal et al. (2011), but have not previously been described. The in-flight performance of the PIPER superfluid pumps and the resulting temperature profiles within the open bucket dewar provide a benchmark for development of future balloon missions.

II Superfluid Pumps
Figure 3 shows the pump design. A plug with small pores blocks the intake into the pump body, which contains a resistive heater. The fraction of the liquid in the superfluid state is a function of temperature, increasing from zero at the point to 100% at absolute zero. Raising the temperature of the liquid inside the pump body decreases the superfluid fraction within the pump. Osmosis then drives the zero-viscosity superfluid from the higher concentration in the main bath across the plug and into the pump body. The small pore size in the plug impedes a corresponding counterflow of the normal component, creating a pressure differential
| (4) |
where is the fluid density, is the entropy, is the bath temperature, and is the temperature difference across the plugLondon (1938). At bath temperature 1.7 K, a temperature gradient mK will create a pressure 2.9 kPa sufficient to support a LHe column 200 cm above the bath. Additional heating then provides a steady flow of superfluid helium.
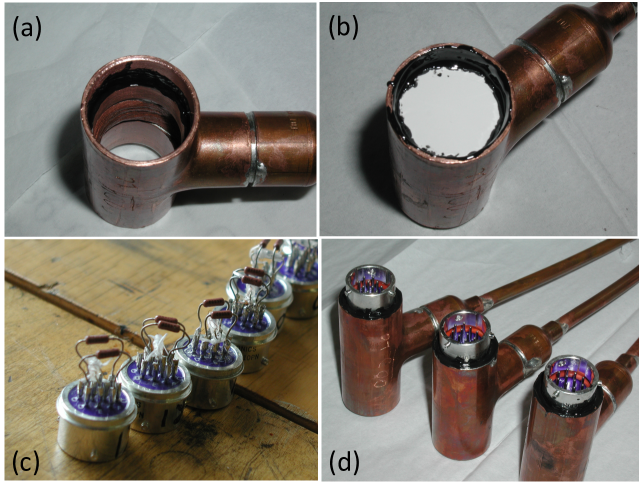
The PIPER superfluid pumps are designed for ease of manufacture. Figure 4 shows the as-built pumps. Each pump body consists of a standard household 25 mm copper plumbing tee. We first solder a copper reducer and flared compression fitting onto the tee “handle” which couples to thin-wall stainless steel tubing on the pump output. We epoxy a circular disk ground from CoorsTek P-1/2-BC porous ceramic into one end of the tee using Stycast 2850 FT epoxy to form a porous plug intake with pore diameter less than 0.5 m. A circular hermetic connector epoxied into the opposing end of the tee provides electrical connectivity. Two redundant 350 resistors wired in parallel provide ohmic heating within the pump body while a resistive ruthenium oxide thermometer monitors the internal pump temperature.
The electrical power required to produce the desired temperature (hence pressure) gradient depends in part on parasitic heat loss through the porous plug and the pump body to the bath. We coat the exterior of the copper pump body with a 2 mm layer of Stycast 2850 FT epoxy to provide modest thermal isolation between the pump interior and the main bath. Although a more sophisticated thermal isolation would allow the pump to operate at reduced electrical power, heat flow through the pump body to the bath supplies part of the heat dissipated within the bath to maintain a sufficient efflux of boiloff gas through the telescope aperture.

We calibrate the as-built performance for a set of 12 identical pumps using the test facility shown in Figure 5. We mount the pumps at the bottom of a liquid helium dewar and pump on the helium space to maintain the bath at temperatures 1.4–1.7 K (the temperature range expected during flight). A thin-wall stainless steel tube connects the outlet of the pump to a container positioned above the bath surface. A thermometer and an American Magnetics continuous level sensor record the temperature and liquid level in the container. A heater on the bottom of the container can be powered as needed to remove LHe from the container.


The flow rate of a pump depends on the electrical power dissipated by the pump heater as
| (5) |
where is the thermal conductivity from the pump interior to the bath,
| (6) |
is the power required to raise the temperature inside the pump,
| (7) |
is the power required to lift the liquid against gravity, and
| (8) |
is the kinetic power. Here is the liquid density, is the temperature, is the heat capacity, is the acceleration from gravity, is the radius of the output tubing, and is the difference in height between the top of the liquid in the container vs the top of the liquid in the bath. With no flow through the pump, the last three terms in Eq. 5 are identically zero, allowing a simple calibration of heat flow through the pump body. With the container initially empty, we increase the voltage to the pump heater while monitoring the container to determine the minimum power required to raise the helium column to height without delivering liquid into the container. Equating , we find mean value W K-1 for the parasitic loss at K.
Increasing the heater power above produces a flow of liquid helium into the container
| (9) |
where is the volume change associated with helium mass flow Broulik and Hess (1978); Nakai et al. (1996). We monitor the liquid level within the container to determine the change in volume per unit time, correcting the resulting flow rate from the pump for the passive boiloff within the container determined by setting and monitoring the container volume as the LHe boils away. Figure 6 shows the measured flow rate as a function of the heater power, demonstrating the expected linear dependence on the heater power,
| (10) |
with coefficient
| (11) |
Figure 7 shows the relative amplitudes of the terms in Eq. 5 at temperature 1.7 K. The bulk of the heater power goes to heating the liquid as it enters the pump and the parasitic heat flow through the pump body back to the bath. The power required to heat the liquid depends on the flow rate and dominates at higher flow rates (top panel), while the parasitic loss through the pump body is nearly independent of flow rate and becomes more important at low rates. The power needed to raise the liquid against gravity is always sub-dominant, while the kinetic term is negligible. At temperatures 1.5–1.7 K appropriate for float altitude 30–35 km, applied heater power of W induces flow rates for a single pump of 15 cm3 s-1 to a height 2 meters above the bath.
The linear dependence shown in Fig. 6 does not extend to arbitrarily high flow rate. Above a critical velocity, turbulence sets in so that additional heater power produces little additional flow Broulik and Hess (1978); Nakai et al. (1996). The demonstrated peak flow of 60 cm3 s-1 (215 liters hr-1) for a single pump is sufficient to maintain the PIPER optics at the bath temperature; consequently, we do not attempt to determine the maximum flow rate for the PIPER pump configuration.
| Pump | Outlet Target | Outlet Height (cm) |
|---|---|---|
| 1 | Port Dewar Aperture | 200 |
| 2 | Port Secondary Mirror | 130 |
| 3 | Port Primary Mirror | 180 |
| 4 | Starboard Primary Mirror | 180 |
| 5 | Starboard Secondary Mirror | 130 |
| 6 | Starboard Dewar Aperture | 200 |
| 7 | Port VPM | 180 |
| 8 | CADR Feedthrough | 120 |
| 9 | CADR Feedthrough | 120 |
| 10 | Receiver Heat Sink | 100 |
| 11 | Receiver Heat Sink | 100 |
| 12 | Starboard VPM | 180 |
III Flight Performance
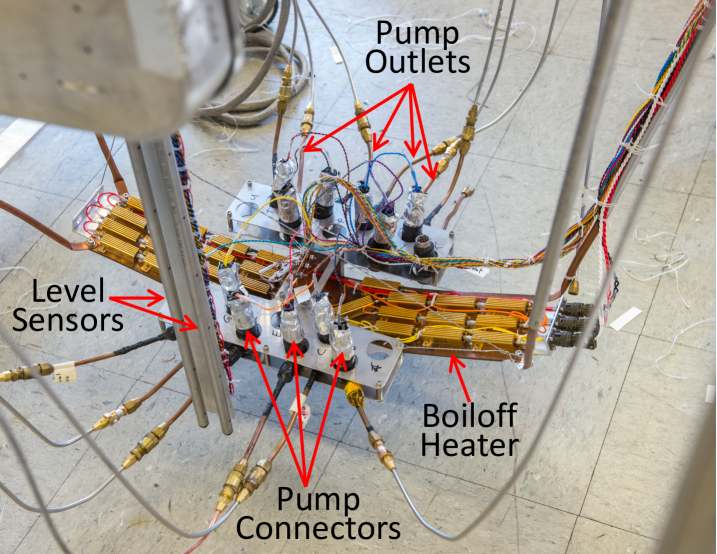
PIPER uses a set of 12 identical superfluid pumps to maintain the reflective optics at temperatures below 3 K. Figure 8 shows the set of pumps mounted in the flight manifold. A metal frame holds the pumps near the dewar bottom, oriented so the pump inlet port is horizontal. We direct the output of individual pumps to the rear surfaces of the VPM, primary mirror, and secondary mirror for each of the two telescopes. An additional pump for each telescope directs superfluid helium onto the top of the dewar wall, at the point where the telescope beam exits the dewar aperture. Two redundant pumps deliver LHe onto the vacuum feedthrough housing the high-current wiring for the continuous adiabatic demagnetization refrigerator (CADR). The final two pumps deliver LHe to a small container mounted atop the receiver cryostat, providing a stable heat sink for the receiver even when the LHe level within the dewar drops below the receiver (Fig 1). Table 1 summarizes the pump allocation and the height of each outlet above the dewar floor.
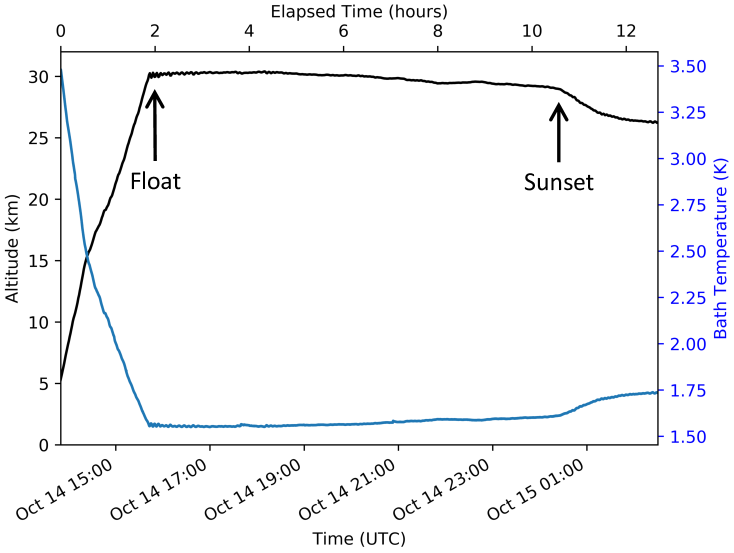
PIPER has flown twice: an engineering flight in 2017 and a science flight in 2019. Both flights demonstrated similar cryogenic performance. For simplicity, we show performance from the 2019 Oct 14 flight which launched at 13:36 UTC from Ft Sumner, NM with 1515 liters (195 kg) of liquid helium in the bucket dewar. By 15:46 the payload reached float altitude of 29.9 km. Figure 9 shows the temperature and altitude profile for this flight. Dual vents in the protective cover allow the dewar to vent during ascent so that the bath temperature is determined by the ambient pressure, reaching a stable value of 1.7 K at float altitude. The continuous LHe level sensor was turned on at 16:10, showing 985 liters (143 kg) remaining after ascent. The 35% drop in LHe volume during ascent corresponds to a 27% mass loss after accounting for the higher LHe density at 1.7 K, and is consistent with a 25% LHe mass loss during the superfluid transition plus minor losses from parasitic heat leaks during ascent. Cooling of the balloon after local sunset causes a loss in buoyancy; the resulting drop in altitude is reflected in modestly higher bath temperatures.
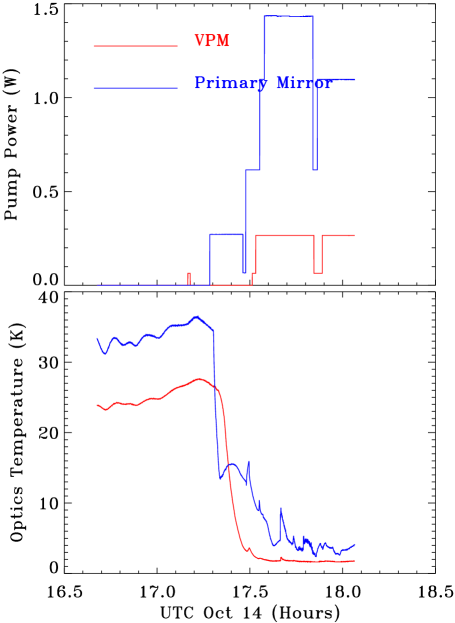
At 17:15 the superfluid pumps were powered to cool the optics. Figure 10 shows the optics temperature and commanded pump power for the two optical surfaces mounted highest within the dewar (the VPM and primary mirror). Prior to initiating LHe flow through the pumps, both surfaces showed a slow warming trend as temperatures stratified within the dewar. At 17:17 UTC the pump servicing the starboard primary mirror was turned on, followed promptly by a sharp drop in mirror temperature from 35 K to 3 K. Within 200 seconds, the starboard VPM temperature also began to fall, although the VPM pump was not commanded on until 17:31. Since the VPM and primary mirror are mounted on opposite sides of the dewar (Fig 1), the probable cause for the observed cooling is increased gas flow as LHe boils on warm elements within the dewar. Once the optics cooled, they remained near the bath temperature for the remainder of the flight.

The power loading from the sky to the detectors is small (below 1 pW). Even modest beam spillover onto warm surfaces could saturate the detectors. The warmest portion of the dewar interior is the top of the wall at the dewar aperture. To minimize optical power from the dewar aperture, we cool the aperture using a pair of pumps (one for each telescope). Figure 11 shows temperatures and commanded pump power for the starboard dewar aperture. A ruthenium oxide thermometer monitors the temperature at the pump outlet, but saturates at temperatures above 40 K. A diode thermometer monitors the temperature at the top of the dewar wall some 10 cm above the pump outlet, but saturates at temperatures below 30 K. At 17:39 the starboard aperture pump was powered on for 21 minutes at power levels 0.8 to 3.3 W, corresponding to commanded flow rates 50 to 350 liters hr-1. Temperatures at the dewar aperture promptly fell from 120 K to 60 K. Between 19:00 and 20:52 the aperture pumps were turned off, resulting in a slow rise in aperture temperatures from 60 K to 90 K. At 20:53 the aperture pump was turned on again for a commanded flow rate of 350 liters hr-1, after which the aperture temperature fell below 30 K where it remained for the duration of the flight.
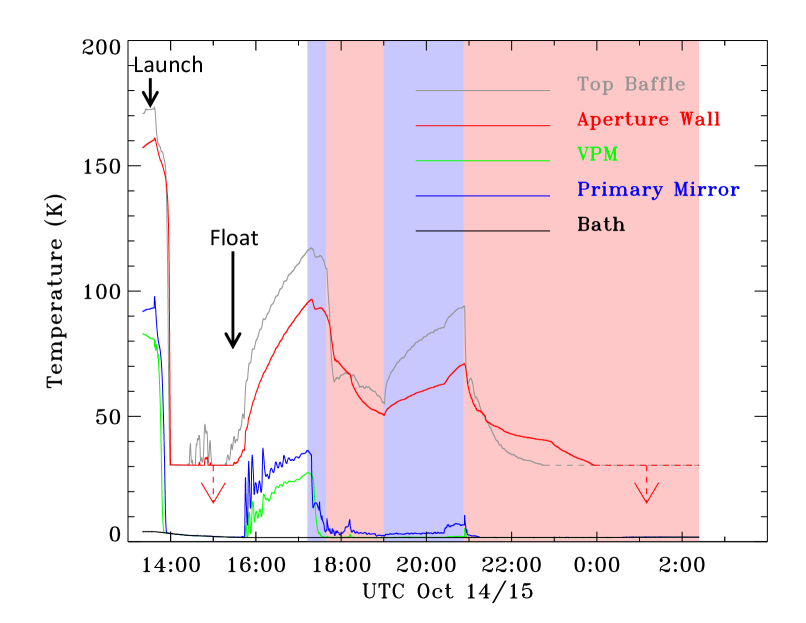
Note that cold gas efflux from the passive helium boiloff rate is not normally sufficient by itself to cool the PIPER optics or prevent warming in the upper portion of the dewar. Figure 12 shows the temperature profile for selected elements in the dewar throughout the flight. Prior to launch, temperatures within the dewar are stratified, with components further above the bath at progressively higher temperatures. During ascent, the rapid helium boiloff cools the telescope and dewar interior to the bath temperature. Once float altitude is reached, the boiloff rate decreases dramatically and the dewar re-stratifies. Direct application of superfluid LHe onto the telescope optics cools the optics to the bath temperature, but is not in itself sufficient to cool the entire dewar. Spraying LHe onto the dewar top wall restores near-isothermal operation at the bath temperature.
IV Discussion
PIPER uses a set of 12 identical superfluid pumps to maintain the optical surfaces at 1.7 K. Each pump is capable of producing flow rates in excess of 200 liters hr-1. Monitoring the liquid level within the dewar despite the resulting LHe spray and high boiloff gas flow proved challenging. The continuous level sensors flow a 75 mA current through a superconducting filament. In normal operation, the portion of the filament submerged in LHe remains superconducting, while ohmic heating drives the portion above the liquid into the normal state. The electrical resistance across the entire filament is thus proportional to the segment length above the liquid. Excessive cooling of the portion above the liquid, either by gas flow or liquid splashes, maintains the filament in the superconducting state to produce erroneous readings. We minimize this effect by mounting the level sensors within a hollow metal tube to shield it from both gas flow and liquid splashes. Small holes drilled through the tube every 10 cm in height allow the liquid level inside to equilibrate with the main dewar tank. With this modification, the level sensors performed as designed throughout flight.
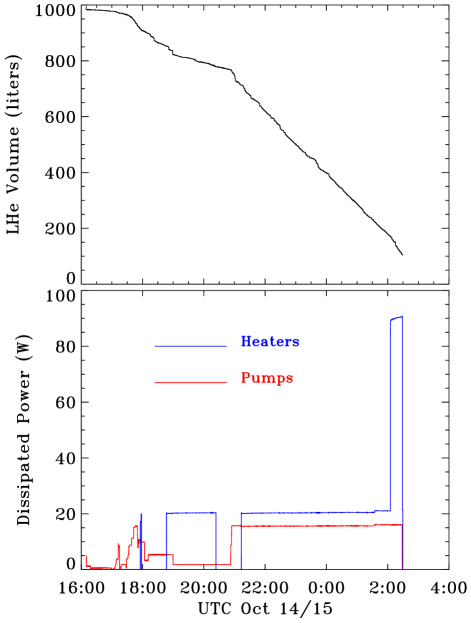
PIPER’s open-aperture operation requires a constant efflux of helium gas to prevent condensation of atmospheric gases onto the cold optics. The helium boiloff rate depends on both the power dissipated within the dewar as well as evaporation from the liquid flow directed onto warm portions of the dewar. Figure 13 shows the LHe volume within the dewar throughout operation at float altitude. Prior to initiation of pump activity, the observed boiloff rate of 6.4 liters hr-1 is consistent with the typical quiescent loss 8–13 liters hr-1 measured during ground tests. During the initial pump checkout from 17:40 to 18:45 UTC, the boiloff rate increased to 96 liters hr-1. From 18:45 to 20:20 a boiloff heater on the dewar bottom was powered at 20.3 W while all pumps except the two VPM pumps were turned off. Boiloff for this period fell to 29 liters hr-1. At 20:55 the pumps servicing the primary mirrors, VPMs, and dewar aperture ports were turned on, followed by the boiloff heater at 21:14. The boiloff rate then increased to 110 liters hr-1. Finally, at 02:05 Oct 15 a larger boiloff heater was powered at 90 W to dissipate remaining cryogen in preparation for flight termination and descent. The boiloff rate then increased to 177 liters hr-1.

The measured helium loss exceeds the minimum value derived from the electrical power dissipated within the liquid by the superfluid pumps and boiloff heaters. We ascribe the excess loss to the flow of liquid onto warmer components near the top of the dewar. Figure 14 compares the excess loss rate to the commanded flow for the combined port and starboard aperture pumps. We correct the measured LHe volume loss rate for the expected loss from the electrical power dissipation,
| (12) |
where is the pump electrical power, is the boiloff heater power, is the LHe density, and is the latent heat of evaporation. When the pumps are off, the excess loss is consistent with zero, as expected. We then compare the excess loss to the predicted flow rate (Eq. 10) delivered to the top of the dewar by the port and starboard aperture pumps combined. The excess helium loss can be explained if roughly 15% of the helium sprayed onto the dewar aperture evaporates to cool the metal top of the dewar, with the remaining 85% flowing back into the dewar. If correct, this interpretation suggests that there is little penalty in helium loss incurred by ”over-pumping” liquid to the top of the dewar in excess of the minimum flow required to cool the aperture.
V Conclusions
We describe a simple method to construct superfluid liquid helium pumps for the PIPER balloon-borne telescopes. Electrical power of 3 W supplied to heater resistors within each pump deliver a fluid flow as much as 100 cm3 s-1 (360 liters hr-1) to heights 200 cm above the helium bath. The resulting flow of superfluid LHe directed onto the telescope optics maintains the entire telescope at the 1.7 K bath temperature. Comparison of liquid loss within the bath to the total dissipated heater power suggests that the bulk of the helium flow directed onto the optics and the top of the dewar wall during flight simply recirculates back to the bath. If launched with the maximum practical helium load of 2600 liters, the observed boiloff rate of 110 liters hr-1 would allow 19 hours or more of fully cryogenic observations at float altitude.
Acknowledgements.
We thank the CSBF staff for launch support and gratefully acknowledge N. Bellis, P. Cursey, N. Gandilo, S. Pawlyk, and P. Taraschi for their contributions to the PIPER flight. Support for development of the superfluid pumps was provided by NASA WBS 51-188-02-54. PIPER is supported by NASA WBS 399131.02.06.04.08.DATA AVAILABILITY STATEMENT
The data that support the findings of this study are available from the corresponding author upon reasonable request.
References
- Lyth and Riotto (1999) D. H. D. H. Lyth and A. A. Riotto, Physics Reports 314, 1 (1999), hep-ph/9807278 .
- BICEP2 Collaboration and Keck Array Collaboration (2018) BICEP2 Collaboration and Keck Array Collaboration, Physical Review Letters 121, 221301 (2018), arXiv:1810.05216 [astro-ph.CO] .
- Mather (1982) J. C. Mather, Appl. Opt. 21, 1125 (1982).
- Kogut et al. (2012) A. Kogut, P. A. R. Ade, D. Benford, C. L. Bennett, D. T. Chuss, J. L. Dotson, J. R. Eimer, D. J. Fixsen, M. Halpern, G. Hilton, J. Hinderks, G. F. Hinshaw, K. Irwin, C. Jhabvala, B. Johnson, J. Lazear, L. Lowe, T. Miller, P. Mirel, S. H. Moseley, S. Rodriguez, E. Sharp, J. G. Staguhn, C. E. Tucker, A. Weston, and E. J. Wollack, in Millimeter, Submillimeter, and Far-Infrared Detectors and Instrumentation for Astronomy VI, Society of Photo-Optical Instrumentation Engineers (SPIE) Conference Series, Vol. 8452 (2012) p. 84521J.
- Pawlyk et al. (2018) S. Pawlyk, P. A. R. Ade, D. Benford, C. L. Bennett, D. T. Chuss, R. Datta, J. L. Dotson, J. R. Eimer, D. J. Fixsen, N. N. Gand ilo, T. M. Essinger-Hileman, M. Halpern, G. Hilton, G. F. Hinshaw, K. Irwin, C. Jhabvala, M. Kimball, A. Kogut, L. Lowe, J. J. McMahon, T. M. Miller, P. Mirel, S. H. Moseley, S. Rodriguez, E. Sharp, P. Shirron, J. G. Staguhn, D. F. Sullivan, E. R. Switzer, P. Taraschi, C. E. Tucker, A. Walts, and E. J. Wollack, in Millimeter, Submillimeter, and Far-Infrared Detectors and Instrumentation for Astronomy IX, Society of Photo-Optical Instrumentation Engineers (SPIE) Conference Series, Vol. 10708 (2018) p. 1070806.
- Chuss et al. (2012) D. T. Chuss, E. J. Wollack, R. Henry, H. Hui, A. J. Juarez, M. Krejny, S. H. Moseley, and G. Novak, Appl. Opt. 51, 197 (2012), arXiv:1106.5984 [astro-ph.IM] .
- Chuss et al. (2014) D. T. Chuss, J. R. Eimer, D. J. Fixsen, J. Hinderks, A. J. Kogut, J. Lazear, P. Mirel, E. Switzer, G. M. Voellmer, and E. J. Wollack, Review of Scientific Instruments 85, 064501 (2014), arXiv:1403.1652 [astro-ph.IM] .
- Switzer et al. (2019) E. R. Switzer, P. A. R. Ade, T. Baildon, D. Benford, C. L. Bennett, D. T. Chuss, R. Datta, J. R. Eimer, D. J. Fixsen, N. N. Gandilo, T. M. Essinger-Hileman, M. Halpern, G. Hilton, K. Irwin, C. Jhabvala, M. Kimball, A. Kogut, J. Lazear, L. N. Lowe, J. J. McMahon, T. M. Miller, P. Mirel, S. H. Moseley, S. Pawlyk, S. Rodriguez, E. Sharp, P. Shirron, J. G. Staguhn, D. F. Sullivan, P. Taraschi, C. E. Tucker, A. Walts, and E. J. Wollack, Review of Scientific Instruments 90, 095104 (2019), arXiv:1909.06440 [astro-ph.IM] .
- Eimer et al. (2010) J. R. Eimer, P. A. R. Ade, D. J. Benford, C. L. Bennett, D. T. Chuss, D. J. Fixsen, A. J. Kogut, P. Mirel, C. E. Tucker, G. M. Voellmer, and E. J. Wollack, in Ground-based and Airborne Telescopes III, Society of Photo-Optical Instrumentation Engineers (SPIE) Conference Series, Vol. 7733 (2010) p. 77333B.
- Allen and Jones (1938) J. F. Allen and H. Jones, Nature (London) 141, 243 (1938).
- London (1938) H. London, Nature (London) 142, 612 (1938).
- London (1939) H. London, Proceedings of the Royal Society of London Series A 171, 484 (1939).
- Woody and Richards (1981) D. P. Woody and P. L. Richards, The Astrophysical Journal 248, 18 (1981).
- Peterson et al. (1985) J. B. Peterson, P. L. Richards, and T. Timusk, Physical Review Letters 55, 332 (1985).
- Bernstein et al. (1990) G. M. Bernstein, M. L. Fischer, P. L. Richards, J. B. Peterson, and T. Timusk, The Astrophysical Journal 362, 107 (1990).
- Kogut et al. (2004) A. Kogut, D. J. Fixsen, S. Levin, M. Limon, P. M. Lubin, P. Mirel, M. Seiffert, and E. Wollack, The Astrophysical Journal Supplement Series 154, 493 (2004), arXiv:astro-ph/0402578 [astro-ph] .
- Singal et al. (2011) J. Singal, D. J. Fixsen, A. Kogut, S. Levin, M. Limon, P. Lubin, P. Mirel, M. Seiffert, T. Villela, E. Wollack, and C. A. Wuensche, The Astrophysical Journal 730, 138 (2011), arXiv:0901.0546 [astro-ph.IM] .
- DiPirro and Castles (1986) M. DiPirro and S. Castles, Cryogenics 26, 84 (1986).
- DiPirro (2016) M. DiPirro, “The superfluid helium on-orbit transfer (shoot) flight demonstration,” in Cryostat Design: Case Studies, Principles and Engineering, edited by J. Weisend II (Springer International Publishing, Cham, 2016) pp. 95–116.
- Fixsen et al. (2011) D. J. Fixsen, A. Kogut, S. Levin, M. Limon, P. Lubin, P. Mirel, M. Seiffert, J. Singal, E. Wollack, T. Villela, and C. A. Wuensche, The Astrophysical Journal 734, 5 (2011), arXiv:0901.0555 [astro-ph.CO] .
- Cataldo et al. (2021) G. Cataldo, P. Ade, C. Anderson, A. Barlis, E. Barrentine, N. Bellis, A. Bolatto, P. Breysse, B. Bulcha, J. Connors, P. Cursey, N. Ehsan, T. Essinger-Hileman, J. Glenn, J. Golec, J. Hays-Wehle, L. Hess, A. Jahromi, M. Kimball, A. Kogut, L. Lowe, P. Mauskopf, J. McMahon, M. Mirzaei, H. Moseley, J. Mugge-Durum, O. Noroozian, T. Oxholm, U.-L. Pen, A. Pullen, S. Rodriguez, P. Shirron, G. Siebert, A. Sinclair, R. Somerville, R. Stephenson, T. Stevenson, E. Switzer, P. Timbie, C. Tucker, E. Visbal, C. Volpert, E. Wollack, and S. Yang, arXiv e-prints , arXiv:2101.11734 (2021), arXiv:2101.11734 [astro-ph.IM] .
- Kogut et al. (2021) A. Kogut, S. Denker, N. Bellis, T. Essinger-Hileman, L. Lowe, and P. Mirel, arXiv e-prints , arXiv:2103.12090 (2021), arXiv:2103.12090 [astro-ph.IM] .
- Broulik and Hess (1978) B. M. Broulik and G. B. Hess, Physica B+C 94, 169 (1978).
- Nakai et al. (1996) H. Nakai, N. Kimura, M. Murakami, T. Haruyama, and A. Yamamoto, Cryogenics 36, 667 (1996).