Nuclear-Physics Multi-Messenger Astrophysics Constraints on the Neutron-Star Equation of State:
Adding NICER’s PSR J0740+6620 Measurement
Abstract
In the past few years, new observations of neutron stars and neutron-star mergers have provided a wealth of data that allow one to constrain the equation of state of nuclear matter at densities above nuclear saturation density. However, most observations were based on neutron stars with masses of about 1.4 solar masses, probing densities up to 3-4 times the nuclear saturation density. Even higher densities are probed inside massive neutron stars such as PSR J0740+6620. Very recently, new radio observations provided an update to the mass estimate for PSR J0740+6620 and X-ray observations by the NICER and XMM telescopes constrained its radius. Based on these new measurements, we revisit our previous nuclear-physics multi-messenger astrophysics constraints and derive updated constraints on the equation of state describing the neutron-star interior. By combining astrophysical observations of two radio pulsars, two NICER measurements, the two gravitational-wave detections GW170817 and GW190425, detailed modeling of the kilonova AT2017gfo, as well as the gamma-ray burst GRB170817A, we are able to estimate the radius of a typical 1.4-solar mass neutron star to be at 90% confidence. Our analysis allows us to revisit the upper bound on the maximum mass of neutron stars and disfavors the presence of a strong first-order phase transition from nuclear matter to exotic forms of matter, such as quark matter, inside neutron stars.
LA-UR-21-20534
1 Introduction
One of the major challenges in modern nuclear physics is the characterisation of the equation of state (EOS) describing matter at supra-nuclear densities. These densities are probed inside neutron stars (NSs), which are among the most compact objects in the Universe. Therefore, NSs are ideal laboratories to test theories of strong interactions at conditions that cannot be realized experimentally on Earth and to validate or falsify theoretical models for the EOS of dense neutron-rich matter (see, e.g., Lattimer (2012) and Ozel & Freire (2016)).
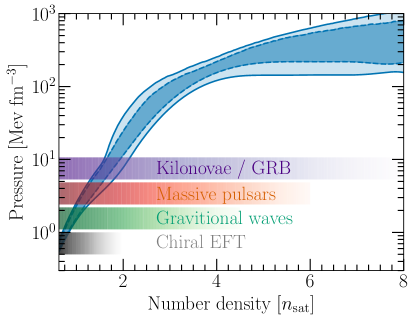
In the recent years, a number of new observational constraints on the EOS appeared, either from single NSs, such as the observations of massive pulsars (Demorest et al., 2010; Antoniadis et al., 2013; Arzoumanian et al., 2018; Cromartie et al., 2020) or the X-ray pulse-profile modeling of J0030+0451 by the Neutron-Star Interior Composition Explorer (NICER) (Miller et al., 2019b; Riley et al., 2019), but also from the observation of binary NS mergers via gravitational waves (GWs), GW170817 (Abbott et al., 2017a, 2019b, 2018, 2019a) and GW190425 (Abbott et al., 2020a, 2021), and corresponding electromagnetic (EM) counterparts associated with GW signals, namely AT2017gfo and GRB170817A (e.g., Abbott et al. (2017b); Arcavi et al. (2017); Coulter et al. (2017); Lipunov et al. (2017); Soares-Santos et al. (2017); Tanvir et al. (2017); Valenti et al. (2017)). All these measurements provide key input to analyse the NS structure and the EOS. This wealth of data made available by multi-messenger observations of NSs and NS mergers in the last years has energized the field and triggered many exciting studies (e.g., Bauswein et al. (2017); Metzger (2017); Radice et al. (2018); Ruiz et al. (2018); Annala et al. (2018); Most et al. (2018); Hinderer et al. (2019); Radice & Dai (2019); Tews et al. (2018b); Coughlin et al. (2019); Essick et al. (2020a); Capano et al. (2019); Raaijmakers et al. (2020); Dietrich et al. (2020); Essick et al. (2020b, 2021)). However, most of the existing observational data that is sufficiently constraining to improve our understanding of the EOS, e.g., from GW170817 or NICER observations of J0030+0451, probe typical NSs with masses of the order of . Hence, these measurements explore the EOS ‘only’ up to densities of the order of three to four times the nuclear saturation density, ; cf. Fig. 1. These ‘intermediate’ densities are likely below the onset of a possible phase transition to exotic forms of matter, e.g., quark matter (see, e.g., Annala et al. 2020).
To explore the high-density EOS and to place constraints on the possible existence of a phase transition, it is crucial to observe isolated NSs close to the maximum mass supported by the EOS. Alternatively, the high-density part of the EOS can also be probed through binary NS mergers. Once the two stars merge, they can potentially form a hypermassive remnant even exceeding the maximum mass of individual NSs (Radice et al., 2017; Margalit & Metzger, 2017; Ruiz et al., 2018; Rezzolla et al., 2018). However, such remnants have not yet been observed through GWs but only through the associated EM observations which, due to their more involved interpretation, leads to larger uncertainties for the EOS (e.g., Heinzel et al. (2021) and Kawaguchi et al. (2020)). Fortunately, the recently published second observation by NICER (Wolff et al., 2021; Miller et al., 2021b; Riley et al., 2021b) provides a crucial new data point for an isolated NS close to the maximum mass.
NICER is a NASA mission on board the International Space Station that measures the X-ray pulse profile of selected pulsars which allows one to extract information on the configuration of X-ray hot spots. Additionally, the pulse profile is sensitive to the light bending around the pulsar (see Sec. 4 in Wolff et al. 2021), and therefore, provides information on the NS compactness, which in turn allows to extract data on the NS mass and radius. The first NICER measurement was reported in December 2019 and targeted the pulsar J0030+0451, for which both mass and radius were unknown. Two independent analyses of the first NICER observation provided mass-radius constraints for this NS of and km (Riley et al., 2019) or and km (Miller et al., 2019b) at 68% confidence.
In its second observation, NICER analyzed X-ray data from the millisecond pulsar PSR J0740+6620 (Miller et al., 2021b; Riley et al., 2021b). This NS is the heaviest NS observed to date with a known mass of (Fonseca et al. 2021, updated from its original value reported by Cromartie et al. 2020). Combining the known mass with the pulse-profile modeling allowed the NICER collaboration to measure the radius of PSR J0740+6620. Two independent analyses by the NICER collaboration found the radius to be (Riley et al., 2021b) or (Miller et al., 2021b) at 68% confidence. While the NICER data provide information about the modulated emission from the star, the analyses of Miller et al. (2021b) and Riley et al. (2021b) additionally used information from the X-ray Multi-Mirror (XMM)-Newton telescope (Strüder et al., 2001; Turner et al., 2001) to improve the total flux measurement from the star, due to a smaller rate of background counts.
In this article, we incorporate the new X-ray observation of PSR J0740+6620 and its updated mass within our existing nuclear-physics multi-messenger astrophysics (NMMA) framework, which we have developed and described in Dietrich et al. (2020). This allows us to revisit our constraints on the NS EOS, in particular on the existence of strong first-order phase transitions, the maximum mass of neutron stars, and the nature of GW190814 (Tews et al., 2021).
This paper is structured as follows. In Section 2 we briefly summarize our previous results and review recent works including the NICER measurement of PSR J0740+6620. In Section 3, we review our NMMA framework. Using the new NICER data, in Section 4, we discuss our prediction for the NS EOS (Sec. 4.1), the NS maximum mass and the probability for GW190814 (Abbott et al., 2020b) to be a black hole-NS merger (Sec. 4.2), and investigate to what extent the recent NICER observations informs us about the existence of a phase transition in the EOS (Sec. 4.3). We will give a summary of our results in Section 5.
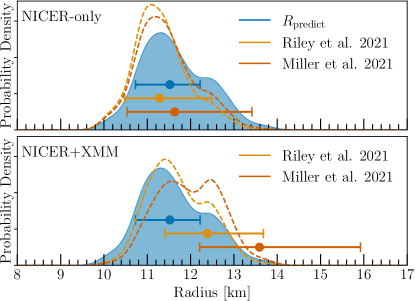
2 Previous works
In our previous work (Dietrich et al., 2020), we included the pulsar mass measurements of PSR J0740+6620, PSR J0348+4042, and PSR J1614-2230 (Cromartie et al., 2020; Antoniadis et al., 2013; Arzoumanian et al., 2018; Demorest et al., 2010), GW data from the NS mergers GW170817 and GW 190425, information from the kilonova AT2017gfo, the gamma-ray burst GRB170817A as well as its afterglow (Abbott et al., 2017b), and the NICER observation of PSR J0030+0451 (Riley et al., 2019; Miller et al., 2019b) in a Bayesian Inference framework based on systematic nuclear-physics input from chiral effective field theory (EFT). We obtained a radius of a typical NS of km (Dietrich et al., 2020) at 68% uncertainty. Based on these results, our prediction of the radius of PSR J0740+6620 was at 68% confidence level. We compare this prediction with the recent NICER measurements in Fig. 2. We find that our estimate is in excellent agreement with the results obtained in Riley et al. (2021b) and Miller et al. (2021b) using only the NICER data. Once data from the XMM-Newton observatory is additionally taken into account, the radius is pulled to larger values decreasing the agreement between our prediction and the measurement, but deviations are . This effect is stronger for the Maryland-Illinois result (Miller et al., 2021b), which appears to be caused by a number of differences between the individual analyses of Miller et al. (2021b) and Riley et al. (2021b): differences in the prior on the cross-calibration uncertainty of NICER and XMM-Newton which is allowed to be two times larger than the measured deviation in Miller et al. (2021b) but an order of magnitude larger in the analysis of Riley et al. (2021b), differences in the radius prior which has an upper bound of 16 km in the analysis of Riley et al. (2021b) and approximately 25 km in Miller et al. (2021b), differences in the sampling algorithms and their convergence that affected the posterior widths, and differences in the assumed distribution of the blank-sky counts to estimate the XMM background.
Since the first announcement of the NICER results for PSR J0740+6620 (NICER, 2021) there have been several studies of the implications of this radius measurement (Somasundaram & Margueron, 2021; Biswas, 2021; Li et al., 2021; Annala et al., 2021). However, these studies did not use the full posterior samples released in Riley et al. (2021b); Miller et al. (2021b), but employed hard cuts for the radius-mass measurement, which can lead to biases during the final multi-messenger analysis, as shown in, e.g., Miller et al. (2019a). In more detail, the studies in Somasundaram & Margueron (2021) and Biswas (2021) were based on phenomenological nuclear-physics descriptions, but did not include systematic nuclear-theory calculations with uncertainty estimates, e.g., from chiral EFT, to constrain the low-density EOS. Instead, Somasundaram & Margueron (2021) studied the impact of the NICER observation of PSR J0740+6620 on the existence of a first-order phase transition or quarkyonic matter using two different models for the high-density part of the EOS. They found that the NICER observation of PSR J0740+6620 cannot rule out first-order phase transitions, but this study also did not systematically include other astrophysical constraints in a Bayesian analysis. Using a different EOS parametrization, Biswas (2021) combined a hypothetical radius measurement of PSR J0740+6620 with previous GW and NICER observations and the recent result for the neutron-skin thickness of 208Pb from the PREX-II experiment (Adhikari et al., 2021). In contrast to these works, Annala et al. (2021) used theoretical nuclear-physics input from chiral EFT at low densities and perturbative Quantum Chromodynamics (QCD) at high densities to constrain the EOS. However, they did not perform a Bayesian analysis to constrain the EOS given available astrophysical data, but instead implemented various constraints using hard cuts; see above. None of these papers included multi-messenger constraints from a detailed modeling and parameter estimation of EM counterparts associated with binary NS mergers, e.g., from a Bayesian Inference of AT2017gfo and GRB170817A.
Raaijmakers et al. (2021) and Miller et al. (2021b) were directly based on the NICER and XMM measurements of PSR J0740+6620 and studied the influence of the new NICER data using the full posterior samples. For this purpose, Miller et al. (2021b) employed very general and conservative EOS priors that were not directly informed by nuclear-theory calculations at low densities. In addition to the NICER observations of pulsars PSR J0030+0451 and PSR J0740+6620, final EOS constraints in Miller et al. (2021b) used other heavy-pulsar mass measurements, gravitational-wave observations of GW170817 and GW190425, and constraints on the nuclear symmetry energy. Results presented in Raaijmakers et al. (2021) were instead constrained by chiral EFT calculations up to , comparing four different chiral EFT calculations. In addition, EM information from AT2017gfo were included as well as information from GW170817 and GW190425.
In this paper, in contrast to the studies presented in Miller et al. (2021b) and Raaijmakers et al. (2021), we use updated GW models (Dietrich et al., 2019) and different kilonova models with detailed microphysical input that also explore deviations from spherical symmetry (Kasen et al., 2017; Bulla, 2019); cf. Heinzel et al. (2021) and Dietrich et al. (2020) for details about systematic uncertainties of kilonova modelling. In case of Miller et al. (2021b), we also include low-density input from chiral EFT.
3 Methodology
Our NMMA framework uses Bayesian inference tools to analyze a set of EOSs with respect to their agreement with several astrophysical observations of NSs.
The initial EOS set is constrained at low densities by calculations of the energy per particle of neutron matter using interactions from chiral EFT (Epelbaum et al., 2009; Machleidt & Entem, 2011). Chiral EFT is a low-energy systematic theory for nuclear forces and provides a momentum expansion of two-nucleon and multi-nucleon interactions. Interactions are arranged in an order-by-order scheme that organizes various interaction mechanisms according to their relative importance. By going to higher orders, the precision of the calculation is improved at the cost of more involved calculations. An important benefit of the chiral EFT scheme is that it allows one to estimate theoretical uncertainties (Epelbaum et al., 2015; Drischler et al., 2020). Given chiral EFT Hamiltonians describing the strong interactions between nucleons, a many-body method is required to solve the many-body Schröedinger equation and calculate the energy per particle. The EOS set used here is constrained by calculations employing Quantum Monte Carlo (QMC) methods which are among the most precise methods to solve the nuclear many-body problem (Carlson et al., 2015) and have been combined with chiral EFT interactions with great success (e.g., Gezerlis et al. (2013); Piarulli et al. (2018); Lonardoni et al. (2018); Lynn et al. (2019)). Specifically, here we use the QMC calculations by Tews et al. (2018a) using local chiral EFT interactions from Gezerlis et al. (2013, 2014); Tews et al. (2016), and Lynn et al. (2016), which agree very well with other microscopic calculations based on chiral EFT (Huth et al., 2021). Furthermore, Raaijmakers et al. (2021) have shown that EOS constraints are only weakly dependent on the choice of a particular chiral EFT calculation at low densities.
The range of applicability of chiral EFT calculations is limited because the average nucleon momentum increases with density and the momentum expansion breaks down. While the exact breakdown density for individual chiral EFT interactions is unknown, it was estimated to be between for the QMC calculations used here (Tews et al., 2018a; Essick et al., 2020b). We constrain the NS EOS with QMC calculations of the EOS up to a density of but results were found to show only a very weak dependence to a variation of this density between (Essick et al., 2020b). We use the speed-of-sound extension scheme from Tews et al. (2018b) to extend the EOS to higher densities in a general way. The speed-of-sound extension scheme allows us to explore the physically plausible EOS space without making any strong model assumptions (see also Greif et al. (2019) and Raaijmakers et al. (2021)). We only require the EOSs to explore speeds of sound, , limited by in units of the speed of light, and to provide a maximum mass for NSs of at least 1.9 . Our EOS set explicitly includes EOS with regions of sudden stiffening or softening, e.g., strong first-order phase transitions towards exotic forms of matter. For our EOS set, we impose a uniform prior on the radius of a typical 1.4 NS, . To estimate the impact of the particular choice of the EOS prior, we have also investigated an EOS prior without this additional requirement, see Tab. 2 of the Appendix
As a next step, we analyze our EOS set with respect to available NS observations. We start by incorporating a constraint on the maximum mass of NSs through the radio observations of the heaviest pulsars known to date, PSR J0348+4042 (Antoniadis et al., 2013) and PSR J1614-2230 (Arzoumanian et al., 2018). The existence of these pulsars can only be explained if the NS EOS supports masses that lie above the individual masses of these pulsars. Hence, radio pulsar measurements of heavy NSs provide a lower bound on the maximum NS mass and the constraints of the high-density EOS; cf. Fig. 1. We stress that at this stage we do not include the mass measurement of PSR J0740+6620, because information will be included through the new NICER measurement. An upper bound of the maximum NS mass follows from the EM observation of GRB170817A and AT2017gfo. As outlined in, e.g., Margalit & Metzger (2017), the observed EM signatures indicate the formation of a black hole as the final product of the binary NS merger GW170817. Combining this information with the estimated total remnant mass from the GW observation leads to a non-rotating maximum NS mass of (Rezzolla et al., 2018). Incorporating the constraints on the maximum mass leads to a re-weighting of the original chiral EFT EOS set.
As a next step, we include the NICER measurement of PSR J0030+0451, for which the inferred mass-radius posterior probability distributions was not dominated by systematic uncertainties and inferred system parameters were in agreement for different analyses (Miller et al., 2019b; Riley et al., 2019). Finally, we use the resulting EOS set for GW and kilonova parameter estimation following the methods outlined in Dietrich et al. (2020).

We now include the NICER observations of PSR J0740+6620 (Miller et al., 2021b; Riley et al., 2021b), which are based on a Bayesian inference approach to analyze the energy-dependent thermal X-ray signal of PSR J0740+6620. We employ the posterior samples obtained with the two-circular, uniform-temperature spot model from Miller et al. (2021a, b) and the two disjoint , uniform-temperature spots model from Riley et al. (2021b, a). These models provide best agreement with the observed NICER and NICER+XMM data and, for the latter, constrain the radius of PSR J0740+6620 with a mass of (Cromartie et al., 2020; Fonseca et al., 2021) to be and at 68% confidence for Miller et al. (2021b) and Riley et al. (2021b), respectively.
The corresponding likelihood is given by
| (1) | ||||
where is the joint-posterior probability distribution of mass and radius of PSR J0740+6620 as measured by NICER and we use the fact that the radius is a function of mass for a given EOS.
4 Results
In the following, we discuss the results of our NMMA framework when the new NICER measurement is included. We give results using constraints from the X-PSI analysis by the Amsterdam group (Riley et al., 2021b) or using the analysis of the Illiniois-Maryland group (Miller et al., 2021b) outside/inside of parentheses. The combined results refer to an analysis using the average of the two posterior distributions for PSR J0740+6620. Our findings are summarized in Tab. 1.
4.1 Neutron-star equation of state
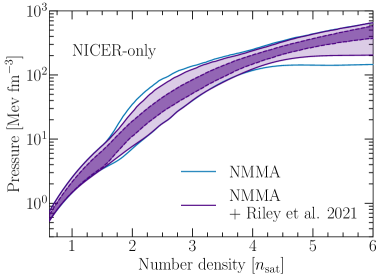
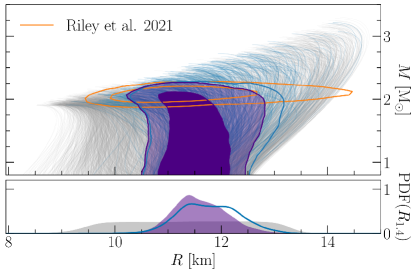
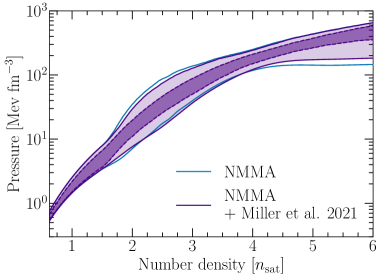
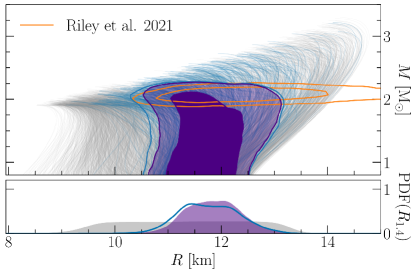
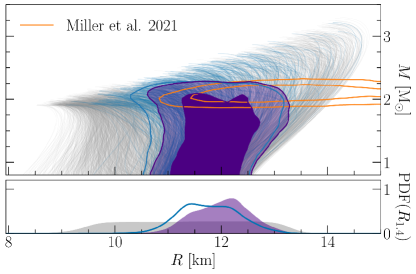
In Fig. 3, we show the EOS and mass-radius posteriors after the inclusion of the radius measurement of PSR J0740+6620 using only NICER data. In this case, the NICER radius measurement shows excellent agreement with the NMMA prediction for the radius of PSR J0740+6620, see also Fig. 2. Because the NICER-only data slightly prefers softer EOS in the NMMA set, we observe a softening of our total EOS posterior. This can also be seen from the posteriors for the mass-radius relation, that is slightly shifted to lower radii. For example, the NMMA framework predicts the radius of a NS, , to be without the new NICER measurement. Including the measurement, we find and a combined result of at credibility. The median predictions change minimally, by m, and the uncertainties improve slightly from 4.5% to 4.2% for the combined result at 68% credible interval (and from 7.1% to 6.9% at 90% credible interval). Similarly, the radius posteriors of PSR J0740+6620 after including the NICER-only data are shown in Fig. 2. The estimated radius changes from to () at 68% credibility.
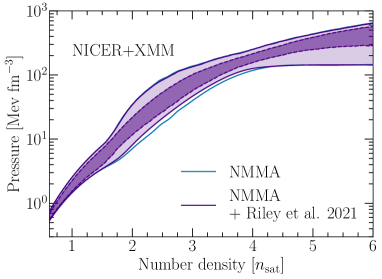
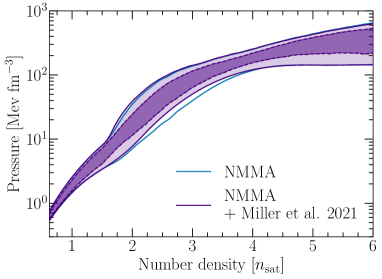
The situation is different when the XMM data is added. In Fig. 4, we show our results for the EOS and the mass-radius relation when including the NICER and XMM data. Now, these measurements predict larger radii compared to our initial estimation for PSR J0740+6620, see Fig. 2. This slightly shifts our EOS posterior to the stiffer end and the mass-radius relation to larger radii. By including the NICER-XMM measurement, changes from without the new data to and a combined result of . Though the measured radii are well above the NMMA prediction, the uncertainties are sizable and, hence, the radius measurement of PSR J0740+6620 does not change our EOS results significantly. The medians shift to slightly larger values but remain statistically consistent with a comparable uncertainty. Similarly, the NMMA radius prediction for PSR J0740+6620 changes from without the new data to () at 68% credibility.
4.2 Neutron-star maximum mass and GW190814
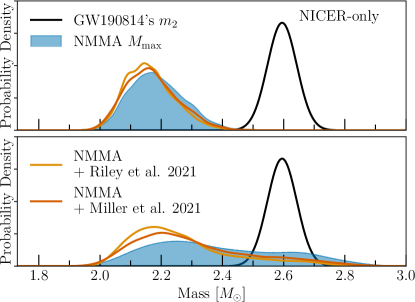
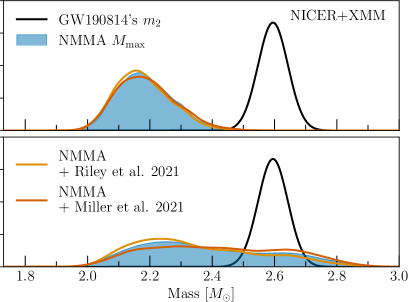
The radius measurement of PSR J0740+6620, and its impact on the EOS, allows us to revisit our estimate for the maximum allowed mass for NSs, , which we found to be without including the new NICER data (Tews et al., 2021), see Fig. 5. Please note that this original estimate used the previously larger mass for PSR J0740+6620 from Cromartie et al. (2020), which was updated to a lower value in Fonseca et al. (2021).
Because the NICER-only data favors slightly softer EOS, see the previous discussion, the maximum-mass estimate decreases slightly to . When additionally considering the XMM data, the new data prefers slightly stiffer EOS but the maximum mass estimate, , does not change significantly. The reason is that the upper limit on is mainly determined by the constraint of Rezzolla et al. (2018). Because of the strong impact of this constraint, we also consider the scenario where this upper limit on is not included. In this case, is found to be without the new NICER data and changes to including the NICER-only data and to for the NICER and XMM data. The changes are small because the increased stiffness coming from the pulsar radius measurement competes with the updated lower pulsar mass.
The posterior of affects the classification of the secondary component of GW190814 (Abbott et al., 2020b), where a compact object merged with a black hole. Due to its extreme mass ratio and the low primary spin, the nature of the secondary component cannot be extracted from observational data. Instead, it has to be extracted from EOS modeling, see, e.g, Kalogera & Baym (1996), Biswas et al. (2021), Essick & Landry (2020), and Tews et al. (2021). To examine the probability for the secondary component of GW190814 to be a NS, the posterior of , and that of GW190814’s , are compared. The probability for GW190814 being a NS-black hole merger is given by (Tews et al., 2021),
| (2) | ||||
Due to the strong tension between GW190814’s and the upper limit from Rezzolla et al. (2018), the inclusion of the NICER measurement of PSR J0740+6620 does not impact the classification of this system. With or without the new NICER measurement, the probability for GW190814 to be NS-black hole merger is estimated to be . However, if we relax the upper limit on , i.e., do no include the analysis of Rezzolla et al. (2018), the probabilities change. Using the NICER-only data, the probability for GW190814 to be a NS-black hole system changes to 6.30(10.5)%, lower than the previous estimation of 19% in Tews et al. (2021). When additionally including XMM data, the probability for GW190814 to be a NS-black hole system changes to 15.2 (24.4)%. The corresponding posterior distributions are shown in Fig. 5. Given all current observational and theoretical knowledge of the NS EOS, a binary black hole merger remains the most consistent scenario for GW190814.
4.3 Existence of a phase transition
QCD predicts that nucleonic matter undergoes a phase transition to quark matter at very high densities. If such a phase transition is realized in neutron stars, at which exact density such a phase transition would occur, and which properties this phase transition would exhibit is unknown (Glendenning, 1992; Alford & Reddy, 2003; Alford et al., 2007). A strong first-order phase transition, i.e., a segment in the EOS where the speed of sound vanishes, would be a ’smoking gun’ signature for the existence of exotic forms of matter inside NSs.
Here, we calculate the Bayes factor for the presence of such a strong first-order phase transition against the absence of it. The Bayes factor is given by
| (3) | ||||
where () is the posterior probability for the presence (absence) of phase transition, and () is the corresponding prior probability. A Bayes factor larger than one indicates that the presence of a phase transition is preferred, while a Bayes factor smaller than one suggests that the presence of a phase transition is disfavoured. Without information from the NICER measurement of PSR J0740+6620, we find the Bayes factor to be .
When including NICER-only data, softer EOS are preferred and the Bayes factors in favor of a phase transition change to . In this case, the NICER radius measurement of PSR J0740+6620 alone slightly increases the Bayes factor for the presence of a strong first-order phase transition within a NS with respect to the original NMMA analysis, but such a transition remains disfavoured considering all data. On the other hand, with the additional inclusion of the XMM data, the Bayes factor changes to . Following the interpretation of the Bayes factor described in Jeffreys (1961), the presence of a phase transition inside a NS is disfavoured in all cases, yet it is not ruled-out, in agreement with the findings of Somasundaram & Margueron (2021).
In all cases, even though a radius measurement of PSR J0740+6620 probes the EOS at the highest densities we can observe in the Cosmos to date, the NICER data adds only limited information due to its sizable uncertainties. In addition, it remains inconclusive if the radius measurement of PSR J0740+6620 itself suggests the presence of a phase transition inside a NS because the NICER-only and NICER-XMM data shift the Bayes factors in different directions; cf. last column in Tab. 1. Moreover, an analysis using a different EOS prior shows that the direction of the shift is prior-dependent; cf. Tab. 2.
| Quantity | NMMA | NMMA | NMMA | NMMA + Combined |
| + Miller et al. 2021 | + Riley et al. 2021 | Miller & Riley et al. 2021 | ||
5 Summary
Using our nuclear physics – multi-messenger astronomy framework (Dietrich et al., 2020), we have studied the impact of the new NICER observations of PSR J0740+6620 on the neutron-star EOS. While the NICER data alone shows good agreement with our previous NMMA predictions and therefore, validates our results, the additional inclusion of XMM data prefers slightly stiffer EOS. However, due to the large uncertainties of 10-20% in the NICER radius measurement of PSR J0740+6620, changes remain small.
In particular, the radius of a NS changes from km (Dietrich et al., 2020) to and for the analyses from Riley et al. (2021b) and Miller et al. (2021b), respectively, at 90% confidence without the XMM data and to and with the XMM data. Combining the latter results, we obtain a final radius estimate of (at 90% confidence), showing excellent agreement with our initial prediction. Although the NICER-XMM data is informative, its large measurement uncertainties prevent it from significantly influencing our NMMA analysis.
We also investigated its impact on the maximum allowed NS mass, , and its influence on the probability for GW190814 to be a NS-black hole merger. The upper limit on the maximum mass is mainly influenced by electromagnetic observations of GW170817 (Margalit & Metzger, 2017; Rezzolla et al., 2018) and therefore, the NICER data does not result in an observable impact. When not enforcing this upper bound on , the probability for GW190814 to be a NS-black hole merger changes from 19% to and ( and ) with the inclusion of NICER (NICER+XMM) data from Riley et al. (2021b) and Miller et al. (2021b), respectively. Based on these estimations, it remains most plausible that GW190814 originated from a binary black-hole merger.
Finally, we studied the possibility for a first-order phase transition to be present inside NSs. Following the interpretation of Bayes factors suggested in Jeffreys (1961), the presence of phase transition inside NSs is disfavoured, yet it is not ruled-out. However, this result is mainly impacted by previous multi-messenger observations of NSs and the impact of the new NICER measurement is small.
Observation of NSs have the potential to help us answer key questions in nuclear physics but current uncertainties of individual data remain large. This highlights the importance of flexible multi-messenger frameworks that can use input from nuclear theory modeling of the EOS, laboratory experiments, and complementary observations of NSs to probe different aspects and to paint a complete picture of the EOS.
Acknowledgement
We thank LIGO’s extreme matter group for valuable comments and discussions. We are also grateful to the NICER collaboration for releasing their posterior samples and collected data. P.T.H.P and C.V.D.B are supported by the research program of the Netherlands Organization for Scientific Research (NWO). The work of I.T. was supported by the U.S. Department of Energy, Office of Science, Office of Nuclear Physics, under contract No. DE-AC52-06NA25396, by the Laboratory Directed Research and Development program of Los Alamos National Laboratory under project numbers 20190617PRD1 and 20190021DR, and by the U.S. Department of Energy, Office of Science, Office of Advanced Scientific Computing Research, Scientific Discovery through Advanced Computing (SciDAC) program. M.W.C. acknowledges support from the National Science Foundation with grant number PHY-2010970. M.B. acknowledges support from the Swedish Research Council (Reg. no. 2020-03330). Computations were performed on the national supercomputer Hawk at the High Performance Computing Center Stuttgart (HLRS) under the grant number 44189 and on SuperMUC-NG at Leibniz Supercomputing Centre Munich under project number pn29ba. Computational resources have also been provided by the Los Alamos National Laboratory Institutional Computing Program, which is supported by the U.S. Department of Energy National Nuclear Security Administration under Contract No. 89233218CNA000001, and by the National Energy Research Scientific Computing Center (NERSC), which is supported by the U.S. Department of Energy, Office of Science, under contract No. DE-AC02-05CH11231. This research has made use of data, software and/or web tools obtained from the Gravitational Wave Open Science Center (https://www.gw-openscience.org), a service of LIGO Laboratory, the LIGO Scientific Collaboration and the Virgo Collaboration. LIGO is funded by the U.S. National Science Foundation. Virgo is funded by the French Centre National de Recherche Scientifique (CNRS), the Italian Istituto Nazionale della Fisica Nucleare (INFN) and the Dutch Nikhef, with contributions by Polish and Hungarian institutes.
References
- Abbott et al. (2017a) Abbott, B. P., Abbott, R., Abbott, T. D., et al. 2017a, Phys. Rev. Lett., 119, 161101
- Abbott et al. (2017b) —. 2017b, ApJ, 848, L12
- Abbott et al. (2018) —. 2018, Phys. Rev. Lett., 121, 161101
- Abbott et al. (2019a) —. 2019a, Physical Review X, 9, 031040
- Abbott et al. (2019b) —. 2019b, Physical Review X, 9, 011001
- Abbott et al. (2020a) —. 2020a, ApJ, 892, L3
- Abbott et al. (2020b) Abbott, R., Abbott, T. D., Abraham, S., et al. 2020b, ApJ, 896, L44
- Abbott et al. (2021) —. 2021, Physical Review X, 11, 021053
- Adhikari et al. (2021) Adhikari, D., Albataineh, H., Androic, D., et al. 2021, Phys. Rev. Lett., 126, 172502
- Alford et al. (2007) Alford, M., Blaschke, D., Drago, A., et al. 2007, Nature, 445, E7
- Alford & Reddy (2003) Alford, M., & Reddy, S. 2003, Phys. Rev. D, 67, 074024
- Annala et al. (2021) Annala, E., Gorda, T., Katerini, E., et al. 2021, arXiv:2105.05132
- Annala et al. (2020) Annala, E., Gorda, T., Kurkela, A., Nättilä, J., & Vuorinen, A. 2020, Nature Phys., 16, 907
- Annala et al. (2018) Annala, E., Gorda, T., Kurkela, A., & Vuorinen, A. 2018, Phys. Rev. Lett., 120, 172703
- Antoniadis et al. (2013) Antoniadis, J., Freire, P. C., Wex, N., et al. 2013, Science, 340, 6131
- Arcavi et al. (2017) Arcavi, I., Hosseinzadeh, G., Howell, D. A., et al. 2017, Nature, 551, 64
- Arzoumanian et al. (2018) Arzoumanian, Z., Brazier, A., Burke-Spolaor, S., et al. 2018, The Astrophysical Journal Supplement Series, 235, 37
- Bauswein et al. (2017) Bauswein, A., Just, O., Janka, H.-T., & Stergioulas, N. 2017, Astrophys. J., 850, L34
- Biswas (2021) Biswas, B. 2021, arXiv:2105.02886
- Biswas et al. (2021) Biswas, B., Nandi, R., Char, P., Bose, S., & Stergioulas, N. 2021, Mon. Not. Roy. Astron. Soc., 505, 1600
- Bulla (2019) Bulla, M. 2019, Mon. Not. Roy. Astron. Soc., 489, 5037
- Capano et al. (2019) Capano, C. D., Tews, I., Brown, S. M., et al. 2019, Nature Astronomy, arXiv:1908.10352
- Carlson et al. (2015) Carlson, J., Gandolfi, S., Pederiva, F., et al. 2015, Rev. Mod. Phys., 87, 1067
- Coughlin et al. (2019) Coughlin, M. W., Dietrich, T., Margalit, B., & Metzger, B. D. 2019, Monthly Notices of the Royal Astronomical Society: Letters, 489, L91
- Coulter et al. (2017) Coulter, D. A., Foley, R. J., Kilpatrick, C. D., et al. 2017, Science, 358, 1556
- Cromartie et al. (2020) Cromartie, H. T., Fonseca, E., Ransom, S. M., et al. 2020, Nature Astronomy, 4, 72
- Demorest et al. (2010) Demorest, P., Pennucci, T., Ransom, S., Roberts, M., & Hessels, J. 2010, Nature, 467, 1081
- Dietrich et al. (2020) Dietrich, T., Coughlin, M. W., Pang, P. T. H., et al. 2020, Science, 370, 1450
- Dietrich et al. (2019) Dietrich, T., Samajdar, A., Khan, S., et al. 2019, Phys. Rev., D100, 044003
- Drischler et al. (2020) Drischler, C., Melendez, J. A., Furnstahl, R. J., & Phillips, D. R. 2020, Phys. Rev. C, 102, 054315
- Epelbaum et al. (2009) Epelbaum, E., Hammer, H.-W., & Meissner, U.-G. 2009, Rev. Mod. Phys., 81, 1773
- Epelbaum et al. (2015) Epelbaum, E., Krebs, H., & Meißner, U.-G. 2015, Eur. Phys. J. A, 51, 53
- Essick & Landry (2020) Essick, R., & Landry, P. 2020, Astrophys. J., 904, 80
- Essick et al. (2020a) Essick, R., Landry, P., & Holz, D. E. 2020a, Phys. Rev. D, 101, 063007
- Essick et al. (2020b) Essick, R., Tews, I., Landry, P., Reddy, S., & Holz, D. E. 2020b, Phys. Rev. C, 102, 055803
- Essick et al. (2021) Essick, R., Tews, I., Landry, P., & Schwenk, A. 2021, arXiv:2102.10074
- Fonseca et al. (2021) Fonseca, E., Cromartie, H. T., Pennucci, T. T., et al. 2021, The Astrophysical Journal Letters, 915, L12
- Gezerlis et al. (2014) Gezerlis, A., Tews, I., Epelbaum, E., et al. 2014, Phys. Rev. C, 90, 054323
- Gezerlis et al. (2013) —. 2013, Phys. Rev. Lett., 111, 032501
- Glendenning (1992) Glendenning, N. K. 1992, Phys. Rev. D, 46, 1274
- Greif et al. (2019) Greif, S., Raaijmakers, G., Hebeler, K., Schwenk, A., & Watts, A. 2019, Mon. Not. Roy. Astron. Soc., 485, 5363
- Heinzel et al. (2021) Heinzel, J., Coughlin, M. W., Dietrich, T., et al. 2021, Mon. Not. Roy. Astron. Soc., 502, 3057
- Hinderer et al. (2019) Hinderer, T., Nissanke, S., Foucart, F., et al. 2019, Phys. Rev. D, 100, 063021
- Huth et al. (2021) Huth, S., Wellenhofer, C., & Schwenk, A. 2021, Phys. Rev. C, 103, 025803
- Jeffreys (1961) Jeffreys, H. 1961, Theory of Probability, 3rd edn. (Oxford, England: Oxford)
- Kalogera & Baym (1996) Kalogera, V., & Baym, G. 1996, Astrophys. J. Lett., 470, L61
- Kasen et al. (2017) Kasen, D., Metzger, B., Barnes, J., Quataert, E., & Ramirez-Ruiz, E. 2017, Nature, 551, 80
- Kawaguchi et al. (2020) Kawaguchi, K., Shibata, M., & Tanaka, M. 2020, The Astrophysical Journal, 889, 171
- Lattimer (2012) Lattimer, J. M. 2012, Ann. Rev. Nucl. Part. Sci., 62, 485
- Li et al. (2021) Li, B.-A., Cai, B.-J., Xie, W.-J., & Zhang, N.-B. 2021, Universe, 7, 182
- Lipunov et al. (2017) Lipunov, V. M., Gorbovskoy, E., Kornilov, V. G., et al. 2017, The Astrophysical Journal, 850, L1
- Lonardoni et al. (2018) Lonardoni, D., Carlson, J., Gandolfi, S., et al. 2018, Phys. Rev. Lett., 120, 122502
- Lynn et al. (2016) Lynn, J. E., Tews, I., Carlson, J., et al. 2016, Phys. Rev. Lett., 116, 062501
- Lynn et al. (2019) Lynn, J. E., Tews, I., Gandolfi, S., & Lovato, A. 2019, Ann. Rev. Nucl. Part. Sci., 69, 279
- Machleidt & Entem (2011) Machleidt, R., & Entem, D. R. 2011, Phys. Rept., 503, 1
- Margalit & Metzger (2017) Margalit, B., & Metzger, B. D. 2017, Astrophys. J., 850, L19
- Metzger (2017) Metzger, B. D. 2017, arXiv:1710.05931
- Miller et al. (2021a) Miller, M., Lamb, F. K., Dittmann, A. J., et al. 2021a, NICER PSR J0740+6620 Illinois-Maryland MCMC Samples, Zenodo, doi:10.5281/zenodo.4670689
- Miller et al. (2019a) Miller, M. C., Chirenti, C., & Lamb, F. K. 2019a, The Astrophysical Journal, 888, 12
- Miller et al. (2019b) Miller, M. C., Lamb, F. K., Dittmann, A. J., et al. 2019b, The Astrophysical Journal, 887, L24
- Miller et al. (2021b) —. 2021b, The Astrophysical Journal Letters, 918, L28
- Most et al. (2018) Most, E. R., Weih, L. R., Rezzolla, L., & Schaffner-Bielich, J. 2018, Phys. Rev. Lett., 120, 261103
- NICER (2021) NICER. 2021
- Ozel & Freire (2016) Ozel, F., & Freire, P. 2016, Ann. Rev. Astron. Astrophys., 54, 401
- Piarulli et al. (2018) Piarulli, M., Baroni, A., Girlanda, L., et al. 2018, Phys. Rev. Lett., 120, 052503
- Raaijmakers et al. (2020) Raaijmakers, G., Greif, S. K., Riley, T. E., et al. 2020, The Astrophysical Journal, 893, L21
- Raaijmakers et al. (2021) Raaijmakers, G., Greif, S. K., Hebeler, K., et al. 2021, arXiv:2105.06981
- Radice et al. (2017) Radice, D., Bernuzzi, S., Del Pozzo, W., Roberts, L. F., & Ott, C. D. 2017, Astrophys. J., 842, L10
- Radice & Dai (2019) Radice, D., & Dai, L. 2019, Eur. Phys. J., A55, 50
- Radice et al. (2018) Radice, D., Perego, A., Zappa, F., & Bernuzzi, S. 2018, Astrophys. J., 852, L29
- Rezzolla et al. (2018) Rezzolla, L., Most, E. R., & Weih, L. R. 2018, Astrophys. J., 852, L25
- Riley et al. (2019) Riley, T. E., Watts, A. L., Bogdanov, S., et al. 2019, The Astrophysical Journal, 887, L21
- Riley et al. (2021a) Riley, T. E., Watts, A. L., Ray, P. S., et al. 2021a, A NICER View of the Massive Pulsar PSR J0740+6620 Informed by Radio Timing and XMM-Newton Spectroscopy: Nested Samples for Millisecond Pulsar Parameter Estimation, v.v1.0.0, Zenodo, doi:10.5281/zenodo.4697625
- Riley et al. (2021b) —. 2021b, The Astrophysical Journal Letters, 918, L27
- Ruiz et al. (2018) Ruiz, M., Shapiro, S. L., & Tsokaros, A. 2018, Phys. Rev., D97, 021501
- Soares-Santos et al. (2017) Soares-Santos, M., Holz, D. E., Annis, J., et al. 2017, The Astrophysical Journal, 848, L16
- Somasundaram & Margueron (2021) Somasundaram, R., & Margueron, J. 2021, arXiv:2104.13612
- Strüder et al. (2001) Strüder, L., Briel, U., Dennerl, K., et al. 2001, A&A, 365, L18
- Tanvir et al. (2017) Tanvir, N. R., Levan, A. J., González-Fernández, C., et al. 2017, Astrophys. J., 848, L27
- Tews et al. (2018a) Tews, I., Carlson, J., Gandolfi, S., & Reddy, S. 2018a, Astrophys. J., 860, 149
- Tews et al. (2016) Tews, I., Gandolfi, S., Gezerlis, A., & Schwenk, A. 2016, Phys. Rev. C, 93, 024305
- Tews et al. (2018b) Tews, I., Margueron, J., & Reddy, S. 2018b, Phys. Rev., C98, 045804
- Tews et al. (2021) Tews, I., Pang, P. T. H., Dietrich, T., et al. 2021, Astrophys. J. Lett., 908, L1
- Turner et al. (2001) Turner, M. J. L., Abbey, A., Arnaud, M., et al. 2001, A&A, 365, L27
- Valenti et al. (2017) Valenti, S., Sand, D. J., Yang, S., et al. 2017, Astrophys. J., 848, L24
- Wolff et al. (2021) Wolff, M. T., Guillot, S., Bogdanov, S., et al. 2021, Astrophys. J. Lett., 918, L26
Appendix A Impact of EOS prior
| Quantity | NMMA | NMMA | NMMA | NMMA + Combined |
| + Miller et al. 2021 | + Riley et al. 2021 | Miller & Riley et al. 2021 | ||
In Table 2, we present the summary of the resulting posteriors for the quantities of interest using an EOS prior that is not uniform in , i.e., a prior that is “natural" to our speed-of-sound extension scheme. The posteriors on and are consistent with the results shown in Tab. 1 within the uncertainties.
In contrast, the Bayes factors are prior-sensitive, and their values shift significantly from the results in Tab. 1. Because the non-uniform prior set does not explore as many EOS with phase transitions as the uniform prior set, the shifts of the Bayes factors changes. However, the presence of a phase transition inside a NS is still disfavoured in all cases, but cannot be ruled-out.