Strong suppression of heat conduction in a laboratory replica of galaxy-cluster turbulent plasmas
Abstract
Galaxy clusters are filled with hot, diffuse X-ray emitting plasma, with a stochastically tangled magnetic field whose energy is close to equipartition with the energy of the turbulent motions zweibel1997 ; Vacca . In the cluster cores, the temperatures remain anomalously high compared to what might be expected considering that the radiative cooling time is short relative to the Hubble time cowie1977 ; fabian1994 . While feedback from the central active galactic nuclei (AGN) fabian2012 ; birzan2012 ; churazov2000 is believed to provide most of the heating, there has been a long debate as to whether conduction of heat from the bulk to the core can help the core to reach the observed temperatures narayan2001 ; ruszkowski2002 ; kunz2011 , given the presence of tangled magnetic fields. Interestingly, evidence of very sharp temperature gradients in structures like cold fronts implies a high degree of suppression of thermal conduction markevitch2007 . To address the problem of thermal conduction in a magnetized and turbulent plasma, we have created a replica of such a system in a laser laboratory experiment. Our data shows a reduction of local heat transport by two orders of magnitude or more, leading to strong temperature variations on small spatial scales, as is seen in cluster plasmas markevitch2003 .
There are a number of possible mechanisms that can lead to a reduction from the classical (local) Spitzer conductivity: electrons getting stuck in local magnetic mirrors komarov2016 , alignment of local temperature gradients perpendicular to magnetic fields komarov14 and plasma instabilities such as whistler waves komarov2018 ; roberg2018 . For these processes to occur, the electron’s Larmor radius must be small compared to its Coulomb mean free path, enabling microscale changes in the electron heat transport to alter the global properties of the plasma dynamics. Numerical simulations are unable to address these issues fully zuhone2012 ; smith2013 , as comprehensive modelling of all the physical processes present at different scales remains very challenging computationally. Laboratory experiments gregori2015 can provide an alternative approach if they can achieve sufficiently weakly-collisional conditions and sufficiently strong stochastic magnetic fields for the heat transport to be significantly modified.
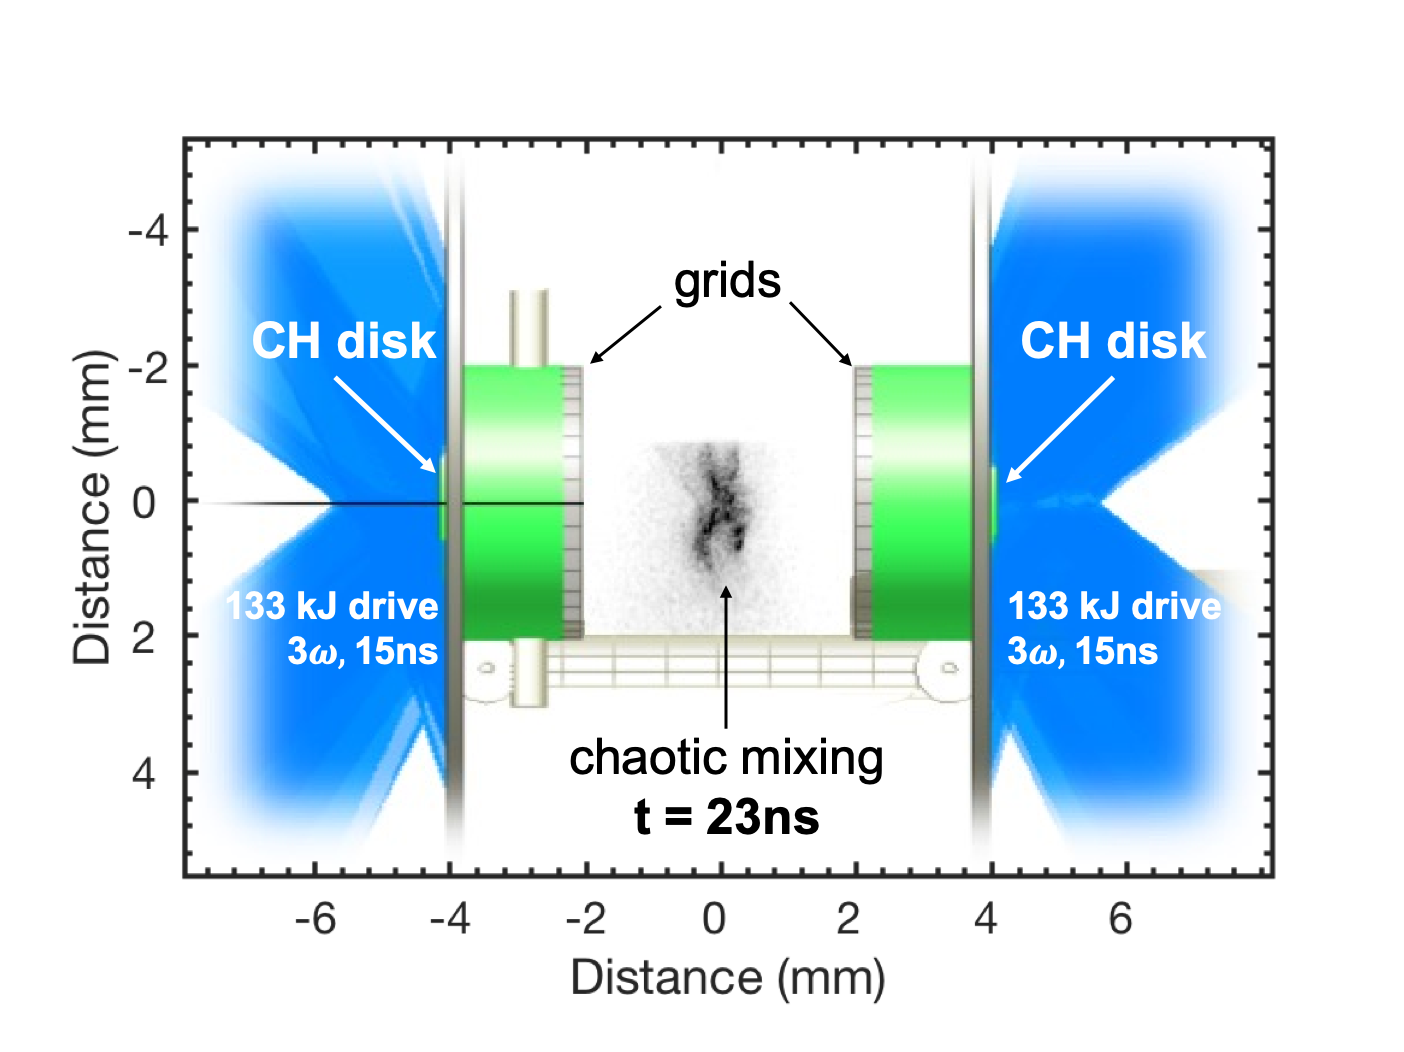
Here we report such an experiment using the National Ignition Facility (NIF) laser at the Lawrence Livermore National Laboratory – see Figure 1 for details of the experimental setup. The platform is similar to that already employed at other laser facilities (e.g., the Omega laser tzeferacos2018 ; bott2021time ) but with 30 times more energy delivered to the target. A highly turbulent plasma was created by ablating two doped plastic foils, each with 133 kJ of 351 nm light in 15 ns (see Figure 1). The foils were separated by 8 mm and ablated on the back side to create colliding plasma flows at the centre (4 mm from each target). To help excite turbulence, plastic mesh grids with 300 apertures and 300 wires were placed 2 mm from each foil to disturb the two flows before they collided. Three-dimensional simulations carried out with the FLASH code (validated on previous experiments at smaller laser facilities tzeferacos2017 ; bott2021time ) were used to help design the platform and analyze the experimental data.
Several complementary plasma diagnostics were deployed (see Methods). With optical Thomson scattering, we measured an average electron density cm-3 in the collision region at ns after the start of the drive beams. The turbulent velocity in the plasma was determined via stimulated Brillouin scattering. By recording the wavelength shift of the back-scattered light from a probe beam, we infer km/s. The self-generated magnetic fields were estimated from proton deflectometry to be MG (here is the one component of the magnetic field that we measure), where we took the proton path-length from self-emission X-ray images tzeferacos2018 ; bott2021time , and the magnetic field correlation length, , corresponds to a wavelength m of the same order as the grid periodicity. Using the same diagnostic, we found the maximum field to be MG.
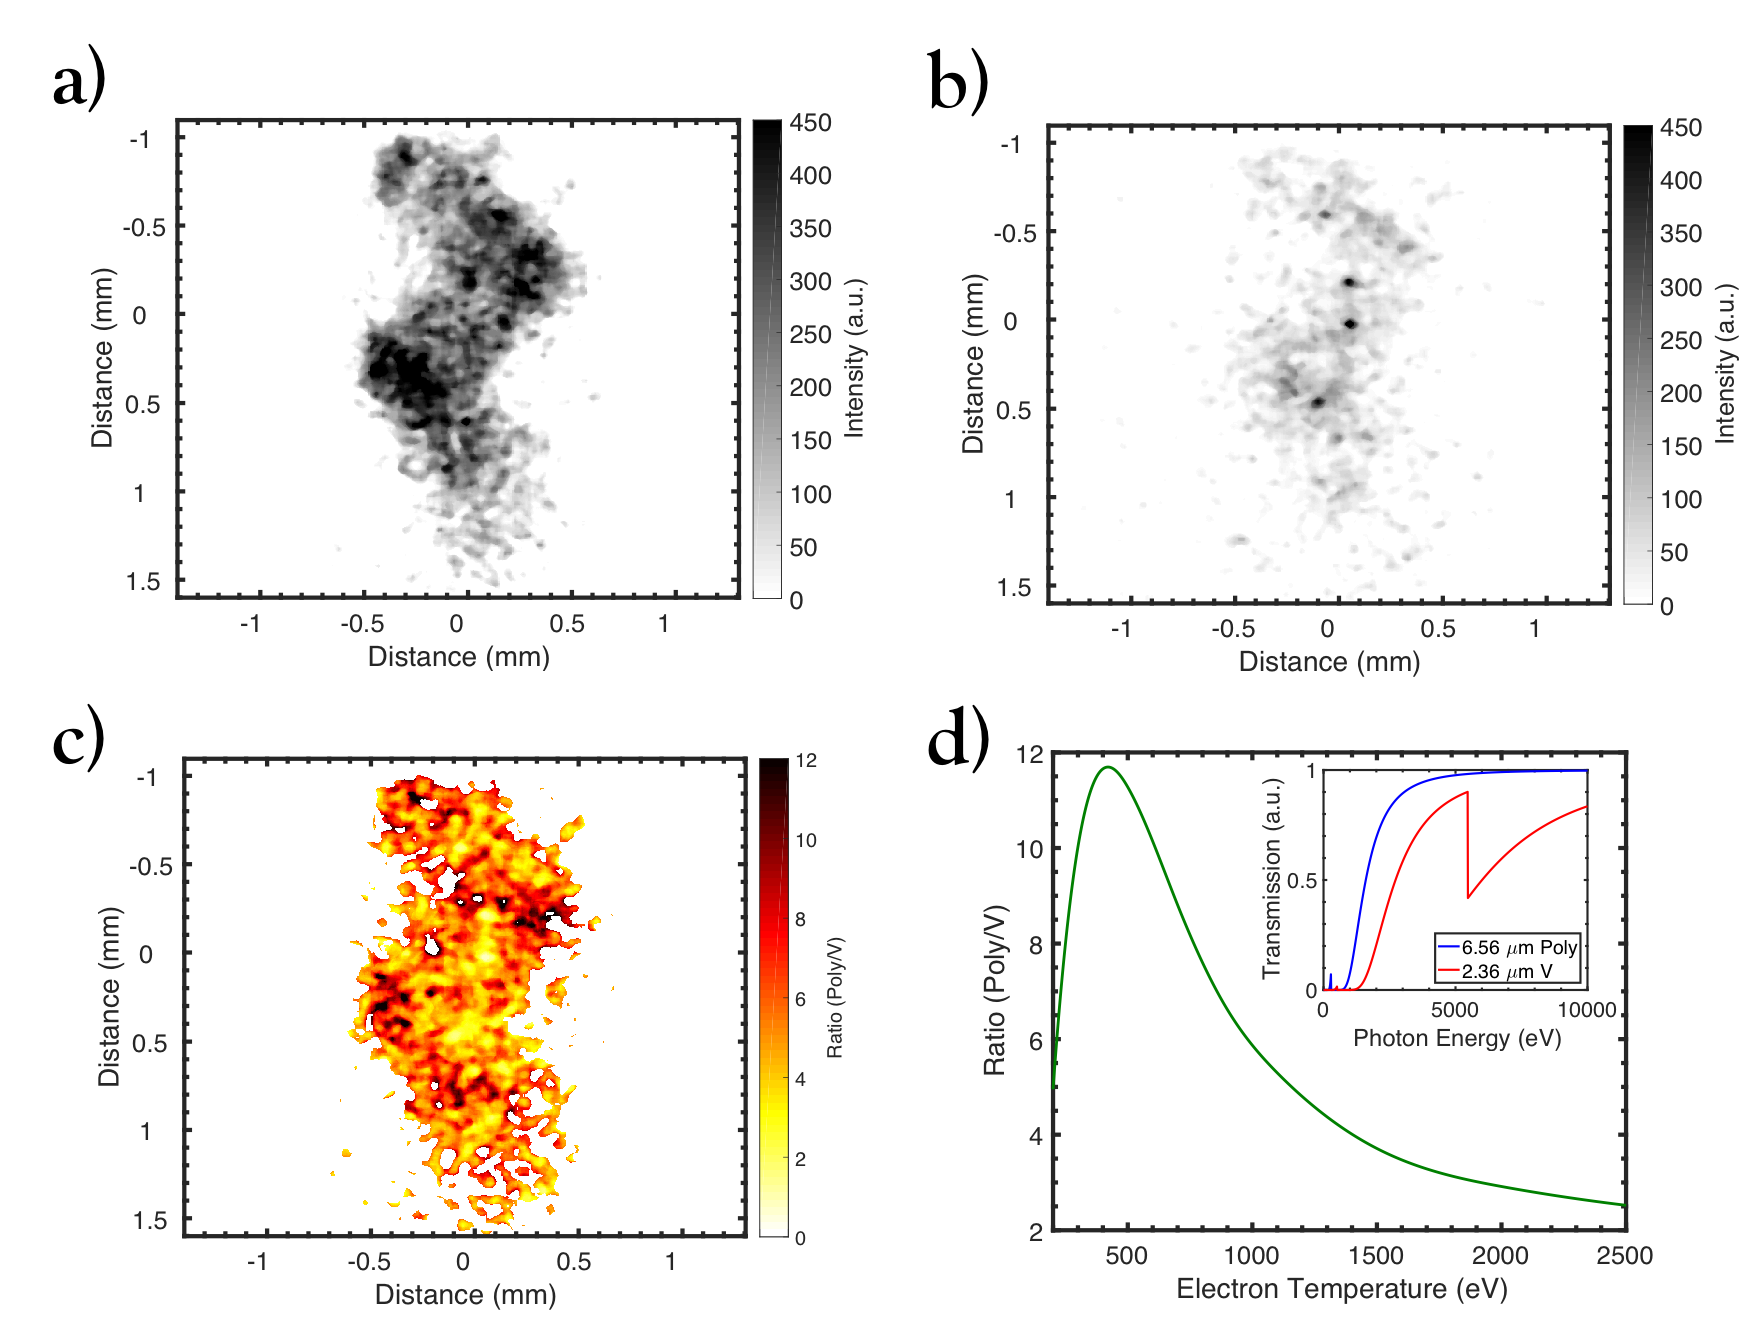
By comparing soft X-ray emission images in two wavelength bands determined by filtering the broadband emission with either 6.56 m polyimide or 2.36 m vanadium (see Figure 2), two-dimensional maps of , a measure of the electron temperature averaged along the line of sight, were obtained with 50 m spatial resolution and 100 ps temporal resolution (see Supplementary Information for details and validation with synthetic FLASH data). This temperature diagnostic closely resembles what has recently been used for galaxy-cluster X-ray analysis churazov2016 .
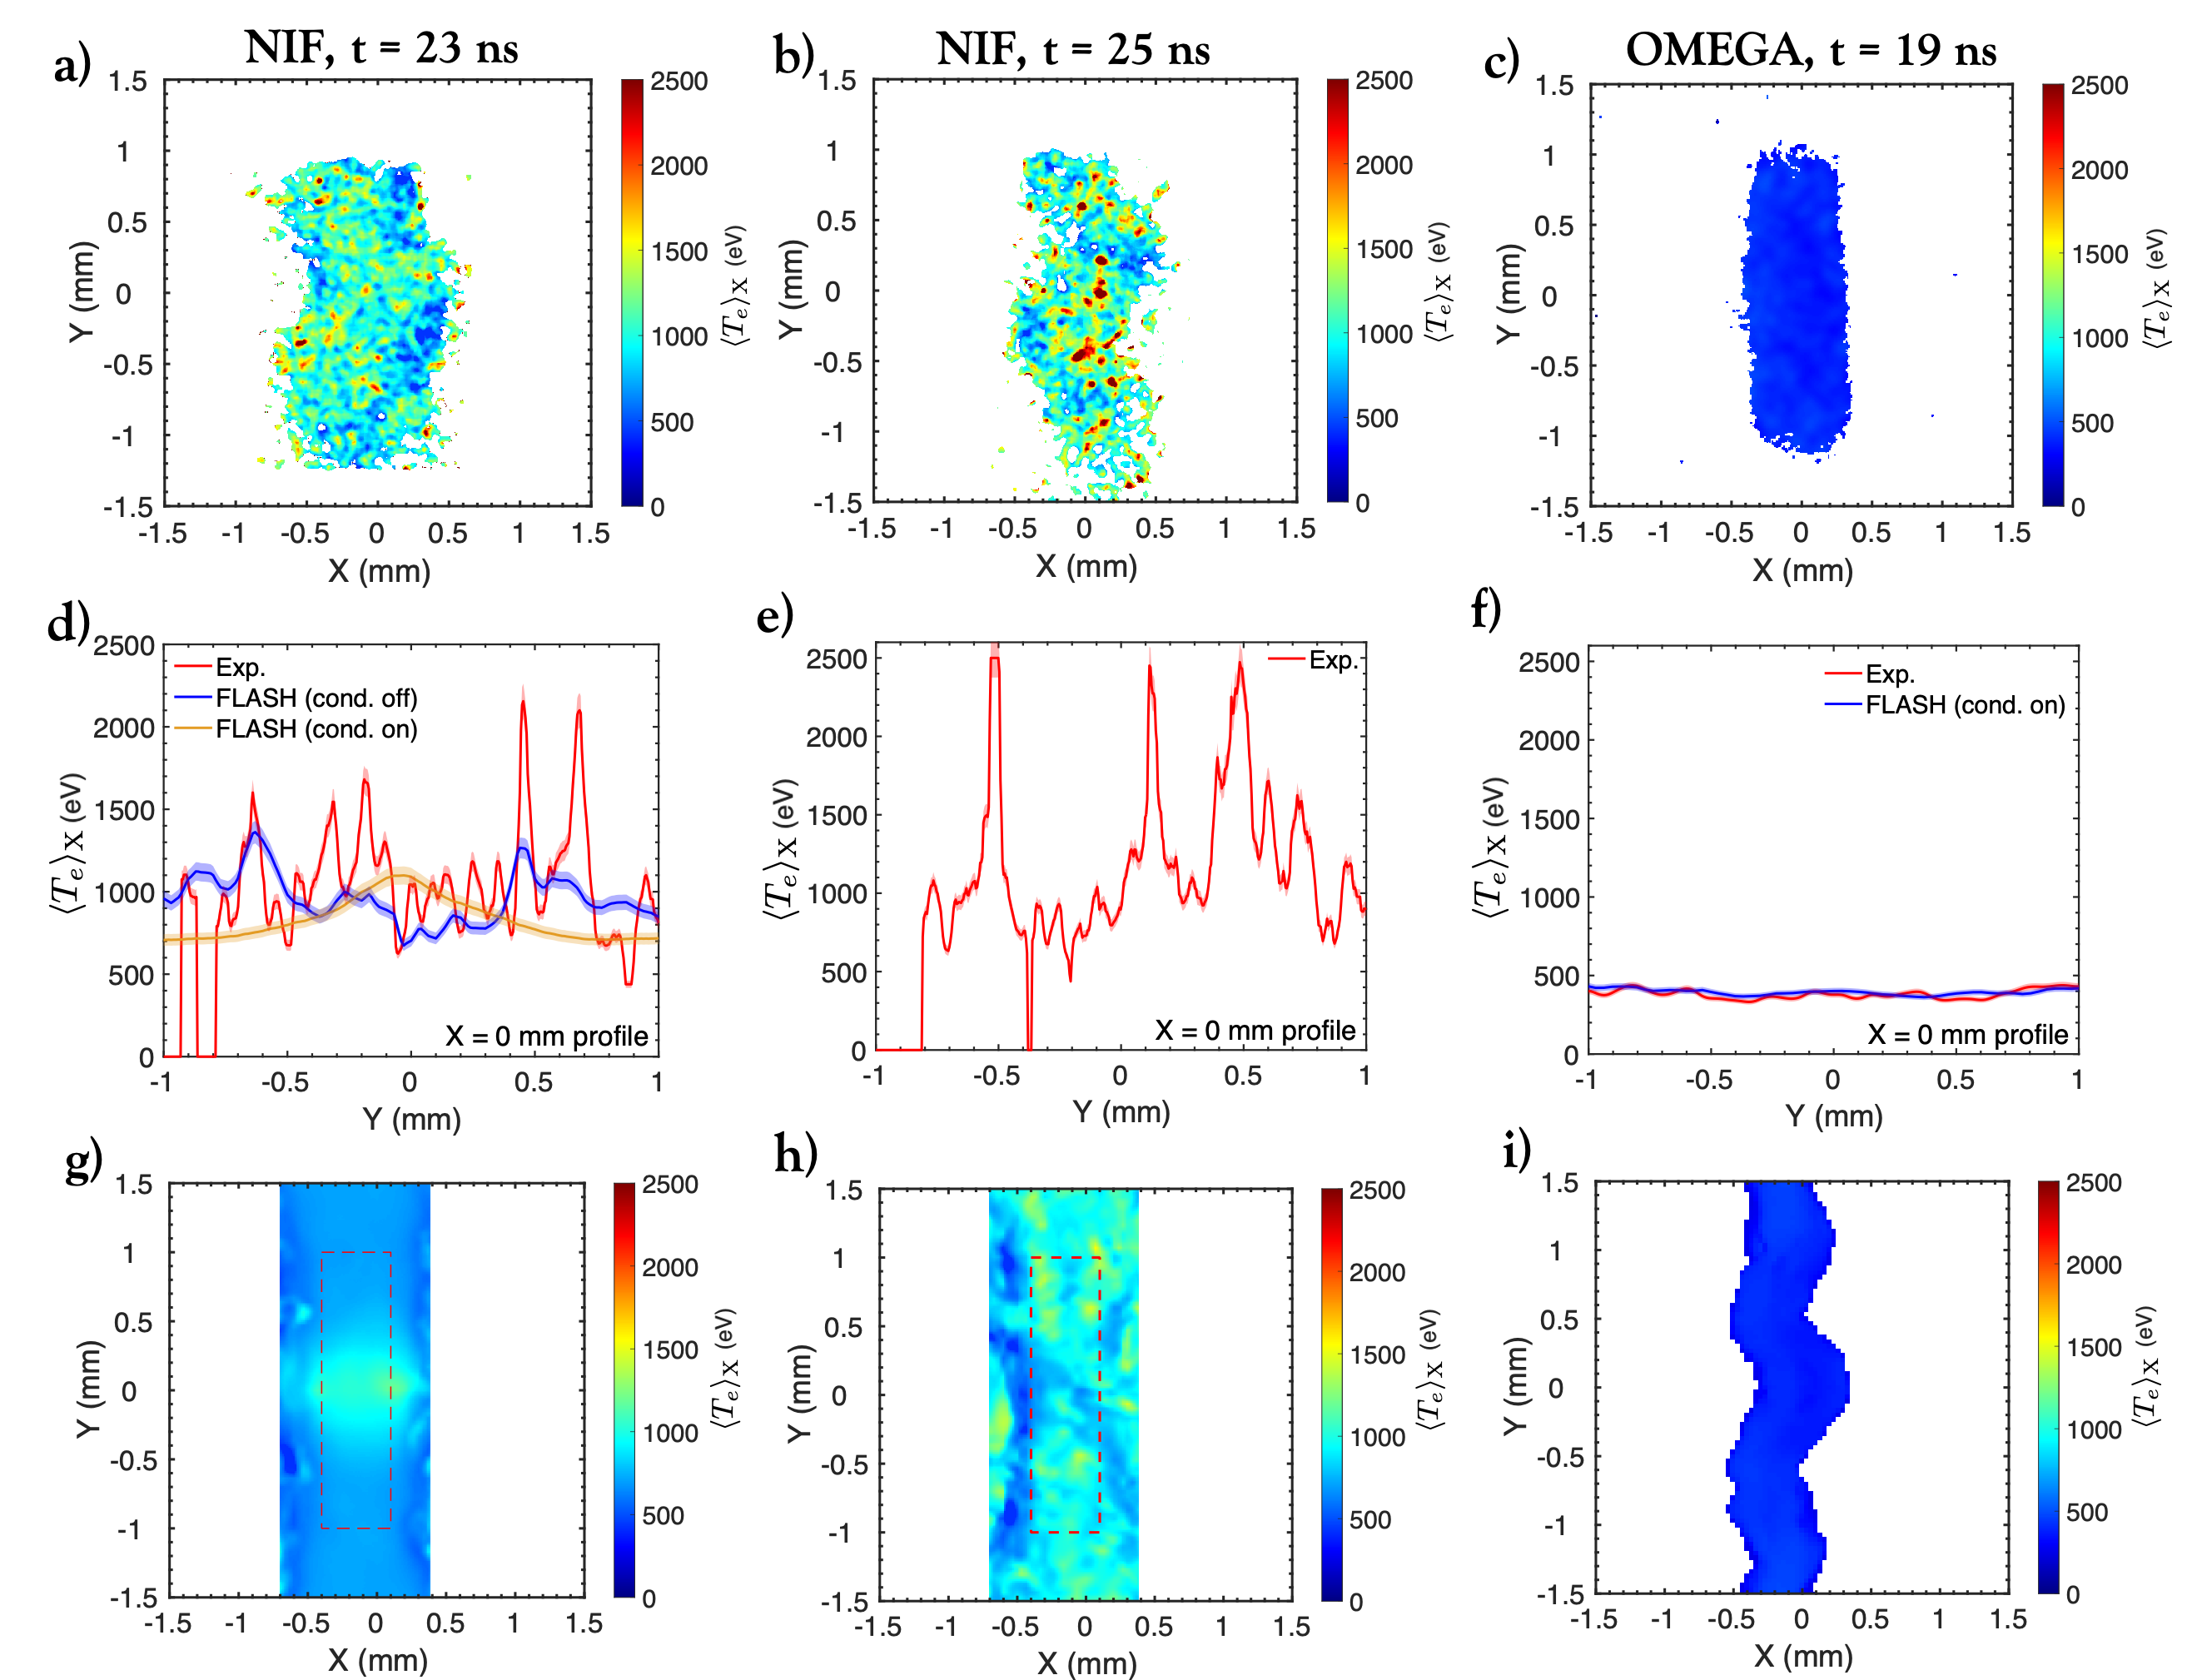
At ns after the start of the drive beams, we measured an average temperature measure keV over a 2 mm 1 mm region: see Figure 3. The profile of the map is highly structured, with the magnitude of local perturbations in exceeding keV by ns. The spikiness of the profile is less pronounced at earlier times, and very different from the temperature maps that we obtained in previous experiments at less energetic laser facilities tzeferacos2018 , which showed a nearly uniform temperature distribution.
Taking the measured RMS magnetic field, we find that the electrons in the interaction region are strongly magnetized (see Supplementary Information), viz., , where is their gyroradius and m their mean free path. Note , where m is the thermal gradient length scale (limited by the spatial resolution of the diagnostics), implies that ordinary (Spitzer) conductivity is somewhat modified by non-local effects bell1981 . Non-local thermal conduction has been previously seen in laboratory experiments gregori2004 and results in a smoothing of the heat front – increasing its width by a factor for komarov2018 . However, in the presence of magnetic fields, electron conduction perpendicular to the field lines is further reduced by up to a factor . The parallel heat conduction is also quenched by a factor of due to the development of the whistler instability komarov2018 .
Evidence of significant reduction of heat conduction in our NIF experiment is illustrated by the temperature maps in Figure 3. The image shows localized hot patches with scale length m. For normal conduction, we should expect the time for the temperature gradients associated with the hot spots to disappear to be s, where is the Spitzer thermal conductivity. Instead, as we do see temperature structures, they must have existed for a dynamical time s, where mm is the spatial extent of the interaction region and is the sound speed. This implies a reduction in the effective conductivity () by a factor – between –25 ns.
The notion that the reduction in heat conduction is due to electrons being magnetised can be further strengthened if we compare NIF results with a turbulent plasma where , which was achieved in our previous experiments at the Omega laser facility, shown in Figure 3c tzeferacos2018 . While the turbulence itself exhibits a similar structure, the temperature map in this case is significantly more homogeneous, with , and the same considerations as above lead to , as expected for normal conduction.
Our analysis is supported by numerical simulations of the Omega and NIF experiments performed with the FLASH code. For both experiments, we generated X-ray images from the simulation outputs and synthetic temperature maps (Figures 3g,h,i - see Supplementary Information for details). For Omega, the code, run with Spitzer’s conductivity, accurately reproduces the experimental maps. For NIF, we compared simulation results for the cases when Spitzer thermal conduction was turned off to those with it included. We find that a highly structured profile is only obtained in the conduction-off simulations.
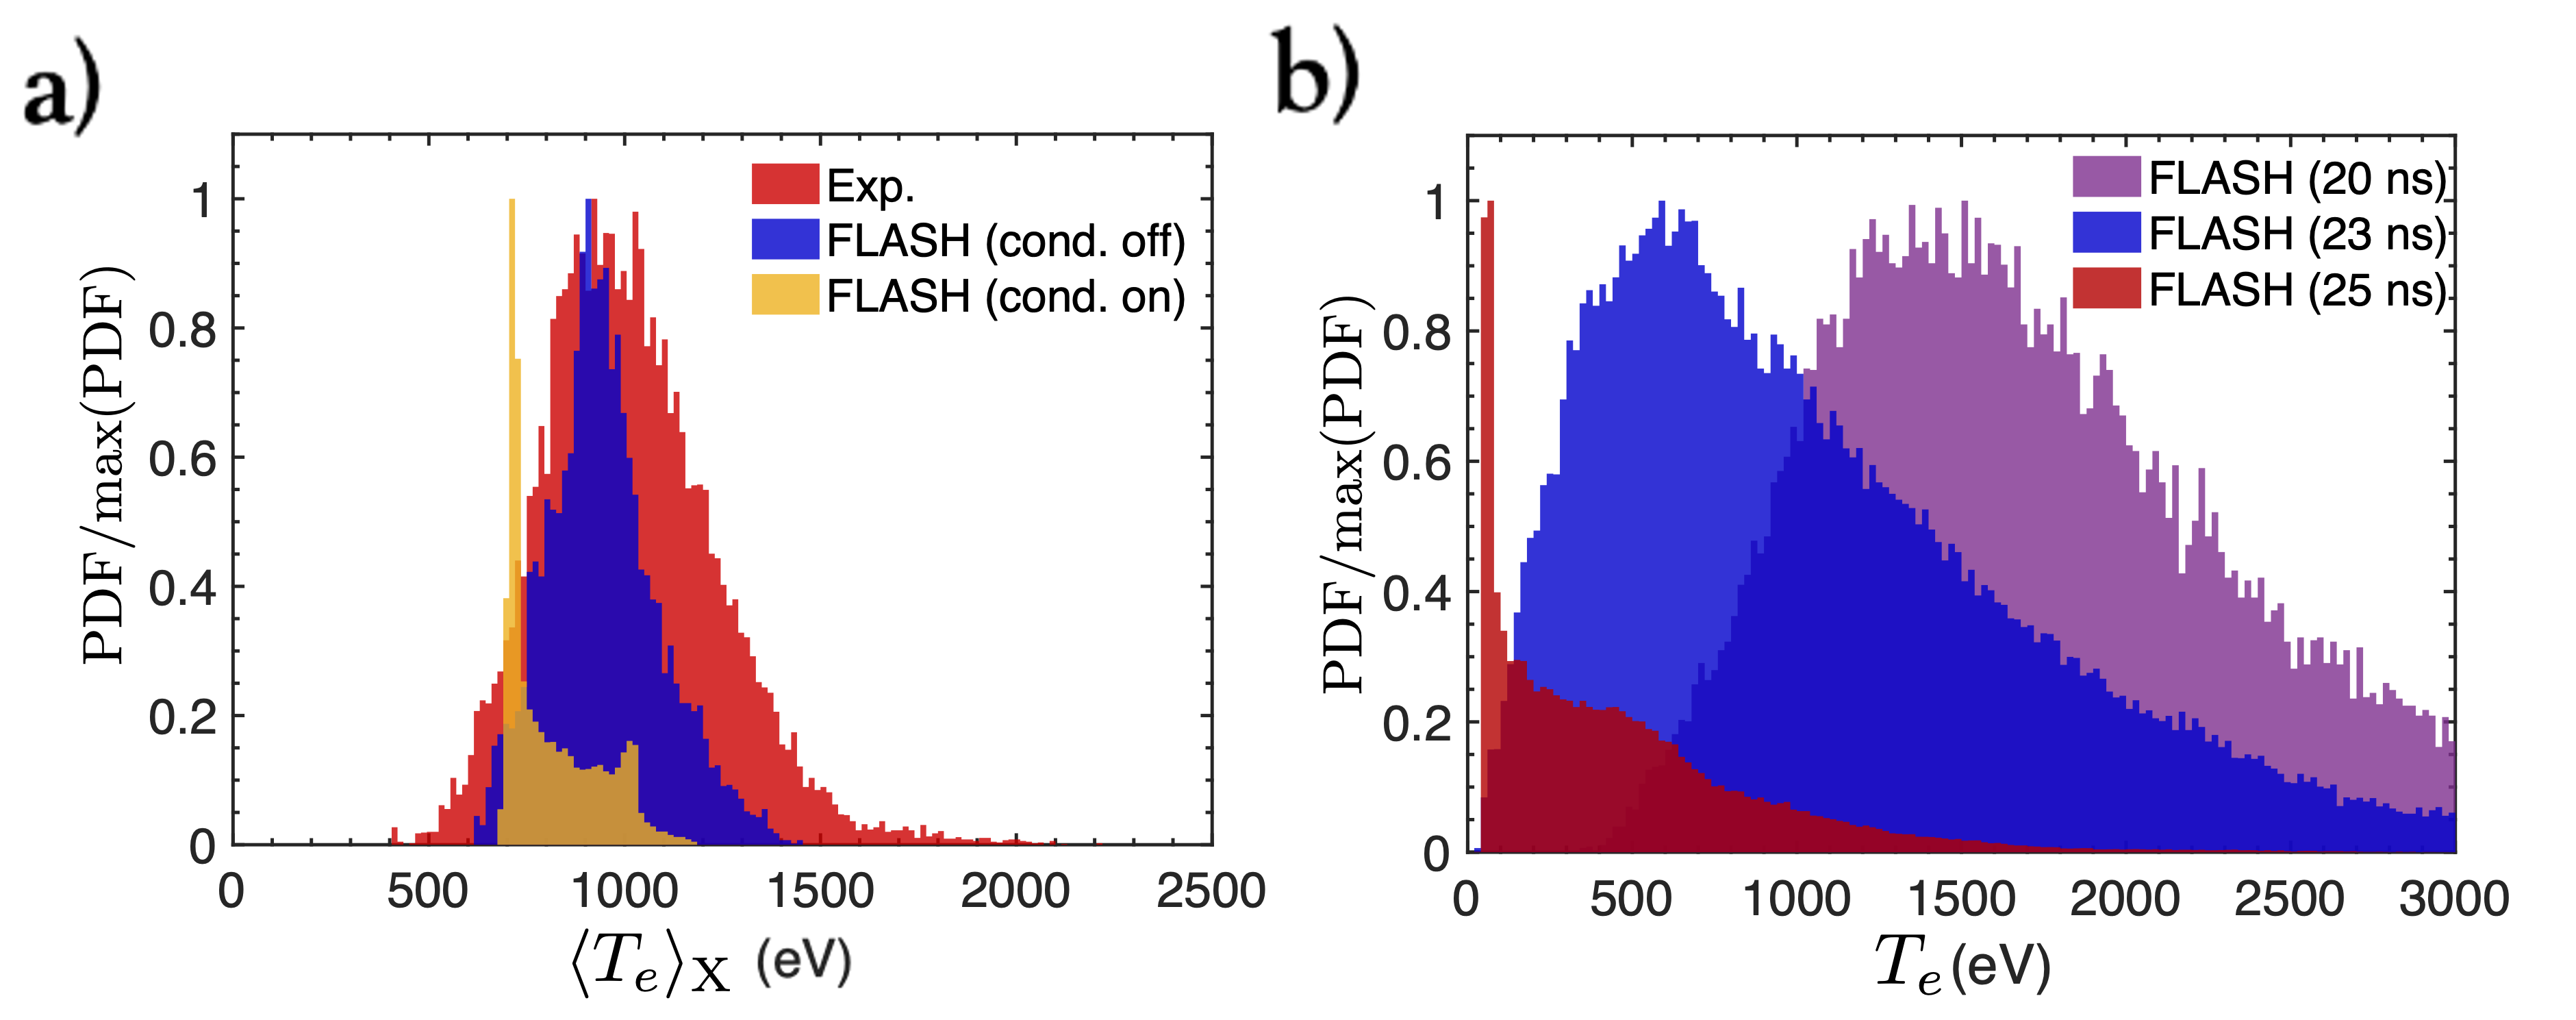
More quantitatively, the distribution of fluctuations in the interaction region agrees between the experimental data and synthetic predictions from the FLASH conduction-off simulations (Figure 4a). Even though FLASH simulations lack the kinetic physics likely responsible for the suppression of conductivity in the experiment, this agreement is unsurprising for the following reason. In the experiment, because thermal conductivity is suppressed, mixing of temperature perturbations by turbulent motions predominates over thermal diffusion for the smallest temperature fluctuations that are resolved by our diagnostic. The conduction-off simulations have a similar resolution (25 m) and a very small artificial viscosity (see Supplementary Information), so they capture the turbulent motions and the resulting temperature fluctuations on the same scales as the experimental diagnostic.
Further analysis of the simulations suggests a plausible candidate for the mechanism that gives rise to the temperature inhomogeneities (that are then mixed by turbulent motions): a radiative-cooling instability that acts on the initial temperature perturbations in the interaction region arising from asymmetries in the jets’ collision. The instability is a result of line cooling due to the dopants in the plasma, which causes the cooling function for the plasma to be a strongly decreasing function of the temperature for much of the relevant range of temperatures (see Supplementary Information). As a result, regions in the simulated plasma where eV and eV eV experience significant radiative cooling on a timescale that is comparable with the eddy-turnover time of the turbulence (see Figure 4b). Also, approximate pressure balance across the whole interaction region (see Supplementary Information) implies that the regions that experience significant radiative cooling must undergo compression, while those that do not must expand (TS1974, ; H81, ), enhancing the impact of the cooling instability across the whole plasma. The instability cannot operate in the conduction-on simulations because the initial temperature fluctuations in the plasma are rapidly suppressed by efficient heat transport.
Our results provide the first direct experimental evidence of suppression of heat conduction in a turbulent magnetized plasma for conditions that resemble those of galaxy clusters, and more generally in high- turbulent plasma with weakly collisional and magnetised electrons. They suggest that the effective electron conductivity is about two orders of magnitude below that predicted by Spitzer’s theory, and so, e.g., in cluster cores, conduction is unlikely to be able to lower the AGN feedback requirements, which requires a conductivity larger than narayan2001 ; ruszkowski2002 . Since both the experiment and the cluster plasma are in the regime where the electron Larmor radius is smaller than the mean free path, such strong modification in the heat transport points to plasma micro-instabilities as the main culprit for the reduction of classical Spitzer’s conductivity komarov2018 ; roberg2018 . Precisely how to calculate the effective conductivity in such a plasma is currently unknown, either theoretically or numerically. Our NIF measurements thus provide an experimental benchmark for the development of future multi-scale models of heat transport in turbulent and magnetized plasmas.
Materials and Methods
Optical Thomson scattering (OTS) from collective electron plasma wave (EPW) oscillations was used to characterise the electron density in the interaction region of the two counter-propagating turbulent flows evans1969 . Four laser beams were focused at the interaction region with a spot radius of 600 , forming a cylindrical collection volume of diameter 50 and length of 1.2 mm (see Figure 1). From a scattering angle of , light was collected by a spectrometer, dispersed by a grating, and streaked onto a camera to measure the temporal evolution of the electron density. The peak position of the EPW is mainly determined by the plasma frequency (via the plasma dispersion relation) evans1969 . Since scattering occurs over a region which is much longer than the laser wavelength, in a turbulent plasma this implies that different electron densities are probed simultaneously, and so the observed broadening of the EPW is a measurement of that range of densities.
Similar to OTS is the stimulated Brillouin scattering (SBS) diagnostic, which measures the light scattered back in the laser direction in a narrow wavelength range near the laser frequency. The SBS instability results from the resonant coupling between the probe laser light, the scattered light and an ion-acoustic wave rose1994 . To drive this instability, we use four NIF beams delivering 0.5 TW in a 100 spot, probing different points in the interaction region. The back-scattered light (mostly occurring near the peak of the density profile) shows a frequency shift , where is associated with the coupling of the probe light with ion-acoustic waves, while is the Doppler contribution from the plasma flow moving in the direction of the laser beam. If the plasma temperature is known (from the temperature maps shown in the main text), then can be estimated, and the SBS diagnostic measures the component of the flow moving along the probe beam, which is nearly perpendicular to the axis connecting the two grids (see Figure 1). Since the velocities near the centre of the interaction region are chaotic (as confirmed by the FLASH simulations), the SBS measurement is indicative of the turbulent velocities achieved in the experiment.
The turbulence-amplified magnetic fields were inferred from the angular deflections of energetic protons as they traversed the interaction region. These were created by illuminating a D3He capsule with 60 additional laser beams delivering a total of 48 kJ in a 900 ps pulse. Fusion reactions in the imploding capsule generate nearly monoenergetic 15 MeV protons. Unlike previous experiments where protons of these energies only acquired small deflections, proton deflections in the present experiment are large, with the trajectory of each individual proton crossing over those of other protons before reaching the detector. This prevents the application of previous analysis techniques capable of reconstructing two-dimensional maps of the path-integrated magnetic field bott2017 .
In order to characterize the magnetic field, we instead measured the proton deflections by placing a slit in the path of the protons to limit the size of the beam as it entered the plasma. Qualitatively, the significant displacement of protons from their projected positions in the absence of any deflection is consistent with strong magnetic fields. More quantitatively, we measured the mean, the root mean square (RMS), and the maximum displacement of the proton flux distribution from the slit’s central position. This allows us to estimate the corresponding mean, RMS and maximum values of the component of the path-integrated magnetic field parallel to the slit’s orientation (). We also analyzed inhomogeneities in the proton flux distribution and found that their scale was consistent with the correlation length of the magnetic field being . Further details of this analysis are provided in the Supplementary Information.
Acknowledgements
The research leading to these results received funding from the EPSRC (grant numbers EP/M022331/1 and EP/N014472/1), the U.S. DOE under Contract No. B591485 to LLNL, Field Work Proposal No. 57789 to ANL and DE-SC0016566 to the University of Chicago, DE-NA0003868 to the Massachusetts Institute of Technology, DE-NA0001808, 89233118CNA000010, and 89233119CNA000063 to General Atomics, subcontracts no. 536203 and 630138 (LANL) and B632670 (LLNL) to the Flash Center for Computational Science, and Cooperative Agreement DE-NA0003856 to the Laboratory for Laser Energetics, University of Rochester. We acknowledge support from the NSF under grants PHY-1619573 and PHY-2033925. Awards of compute time were provided by the U.S. DOE ALCC program. We acknowledge funding from grants 2016R1A5A1013277 and 2020R1A2C2102800 of the NRF of Korea. The work of AAS was supported in part by the U.K. EPSRC Programme Grant EP/R034737/1. Support from AWE plc. and the STFC of the U.K. is also acknowledged.
References
- (1) Zweibel, E. G. & Heiles, C. Magnetic fields in galaxies and beyond. Nature 385, 131–136 (1997).
- (2) Vacca, V. et al. Magnetic Fields in Galaxy Clusters and in the Large-Scale Structure of the Universe. Galaxies 6, 142 (2018).
- (3) Cowie, L. L. & Binney, J. Radiative regulation of gas flow within clusters of galaxies - A model for cluster X-ray sources. The Astrophysical Journal 215, 723 (1977).
- (4) Fabian, A. C. Cooling Flows in Clusters of Galaxies. Annual Review of Astronomy and Astrophysics 32, 277–318 (1994).
- (5) Fabian, A. Observational Evidence of Active Galactic Nuclei Feedback. Annual Review of Astronomy and Astrophysics 50, 455–489 (2012).
- (6) Bîrzan, L. et al. The duty cycle of radio-mode feedback in complete samples of clusters. Monthly Notices of the Royal Astronomical Society 427, 3468–3488 (2012).
- (7) Churazov, E., Forman, W., Jones, C. & Bohringer, H. Asymmetric, arc minute scale structures around NGC 1275. Astronomy and Astrophysics 356, 788 (2000).
- (8) Narayan, R. & Medvedev, M. V. Thermal Conduction in Clusters of Galaxies. The Astrophysical Journal 562, L129–L132 (2001).
- (9) Ruszkowski, M. & Begelman, M. C. Heating, conduction and minimum temperatures in cooling flows. The Astrophysical Journal 581, 223–228 (2002).
- (10) Kunz, M. W., Schekochihin, A. A., Cowley, S. C., Binney, J. J. & Sanders, J. S. A thermally stable heating mechanism for the intracluster medium: turbulence, magnetic fields and plasma instabilities. Monthly Notices of the Royal Astronomical Society 410, 2446–2457 (2011).
- (11) Markevitch, M. & Vikhlinin, A. Shocks and cold fronts in galaxy clusters. Physics Reports 443, 1–53 (2007).
- (12) Markevitch, M. et al. Chandra Temperature Map of Abell 754 and Constraints on Thermal Conduction. The Astrophysical Journal 586, L19–L23 (2003).
- (13) Komarov, S. V., Churazov, E. M., Kunz, M. W. & Schekochihin, A. A. Thermal conduction in a mirror-unstable plasma. Monthly Notices of the Royal Astronomical Society 460, 467–477 (2016).
- (14) Komarov, S. V., Churazov, E. M., Schekochihin, A. A. & ZuHone, J. A. Suppression of local heat flux in a turbulent magnetized intracluster medium. Monthly Notices of the Royal Astronomical Society 440, 1153–1164 (2014).
- (15) Komarov, S., Schekochihin, A., Churazov, E. & Spitkovsky, A. Self-inhibiting thermal conduction in a high-, whistler-unstable plasma. Journal of Plasma Physics 84, 905840305 (2018).
- (16) Roberg-Clark, G. T., Drake, J. F., Reynolds, C. S. & Swisdak, M. Suppression of Electron Thermal Conduction by Whistler Turbulence in a Sustained Thermal Gradient. Physical Review Letters 120, 035101 (2018).
- (17) ZuHone, J. A., Markevitch, M., Ruszkowski, M. & Lee, D. Cold fronts and gas sloshing in galaxy clusters with anisotropic thermal conduction. The Astrophysical Journal 762, 69 (2012).
- (18) Smith, B., O’Shea, B. W., Voit, G. M., Ventimiglia, D. & Skillman, S. W. Cosmological simulations of isotropic conduction in galaxy clusters. The Astrophysical Journal 778, 152 (2013).
- (19) Gregori, G., Reville, B. & Miniati, F. The generation and amplification of intergalactic magnetic fields in analogue laboratory experiments with high power lasers. Physics Reports 601, 1–34 (2015).
- (20) Tzeferacos, P. et al. Laboratory evidence of dynamo amplification of magnetic fields in a turbulent plasma. Nature Communications 9, 591 (2018).
- (21) Bott, A. F. A. et al. Time-resolved turbulent dynamo in a laser plasma. Proceedings of the National Academy of Sciences 118, e2015729118 (2021).
- (22) Tzeferacos, P. et al. Numerical modeling of laser-driven experiments aiming to demonstrate magnetic field amplification via turbulent dynamo. Physics of Plasmas 24, 041404 (2017).
- (23) Churazov, E. et al. Arithmetic with X-ray images of galaxy clusters: effective equation of state for small-scale perturbations in the ICM. Monthly Notices of the Royal Astronomical Society 463, 1057–1067 (2016).
- (24) Bell, A. R., Evans, R. G. & Nicholas, D. J. Elecron Energy Transport in Steep Temperature Gradients in Laser-Produced Plasmas. Physical Review Letters 46, 243–246 (1981).
- (25) Gregori, G. et al. Effect of Nonlocal Transport on Heat-Wave Propagation. Physical Review Letters 92 (2004).
- (26) Tidman, D. A. & Shanny, R. A. Field‐generating thermal instability in laser‐heated plasmas. The Physics of Fluids 17, 1207 (1974).
- (27) Haines, M. G. Thermal instability and magnetic field generated by large heat flow in a plasma, especially under laser-fusion conditions. Phys. Rev. Lett. 47, 917 (1981).
- (28) Evans, D. E. & Katzenstein, J. Laser light scattering in laboratory plasmas. Reports on Progress in Physics 32, 207 (1969).
- (29) Rose, H. A. & DuBois, D. F. Laser hot spots and the breakdown of linear instability theory with application to stimulated Brillouin scattering. Physical Review Letters 72, 2883–2886 (1994).
- (30) Bott, A. et al. Proton imaging of stochastic magnetic fields. Journal of Plasma Physics 83, 905830614 (2017).