Topology Optimization for Large-Scale Additive Manufacturing: Generating designs tailored to the deposition nozzle size
Abstract
Additive Manufacturing (AM) processes intended for large scale components deposit large volumes of material to shorten process duration. This reduces the resolution of the AM process, which is typically defined by the size of the deposition nozzle. If the resolution limitation is not considered when designing for Large-Scale Additive Manufacturing (LSAM), difficulties can arise in the manufacturing process, which may require the adaptation of the deposition parameters. This work incorporates the nozzle size constraint into Topology Optimization (TO) in order to generate optimized designs suitable to the process resolution. This article proposes and compares two methods, which are based on existing TO techniques that enable control of minimum and maximum member size, and of minimum cavity size. The first method requires the minimum and maximum member size to be equal to the deposition nozzle size, thus design features of uniform width are obtained in the optimized design. The second method defines the size of the solid members sufficiently small for the resulting structure to resemble a structural skeleton, which can be interpreted as the deposition path. Through filtering and projection techniques, the thin structures are thickened according to the chosen nozzle size. Thus, a topology tailored to the size of the deposition nozzle is obtained along with a deposition proposal. The methods are demonstrated and assessed using 2D and 3D benchmark problems.
keywords:
Nozzle Size; WAAM; Design for AM; Topology Optimization; Maximum Size1 Introduction
Topology Optimization (TO) and Additive Manufacturing (AM) are recognized as promising technologies for the realization of high performance structural components due to their ability to create designs with unprecedented sophistication. The potential of these technologies has caught intense interest across a wide range of industries (Zhu, Zhang, and Xia 2016; Culmone, Smit, and Breedveld 2019; Tino et al. 2020), which promotes their accelerated development. While AM techniques are becoming more versatile, stable and precise (Li et al. 2019; Bajaj et al. 2020), TO is adapting to the limitations of the AM processes (Liu et al. 2018; Meng et al. 2019).
Topology Optimization is well known for its ability to generate highly efficient designs. However, TO designs often come with high geometrical complexity which hinders manufacturing for even the most advanced AM processes. This drawback has established a research field seeking to facilitate the manufacturability of TO design (Liu et al. 2018). To date, a number of TO methods have been proposed for specific AM processes, such as powder-based processes, stereolithography or Fused Deposition Modeling (FDM). For instance, there are methods to prevent closed cavities in optimized designs in order to ensure the removal of support structures or unfused powder (Li et al. 2016; Langelaar 2019; Gaynor and Johnson 2020). To reduce or avoid the use of support structures, the maximum permissible overhang angle of parts can be controlled during TO (Langelaar 2016; Gaynor and Guest 2016; Zhang and Cheng 2020; van de Ven et al. 2020) along with the printing direction (Langelaar 2018; Wang and Qian 2020). In addition, minimum member size and minimum cavity size can be imposed in TO to ensure their printability (Wang, Lazarov, and Sigmund 2011; Pellens et al. 2019). More complex methods take into account thermal residual stresses in TO (Allaire and Jakabčin 2018), or incorporate continuity constraints to facilitate the printability of multiple materials (Yu et al. 2020). Experimental studies (Fu et al. 2019) and industrial applications (Zhu, Zhang, and Xia 2016) have demonstrated that such AM-specific TO methods enhance the manufacturability of the optimized design when it comes to FDM, stereolithography or powder-based AM processes.
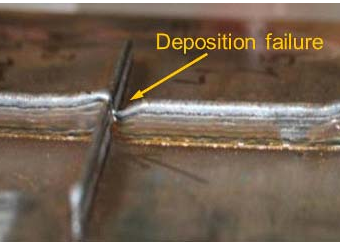
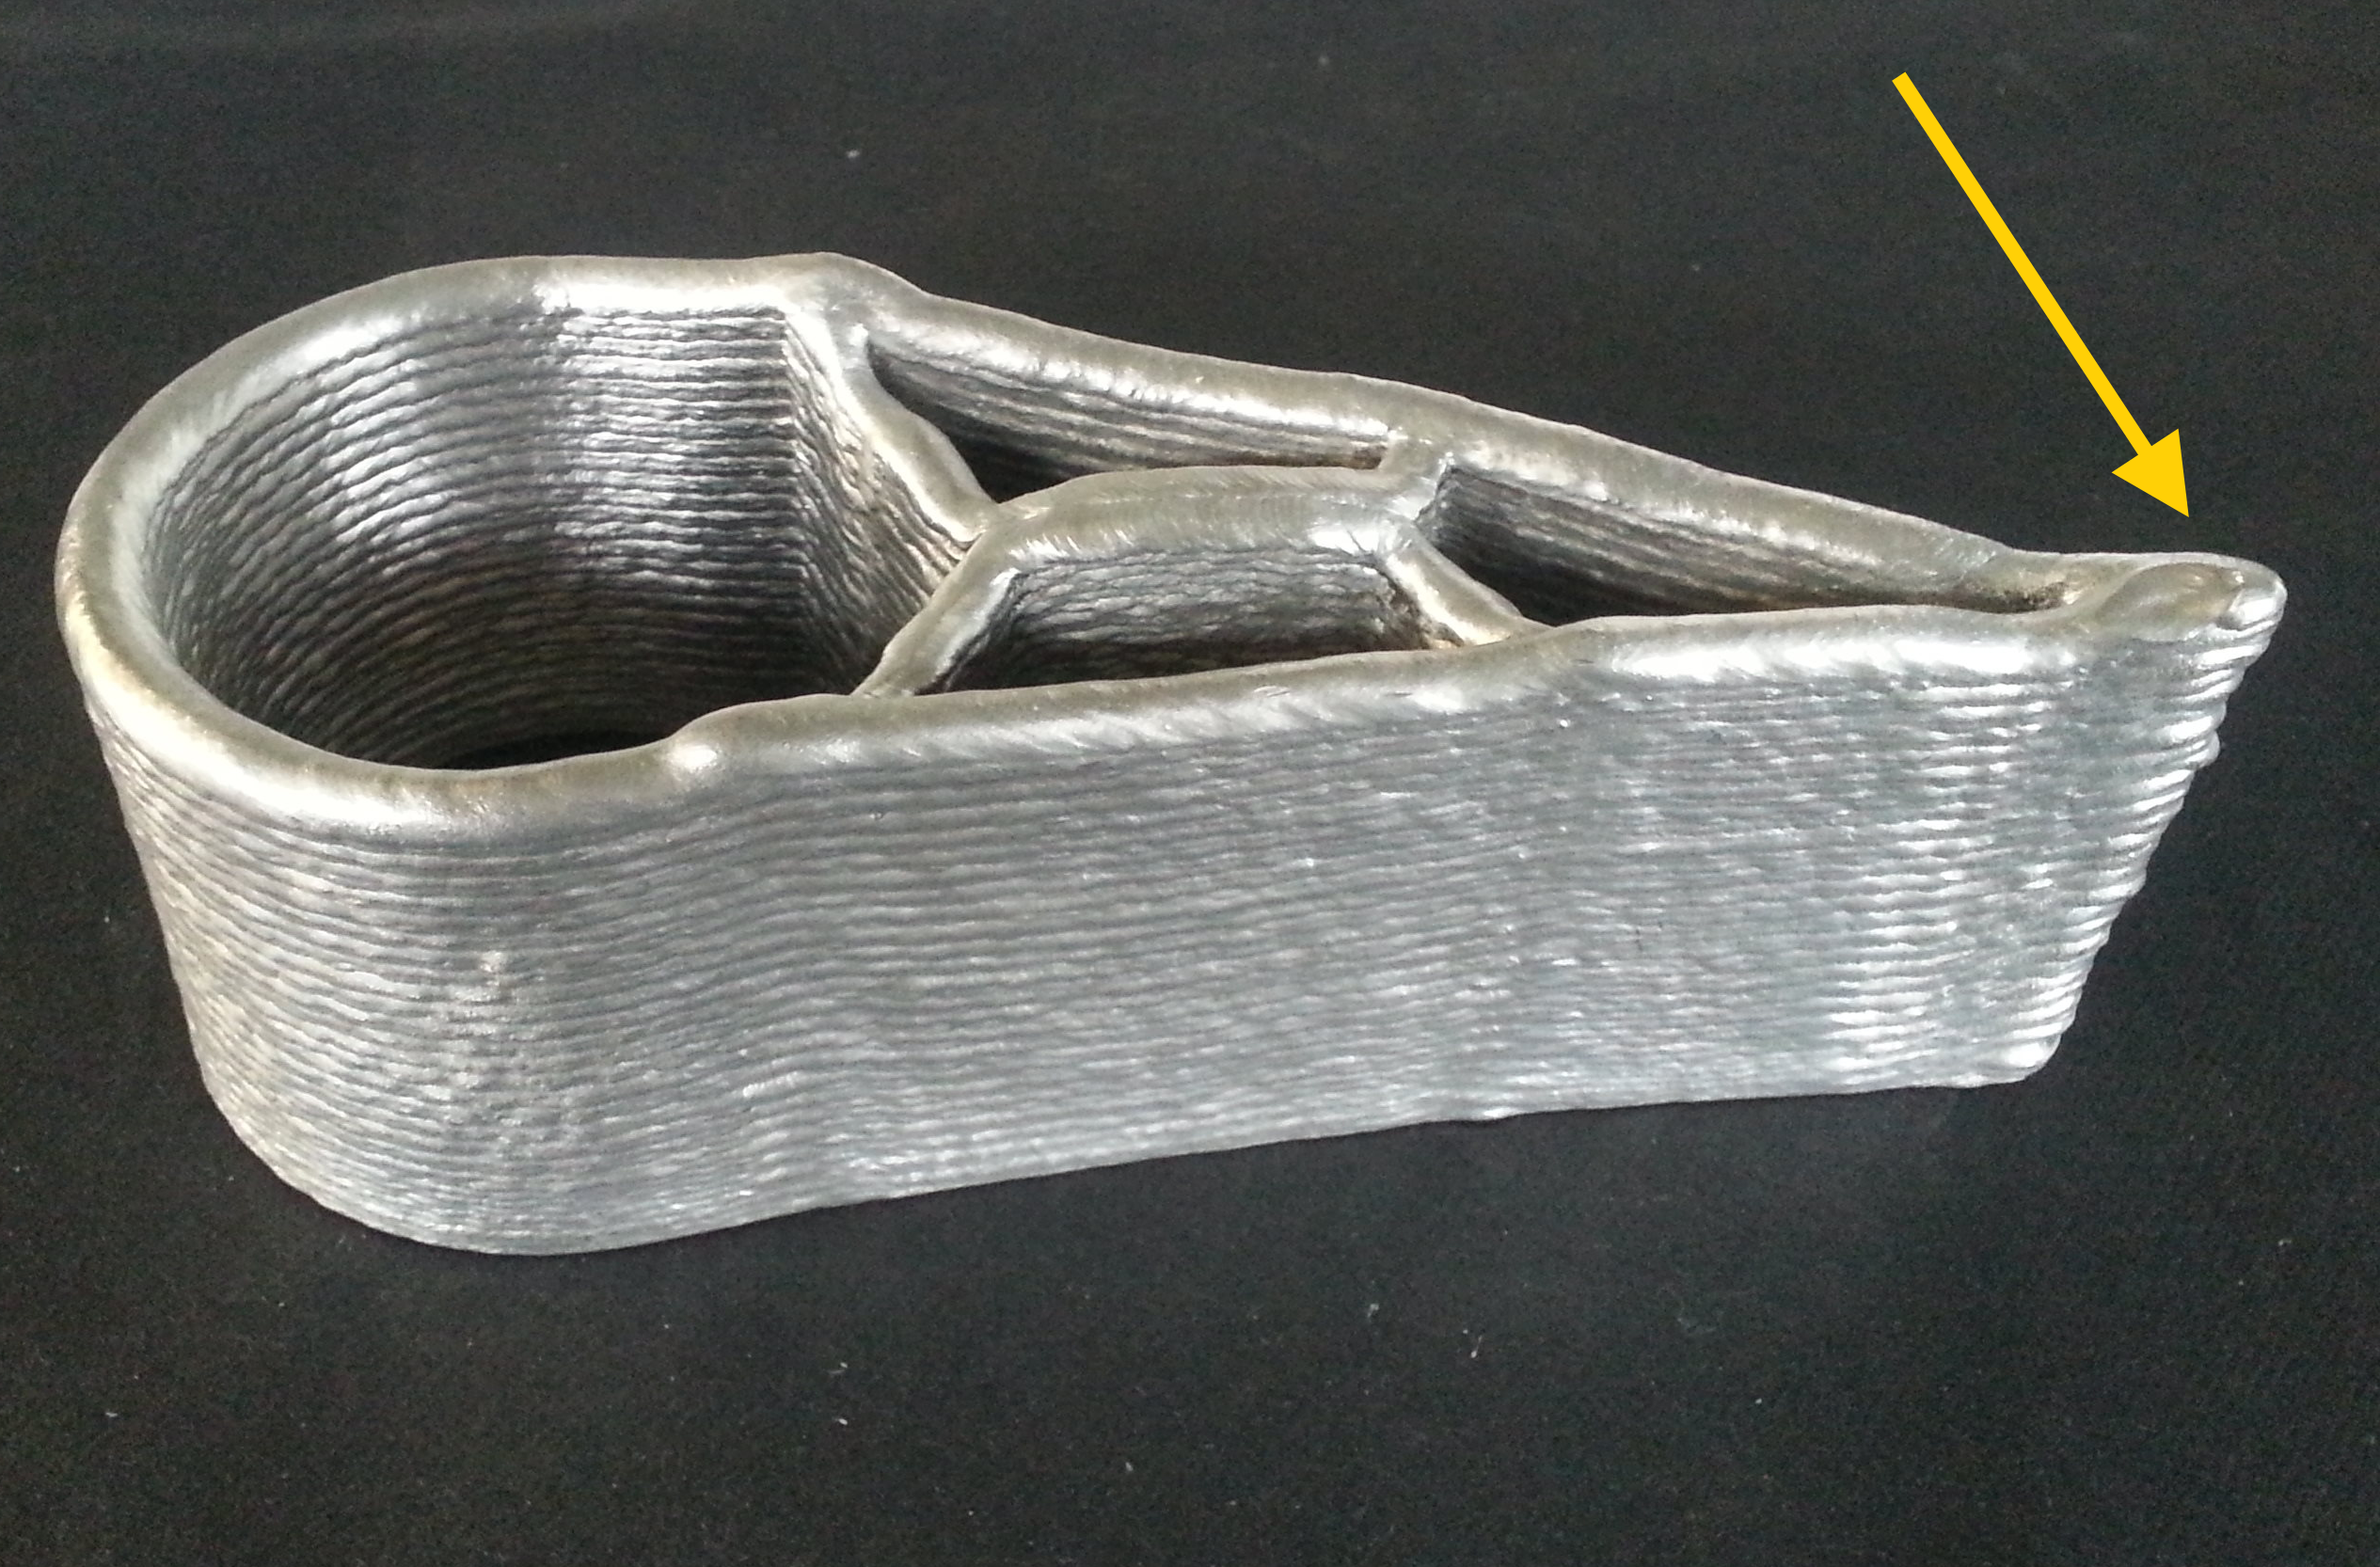
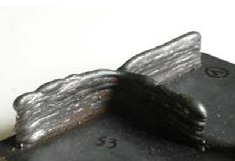
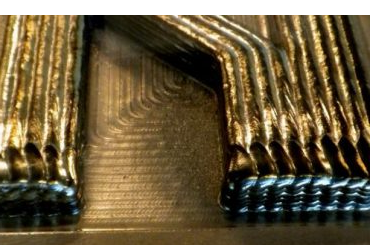
There is an emerging interest in the industry for Large-Scale Additive Manufacturing (LSAM) processes, as they are able to produce components in short time spans (Lim et al. 2012), either to manufacture large-scale parts (Greer et al. 2019), or to speed up mass production (Bishop and Leigh 2020). Among others, processes such as Direct Metal Deposition (DMD), Wire-Arc Additive Manufacturing (WAAM), 3D Concrete Printing (3DCP), and large-scale Fused Deposition Modelling (FDM) stand out. These LSAM processes achieve high production rates by depositing relatively large volumes of material per unit time. Though they operate using the layer-by-layer principle, they exhibit distinctive limitations compared to low production rate processes, such as powder bed fusion. For example, the large amount of deposited material complicates the deposition path planning (Jiang and Ma 2020), since crossover of deposition paths leads to local agglomerations of material that accumulate geometrical defects from layer to layer (Mehnen et al. 2014), as shown in Fig. 1(a). Similarly, design features with sharp corners and small radii of curvature may also cause local agglomeration of material (Geng et al. 2017; Comminal et al. 2019), as shown in Fig. 1(b), while deposition paths with T-joints can induce defects during stops and starts, such as excess or lack of deposited material (Venturini et al. 2016), as shown in Fig. 1(c). These difficulties have been included in path planning algorithms (Liu et al. 2020). However, when the design to be manufactured has features with geometrical details smaller than the nominal resolution of the LSAM process, the path planning becomes extremely difficult, since the deposition process parameters must be included in the planning algorithm. For example, the nozzle size can be reduced, but if this is not possible, then the feed rate and travel speed can be modified, or the deposition beads can be overlapped. Changing the deposition parameters can reduce the process stability, induce geometrical or metallurgical defects and demand extensive testing, thus increasing production costs (Rodrigues et al. 2019). For these reasons, a discrete number of paths must be considered when designing for LSAM, as shown in Fig. 1(d). Thus, designs with resolution and geometrical features compatible with the nominal production are obtained.
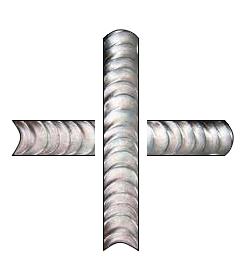
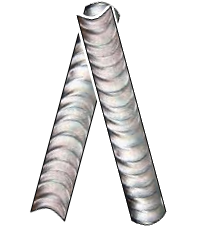
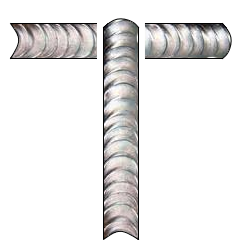
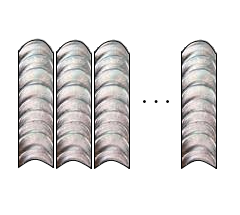
Ways to fully ensure the above mentioned compatibility between design and process are not yet available. Only recently, few studies have appeared that address this gap. Carstensen (2020) considers the size of the deposition nozzle in the TO problem using the formulation that embeds discrete particles in a continuous domain (Guest 2015). The author proposes a formulation that binds the discrete particles to produce a continuous material bead. Numerous examples in 2D are reported, which at first sight meet the imposed resolution of the desired AM process. However, the method binds the particles in a orthogonal pattern, which makes it difficult to generate inclined structural members, therefore, the method is not able to fully exploit the form freedom provided by the AM process. The work of Vantyghem et al. (2020) takes a pragmatic approach to deal with the low resolution issue imposed by 3D Concrete Printing. The authors post-process 2D topology-optimized solutions to propose a large-scale three-dimensional design. In the post-processing step, the authors enforce the design details to match the printing resolution of the LSAM process. However, in this manner the optimality of the final design is likely lost.
This article adopts a strategy different from that proposed by Carstensen (2020), although with the same intent. Consequently, it is aimed to generate topology-optimized designs complying with the low resolution of Large-Scale AM processes, which is typically defined by the size of the deposition nozzle. For this purpose, we propose two methods based on recent developments in minimum and maximum size control in topology optimization (Fernández et al. 2020). The first method forces the minimum and maximum size of all solid members to be equal to the size of the deposition nozzle. This approach proves to be simple yet effective in producing designs suitable for the desired resolution. However, the maximum size restriction prevents solid members greater than the prescribed nozzle size, which can significantly reduce the achievable design performance. The second method restricts the maximum size of the solid members sufficiently to render a structural skeleton, which can also be interpreted as the deposition path. Through filtering and projection techniques (Wang, Lazarov, and Sigmund 2011), the skeleton is dilated according to the nozzle size and thus the actual design is defined. Therefore, a design adapted to the desired resolution is obtained and a low performance penalization is introduced. The proposed strategies are explained, assessed and compared using 2D and 3D numerical examples. Results exhibit designs that conform to the size of the deposition nozzle, allowing optimized topologies to be filled by a discrete number of material beads. Thus, the design requirement shown in Fig. 1(d) is met. Furthermore, for a specific set of printing parameters, deposition paths free of crossovers, T-type connections and sharp corners can be obtained.
Although this paper addresses a purely geometric limitation that has to do with the size of the deposition nozzle, the obtained results suggest that the nozzle size restrictions proposed for topology optimization improve the printability of optimized components. Other AM constraints that may apply such as critical overhang angles or thermal-induced restrictions are outside the scope of this work. Potential combinations and extensions with other AM constraints are discussed in the Perspectives section towards the end of this manuscript.
The remainder of this article is organized as follows. Section 2 introduces the formulation of the TO problem that imposes the minimum and maximum size of solid members. Section 3 presents and compares the two methods proposed in this article using a compliance minimization formulation. In addition to 2D examples in the preceding section, Section 4 compares the two methods on a 3D test case. Section 5 validates the methods on benchmarks including stress constraints and displacement functions. Finally, Section 6 provides the conclusions and future perspectives of this work.
2 Base topology optimization formulation
The topology optimization problem is formulated using the density method (Bendsøe and Kikuchi 1988). Therefore, the design domains are discretized into finite elements and their densities are described by design variables. The value of these design variables range from 0 to 1, where the value 0 represents the void phase and the value 1 represents the solid phase (Bendsøe 1989). To avoid the presence of intermediate densities, we use the Solid Isotropic Material with Penalization (SIMP) interpolation law (Bendsøe 1989). Note that, for simplicity and because the focus of this work is on the nozzle size restriction, anisotropic material behavior is not considered.
It is well-known that SIMP exhibits numerical difficulties, such as the mesh-dependency and the presence of checkerboard patterns (Sigmund and Petersson 1998). In addition, the formulation does not allow to impose precisely a minimum size control in the solid and void phases (Wang, Lazarov, and Sigmund 2011), which is an essential requirement for the methods proposed in this work. For this reason, we adopt the robust formulation proposed by Sigmund (2009). This formulation considers manufacturing errors that may result in a thinner (eroded) or thicker (dilated) design with respect to the reference one intended for manufacturing (intermediate). These designs are constructed using filtering and projections techniques, which are described below.
The filtering operation utilizes a weighted average of the design variables within a circular (or spherical) domain of radius (Bruns and Tortorelli 2001; Bourdin 2001). The numerical procedure is defined as follows:
| (1) |
where and are the design variable and the filtered variable associated with the finite element , respectively. The volume of element is denoted as and the weight of the design variable in the definition of is denoted by . The weighting function depends on the distance between the centroids of elements and , which are denoted as and , respectively. Here, the weighting function is defined by the following decreasing linear function:
| (2) |
The projection operation transforms the value of all the filtered variables that are greater than a given threshold close to 1, and close to 0 otherwise (Guest, Prévost, and Belytschko 2004). This is done using the following smoothed Heaviside function:
| (3) |
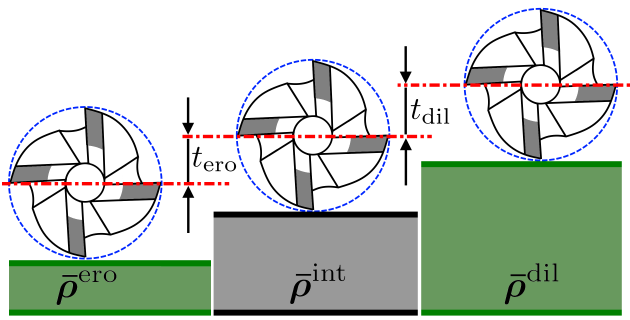
where is the projected density and is the parameter that controls the steepness of the smoothed Heaviside function (Wang, Lazarov, and Sigmund 2011). The parameter controls the projection threshold and can be used to impose a uniform manufacturing error. As can be seen in Fig. 2, the eroded, intermediate and dilated designs are denoted by , and , and they are created selecting the values of thresholds , and , respectively. Fig. 2 depicts the eroded and dilated designs colored green to emphasize the fact that the intermediate design is the actual design intended for manufacturing.

2.1 Minimum size formulation
As mentioned above, the eroded and dilated fields can be seen as the outcome product of a manufacturing error. As illustrated in Fig. 3, the manufacturing error can be caused by the misplacement of a milling tool with respect to the reference line, where and represent the placement errors.
Sigmund (2009) proposed a robust formulation with respect to manufacturing errors, i.e. the component must provide high performance even if the optimized design is eventually eroded or dilated during the manufacturing process. For example, considering the compliance minimization problem subject to a volume restriction, the robust formulation reads as follows:
| (4) | ||||
where is the compliance, is the array containing the elemental volumes, and , and are the maximum volume of material allowed in the eroded, intermediate and dilated designs, respectively.
The compliance of each design field is computed as , where is an array containing the external forces and is array containing the nodal displacement of the design field. A linear-elastic response is assumed in the finite element model that yields , and the finite element analysis is performed prior to solving the iteration of the optimization problem (approach known as Nested Analysis and Design (Arora and Wang 2005)).
An interesting outcome of the robust formulation is that the design intended for manufacturing features a minimum size in both the solid and void phases (Wang, Lazarov, and Sigmund 2011). The minimum size of the solid is defined by the radius of the largest circle (or sphere), that can be inscribed in the thinnest solid member. Conversely, the minimum size of the void is defined by the radius of the largest circle (or sphere), that can be inscribed in the smallest cavity of the topology. Thus, may represent the radius of a deposition nozzle in an AM process, while may represent the radius of a cylindrical (or spherical) milling tool.
It is well known that in the robust formulation, the desired minimum length scale is implicitly imposed through the parameters that define the filtering and projection processes (Wang, Lazarov, and Sigmund 2011). Thus, and must be defined through , , , and . The relation between the desired minimum length scales and the parameters that impose it can be obtained numerically (Wang, Lazarov, and Sigmund 2011) or analytically (Qian and Sigmund 2013). To facilitate the description of the proposed methodology, the minimum length scale is fixed at , which is imposed through:
| (5) | ||||
It is important to note that other combinations of length scales and threshold parameters do not change the findings of this work, as long as .
The eroded design is the most compliant. Therefore, in the compliance minimization problem of Eq. (4), the intermediate and dilated designs can be excluded from the objective function (Amir and Lazarov 2018). In addition, the volume restriction can be applied to one field only and implicitly restrict the volume of the other two (Sigmund 2009). Thus, the robust compliance minimization problem reduces to the following formulation:
| (6) | ||||
In the simplified robust topology optimization problem of Eq. (6), the volume constraint is applied to the dilated design. As the intermediate design is the one intended for manufacturing, the desired volume constraint is used to scale the upper bound that defines the volume constraint (Amir and Lazarov 2018). There are two main reasons for this implicit approach to impose the volume constraint. The first one is the most known in the literature (Amir and Lazarov 2018; Fernández et al. 2020; Sigmund 2009; da Silva, Beck, and Sigmund 2019; Wang, Lazarov, and Sigmund 2011) and it is due to the fact that applying the restriction in the dilated design reduces numerical instabilities and promotes convergence to better optimum. The second reason, which is rarely mentioned in the literature (Trillet, Duysinx, and Fernández 2021), is that the implicit volume restriction allows to involve all 3 design fields in the optimization problem, which is an essential requirement to ensure the minimum size control on the solid and void phases (Trillet, Duysinx, and Fernández 2021).
The minimum compliance optimization problem in Eq. (6) is denoted as the Reference problem hereafter.
2.2 Minimum and Maximum size formulation
The topology optimization methods accounting for the size of the deposition nozzle require in addition control over the maximum size of the solid members. To this end, the approach proposed by Fernández et al. (2020) is used. In (Fernández et al. 2020), the maximum size of a solid feature is imposed using the following local volume restriction (Guest 2009):
| (7) |
where is the volume restriction applied within a region . The expression is a measure of the amount of void within the element , where is a parameter penalizing intermediate densities to avoid their appearance during the optimization process, similar to the SIMP penalty parameter. Therefore, the volume restriction in Eq. (7) computes the fraction of void within the local region and enforces it to be equal or greater than a given fraction . The local region is defined as an annulus (or spherical shell), with an outer radius and inner radius , as shown in Fig. 4. Similar to (Fernández et al. 2020; Guest 2009), the void fraction within the local region is set as and the penalty parameter is set as .
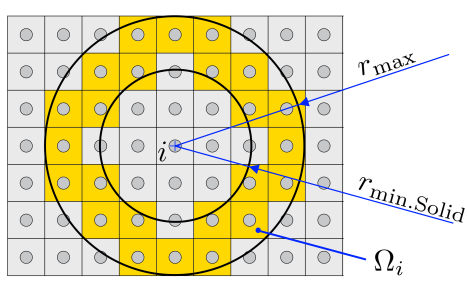
Fernández et al. (2020) showed that to obtain an intermediate design satisfying the desired length scale, i.e. the minimum member size (), the minimum cavity size () and the maximum member size (), it is sufficient to apply the local volume restriction at least in the dilated design. Thus, the compliance minimization problem with minimum and maximum length scale control is defined as:
| (8) | ||||
The optimization problem in Eq. (8) is named the Size-Constrained problem hereafter. The constraint represents the global maximum size restriction that aggregates the local ones (). The aggregation is performed with a p-mean function, as follows:
| (9) |
where is the aggregation exponent and a shift parameter to control aggregation accuracy. Similar to (Fernández et al. 2019, 2020), is set to 100 and to 0.05 in all the examples reported in this work.
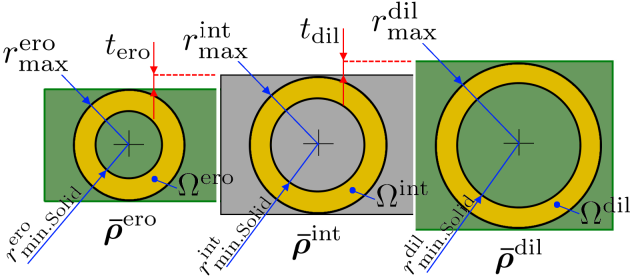
To apply the local volume constraint in the dilated design, the local region must be scaled according to the dilation distance , as illustrated in Fig. 5. Thus, the annular region is defined by the following outer and inner radii:
| (10) | ||||
Given the filter and projection parameters defining the minimum length scale in Eq. (5), the dilation distance is (Fernández et al. 2020; Trillet, Duysinx, and Fernández 2021):
| (11) |
Since the methods presented above are available in the literature, sensitivity analysis is omitted for brevity. Interested readers are referred to (Bendsoe and Sigmund 2004) for the sensitivity analysis of the objective function and of the volume restriction, to (Wang, Lazarov, and Sigmund 2011) for the sensitivity analysis of the eroded, intermediate and dilated designs, and to (Fernández et al. 2020) for the sensitivity analysis of the maximum size restriction.
2.3 Implementation details
Given the highly non-linearity of the Heaviside projection and of the aggregation function that builds the maximum size constraint, it is useful to implement a continuation scheme. As done in (Fernández et al. 2020), the Heaviside parameter is initialized at 1.5 and is increased by 1.5 times up to a maximum of 38. The SIMP penalty parameter is initialized at 1.0 and is increased up to 3.0 in increments of 0.25. The parameter increments are performed every 50 iterations. The stopping criterion of the complete TO process is met either when 450 iterations are reached, or when the maximum change in the design variables between two consecutive iterations is smaller than 0.001.
The reference and the maximum-size-constrained problems, i.e. Eqs. (6) and (8), are implemented in free access codes. Here we use the 88-line code (Andreassen et al. 2011) and the TopOpt code (Aage, Andreassen, and Lazarov 2015). The first one is written in MATLAB aimed at solving 2D problems whereas the latter is a C++ code intended to solve large scale 3D problems. These codes use the density method, the SIMP interpolation scheme and the density filter. Therefore, the Heaviside projection that builds the eroded, intermediate and dilated designs has been added, along with the maximum size restriction and the robust topology optimization formulation. The optimization problems are solved using the Method of Moving Asymptotes (MMA) (Svanberg 1987).
The reader interested on implementation details is referred to (Fernández et al. 2020), since the TopOpt code with the corresponding modifications to solve the reference and the maximum size constrained problems are provided.
3 TO for LSAM
Having introduced the framework to control minimum and maximum size within a topology optimization framework, we proceed with the discussion of the two methods to ensure designs compatible with the intended LSAM process. First, a test problem is introduced by which the methods are explained. Also solutions from the reference optimization problem are discussed to clarify the need for specific design restrictions, after which in subsection 3.1 a method based on a nozzle size constraint is presented. Subsection 3.2 proceeds with the second method, which is based on dilating a maximum size-constrained design.
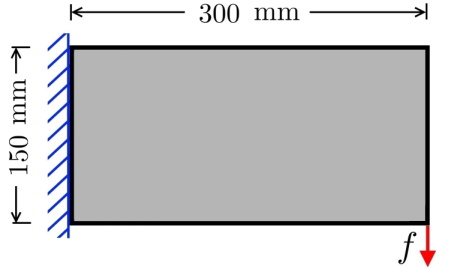
The proposed strategies are explained using a 2D cantilever beam for compliance minimization. For the sake of clarity, arbitrary yet realistic dimensions are chosen in this test case. The design domain is defined by a rectangle of 300 mm 150 mm, as shown in Fig. 6. This domain is discretized into 300 150 quadrilateral finite elements, resulting in square elements of 1 mm length. The optimized design is intended for an AM process equipped with a deposition nozzle of 5 mm diameter. Henceforth, the size of the deposition nozzle is defined by its radius, which is denoted as .
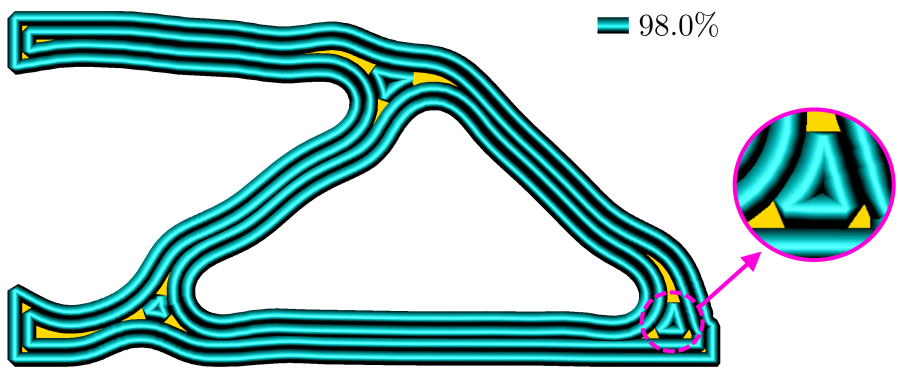
To provide an insight into the printability of the reported designs, the deposition paths obtained with the PrusaSlicer (v.2.2.0) software are provided. PrusaSlicer (Prša 2020) is a freely available software that generates G-codes from STL files. The software is designed for desktop 3D printers, where the nozzle diameter is approximately 0.4 mm, which is rather small compared to a typical component intended for LSAM machines. Although the nozzle size can be modified to a bigger size, the slicing algorithms of PrusaSlicer (v.2.2.0) do not take into account the low-resolution issue caused by large deposition nozzle sizes. Nonetheless, this software is employed herein as a tool to provide the reader with an idea of the printability of the component when large nozzle sizes are used. In this work, the printability of the optimized designs appears next to the symbol \scalerel*![]() B on the corresponding figures and it represents the percentage of the design that can be filled using a nozzle of a given size. Thus, the printability index (\scalerel*
B on the corresponding figures and it represents the percentage of the design that can be filled using a nozzle of a given size. Thus, the printability index (\scalerel*![]() B) is be defined as:
B) is be defined as:
| (12) |
where is the number of layers resulting from the slicing procedure, which takes the value 1 in 2D designs. The surface area of the layer desired to be filled by the deposition process is denoted by , and the actual surface area filled is denoted by , where is the index of the layer.
PrusaSlicer offers different infill patterns, from which the perimeter one is chosen. Thus, the slicing algorithm tracks the design perimeter sequentially, which is a common practice in LSAM processes, especially those equipped with large deposition nozzles. However, the software requires at least two deposition paths per solid member, one for each side of the member. Therefore, to ensure that each solid member found in the optimized design contains at least two deposited beads, the minimum size of the solid phase must be twice the size of the nozzle, i.e. mm.
Given that the deposition paths follow the contour of the design, it is convenient to control the minimum size of the void phase in order to impose a radius of curvature at the reentrant corners of the design and avoid the difficulties associated to the sharp corners in the deposition path. Arbitrarily, the minimum radius of curvature is set as mm, which is imposed with the filter and projection parameters listed in Eq. (5).
Three reference problems (Eq. (6)) are solved for the cantilever beam depicted in Fig. 6 with different volume restrictions, i.e. , and . It is recall that no maximum size constraint is used. The optimized designs and the perimeter deposition paths are shown in the first and second rows of Table 1, respectively. The two circles next to each optimized solution indicate the desired length scale. The blue circle represents the minimum size of the void phase while the black circle represents the minimum size of the solid phase. Both have been set to 5 mm. Regarding the deposition paths, the deposited material is shown in light blue and the regions that cannot be filled are shown in yellow. The printability of the optimized design is reported next to the deposition paths. To complement the analysis and discussion, deposition paths obtained with a rectilinear filling pattern, and combination of perimeter and rectilinear are included in the third and fourth rows of Table 1, respectively.
|
Design |
![[Uncaptioned image]](/html/2105.08115/assets/Figures/T1_MinS_30.png)
|
![[Uncaptioned image]](/html/2105.08115/assets/Figures/T1_MinS_40.png)
|
![[Uncaptioned image]](/html/2105.08115/assets/Figures/T1_MinS_50.png)
|
| c()=124.4 | c()=88.8 | c()=73.2 | |
|
perimeter |
![[Uncaptioned image]](/html/2105.08115/assets/Figures/T1_MinS_30_Slice.png)
|
![[Uncaptioned image]](/html/2105.08115/assets/Figures/T1_MinS_40_Slice.png)
|
![[Uncaptioned image]](/html/2105.08115/assets/Figures/T1_MinS_50_Slice.png)
|
|
rectilinear |
![[Uncaptioned image]](/html/2105.08115/assets/Figures/T1_MinS_30_Slice_1.png)
|
![[Uncaptioned image]](/html/2105.08115/assets/Figures/T1_MinS_40_Slice_1.png)
|
![[Uncaptioned image]](/html/2105.08115/assets/Figures/T1_MinS_50_Slice_1.png)
|
|
combination |
![[Uncaptioned image]](/html/2105.08115/assets/Figures/T1_MinS_30_Slice_2.png)
|
![[Uncaptioned image]](/html/2105.08115/assets/Figures/T1_MinS_40_Slice_2.png)
|
![[Uncaptioned image]](/html/2105.08115/assets/Figures/T1_MinS_50_Slice_2.png)
|
Considering the perimeter infill pattern in Table 1, the reference designs allow fabrication by at least two adjacent beads per solid member, which is attributed to the minimum size control imposed on the topology. However, perimeter paths present large unfilled areas that do not match the nozzle size. Better printability can be achieved using other deposition paths or combinations of infill patterns, as shown in the third and fourth rows of Table 1. Even though, it is not possible to guarantee filling all or most of the design during the deposition process, because it is highly likely that numerous design features will not meet the resolution of the deposition nozzle, as this condition is not imposed on the geometry of the reference optimized designs. For example, it can be seen that a rectilinear pattern covers more area than the perimeter pattern, especially in designs with large volume ( equal to 40 and 50) as shown in the third row of Table 1, but it does not cover more than 95 of the surface due to the small gaps that are present at the outer edge of the design as a result of the numerous path turns. Undoubtedly, the optimal deposition path must consider not only the ability to cover the largest surface area but also other aspects such as the anisotropy of the deposited material, the step-over distance, the number of deposition passes and path continuity, surface finish, and post-machining work among others (Ding et al. 2015; Liu et al. 2018). These aspects are not considered in this work and the proposed methods for topology optimization are limited to producing optimized designs tailored to the process resolution in order to facilitate the path planning and guarantee higher printability.
It is also worth noting that better printability can be achieved not only by optimizing the deposition path, but also using a smaller deposition nozzle size in the remaining unfilled areas, by overlapping the beads, or by modifying the feed rate and travel speed. Nevertheless, each of these measures adds a degree of complexity, cost and risk to the process, which is not desired. Instead, the aim of this work is to propose optimized designs suitable with the nozzle size and thus reduce or avoid the need to modify the deposition parameters. For this purpose, the maximum size constraint is used in two different forms, which leads to the two methods proposed in this article.
3.1 Method 1: Nozzle size constraint
The first method conforms the optimized design to the size of the deposition nozzle by tailoring the minimum and maximum size of the solid phase according to the size of the deposition nozzle. Given that in this study it is decided to place two deposited beads per solid member, the minimum and maximum length scales are chosen as follows:
| (13) |
where is a small distance to avoid contradictions between the minimum size imposed by the Heaviside projection and the maximum size imposed by the maximum size constraint. In this work, is equal to the size of a finite element, which was found to work well. The specific choices in Eq. (13) ensure the width of all structural features ranging from 5 mm to 6 mm, i.e. twice the bead width, which facilitates manufacturability by a LSAM process equipped with a large deposition nozzle fixed in size.
The resulting maximum-size-constrained designs and the corresponding deposition paths are shown in Table 2. The desired maximum size of the solid phase is indicated by a black circle next to each solution. Unlike the reference designs, those constrained in maximum feature size possess structural members of uniform width, which leads to fewer unfilled gaps in the designs. The size-constrained members admit two parallel paths, notably without gaps between the deposited beads. In addition, as designs are filled with two parallel beads that follow the surface of the design, no T-joints or path crossovers are obtained. Furthermore, as the minimum size of the void phase is set equal to the radius of the deposition nozzle, no sharp corners are obtained in the deposition path. Note also that the printability of all designs with nozzle size constraint (95.1-98.1) is superior to that of the reference designs (85.9-91.5). Therefore, designs constrained in maximum size (Table 2) are demonstrated to be much easier to manufacture by LSAM than the reference designs (Table 1).
![[Uncaptioned image]](/html/2105.08115/assets/Figures/T1_MaxS_30.png)
|
![[Uncaptioned image]](/html/2105.08115/assets/Figures/T1_MaxS_40.png)
|
![[Uncaptioned image]](/html/2105.08115/assets/Figures/T1_MaxS_50.png)
|
![[Uncaptioned image]](/html/2105.08115/assets/Figures/T1_MaxS_30_Slice.png)
|
![[Uncaptioned image]](/html/2105.08115/assets/Figures/T1_MaxS_40_Slice.png)
|
![[Uncaptioned image]](/html/2105.08115/assets/Figures/T1_MaxS_50_Slice.png)
|
| c()=136.6 (+9.8 ) | c()=119.1 (+34.1 ) | c()=94.4 (+29.0 ) |
 B represents the printability index defined in Eq. (12).
Despite the benefits introduced by the maximum size restriction, some drawbacks can be noted. For instance, small unfilled zones can be observed at the intersection of two or more solid members. There, the perimeter deposition path exposes triangular unfilled regions, which represent about of the design obtained with in Table 2. Due to these unfilled zones, it is expected that performance of the manufactured component will be different from that of the optimized design, although the performance reduction is not quantified in this study. Regarding this geometrical drawback at the intersection of two or more solid members, we point out that the printability of such zones depends on the intended AM process and the deposition path. For example, if the nozzle size is chosen to be equal to the width of the solid members, the intersection between solid members would represent a T-joint or a crossover of paths. In such cases, it may be advantageous to have an intersection larger than the prescribed size since, in practice, it is difficult to achieve a joint with high dimensional accuracy (Venturini et al. 2016).
The size-constrained design in Table 2 for a volume restriction of exhibits zones that do not meet the desired minimum size, such as those indicated by the red arrows in the deposition path in Table 2. In addition, given that the global maximum size constraint is defined by a p-mean aggregation function, it is possible to find parts of the topology that do not meet the imposed maximum size, as the one highlighted by the blue arrow in Table 2. These undesirable features typical of a local optimum can be reduced by adjustment of parameters. For instance, by increasing the exponent of the aggregation function and increasing the value of the penalty parameters ( and SIMP) more slowly, i.e. by adapting the continuation method to involve a larger number of iterations (Fernández et al. 2020).
It is worth noting that the choice of placing two material beads is to make use of the perimeter deposition path of PrusaSlicer, which is used for illustrative purposes. That is, the proposed method can be used to place any number of beads along the structural members by choosing the maximum and minimum size of the solid phase according to the desired number of beads. For illustrative purposes, a cantilever beam is optimized taking into account 4 material beads along the structural members. Since an even number of beads is assumed, the perimeter pattern can be used to illustrate the deposition path, which is shown in Fig. 7. It is noticeable that a large part of the design is filled with 4 material beads arranged in a parallel fashion, and the remaining gaps at the intersection of solid members are filled with triangular patterns, which may present difficulties when printing due to the sharp corners of the trajectory, as outlined in Fig. 7. Therefore, positioning two material beads per solid member may be a preferable strategy when using maximum size constraints.
Certainly, one of the most significant drawbacks of the maximum size restriction is the performance reduction. It can be seen that the size-constrained design obtained with has a higher compliance compared to the reference design. Requiring all structural members to have the same width of, in this case, two beads, is a rather strong design restriction. Allowing for design features to have varying integer multiples of adjacent beads in various places throughout the structure would also result in a manufacturable design, while offering more design freedom. To conform the optimized design to the size of the deposition nozzle and to avoid a significant reduction on the structural performance, the following subsection presents a second strategy, which is also based on maximum size constraints.
3.2 Method 2: Skeleton-based deposition paths
In the method discussed above, the chosen minimum and the maximum length scales dictate structural members to have uniform width, which facilitates the generation of a feasible deposition path. However, the structural members remain separated from each other, which negatively affects the structural performance. This subsection shows that the separation between members can be eliminated through a dilation projection while retaining the manufacturability. The proposed method is based on the numerical study presented in (Fernández et al. 2020).
Fernández et al. (2020) revealed the behaviour of the maximum size constraint in the context of the robust formulation by restricting the size of the eroded, intermediate and dilated designs separately. The authors concluded that in order to impose the desired minimum and maximum length scales, it is necessary to restrict at least the dilated design. Part of the numerical study developed in (Fernández et al. 2020) is reproduced in Table 3 in order to highlight the property in interest for our work. To this end, the maximum-size-constrained problem in Eq. (8) is solved but with variations on the field where the maximum size constraint is applied. The first and second rows of the table show the result obtained when the maximum size restriction is applied to the intermediate and to the dilated design, respectively. The local region is shown next to the field in which the maximum size constraint is applied, while the desired minimum length scale is shown by the blue and black circles next to the intermediate design. As concluded in (Fernández et al. 2020), the minimum and maximum length scales are met only when is included in the topology optimization problem. However, in this work we emphasize another important observation.
| Constraint | |||
![[Uncaptioned image]](/html/2105.08115/assets/Figures/E_Int.png)
|
![[Uncaptioned image]](/html/2105.08115/assets/Figures/I_Int.png)
|
![[Uncaptioned image]](/html/2105.08115/assets/Figures/D_Int.png)
|
|
![[Uncaptioned image]](/html/2105.08115/assets/Figures/E_Dil.png)
|
![[Uncaptioned image]](/html/2105.08115/assets/Figures/I_Dil.png)
|
![[Uncaptioned image]](/html/2105.08115/assets/Figures/D_Dil.png)
|
The first row of Table 3 suggests that if the maximum size constraint is applied only in the intermediate design, the dilated design does not feature a maximum member width, since the dilation projection closes the cavities present in the intermediate design, as illustrated in Fig. 8. Under this formulation, the eroded and intermediate designs can be interpreted as the structural skeleton or the deposition lines of an AM process, and the dilated design would be the component obtained after deposition. For suitably chosen length scales, the bonding of adjacent beads can be represented in this way. This observation allows us to formulate the following topology optimization problem:
| (14) | ||||
where represents a dilated projection and the design to be manufactured. Henceforth, this optimization problem (14) is denoted as the AM-constrained problem.
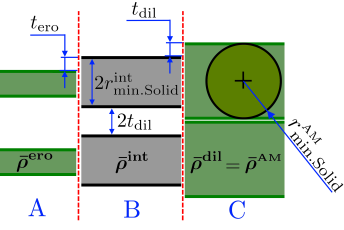
The AM-constrained problem contains the sum of two compliances in the objective function. The compliance of the eroded design serves to impose the minimum size of the solid members (Wang, Lazarov, and Sigmund 2011), while the compliance of the dilated design is to ensure a good performance of the component intended for manufacturing. The compliances are weighted by , where . To define , the following must be considered. If the eroded compliance is prioritized (), the minimum size of the solid phase is guaranteed, but as insignificant emphasis is placed on the performance of the printed structure, the bars of the AM design could still be separated by a very thin layer of gray elements (as seen in zone labeled as C in Table 3), which could impair structural performance. In addition, if a large volume of material is allowed in the design domain, floating structures can arise in the dilated design (Fernández et al. 2020). On the other hand, if the dilated compliance is prioritized (), the bonding of bars is promoted but the minimum size control is not ensured. If the compliances are weighted equally (), a topology that does not meet the desired minimum size and/or that does not completely merge the bars could be obtained. To avoid these issues, the weighting parameter is defined with a continuation scheme. At the beginning of the optimization problem, the minimum size is prioritized, and as the optimization progresses, the structural performance is prioritized. Thus, can be defined by the following function:
| (15) |
where is the maximum number of iterations defined for the continuation scheme and is the current iteration number. Although this continuation scheme causes the objective to change in every iteration, it was found to have no detrimental effect on convergence, and has been used successfully in all the cases considered in this study.
To select appropriate length scales and obtain designs suitable for Large-Scale AM processes, i.e. members composed of an integer number of parallel beads, the following must be considered. Given that the design intended for manufacturing is , the desired minimum size in the solid phase is , as illustrated in Fig. 8. Therefore, the set of projection and filtering parameters (, , and ) must be found for a length scale defined in the dilated design. The information available in the literature to obtain the filtering and projection parameters are meant for a length scale defined in the intermediate design (Wang, Lazarov, and Sigmund 2011; Fernández et al. 2020), but it can be used here knowing that the length scale of the intermediate and dilated designs are related by the dilation distance, as follows:
| (16) |
Taking into account that the following set of thresholds is adopted:
| (17) |
it only remains to find the relationships between , and , and to replace these relationships in Eq. (16) to obtain the filter radius leading to . To assist the reader in understanding the procedure for obtaining the required relationships, we include in Fig. 9 graphs relating the projection parameters and the minimum sizes of the intermediate design. For the generation of these graphs, the MATLAB code provided in (Trillet, Duysinx, and Fernández 2021) has been run as NumericalSolution(10,38). The input parameter ”10” denotes a representative size of the filter radius (given in finite elements) simply needed to reduce rounding errors resulting from the finite element discretization. ”38” represents the maximum value of the smoothed Heaviside projection parameter. The procedure to obtain the filter radius for a given nozzle size is detailed hereafter.
The minimum size of the solid phase in the intermediate design () can be expressed as a function of the filter radius using Fig. 9(a), which yields to:
| (18) |
The dilation distance can be expressed as a function of the filter radius using Fig.9(b), resulting in:
| (19) |
Then, using Eqs. (19) and (18) in Eq. (16), the filter radius as a function of the desired minimum length scale is obtained:
| (20) |
The procedure explained in Eqs. (18)-(20) can be used to obtain the filter radius () as a function of the desired length scale () for any other set of thresholds (, and ) that may be required for a specific reason.
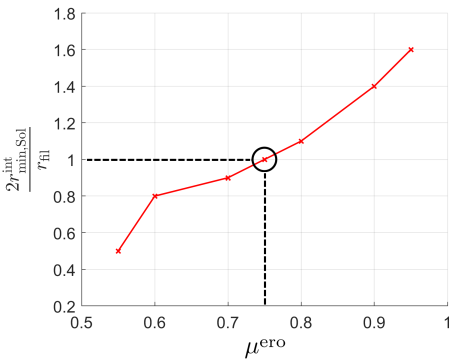
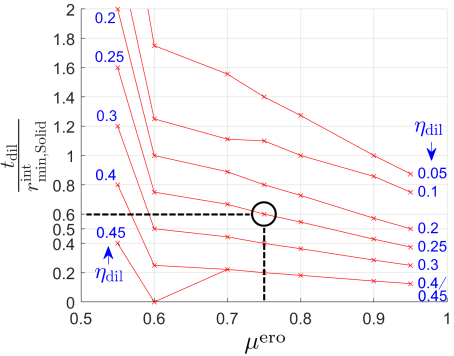
It is emphasized that the relationships between parameters in Eqs. (16)-(20), are obtained from the graphs of Fig. 9, which are built from a numerical method that assumes a 1D design domain (Wang, Lazarov, and Sigmund 2011) and a filter radius of the order of 10 finite elements. For this reason, it is expected that the relationships provided by Fig. 9 will not be accurately met in practice. A major source of error comes from rounding the number of finite elements, especially when small distances (close to one or two finite elements) are involved (Trillet, Duysinx, and Fernández 2021). This rounding error explains the improved behavior of the method when using a slightly smaller dilation projection threshold, which in our case is 0.20 instead of 0.25. Taking into account this observation, the set of parameters that are used hereafter in the AM-constrained problem are:
| (21) | ||||
where the factor 1.11 comes from the equations = and = , which are obtained from Figs. 9(b) and 9(a), respectively. The reason why performs better than is described in the following. It is recalled that in the illustrative example, the minimum size of the solid phase () has been set equal to 5 finite elements. When using a projection , the dilation distance is finite elements. On the other hand, if is used, the dilation distance is finite elements. Numerically, 1.88 results in one finite element (0.88 elements of rounding error), and 2.2 results in two finite elements (0.2 elements of rounding error). That is, a projection using induces a smaller rounding error and produces a dilation distance one finite element larger than the one obtained with , which results in a better bonding between members in the dilated projection. The reader intending to modify the projection thresholds or imposed length scale is recommended to make use of the numerical method provided in (Trillet, Duysinx, and Fernández 2021), as it entails smaller rounding errors and thus less work in parameter tuning compared to the analytical method provided in the cited work.
Now that the formulation of the topology optimization problem has been presented and the projection and filtering parameters have been defined, the proposed method is demonstrated on the cantilever beam presented in the previous section. As the minimum size of the solid phase is set to twice the size of the nozzle, mm. The eroded, intermediate and AM designs, along with the deposition paths are shown in Table 4.
Similar to the maximum-size-constrained designs reported for the first method, the AM-constrained designs do present small unfilled gaps, which are mostly situated at the intersection of solid members. In terms of printability, the designs perform similarly as well. However, the AM-constrained designs exhibit better performance on the face of increased design freedom. The difference is most noticeable when large volumes of material are allowed in the topology, which highlights the need to prefer the AM-constrained optimization problem over the maximum-size-constrained one.
![[Uncaptioned image]](/html/2105.08115/assets/Figures/AM_V30_Ero.png)
|
![[Uncaptioned image]](/html/2105.08115/assets/Figures/AM_V40_Ero.png)
|
![[Uncaptioned image]](/html/2105.08115/assets/Figures/AM_V50_Ero.png)
|
|
![[Uncaptioned image]](/html/2105.08115/assets/Figures/AM_V30_Int.png)
|
![[Uncaptioned image]](/html/2105.08115/assets/Figures/AM_V40_Int.png)
|
![[Uncaptioned image]](/html/2105.08115/assets/Figures/AM_V50_Int.png)
|
|
![[Uncaptioned image]](/html/2105.08115/assets/Figures/AM_V30_Dil.png)
|
![[Uncaptioned image]](/html/2105.08115/assets/Figures/AM_V40_Dil.png)
|
![[Uncaptioned image]](/html/2105.08115/assets/Figures/AM_V50_Dil.png)
|
|
| c()=132.3 (+6.4) | c()=101.8 (+14.6) | c()=80.2 (+9.6) | |
|
Deposition Path |
![[Uncaptioned image]](/html/2105.08115/assets/Figures/AM_V30_Slice.png)
|
![[Uncaptioned image]](/html/2105.08115/assets/Figures/AM_V40_Slice.png)
|
![[Uncaptioned image]](/html/2105.08115/assets/Figures/AM_V50_Slice.png)
|
For a small amount of material, such as , the reference (Table 1), the size-constrained (Table 2) and the AM-constrained (Table 4) optimization problems generate similar topologies. However, for large volumes of material, the topologies can be very different and therein lies the benefit of the AM-constrained formulation. For example, for , the design presents zones where two material beads are placed next to each other to form a bulky zone. As the volume of material is increased in the design space, more parallel material beads merge, as shown in the fourth column of Table 4.
| mm | mm | mm | |
|
|
![[Uncaptioned image]](/html/2105.08115/assets/Figures/B_0.png)
|
![[Uncaptioned image]](/html/2105.08115/assets/Figures/B_1.png)
|
![[Uncaptioned image]](/html/2105.08115/assets/Figures/B_2.png)
|
|
, |
![[Uncaptioned image]](/html/2105.08115/assets/Figures/B_0_Skeleton.png)
|
![[Uncaptioned image]](/html/2105.08115/assets/Figures/B_1_Skeleton.png)
|
![[Uncaptioned image]](/html/2105.08115/assets/Figures/B_2_Skeleton.png)
|
|
Depos. Path |
![[Uncaptioned image]](/html/2105.08115/assets/Figures/B_0_Slice.png)
|
![[Uncaptioned image]](/html/2105.08115/assets/Figures/B_1_Slice.png)
|
![[Uncaptioned image]](/html/2105.08115/assets/Figures/B_2_Slice.png)
|
Table 5 shows three AM-constrained results obtained with varying nozzle sizes, and a volume fraction of . The Table includes the eroded designs superimposed on the optimized designs and the deposition path obtained with PrusaSlicer. Note that the deposition paths are obtained with a nozzle size , which places at least 2 parallel paths per solid member. If the deposition nozzle were chosen twice the size, i.e. , then each solid member would consist of at least one bead. In such a case, the eroded and intermediate fields could be read as the deposition trajectory, since due to the projection strategy, they are positioned exactly at the center of the design intended for manufacturing, as shown in the second row of Table 5. Therefore, the deposition path provided by the eroded or intermediate design is expected to leave fewer unfilled zones than the one proposed by PrusaSlicer.
An interesting observation can be made from the results depicted in Table 5, where the AM-constrained designs present material beads, at first sight, oriented with the major principal stress direction. Surely, this pattern is due to the compliance cost function that is evaluated for a single load case, yet, it might be beneficial when considering an orthotropic elasticity of the material bead, for instance, in the WAAM process (Laghi et al. 2020). This observation, however, is not addressed in this article, hence it is left open for future research.
As the design intended for manufacturing corresponds to a dilated one, it is not possible to guarantee the minimum size of the cavities in . In addition, the presence of small cavities can be a consequence of utilizing large material beads. Note that in practice it is difficult to achieve high accuracy in the material bead width for some LSAM processes, as for instance WAAM (Xia et al. 2020). In such instances, some dimensional uncertainty is present that could fill the voids present in the design. Such beneficial uncertainty could potentially be considered in the topology optimization formulation by using perturbation techniques on the length scale (Lazarov, Schevenels, and Sigmund 2012). This topic, however, is outside the scope of this work.
The approach that defines Method 2 is based on constraining the maximum size of a design and dilating it according to the prescribed deposition nozzle size. This results in a dilated design with improved printability, and in an eroded design that is placed at the center of the dilated members resembling a structural skeleton that can be interpreted as the deposition path. It should be noted that the structural skeleton is a by-product of constraining the intermediate design, and is not explicitly computed using edge detection algorithms (Zhou et al. 2015). This is the main advantage of the proposed Method 2 in comparison to other methods that could eventually be used for improving the printability of the designs, since, to date, the edge detection algorithms for topology optimization are not robust in the density method, mainly due to the fact that intermediate densities complicate boundary detection. For this reason, in the density method, length scale control algorithms based on the explicit calculation of the structural skeleton are applied almost at the end of the optimization process (Zhou et al. 2015), when the topology has already been defined, i.e. they operate as post-processing tools. That being said, Liu (2019) proposes a functional for level set topology optimization that allows to define a variable length scale within the design, which would also allow generation of designs adapted to the deposition nozzle, similar to Method 2. However, the cited method has not been validated in the density framework nor in 3D design domains, these two aspects being a major challenge for algorithms based on the explicit calculation of the skeleton. The following section demonstrates that the proposed Method 2 can be easily applied to 3D geometries, either considering AM processes with a fixed printing direction or with variable printing direction, such as AM processes assisted by robotic arms.
4 3D example and discussion
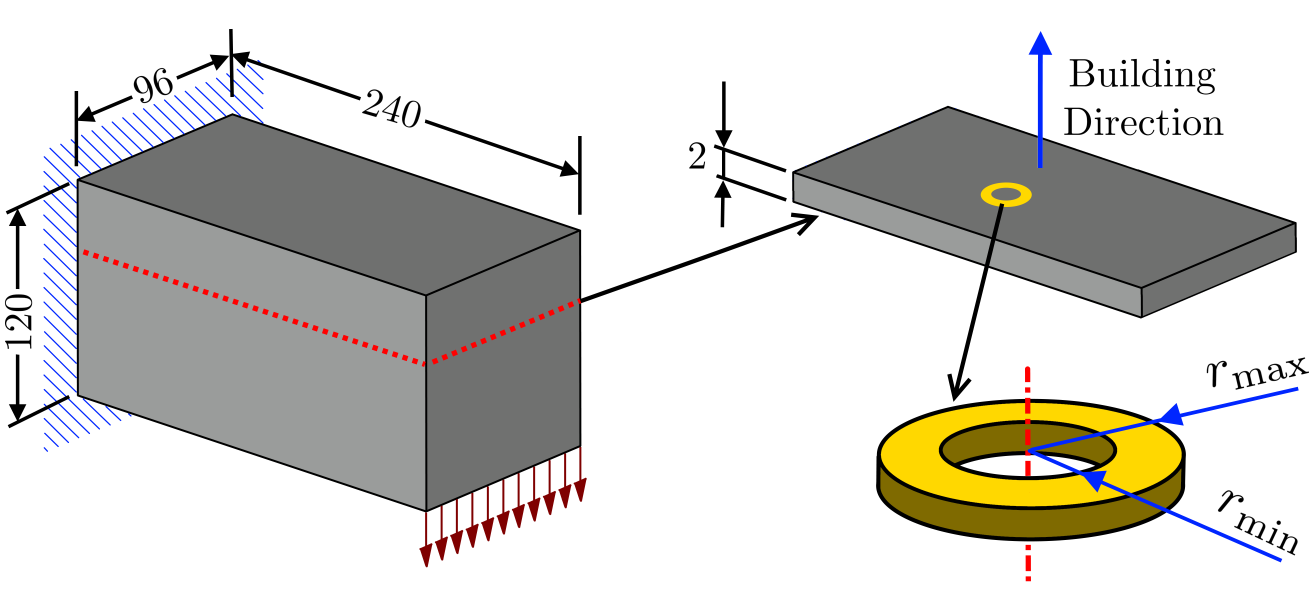
The two methods proposed in the previous sections were presented using a two-dimensional design case, where the deposition path is defined in a 2D plane. This section assesses and compares the methods using a three-dimensional design case. To this end, the cantilever beam shown in Fig. 10 is used. The design domain is discretized into 2.76 million cubic elements of 1 mm edge length. The optimized design is intended for an AM process equipped with a deposition nozzle of mm. It is assumed that the AM process generates layers orthogonal to the build direction, as shown in Fig. 10. In addition, it is assumed that each layer is 2 mm thick, so the final component is made up of 60 layers. As each layer of the optimized design must conform to the size of the deposition nozzle, the maximum size restriction is applied in the plane, as shown in Fig. 10.
As in the previous section, the finite element model considers an isotropic linear elastic behavior for both the deposited material and interlayer bond. Undoubtedly, this consideration may not be representative of some materials and LSAM processes, such as stainless steel in WAAM (Kyvelou et al. 2020), where material anisotropy should not be disregarded during topology optimization (Zhang, Liu, and To 2017). However, as this work focuses on the nozzle size constraint, we keep the material modeling part general assuming an isotropic behavior instead of using a specific anisotropic model (see, for instance, Jantos, Hackl, and Junker 2020).
| Reference | Max.-Size-Constrained | AM-Constrained | |
|
Sliced Design |
![[Uncaptioned image]](/html/2105.08115/assets/Figures/MinS_V15_Slice.png)
|
![[Uncaptioned image]](/html/2105.08115/assets/Figures/MaxS_2D_V15_Slice.png)
|
![[Uncaptioned image]](/html/2105.08115/assets/Figures/AM_2D_V15_Slice.png)
|
| c()=1.00 | c()=1.21 | c()=1.16 | |
|
Least filled |
![[Uncaptioned image]](/html/2105.08115/assets/Figures/T6_minS_1.png)
|
![[Uncaptioned image]](/html/2105.08115/assets/Figures/T6_MS_1.png)
|
![[Uncaptioned image]](/html/2105.08115/assets/Figures/T6_AM_1.png)
|
|
Layer: 45 , \scalerel* |
Layer: 57 , \scalerel* |
Layer: 2 , \scalerel* |
|
|
Most filled |
![[Uncaptioned image]](/html/2105.08115/assets/Figures/T6_minS_2.png)
|
![[Uncaptioned image]](/html/2105.08115/assets/Figures/T6_MS_2.png)
|
![[Uncaptioned image]](/html/2105.08115/assets/Figures/T6_AM_2.png)
|
|
Layer: 22 , \scalerel* |
Layer: 42 , \scalerel* |
Layer: 15 , \scalerel* |
|
| Representative Layers |
![[Uncaptioned image]](/html/2105.08115/assets/Figures/T6_minS_3.png)
|
![[Uncaptioned image]](/html/2105.08115/assets/Figures/T6_MS_3.png)
|
![[Uncaptioned image]](/html/2105.08115/assets/Figures/T6_AM_3.png)
|
|
Layer: 53 , \scalerel* |
Layer: 6 , \scalerel* |
Layer: 42 , \scalerel* |
|
![[Uncaptioned image]](/html/2105.08115/assets/Figures/T6_minS_4.png)
|
![[Uncaptioned image]](/html/2105.08115/assets/Figures/T6_MS_4.png)
|
![[Uncaptioned image]](/html/2105.08115/assets/Figures/T6_AM_4.png)
|
|
|
Layer: 6 , \scalerel* |
Layer: 24 , \scalerel* |
Layer: 30 , \scalerel* |
Three designs are reported, the Reference, the Maximum-size-constrained and the AM-constrained designs. The optimization problems are solved for a volume restriction of and with a minimum size of mm. The optimized results are sliced in PrusaSlicer, and the obtained deposition paths are shown in Table 6. The first row of the table shows the component after all the layers have been deposited and the averaged printability of all layers combined. The remaining rows show 4 selected layers and the associated deposition path. These layers correspond to the least filled, the most filled, and two representative of the average. The layers are shown inside the projected perimeter of the complete structure to provide guidance on the location of the layer with respect to the complete design.
From the printability indices of Table 6, it is clear that as in the 2D examples, the maximum-size-constrained design contains the least amount of unfilled zones. Also, since two material beads are placed per solid member width, no T-joints or path crossovers are obtained. In addition, due to the uniform size of the solid members, the size-constrained component resembles a design composed of walls of uniform width. As a number of AM processes are proficient in the production of walls, such as WAAM, it is expected that the size-restricted component will be the easiest to manufacture among the three reported designs.
The small unfilled gaps (1.1) in the maximum-size-constrained design are mainly zones where the local maximum-size constraint is violated, as those pointed out by arrows in Table 6. This drawback caused by the smoothed aggregation function could be reduced, but not completely eliminated, by using a finer mesh or larger aggregation exponents (Fernández et al. 2019), i.e. at the cost of increasing computational expense. Another approach to improve printability is to post-process the optimized designs using the geometric constraints proposed by Zhou et al. (2015), which, in our experience, enforce length scale more strictly.
Although the size-constrained design is the best candidate for manufacturing, it exhibits the lowest performance, since the maximum size restriction prevents bulky zones that are required to increase the structural stiffness. This could be even more detrimental in applications involving stress or fatigue constraints (Collet, Bruggi, and Duysinx 2017). Therefore, it is expected that for cases involving mechanical constraints, the AM-constrained problem will be a better choice for yielding high performance designs suitable for AM processes equipped with large deposition nozzles.
It was observed in the 2D examples that the eroded and intermediate designs can be interpreted as the structural skeleton or the deposition paths in the AM-constrained formulation. To illustrate this in the 3D design case, Table 7 shows the AM-design and 3 representative layers of the component. Each layer displays the eroded design in red and the AM layer in yellow. The table contains 3 optimized solutions obtained with the same nozzle size but with different volume restriction.
|
|
![[Uncaptioned image]](/html/2105.08115/assets/Figures/AM_2D_V15.png)
|
![[Uncaptioned image]](/html/2105.08115/assets/Figures/AM_2D_V20.png)
|
![[Uncaptioned image]](/html/2105.08115/assets/Figures/AM_2D_V30.png)
|
|
Layer 2 |
![[Uncaptioned image]](/html/2105.08115/assets/Figures/AM_2D_V15_L1.png)
|
![[Uncaptioned image]](/html/2105.08115/assets/Figures/AM_2D_V20_L1.png)
|
![[Uncaptioned image]](/html/2105.08115/assets/Figures/AM_2D_V30_L1.png)
|
|
Layer 20 |
![[Uncaptioned image]](/html/2105.08115/assets/Figures/AM_2D_V15_L2.png)
|
![[Uncaptioned image]](/html/2105.08115/assets/Figures/AM_2D_V20_L2.png)
|
![[Uncaptioned image]](/html/2105.08115/assets/Figures/AM_2D_V30_L2.png)
|
|
Layer 40 |
![[Uncaptioned image]](/html/2105.08115/assets/Figures/AM_2D_V15_L3.png)
|
![[Uncaptioned image]](/html/2105.08115/assets/Figures/AM_2D_V20_L3.png)
|
![[Uncaptioned image]](/html/2105.08115/assets/Figures/AM_2D_V30_L3.png)
|
From the eroded design it is rather intuitive to conceive a deposition path for the layer shown in Table 7. However, there are some places that could hinder the path interpretation, as those pointed out by arrows in the Layer 2 depicted in Table 7. These places are in violation of the local volume restriction that imposes the maximum size and, therefore, it is not possible to ensure that these zones will be filled during the LSAM process. Due to these zones in conflict with the local maximmum size restriction, the optimized design will likely need to be post-processed to conform these details to the resolution of LSAM process, for instance, using more strict geometric constraints on the optimized designs (Zhou et al. 2015).
| Maximum-Size-Constrained | AM-Constrained | |
|
Optimized Design |
![[Uncaptioned image]](/html/2105.08115/assets/Figures/MS_Front_Dil.png)
|
![[Uncaptioned image]](/html/2105.08115/assets/Figures/AM_Front_Dil.png)
|
| c()=1.15 | c()=1.08 | |
|
|
![[Uncaptioned image]](/html/2105.08115/assets/Figures/MS_Front_Ero.png)
|
![[Uncaptioned image]](/html/2105.08115/assets/Figures/AM_Front_Ero.png)
|
|
Section A-A |
![[Uncaptioned image]](/html/2105.08115/assets/Figures/MS_A_A.png)
|
![[Uncaptioned image]](/html/2105.08115/assets/Figures/AM_A_A.png)
|
|
Section B-B |
![[Uncaptioned image]](/html/2105.08115/assets/Figures/MS_B_B.png)
|
![[Uncaptioned image]](/html/2105.08115/assets/Figures/AM_B_B.png)
|
|
Section C-C |
![[Uncaptioned image]](/html/2105.08115/assets/Figures/MS_C_C.png)
|
![[Uncaptioned image]](/html/2105.08115/assets/Figures/AM_C_C.png)
|
|
Section D-D |
![[Uncaptioned image]](/html/2105.08115/assets/Figures/MS_D_D.png)
|
![[Uncaptioned image]](/html/2105.08115/assets/Figures/AM_D_D.png)
|
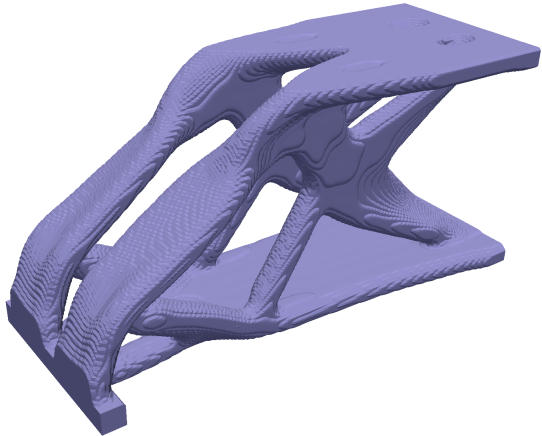
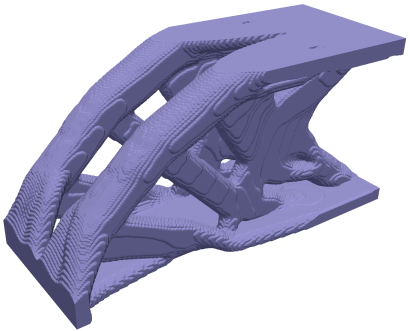
Notably, the 3D examples shown in this section assume a fixed printing direction. Nevertheless, there are Large-Scale AM processes that are able to change the stacking direction of the layers, either by the rotation of the baseplate or of the deposition tool. Interestingly, the methods proposed in this paper can be easily adapted to such processes. For this purpose, the local region where the maximum size restriction is evaluated should be defined as a sphere instead of a two-dimensional disk, as presented in (Fernández et al. 2020). For instance, Fig. 11 shows the size-constrained and AM-constrained designs obtained by using a spherical region. The volume constraint is set as and the length scale is defined identical to the previous examples. The inner details of these designs are summarized in Table 8. The first row of the table contains the optimized designs and the sections planes that display the working layer. The second row shows the eroded design and the printing direction devised intuitively. The remaining rows display the sections, where the eroded design is shown in red and the cross-section in yellow.
The designs in Table 8 are considerably different from their counterparts obtained with a fixed vertical printing direction (Table 6). The designs having the printing direction freedom possess two thick bars at the loaded side (see also Figure 11) that connect the upper part of the design with the load transmission zone. These bars are also present in the reference design (Table 6), which would explain the high performance of these solutions (Table 8) with respect to those obtained using a fixed building orientation (Table 6). Interestingly, these two curved bars present in the designs of Table 8 possess different geometry depending on the formulation used. As can be seen in section D-D, these bars are flat in the size-constrained design, while they are round in the AM-constrained design. Although both geometries are suited to the size of the deposition nozzle, the round bar offers a higher area moment of inertia and hence a higher bending stiffness.
As before with the fixed printing direction, the AM-constrained design shows better performance than the maximum-size constrained one, presumably because it allows thicker members where this is beneficial.
5 Other test cases and TO problems
The proposed Method 2, based on dilating a design constrained in maximum size, was introduced in Eq. (14) using the compliance minimization problem subject to a volume constraint. This formulation was chosen for the sake of simplicity, but in fact, Method 2 is applicable to any topology optimization problem where the maximum size constraint (Eq. (9)) has been validated. Moreover, in our experience, the maximum size constraint, and hence Method 2, can be applied in most of fields where the robust formulation based on the eroded, intermediate and dilated designs has been implemented. For the sake of demonstration, in this section we therefore present results of other topology optimization problems.
In the following, the proposed Method 2 is considered under compliance minimization subject to a volume and stress constraints. The topology optimization problem can be written as:
| (22) | ||||
where represents the equivalent Von Mises stress computed in the dilated field and is the user-defined stress limit. The max() function is computed using a p-mean approximation, following exactly the same implementation as Verbart, Langelaar, and Van Keulen (2017). The equivalent Von Mises stress of the dilated field is computed as described in (da Silva, Beck, and Sigmund 2019). For the sake of brevity, we omit the numerous equations defining the stress constraint and interested readers are referred to the cited works.
The classical L-beam with a volume constraint of is considered. For this test case, three topology optimization problems are solved, the reference (Eq. 6), the AM-constrained (Eq. 14), and the AM-stress-constrained one (Eq. 22). In the latter, the imposed stress limit () is 0.8 times the maximum stress computed in the reference design. The three optimized designs are shown in the first row of Table 9.
| Reference | AM-Constrained | AM-Stress-Constr. | |
|
Optimized Design |
![[Uncaptioned image]](/html/2105.08115/assets/Figures/LShape_Ref.png)
|
![[Uncaptioned image]](/html/2105.08115/assets/Figures/LShape_Ref_AM.png)
|
![[Uncaptioned image]](/html/2105.08115/assets/Figures/LShape_AMStress.png)
|
| c()=1.00, max()=1.00 | c()=1.09, max()=1.01 | c()=1.24, max()=0.86 | |
|
Stress field |
![[Uncaptioned image]](/html/2105.08115/assets/Figures/LShape_Ref_Stress.png)
|
![[Uncaptioned image]](/html/2105.08115/assets/Figures/LShape_Ref_AM_Stress.png)
|
![[Uncaptioned image]](/html/2105.08115/assets/Figures/LShape_AMStress_Stress.png)
|
|
and Design field |
![[Uncaptioned image]](/html/2105.08115/assets/Figures/LShape_Ref_Path_1.png)
|
![[Uncaptioned image]](/html/2105.08115/assets/Figures/LShape_Ref_AM_Path_1.png)
|
![[Uncaptioned image]](/html/2105.08115/assets/Figures/LShape_AMStress_Path_1.png)
|
| Perimeter path |
![[Uncaptioned image]](/html/2105.08115/assets/Figures/LShape_Ref_Path_2.png)
|
![[Uncaptioned image]](/html/2105.08115/assets/Figures/LShape_Ref_AM_Path_2.png)
|
![[Uncaptioned image]](/html/2105.08115/assets/Figures/LShape_AMStress_Path_2.png)
|
The two AM-constrained results in Table 9 (second and third columns) clearly reach the intended purpose, which is the production of designs adapted to the deposition nozzle size. In addition, in such designs, the eroded field can be interpreted as the deposition path, as shown in the third row of Table 9. However, the introduction of stress constraints produces a different arrangement of material beads. The stress-constrained design places the material beads mostly around the vicinity of the L-beam curvature, which, along with the smooth curvature of the design, reduces the maximum stresses in the structure compared to the other two designs. This solution demonstrates the feasibility of implementing the proposed Method 2 in problems involving stress constraints.
Although the combination of Method 2 with stress constraints is demonstrated, there are still aspects that can be improved. For example, it can be seen that the AM-stress-constrained design does not accurately meet the imposed stress constraint. This is probably due to the p-mean function, which underestimates the maximum stress value for the sake of a differentiable approximation, therefore other relaxation strategies should be examined (da Silva, Beck, and Sigmund 2019). Also, observations regarding small gaps in the deposition paths hold as before, which could result in potential stress concentrations. A more in-depth study of these aspects is identified as a direction for future research.
To close this section, we include results for the well-known force inverter benchmark test. The AM-constrained formulation of the force inverter can be written as follows:
| (23) | ||||
where represents the output displacement of the corresponding design (considered negative due to the adopted reference system). The force inverter is modeled under linear elasticity, as is done in many other works in the literature (Sigmund 1997; Bendsoe and Sigmund 2004), so further formulation and implementation details are omitted for the sake of brevity and the reader is referred to the cited works.
| Reference | Size-Constrained | AM-Constrained. | |
|
Design |
![[Uncaptioned image]](/html/2105.08115/assets/Figures/FI_Ref.png)
|
![[Uncaptioned image]](/html/2105.08115/assets/Figures/FI_MS.png)
|
![[Uncaptioned image]](/html/2105.08115/assets/Figures/FI_AM.png)
|
| c()= 1.00 | c()= 0.94 | c()= 0.97 | |
|
and Design |
![[Uncaptioned image]](/html/2105.08115/assets/Figures/FI_Ref_Ero.png)
|
![[Uncaptioned image]](/html/2105.08115/assets/Figures/FI_MS_Ero.png)
|
![[Uncaptioned image]](/html/2105.08115/assets/Figures/FI_AM_Ero.png)
|
| perimeter path |
![[Uncaptioned image]](/html/2105.08115/assets/Figures/FI_Ref_Path_2.png)
|
![[Uncaptioned image]](/html/2105.08115/assets/Figures/FI_MS_Path_2.png)
|
![[Uncaptioned image]](/html/2105.08115/assets/Figures/FI_AM_Path_2.png)
|
Here, once again, the reference, the maximum size-constrained, and the AM-constrained problems are solved. The force inverter design solutions for a volume contraint of are sumarized in Table 10, along with the eroded fields and the deposition paths (note that due to symmetry, only half the domain is modeled). These results exhibit the same pattern observed in previous examples, namely, the maximum size-constrained design achieves better printability than the reference design by improving conformability to the width of the material beads. However, the maximum size constraint could introduce a significant performance reduction, as it provides low design flexibility by imposing a uniform size of solid members throughout the design. On the other hand, the AM constrained design besides providing a good printability, offers more design flexibility since it allows the creation of voluminous zones that improve performance. In addition, as a by-product, Method 2 yields an eroded design that can be interpreted as the deposition path.
6 Conclusions and Perspectives
This work aims to propose topology-optimized designs suitable to Large-Scale Additive Manufacturing (LSAM) processes. The design limitation considered here is the small resolution of LSAM processes resulting from depositing large volumes of material to reduce printing time. The process resolution, which is typically defined by the size of the deposition nozzle, is introduced in the topology optimization problem through a geometric control of structural features. Specifically, two methods based on minimum and maximum size control have been proposed. The first method imposes the minimum and maximum size of the solid members in proportion to the size of the deposition nozzle. This results in designs with structural features of uniform width, which matches a discrete number of material beads arranged in a parallel fashion. The method has been evaluated in 2D and 3D design spaces, showing the capability to produce optimized designs with improved manufacturability. Interestingly, when a fixed building orientation is chosen for a 3D design problem, the method generates structures composed of walls, which are suited for fabrication by most LSAM processes. However, this method can lead to substantial reduction of performance due to the splitting of structural members as enforced by the maximum size restriction. The second method instead dilates a maximum-size constrained design which, due to a specific choice of length scales, resembles a structural skeleton or the deposition path. The dilation operation of this skeleton produces a design tailored to the deposition nozzle size, allowing for an efficient arrangement of the material beads within the design domain. Numerical results indicate that this second approach also produces designs that conform to the specified resolution, and, in addition, it comes with a lesser performance reduction compared to the first method. This is caused by the fact that the second method allows for thicker members to be created using parallel beads, in regions where this is beneficial.
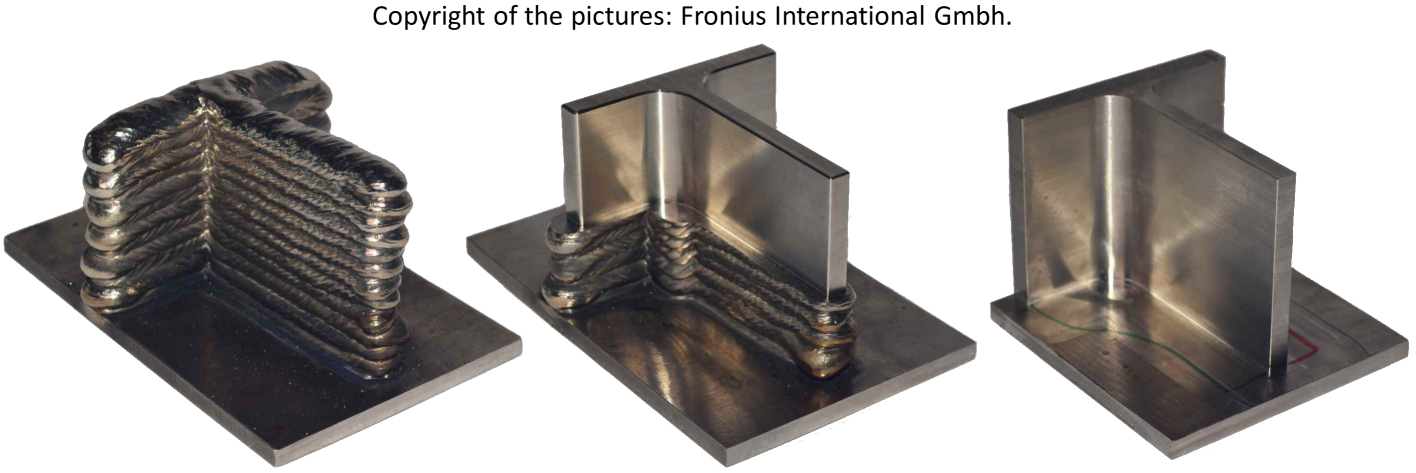
In light of the numerous design guidelines that must be taken into account when designing for LSAM, it is reasonable to think of combining the proposed topology optimization methods with others existing in the literature. For example, the 3D designs obtained for a fixed printing direction (Table 7) could be difficult to manufacture with certain LSAM processes due to the presence of extreme overhang angles. When the use of additional support structures is not considered or feasible, the introduction of overhang angle constraints (Langelaar 2016) in the topology optimization problem could be considered. Also, depending on the application, it may be necessary to post-machine a component manufactured by WAAM for instance, to improve surface finish and mechanical performance. As illustrated in Fig. 12, the post-machining operation slims the WAAM component, similar to an erosion process of the robust formulation. Therefore, it is likely feasible to consider post-processing in the adopted formulation. Certainly, the access of the machining tool should also be considered, as in the topology optimization methods presented in (Li et al. 2016; Langelaar 2019; Gaynor and Johnson 2020). These ideas and the combination of the proposed methods with other Topology Optimization methods are subjects of future research.
Acknowledgements
The corresponding author acknowledges the research project FAFil (Fabrication Additive laser par dépôt de Fil ), funded by INTERREG V A Grande Région and the European Regional Development Fund (ERDF). Computational resources have been provided by the Consortium des Équipements de Calcul Intesif (CÉCI), funded by the Scientific Research Fund of Belgium (F.R.S.-FNRS)
References
- Aage, Andreassen, and Lazarov (2015) Aage, Niels, Erik Andreassen, and Boyan Stefanov Lazarov. 2015. “Topology optimization using PETSc: An easy-to-use, fully parallel, open source topology optimization framework.” Structural and Multidisciplinary Optimization 51 (3): 565–572.
- Allaire and Jakabčin (2018) Allaire, Grégoire, and Lukas Jakabčin. 2018. “Taking into account thermal residual stresses in topology optimization of structures built by additive manufacturing.” Mathematical Models and Methods in Applied Sciences 28 (12): 2313–2366.
- Amir and Lazarov (2018) Amir, Oded, and Boyan S Lazarov. 2018. “Achieving stress-constrained topological design via length scale control.” Structural and Multidisciplinary Optimization 58 (5): 2053–2071.
- Andreassen et al. (2011) Andreassen, Erik, Anders Clausen, Mattias Schevenels, Boyan S Lazarov, and Ole Sigmund. 2011. “Efficient topology optimization in MATLAB using 88 lines of code.” Structural and Multidisciplinary Optimization 43 (1): 1–16.
- Arora and Wang (2005) Arora, JS, and Q Wang. 2005. “Review of formulations for structural and mechanical system optimization.” Structural and Multidisciplinary Optimization 30 (4): 251–272.
- Bajaj et al. (2020) Bajaj, Priyanshu, Avinash Hariharan, Anoop Kini, Philipp Kürnsteiner, Dierk Raabe, and Eric Aimé Jägle. 2020. “Steels in additive manufacturing: A review of their microstructure and properties.” Materials Science and Engineering: A 772: 138633.
- Bendsøe (1989) Bendsøe, Martin P. 1989. “Optimal shape design as a material distribution problem.” Structural optimization 1 (4): 193–202.
- Bendsøe and Kikuchi (1988) Bendsøe, Martin Philip, and Noboru Kikuchi. 1988. “Generating optimal topologies in structural design using a homogenization method.” Computer methods in applied mechanics and engineering 71 (2): 197–224.
- Bendsoe and Sigmund (2004) Bendsoe, Martin Philip, and Ole Sigmund. 2004. Topology optimization: theory, methods, and applications. Springer Science & Business Media.
- Bishop and Leigh (2020) Bishop, Elizabeth Grace, and Simon James Leigh. 2020. “Using Large-Scale Additive Manufacturing (LSAM) as a Bridge Manufacturing Process in Response to Shortages in PPE During the COVID-19 Outbreak.” International Journal of Bioprinting 6 (4).
- Bourdin (2001) Bourdin, Blaise. 2001. “Filters in topology optimization.” International journal for numerical methods in engineering 50 (9): 2143–2158.
- Bruns and Tortorelli (2001) Bruns, Tyler E, and Daniel A Tortorelli. 2001. “Topology optimization of non-linear elastic structures and compliant mechanisms.” Computer methods in applied mechanics and engineering 190 (26-27): 3443–3459.
- Carstensen (2020) Carstensen, Josephine V. 2020. “Topology optimization with nozzle size restrictions for material extrusion-type additive manufacturing.” https://doi.org/10.1007/s00158-020-02620-5.
- Collet, Bruggi, and Duysinx (2017) Collet, Maxime, Matteo Bruggi, and Pierre Duysinx. 2017. “Topology optimization for minimum weight with compliance and simplified nominal stress constraints for fatigue resistance.” Structural and Multidisciplinary Optimization 55 (3): 839–855.
- Comminal et al. (2019) Comminal, Raphael, Marcin P Serdeczny, David B Pedersen, and Jon Spangenberg. 2019. “Motion planning and numerical simulation of material deposition at corners in extrusion additive manufacturing.” Additive Manufacturing 29: 100753.
- Culmone, Smit, and Breedveld (2019) Culmone, Costanza, Gerwin Smit, and Paul Breedveld. 2019. “Additive manufacturing of medical instruments: A state-of-the-art review.” Additive Manufacturing 27: 461–473.
- da Silva, Beck, and Sigmund (2019) da Silva, Gustavo Assis, André Teófilo Beck, and Ole Sigmund. 2019. “Stress-constrained topology optimization considering uniform manufacturing uncertainties.” Computer Methods in Applied Mechanics and Engineering 344: 512–537.
- Ding et al. (2015) Ding, Donghong, Zengxi Pan, Dominic Cuiuri, and Huijun Li. 2015. “A practical path planning methodology for wire and arc additive manufacturing of thin-walled structures.” Robotics and Computer-Integrated Manufacturing 34: 8–19.
- Fernández et al. (2019) Fernández, Eduardo, Maxime Collet, Pablo Alarcón, Simon Bauduin, and Pierre Duysinx. 2019. “An aggregation strategy of maximum size constraints in density-based topology optimization.” Structural and Multidisciplinary Optimization 60 (5): 2113–2130.
- Fernández et al. (2020) Fernández, Eduardo, Kai-ke Yang, Stijn Koppen, Pablo Alarcón, Simon Bauduin, and Pierre Duysinx. 2020. “Imposing minimum and maximum member size, minimum cavity size, and minimum separation distance between solid members in topology optimization.” Computer Methods in Applied Mechanics and Engineering 368: 113157.
- Fu et al. (2019) Fu, Yun-Fei, Bernard Rolfe, Louis NS Chiu, Yanan Wang, Xiaodong Huang, and Kazem Ghabraie. 2019. “Design and experimental validation of self-supporting topologies for additive manufacturing.” Virtual and Physical Prototyping 14 (4): 382–394.
- Gaynor and Guest (2016) Gaynor, Andrew T, and James K Guest. 2016. “Topology optimization considering overhang constraints: Eliminating sacrificial support material in additive manufacturing through design.” Structural and Multidisciplinary Optimization 54 (5): 1157–1172.
- Gaynor and Johnson (2020) Gaynor, Andrew T, and Terrence E Johnson. 2020. “Eliminating occluded voids in additive manufacturing design via a projection-based topology optimization scheme.” Additive Manufacturing 101149.
- Geng et al. (2017) Geng, Haibin, Jinglong Li, Jiangtao Xiong, Xin Lin, and Fusheng Zhang. 2017. “Geometric limitation and tensile properties of wire and arc additive manufacturing 5A06 aluminum alloy parts.” Journal of Materials Engineering and Performance 26 (2): 621–629.
- Greer et al. (2019) Greer, Clayton, Andrzej Nycz, Mark Noakes, Brad Richardson, Brian Post, Thomas Kurfess, and Lonnie Love. 2019. “Introduction to the design rules for metal big area additive manufacturing.” Additive manufacturing 27: 159–166.
- Guest (2009) Guest, James K. 2009. “Topology optimization with multiple phase projection.” Computer Methods in Applied Mechanics and Engineering 199 (1-4): 123–135.
- Guest (2015) Guest, James K. 2015. “Optimizing the layout of discrete objects in structures and materials: a projection-based topology optimization approach.” Computer Methods in Applied Mechanics and Engineering 283: 330–351.
- Guest, Prévost, and Belytschko (2004) Guest, James K, Jean H Prévost, and Ted Belytschko. 2004. “Achieving minimum length scale in topology optimization using nodal design variables and projection functions.” International journal for numerical methods in engineering 61 (2): 238–254.
- Jackson (2016) Jackson, Beau. 2016. “3D Printing Industry.” Accessed: 2020-03-21, https://3dprintingindustry.com/tags/3d-printed-metal/.
- Jantos, Hackl, and Junker (2020) Jantos, Dustin R, Klaus Hackl, and Philipp Junker. 2020. “Topology optimization with anisotropic materials, including a filter to smooth fiber pathways.” Structural and Multidisciplinary Optimization 1–20.
- Jiang and Ma (2020) Jiang, Jingchao, and Yongsheng Ma. 2020. “Path Planning Strategies to Optimize Accuracy, Quality, Build Time and Material Use in Additive Manufacturing: A Review.” Micromachines 11 (7): 633.
- Kyvelou et al. (2020) Kyvelou, Pinelopi, Harry Slack, Dafni Daskalaki Mountanou, M Ahmer Wadee, T Ben Britton, Craig Buchanan, and Leroy Gardner. 2020. “Mechanical and microstructural testing of wire and arc additively manufactured sheet material.” Materials & Design 192: 108675.
- Laghi et al. (2020) Laghi, Vittoria, Michele Palermo, Giada Gasparini, Valentina Alena Girelli, and Tomaso Trombetti. 2020. “Experimental results for structural design of Wire-and-Arc Additive Manufactured stainless steel members.” Journal of Constructional Steel Research 167: 105858.
- Langelaar (2016) Langelaar, Matthijs. 2016. “Topology optimization of 3D self-supporting structures for additive manufacturing.” Additive Manufacturing 12: 60–70.
- Langelaar (2018) Langelaar, Matthijs. 2018. “Combined optimization of part topology, support structure layout and build orientation for additive manufacturing.” Structural and Multidisciplinary Optimization 57 (5): 1985–2004.
- Langelaar (2019) Langelaar, Matthijs. 2019. “Topology optimization for multi-axis machining.” Computer Methods in Applied Mechanics and Engineering 351: 226–252.
- Lazarov, Schevenels, and Sigmund (2012) Lazarov, Boyan Stefanov, Mattias Schevenels, and Ole Sigmund. 2012. “Topology optimization with geometric uncertainties by perturbation techniques.” International Journal for Numerical Methods in Engineering 90 (11): 1321–1336.
- Li et al. (2019) Li, Neng, Shuai Huang, Guodong Zhang, Renyao Qin, Wei Liu, Huaping Xiong, Gongqi Shi, and Jon Blackburn. 2019. “Progress in additive manufacturing on new materials: A review.” Journal of Materials Science & Technology 35 (2): 242–269.
- Li et al. (2016) Li, Quhao, Wenjiong Chen, Shutian Liu, and Liyong Tong. 2016. “Structural topology optimization considering connectivity constraint.” Structural and Multidisciplinary Optimization 54 (4): 971–984.
- Lim et al. (2012) Lim, Sungwoo, Richard A Buswell, Thanh T Le, Simon A Austin, Alistair GF Gibb, and Tony Thorpe. 2012. “Developments in construction-scale additive manufacturing processes.” Automation in construction 21: 262–268.
- Liu et al. (2020) Liu, HH, T Zhao, LY Li, WJ Liu, TQ Wang, and JF Yue. 2020. “A path planning and sharp corner correction strategy for wire and arc additive manufacturing of solid components with polygonal cross-sections.” The International Journal of Advanced Manufacturing Technology 106 (11): 4879–4889.
- Liu (2019) Liu, Jikai. 2019. “Piecewise length scale control for topology optimization with an irregular design domain.” Computer Methods in Applied Mechanics and Engineering 351: 744–765.
- Liu et al. (2018) Liu, Jikai, Andrew T Gaynor, Shikui Chen, Zhan Kang, Krishnan Suresh, Akihiro Takezawa, Lei Li, et al. 2018. “Current and future trends in topology optimization for additive manufacturing.” Structural and Multidisciplinary Optimization 57 (6): 2457–2483.
- Mehnen et al. (2014) Mehnen, Jorn, Jialuo Ding, Helen Lockett, and Panos Kazanas. 2014. “Design study for wire and arc additive manufacture.” International Journal of Product Development 19 (1/2/3): 2–20.
- Meng et al. (2019) Meng, Liang, Weihong Zhang, Dongliang Quan, Guanghui Shi, Lei Tang, Yuliang Hou, Piotr Breitkopf, Jihong Zhu, and Tong Gao. 2019. “From topology optimization design to additive manufacturing: Today’s success and tomorrow’s roadmap.” Archives of Computational Methods in Engineering 1–26.
- Pellens et al. (2019) Pellens, Jeroen, Geert Lombaert, Boyan Lazarov, and Mattias Schevenels. 2019. “Combined length scale and overhang angle control in minimum compliance topology optimization for additive manufacturing.” Structural and Multidisciplinary Optimization 59 (6): 2005–2022.
- Prša (2020) Prša, Josef. 2020. “Prusaslicer software.” Accessed: 2020-06-28, https://www.prusa3d.com/prusaslicer/.
- Qian and Sigmund (2013) Qian, Xiaoping, and Ole Sigmund. 2013. “Topological design of electromechanical actuators with robustness toward over-and under-etching.” Computer Methods in Applied Mechanics and Engineering 253: 237–251.
- Rodrigues et al. (2019) Rodrigues, Tiago A, V Duarte, RM Miranda, Telmo G Santos, and JP Oliveira. 2019. “Current status and perspectives on wire and arc additive manufacturing (WAAM).” Materials 12 (7): 1121.
- Sigmund (1997) Sigmund, Ole. 1997. “On the design of compliant mechanisms using topology optimization.” Journal of Structural Mechanics 25 (4): 493–524.
- Sigmund (2009) Sigmund, Ole. 2009. “Manufacturing tolerant topology optimization.” Acta Mechanica Sinica 25 (2): 227–239.
- Sigmund and Petersson (1998) Sigmund, Ole, and Joakim Petersson. 1998. “Numerical instabilities in topology optimization: a survey on procedures dealing with checkerboards, mesh-dependencies and local minima.” Structural optimization 16 (1): 68–75.
- Svanberg (1987) Svanberg, Krister. 1987. “The method of moving asymptotes—a new method for structural optimization.” International journal for numerical methods in engineering 24 (2): 359–373.
- Tino et al. (2020) Tino, Rance, Martin Leary, Adam Yeo, Elizabeth Kyriakou, Tomas Kron, and Milan Brandt. 2020. “Additive manufacturing in radiation oncology: a review of clinical practice, emerging trends and research opportunities.” International Journal of Extreme Manufacturing 2 (1): 012003.
- Trillet, Duysinx, and Fernández (2021) Trillet, Denis, Pierre Duysinx, and Eduardo Fernández. 2021. “Analytical relationships for imposing minimum length scale in the robust Topology Optimization formulation.” arXiv preprint arXiv:2101.08605 .
- van de Ven et al. (2020) van de Ven, Emiel, Robert Maas, Can Ayas, Matthijs Langelaar, and Fred van Keulen. 2020. “Overhang control based on front propagation in 3D topology optimization for additive manufacturing.” Computer Methods in Applied Mechanics and Engineering 369: 113169.
- Vantyghem et al. (2020) Vantyghem, Gieljan, Wouter De Corte, Emad Shakour, and Oded Amir. 2020. “3D printing of a post-tensioned concrete girder designed by topology optimization.” Automation in Construction 112: 103084.
- Venturini et al. (2016) Venturini, Giuseppe, Filippo Montevecchi, Antonio Scippa, and Gianni Campatelli. 2016. “Optimization of WAAM deposition patterns for T-crossing features.” Procedia CIRP 55: 95–100.
- Verbart, Langelaar, and Van Keulen (2017) Verbart, Alexander, Matthijs Langelaar, and Fred Van Keulen. 2017. “A unified aggregation and relaxation approach for stress-constrained topology optimization.” Structural and Multidisciplinary Optimization 55 (2): 663–679.
- Wang and Qian (2020) Wang, Cunfu, and Xiaoping Qian. 2020. “Simultaneous optimization of build orientation and topology for additive manufacturing.” Additive Manufacturing 101246.
- Wang, Lazarov, and Sigmund (2011) Wang, Fengwen, Boyan Stefanov Lazarov, and Ole Sigmund. 2011. “On projection methods, convergence and robust formulations in topology optimization.” Structural and Multidisciplinary Optimization 43 (6): 767–784.
- Xia et al. (2020) Xia, Chunyang, Zengxi Pan, Shiyu Zhang, Huijun Li, Yanling Xu, and Shanben Chen. 2020. “Model-free adaptive iterative learning control of melt pool width in wire arc additive manufacturing.” The International Journal of Advanced Manufacturing Technology 110 (7): 2131–2142.
- Yu et al. (2020) Yu, Huangchao, Huajie Hong, Su Cao, and Rafiq Ahmad. 2020. “Topology optimization for multipatch fused deposition modeling 3D printing.” Applied Sciences 10 (3): 943.
- Zhang and Cheng (2020) Zhang, Kaiqing, and Gengdong Cheng. 2020. “Three-dimensional high resolution topology optimization considering additive manufacturing constraints.” Additive Manufacturing 101224.
- Zhang, Liu, and To (2017) Zhang, Pu, Jikai Liu, and Albert C To. 2017. “Role of anisotropic properties on topology optimization of additive manufactured load bearing structures.” Scripta Materialia 135: 148–152.
- Zhou et al. (2015) Zhou, Mingdong, Boyan S Lazarov, Fengwen Wang, and Ole Sigmund. 2015. “Minimum length scale in topology optimization by geometric constraints.” Computer Methods in Applied Mechanics and Engineering 293: 266–282.
- Zhu, Zhang, and Xia (2016) Zhu, Ji-Hong, Wei-Hong Zhang, and Liang Xia. 2016. “Topology optimization in aircraft and aerospace structures design.” Archives of Computational Methods in Engineering 23 (4): 595–622.