Optical and NIR spectroscopy of cool CEMP stars to probe the nucleosynthesis in low mass AGB binary system
Abstract
We present the abundance analyses of 7 Carbon enhanced metal-poor (CEMP) stars to understand the origin of carbon in them. We used high-resolution optical spectra to derive abundances of various elements. We also used low-resolution Near-Infrared (NIR) spectra to derive the abundance of O and 12C/13C from the CO molecular band and compared their values with those derived from high-resolution optical spectra. We identified a good agreement between the values. Thus, in cool CEMP stars, the NIR observations complement the high-resolution optical observations to derive the oxygen abundance and the 12C/13C ratio. This enables us to probe fainter cool CEMP stars using NIR spectroscopy. C, N, O abundances of all the program stars in this study show abundances that are consistent with binary mass transfer from a low-mass low-metallicity Asymptotic Giant Branch (AGB) companion which is further supported by the presence of enhancement in neutron-capture elements and detection of radial velocity variation. One of the stars show abundance patterns similar to a CEMP- star whereas the abundance pattern of the rest of the stars satisfy the criteria required to classify them as CEMP- stars. The sub-classification of some of the stars studied here is revisited. The abundance of neutron-capture elements in these CEMP- stars resembles to that of -process models where proton ingestion episodes in the companion low-mass low-metallicity AGB stars produce the necessary neutron density required for the onset of -process.
keywords:
CEMP-- AGB companion – -process– NIR spectroscopy1 Introduction
Spectroscopic studies of metal-poor stars identified from early large surveys like Hamburg/ESO survey and HK survey brought out the fact that a significant fraction of
Galactic halo stars exhibit strong enhancement in carbon with [C/Fe] +0.7 111The abundance of one element with respect to another is expressed by the comparison of their ratios with respect to the sun and is indicated as, [A/B] = log, where NA and NB are the number densities of elements A and B and * and denote the stellar and solar values.(Beers
et al., 1992; Christlieb et al., 2001; Aoki et al., 2007; Yanny
et al., 2009).
The fraction of so called carbon enhanced metal-poor [CEMP] stars increases with
decreasing metallicity (Lucatello
et al., 2005, 2006; Aoki et al., 2007; Aoki
et al., 2013; Yong
et al., 2013; Placco et al., 2014)
and it is of great interest due to their high carbon abundance and the sizable fraction in the low-metallicity regime.
Various follow-up studies have revealed that these CEMP stars also show peculiar elemental abundance pattern along with the strong over abundance in C. Based on these peculiar abundance pattern, CEMP stars are broadly classified
into two categories (Beers &
Christlieb, 2005; Jonsell
et al., 2006; Aoki et al., 2007; Masseron et al., 2010); one shows over abundance of neutron capture elements including the elements from slow neutron-capture process (-process) or/and rapid neutron-capture (-process) process (CEMP-,CEMP-, CEMP-) and other does not
show any enhancement in neutron capture elements (CEMP-).
Among the CEMP population, CEMP- sub-class constitutes around 80% of the population in the metal-rich end (Aoki et al., 2007; Hansen
et al., 2016b, based on their sample of 40 stars altogether) and multi-epoch
observations of these stars reported that
majority of stars in the CEMP- class are members
of binary systems (Lucatello
et al., 2005; Starkenburg et al., 2014). This favors the idea of mass transfer from a companion AGB star which is more massive compared to the primary and therefore would have evolved to a cool white dwarf (Bisterzo et al., 2012; Abate et al., 2015, and references therein).
For the case of CEMP- stars, only a few of them are known till date (Sneden
et al., 2003; Hansen
et al., 2015) and the possible origin of -process elements in this subclass include supernovae (SNe) nucleosynthesis (Wheeler et al., 1998; Qian &
Wasserburg, 2007; Sneden
et al., 2008; Winteler et al., 2012) and/or neutron star merger events (Lattimer &
Schramm, 1974; Thielemann et al., 2017; Watson
et al., 2019). There are also CEMP- stars, that constitute relatively a larger fraction compared to CEMP- stars, exhibiting enhancement in - and -process elements. They also show radial velocity variations, hence two different sources for such enrichment of - and -process elements are considered. Some hypothesize that
carbon and -process abundance would have similar
origin as that of the CEMP- stars (Sivarani
et al., 2004; Masseron et al., 2010; Bisterzo et al., 2011) whereas the origin of -process elements is considered to be from SNe or neutron-star mergers which pre-enrich the birth cloud of the binary stars with -process elements (Bisterzo et al., 2012). This two-source pollution could not satisfactorily explain the observed number of CEMP- stars as well as the correlation between the enrichment in the -process and -process elements (Abate et al., 2015). Recently, nuclear network calculations using neutron densities halfway between -and r-processes were able to produce the abundance pattern similar to CEMP- stars (Hampel et al., 2016; Denissenkov
et al., 2017) thus invoking the possibility of a single stellar site for the production of - and -process in CEMP- stars instead of two-source pollution. In the literature sometimes CEMP- stars are referred as CEMP- stars because
the intermediate neutron-capture process seems capable of reproducing the mixed - and - process abundance pattern.
While majority of the CEMP population exhibit the signatures of a binary companion, CEMP- stars are often found not to be associated with binaries (Hansen
et al., 2016a) thus they reflect the ISM abundance from which the star was born. Also, CEMP- stars are found to be dominating the CEMP population at lower metallicities (Salvadori et al., 2015). Models
of faint SNe that experienced mixing and fallback and models of zero-metallicity-spin stars having
high rotational velocity are some of the proposed scenarios for explaining the peculiar
abundance patterns shown by CEMP- stars (Umeda &
Nomoto, 2003; Meynet
et al., 2006; Yoon
et al., 2016; Hansen
et al., 2016a). These progenitors expel huge amount of C,N and O to the ISM.
Despite various astrophysical processes are identified as
a source for carbon in CEMP- stars, the
masses of progenitors and multiple nucleosynthetic
processes or their sites to explain the diverse abundance pattern of the light and heavy elements are still unclear.
To fully understand the sites and mechanisms that contribute the enrichment of light and heavy elements in CEMP- we require measurements of C, N and O for a large sample of CEMP stars along with other elemental abundances. The abundance of C and N can be determined from low-resolution optical spectra of CEMP stars using the
CH, C2 and CN features. But O abundance measurements require high-resolution spectroscopy. Typical high-resolution oxygen abundances are made from the forbidden [OI] lines at 6300, 6363 and O I triplet near 7774.
However, the O I triplet lines at 7774 are strongly affected by non-local thermodynamic equilibrium (NLTE) and local thermodynamic equilibrium (LTE) approximation results in over estimation of the abundances (Asplund
et al., 2005; Amarsi et al., 2016, 2019).
But the forbidden [OI] lines at 6300 and 6363 do not show any significant departures from LTE even though they do suffer from 3D effects. These 3D effects cause an abundance variation maximum up to 0.2 dex (Caffau
et al., 2015; Amarsi et al., 2016). Hence, more reliable abundance measurements thus come from the forbidden [O I] lines at 6300Å and 6363Å.
But these lines are very weak at lower metallicities and it requires hours of exposures to detect the feature (Schuler et al., 2006).
| Star | RA | DEC | Vmag | Kmag | MJD | RVhelio | SNR at | SNR at | Reference: |
|---|---|---|---|---|---|---|---|---|---|
| (J2000) | (J2000) | (kms-1) | 2.1 m | 4800 Å | |||||
| HD 5223 | 00:54:13.61 | +24:04:01.52 | 8.5 | 5.7 | 57775.68434693 | -242.9 | 66.3 | 58.2 | 1 |
| HE 0314-0143 | 03:17:22.18 | -01:32:36.51 | 12.6 | 8.0 | 57784.59031674 | -33.6 | 45.3 | 27.5 | 1,2 |
| HE 1152-0355 | 11:55:06.06 | -04:12:24.71 | 11.4 | 8.4 | 57801.81004023 | 428.6 | 36.2 | 26.7 | 1,2 |
| HE 0017+0055 | 00:20:21.60 | +01:12:06.83 | 11.7 | 8.5 | 58720.81863073 | -83.2 | 33.8 | 56.1 | 1,2 |
| BD+42 2173 | 11:00:00.44 | +41:36:07.50 | 8.1 | 7.4 | 58575.57389648 | -59.9 | 61.6 | 50.2 | 1 |
| HD 187216 | 19:24: 18.35 | +85:21:57.19 | 9.6 | 6.0 | 58575.85302417 | -122.4 | 44.7 | 51.6 | 1 |
| HE 1418+0150 | 14:21:01.15 | +01:37:17.76 | 12.2 | 9.1 | 57801.97132139 | -22.4 | 44.6 | 26.2 | 1,2 |
Many cool CEMP stars are unexplored due to the complexity of analysis and need for high resolution high S/N data. But the near-infrared (NIR) first-overtone ro-vibrational bands of CO at 2.3 m gives a possible alternate to this problem
because of their detection even at lower resolution (Beers et al., 2007; Kennedy
et al., 2011; Hansen
et al., 2019a). In CEMP stars, the C/O ratio is 1.0 i.e; the carbon abundance exceeds the oxygen abundance.
So essentially all the oxygen would be locked up in CO molecules and these NIR lines will provide a sensitive
probe for the oxygen abundance in CEMP stars.
The carbon isotopic ratio 12C/13C is an important parameter to understand the degree of mixing in the progenitors or the observed star itself (Spite
et al., 2005, 2006; Sivarani
et al., 2006) and is usually derived from the optical spectra using the 12C2
band head at 4737 Å and the 12C13C band head at 4744Å . But in cool stars, the 12C2
band head at 4737 Å may be saturated and leads to a large derived 12C/13C ratio.
This problem can be resolved by using the CO features at 2.3 m where the 13CO lines are well separated from the 12CO lines. So it provides an accurate and better
estimates of the mixing diagnostic 12C/13C ratio than deriving it from the optical spectra (Beers et al., 2007), for cool CEMP stars.
In this paper, observations of 7 CEMP stars are reported to understand the origin of various elements in them and to validate
the oxygen abundances derived from NIR spectra with that of [OI]6300 line in optical.
The paper is organized as follows: In section 2,
sample selection and observation have been mentioned. Section 3 and section 4 describe the details of stellar parameters
and abundance analysis. In section 5, the results are discussed with how the companion’s properties can be constrained with the abundance pattern of light and heavy elements and in section 6, the paper is concluded.
2 Observation and data reduction
One of the motivations of this study is to measure the C, N and O abundances, and compare the oxygen
abundance from CO features in the NIR regime and oxygen from [OI] at 6300 Å.
So the target selection considered were, metal poor stars that are enhanced in carbon abundance, low effective temperature (T 5000K) and Vmag < 13, suitable for observations using a 2m class telescope. At such cool temperatures and with C/O 1, all the oxygen will be locked up as CO molecule.
So the program stars were chosen from literature where the carbon has been previously measured which has low effective temperature.
The details of the targets are given in the table 1.
The targets were observed using the TIFR (Tata Institute of Fundamental Research) Near Infrared Spectrometer and Imager (TIRSPEC) (Ninan
et al., 2014) and Hanle Echelle Spectrograph (HESP) (Sriram
et al., 2018) mounted on 2m Himalayan Chandra Telescope (HCT), Hanle. TIRSPEC was used to capture the
CO bands at 2.3 m and HESP was used for the optical observations.
The NIR spectra have been taken in the cross-dispersed mode using a slit S3 (width is 1.97"). This setup covers both
the H and K bands simultaneously, covering a wavelength of 1.50 - 1.84 m & 1.95 - 2.45 m at a resolution R 800.
Dithering along the slit was performed
for accurate background subtraction, we also avoided regions of bad pixels by suitably choosing the target location on the slit.
A0 type stars at the same air mass were also observed along with the targets to correct for the
telluric lines in the spectra. In order to avoid the counts reaching the non-linearity regime of
the detector, the observations were performed as multiple exposures of 500sec. The final spectrum thus obtained had a signal to noise ratio (SNR) 30.
The NIR data reduction has been performed using semi automated pipeline developed by Ninan
et al. (2014)
in which the dark correction, flat fielding, background subtraction, spectrum extraction, wavelength
calibration, telluric line correction and continuum fitting were performed using codes in python
which made use of standard modules like astropy, numpy, matplotlib and PyRAF222PyRAF is a
product of the Space Telescope Science Institute, which is operated by AURA for NASA.
The optical observations of the program stars were taken in high-resolution (R = 30000) using HESP. They were observed in multiple frames of 45 minute
exposures depending on the brightness and obtained the spectra in the star-sky mode
which enabled the sky to be subtracted from the object fibre.
ThAr spectrum was taken along with each program star spectrum for the
wavelength calibration.
The spectral reduction included, trimming, bias subtraction, aperture extraction and wavelength
calibration. These steps were performed using PyRAF.
The final normalized and co-added spectrum covers a wavelength range from 4000-10500 Å.
3 stellar parameters and chemical abundances
The spectra of all the program stars are dominated by
molecular features because of high carbon abundance and low effective temperature.
This hindered us from getting clean lines of iron (Fe) for estimating
the stellar parameters using equivalent width method.
So, we performed a full spectrum synthesis to derive abundances from the atomic lines.
We used the spectral synthesis code TURBOSPECTRUM developed by Plez (2012) to derive abundances and obtain the stellar parameters. We used the stellar atmospheric models by Mészáros
et al. (2012) in which the ATLAS9 and
MARCS codes were modified with an updated H2O linelist and
with a wide range of carbon- and -element enhancements. Whenever required, we interpolated the models from the grid of model photospheres provided by Mészáros
et al. (2012) to obtain the intermediate parameter values. LTE has been assumed for all
species. But we referred Mashonkina et al. (1999); Mashonkina &
Gehren (2000); Andrievsky
et al. (2009, 2010); Lind et al. (2011); Mashonkina &
Christlieb (2014) and Hansen
et al. (2020) for NLTE corrections of various elements and whenever available we applied their corrections to the derived abundances.
We adopted the Solar abundances from Asplund et al. (2009)
and Solar isotopic ratios were used unless otherwise specified. The line lists for atomic lines
were assembled from the Vienna Atomic Line Database (VALD) database (Kupka et al., 1999) and the details of the same are mentioned in the table LABEL:tab:linelist. Hyperfine structure (HFS) has
been accounted for Li, Sc, Ba, La and Eu.
For the case of molecular linelists, we used the CH line list compiled by T.
Masseron (priv. comm.) and CN data from Plez &
Cohen (2005). The linelists for C2 and NIR CO molecular features were taken from the Kurucz database333http://kurucz.harvard.edu/linelists/linesmol/.
3.1 Stellar parameters
The effective temperatures of all the program stars were calculated from J-H, J-K and V-K colors using various color transformation relations (Alonso et al., 1996, 1999; Ramírez &
Meléndez, 2005). For this, whenever available, we used the metallicity quoted in the literature as the initial metallicity of the respective star and the reddening values, E(B-V), from Schlegel et al. (1998). The derived photometric temperature values are consistent within 150K. Among these, the temperature derived from the V-K color index is considered superior due to its large span in the wavelength of the bands involved.
Also, these bands are relatively free from contamination from molecular C.
So we adopted the temperature derived from the V-K color as the star’s temperature which is also consistent within 150K with literature values. Hence, we adopt this value as uncertainty in the temperature measurements, for deriving abundances.
We have also cross-verified the temperature of the star using the available data from Gaia data release 2444https://gea.esac.esa.int/archive/. The available Gaia temperatures are matching within the error ( 150 K).
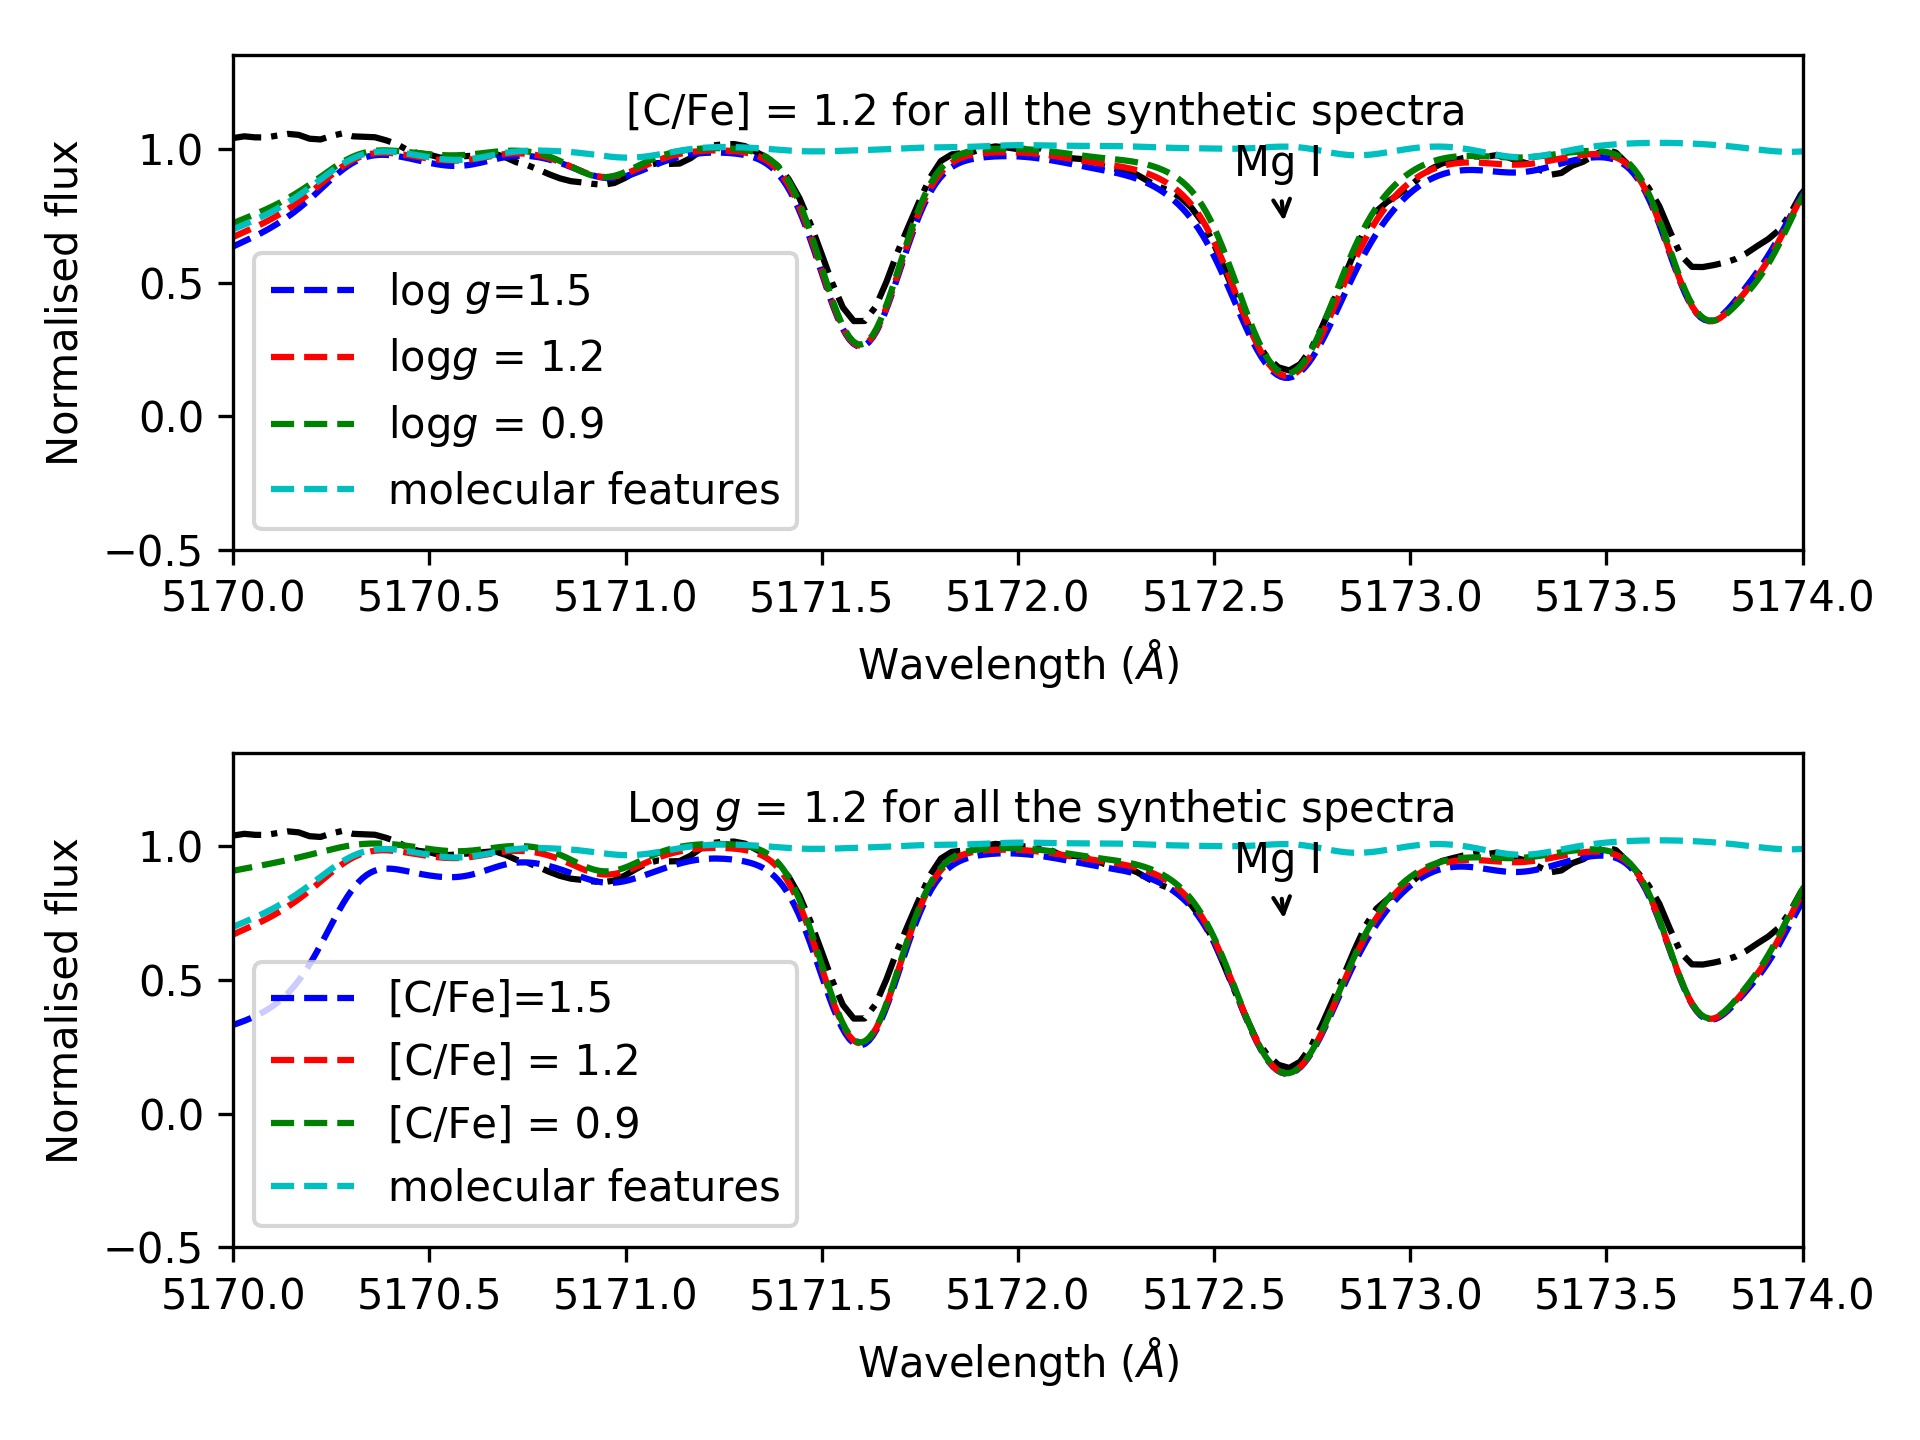
The surface gravity, log , was derived by fitting the wings of Mg I triplet around 5172 Å using a synthetic grid of model spectra where we adopted the temperature derived from the above method as the model temperature value and for various values
of log with a step size of 0.25 dex. The best fit value was
found by the goodness of the fit and chosen as the final log . While fixing log , we also changed the carbon abundance from [C/Fe]=0.0 to [C/Fe]= +1.5 to simultaneously fit the C2 band-head at 5165 Å to converge on to the best fit parameters. We have checked the effect of carbon abundance on the wings of Mg I lines by fitting the Mg I lines with different values of [C/Fe]. The effect is found to be negligible (refer figure 15).
We identified that the log of the program stars ranges from 0.25 to 1.9.
In order to understand the evolutionary phase of the program stars, we obtained the luminosity of the stars from Gaia DR2 data and placed the stars on their respective isochrones from BASTI stellar evolution database (Pietrinferni et al., 2004) and identified that all the program stars fall in the upper part of the red giant branch (RGB).
The metallicities of the stars were derived by fitting the iron features in the visual
spectra where the molecular features have less influence on the continuum (e.g., Fe lines in the range 5190 Å - 6450 Å). The best fit value was chosen as the final value with an error of 0.2 dex. The uncertainty was chosen in such a way that the best fit does not change while changing the Fe abundance.
We derived the microturbulence velocity () by simultaneously matching the iron abundance of weak and strong FeI lines in the spectra. We fitted the unblended iron features by varying the by a step-size of 0.2 kms-1 and the best fit value was taken as the final microturbulent velocity.
The final adopted stellar parameters with the uncertainty in measurements are listed in the table 2
| star name | Teff | log | [Fe/H] | type | |
|---|---|---|---|---|---|
| K | cms-2 | dex | kms-1 | ||
| 150 | 0.25 | 0.2 | 0.2 | ||
| HD 5223 | 4335 | 1.20 | -2.1 | 2.0 | r/s |
| HE 0314-0143 | 3881 | 0.25 | -1.9 | 2.1 | r/s |
| HE 1152-0355 | 4200 | 0.25 | -1.7 | 2.2 | s |
| HE 0017+0055 | 4240 | 1.00 | -2.6 | 1.9 | r/s |
| HE 1418+0150 | 4150 | 1.80 | -2.0 | 2.0 | r/s |
| BD+42 2173 | 4430 | 1.90 | -1.6 | 1.5 | r/s |
| HD 187216 | 3920 | 0.80 | -2.5 | 2.0 | r/s |
4 Abundances
The abundances of key elements such as Li, C, N, O, Mg, Na, Ca, Y, Ba, Eu and Sm were derived using the spectral synthesis method where the input model parameters were chosen from the table 2 . Using these model parameters, the synthetic spectral grid was generated by varying the input elemental abundances in steps of 0.2 dex. This synthetic spectra were used to fit the respective spectral line and the best fit value was chosen as the final abundance. The derived abundances are quoted in the table 3. The details of the abundance measurements for each element are briefly described below.
4.1 Uncertainties in the abundance measurements
The stellar parameters and the elemental abundances are estimated using spectral synthesis method. So, the uncertainty in the abundance values was estimated through the goodness of the least squares fit and are mentioned in the table 4.
The systematic errors in our abundances were derived using models where each stellar parameter (Teff, log , )
was varied by a fixed amount (150 K, 0.25 dex, 0.2 km s-1) while keeping other parameters constant
and from those, new abundances were computed. To perform the analysis, we choose HD 5223 as the representative star for the program stars in this study. The resulting change on abundance variations upon these
parameter variations as well as their combined effect, calculated by adding them in quadrature, are listed in the table 4.
| Element | Solar | HD 5223 | HE 1152-0355 | HE 1418+0150 | BD+42 2173 | HD 187216 | HE 0017+0055 | HE 0314-0143 | |
|---|---|---|---|---|---|---|---|---|---|
| Li§ | 1.05 | 0.00 | 0.00 | -0.05 | 0.00 | 0.00 | -0.10 | -0.50 | 0.30 |
| C | 8.43 | 1.35 | 1.35 | 1.30 | 1.10 | 1.45 | 2.10 | 0.95 | 0.20 |
| N | 7.83 | 0.73 | 0.95 | 1.20 | 1.00 | 0.93 | 1.65 | 0.55 | 0.20 |
| O | 8.69 | 0.35 | 0.50 | 1.00 | 0.35 | 0.05 | 0.90 | 1.02 | 0.30 |
| Na (LTE) | 6.24 | 0.20 | -0.10 | 0.60 | 0.80 | 0.50 | 0.70 | 0.30 | 0.20 |
| Na (NLTE) | 6.24 | 0.13∗ | — | 0.45∗ | 0.60∗ | — | 0.61∗ | 0.20∗ | 0.20 |
| Al | 6.45 | -0.00 | -0.20 | -0.40 | 0.65 | -0.10 | 0.00 | -0.00 | 0.30 |
| Mg | 7.60 | -0.10 | 0.40 | 0.10 | 0.40 | 0.30 | 0.00 | 0.40 | 0.20 |
| K(LTE) | 5.03 | … | 0.70 | 0.10 | 0.80 | 0.10 | 0.60 | 0.00 | 0.20 |
| K (NLTE) | 5.11 | … | — | -0.26 ∗ | 0.27 ∗ | 0.09∗ | 0.40∗ | — | 0.20 |
| Ca | 6.34 | 0.10 | 0.30 | -0.20 | 0.40 | 0.30 | 0.30 | 0.00 | 0.30 |
| Sc | 3.15 | 0.25 | 0.00 | 0.70 | 0.40 | 0.90 | 0.85 | 0.35 | 0.20 |
| Rb | 2.52 | 0.60 | -0.30 | -0.50 | 0.70 | 0.10 | 0.10 | 0.60 | 0.20 |
| Y | 2.21 | 0.80 | 0.40 | 1.10 | 1.40 | 0.80 | 0.50 | 0.55 | 0.20 |
| Zr | 2.58 | 1.30 | 0.40 | 1.50 | 1.20 | 1.50 | 1.70 | 0.80 | 0.20 |
| Ba | 2.18 | 1.50 | 1.30 | 1.80 | 2.20 | 2.00 | 2.30 | 1.35 | 0.20 |
| La | 1.10 | 1.70 | 1.40 | 2.00 | 2.20 | 2.00 | 2.30 | 1.65 | 0.20 |
| Ce | 1.58 | 1.42 | 1.20 | 2.10 | 2.00 | 1.90 | 2.00 | 1.07 | 0.20 |
| Pr | 0.72 | 1.48 | 1.18 | 2.30 | 2.10 | 1.98 | 2.20 | 1.25 | 0.20 |
| Nd | 1.42 | 1.48 | 1.20 | 1.90 | 2.10 | 1.66 | 2.20 | 1.35 | 0.20 |
| Sm | 0.96 | 1.24 | 0.90 | 1.50 | 2.00 | 1.64 | 2.10 | 1.09 | 0.20 |
| Eu | 0.52 | 1.06 | 0.36 | 1.16 | 1.60 | 1.66 | 1.96 | 1.23 | 0.20 |
| 0.00 | 0.49 | 0.90 | 0.70 | 0.83 | 0.85 | 1.10 | 0.68 | — |
-
•
The * represents the values corrected for the NLTE effects and — represents no available NLTE correction.
-
•
§ The Li abundance quoted here is in the absolute scale, A(Li)
| Element | ||||
| g | ||||
| (150K ) | (0.25 dex) | (0.2km s-1 ) | ||
| Li | 0.3 | 0.15 | 0.0 | 0.11 |
| O | 0.1 | 0.05 | 0.0 | 0.01 |
| Na | 0.05 | 0.10 | 0.05 | 0.02 |
| Al | 0.15 | 0.10 | 0.05 | 0.04 |
| Mg | 0.0 | 0.1 | 0.0 | 0.01 |
| K | 0.1 | 0.05 | 0.0 | 0.01 |
| Ca | 0.1 | 0.1 | 0.0 | 0.02 |
| Sc | 0.0 | 0.05 | 0.05 | 0.01 |
| Rb | 0.1 | 0.0 | 0.05 | 0.01 |
| Y | 0.05 | 0.05 | 0.0 | 0.01 |
| Zr | 0.1 | 0.0 | 0.0 | 0.01 |
| Ba | 0.15 | 0.1 | 0.0 | 0.03 |
| La | 0.0 | 0.05 | 0.0 | 0.01 |
| Ce | 0.05 | 0.05 | 0.0 | 0.01 |
| Pr | 0.15 | 0.05 | 0.05 | 0.03 |
| Nd | 0.05 | 0.05 | 0.0 | 0.01 |
| Sm | 0.1 | 0.1 | 0.0 | 0.02 |
| Eu | 0.2 | 0.1 | 0.0 | 0.05 |
4.2 C, N and O
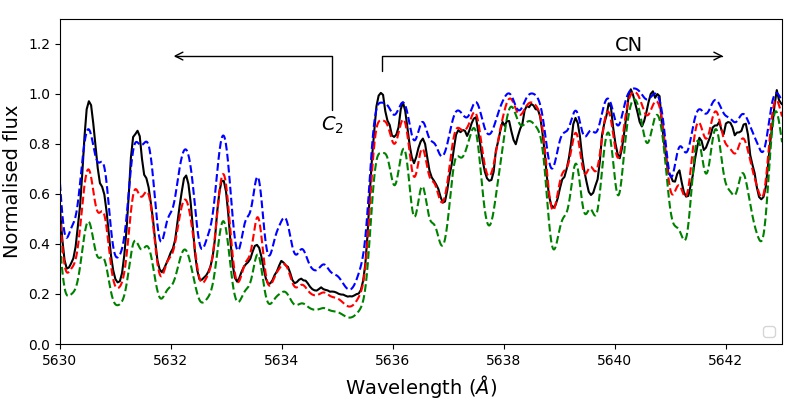
The carbon abundance in the program stars has been derived by fitting the
C2 molecular band heads at 5165 Å and 5635 Å. Both
features yielded the same abundance values and we adopted this carbon value while deriving the abundances of N and O from molecular features.
For the case of N abundance, we used CN lines in the wavelength
range from 5635-6700 Å by iteratively changing the nitrogen
abundance of the synthetic spectra by 0.2 dex and fixed the carbon abundance to the value derived from C2 molecular band and fitting the entire spectral region (refer figure 1). The best-fit value is chosen as the final nitrogen abundance. We did not use strong CN lines in the blue region at 4215 Å due to the poor the SNR .
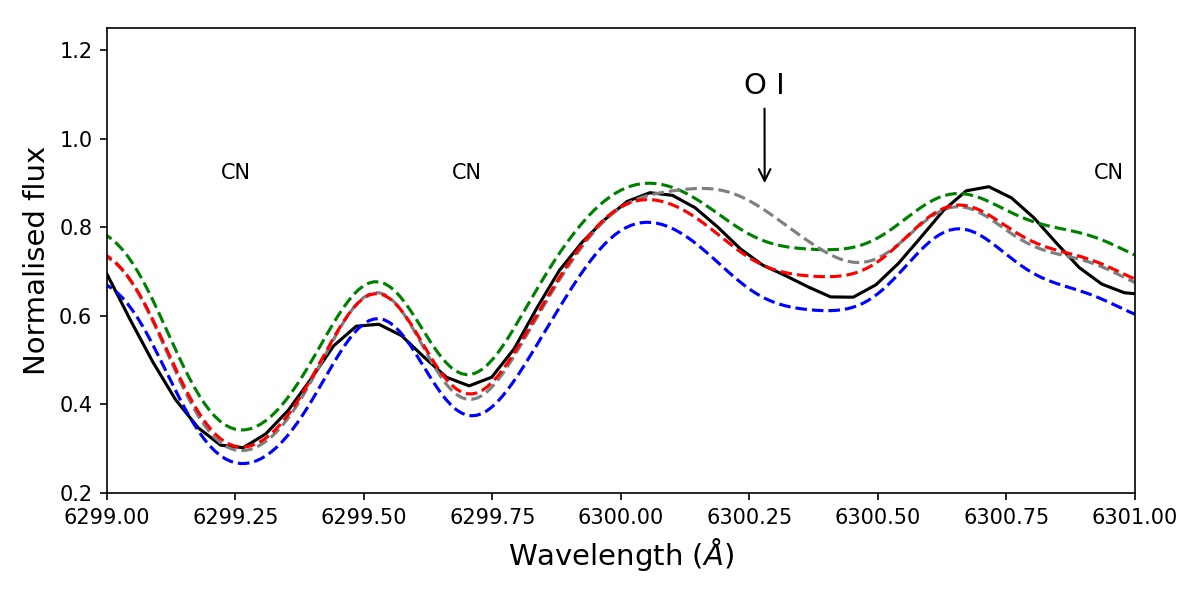
The oxygen abundance from optical spectra was derived by using the [O I] lines at 6300, 6363 Å . Since these lines are blended with CN features, a small change in the nitrogen abundance affects the derived oxygen abundance. So, the carbon abundance and the nitrogen abundance were first fixed to be the value obtained from the C2 and CN bands and the oxygen abundance was iteratively adjusted to fit the [O I] lines. While fixing the O abundance, N abundance was also iteratively changed by a small amount for a better fitting of the [OI] feature but without affecting the nearby CN features. The resulting O abundance from both the lines differs by 0.3 dex because of the iterative process involving both N and O, and we take this difference as our final uncertainty on the reported oxygen abundances. The spectral fitting of the [OI] line is shown in the figure 2.
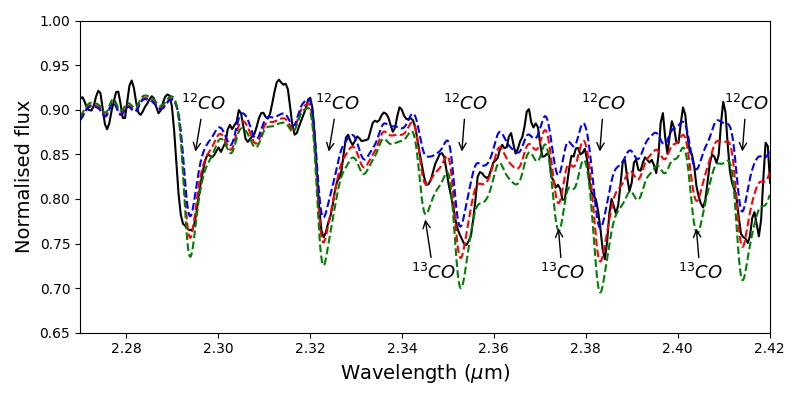
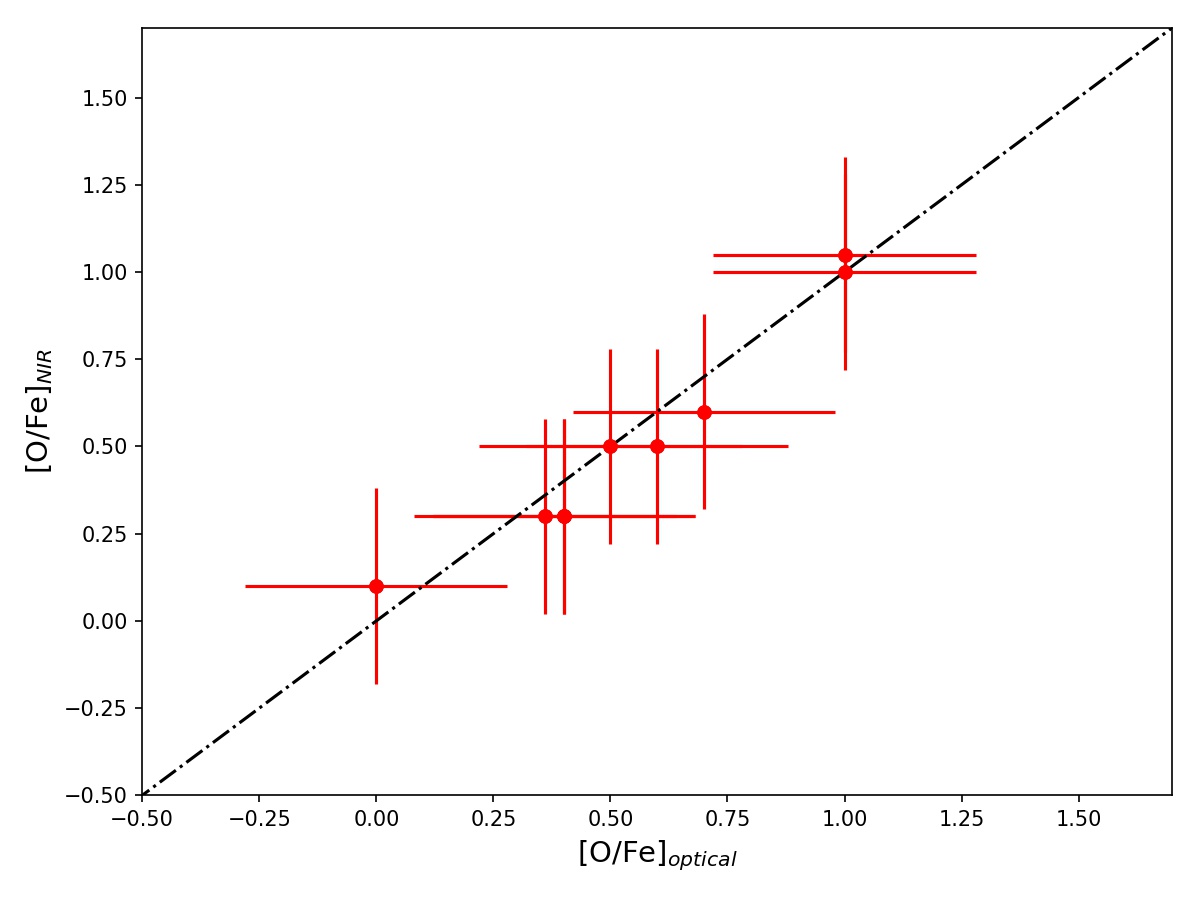
The oxygen abundance from NIR CO molecular features at 2.3 m were also obtained for all the program stars in this study. The C and N abundance derived from optical spectra were kept fixed in the synthetic spectral grid and we varied the oxygen abundances with a step size of 0.2 dex and the best fit value was chosen as the final value (see figure 3).
The final C, N and O abundances were listed in the table 3 and the oxygen abundances derived from both optical and NIR spectra are compared in the figure 4. The O abundance from optical and NIR are matching within an uncertainty of 0.3 dex. So the average of these two values was used as O abundance elsewhere in the text.
4.3 Li and ratio
Li-abundances for the program stars were determined by synthesizing
the resonance doublet at 6707 Å and the abundances are provided in the table 3. We did not detect any distinguishable spectral features of Li in the region, thus, we only derived an upper limit for the abundances. Due
to the heavy contamination from CN molecular features to the Li line, we assigned an uncertainty of
0.3 dex to the derived values. Since all the samples in the study are in the giant phase, the low values for A(Li) 555A(X) = log (X) = log (NX/NH) + 12, where NX and NH represent
number densities of a given element X and hydrogen respectively. are consistent with their evolutionary phase. During the RGB evolutionary stage, the surface Li is taken into the deeper interiors through convective mixing where it is easily destroyed due to the high interior temperatures (Gratton et al., 2000; Lind et al., 2009). To confirm the mixing scenario, we compared the Li abundances of our program stars with the objects from Spite
et al. (2005) and Sbordone
et al. (2010) in the figure 5 and identified that all the program stars occupy the same region as that of the mixed giants.

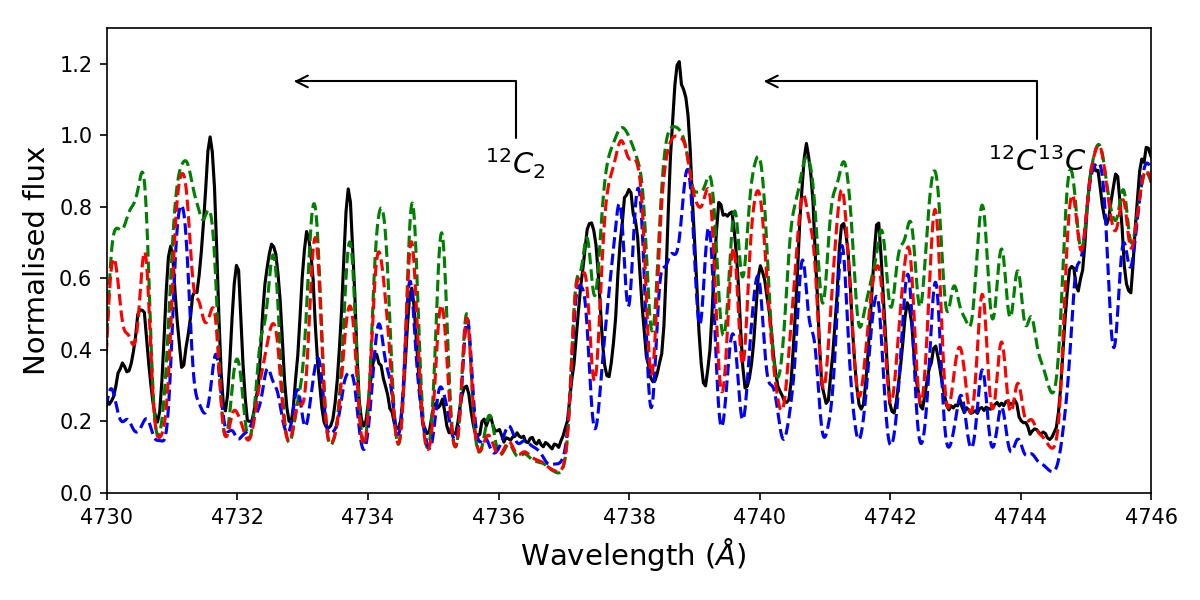
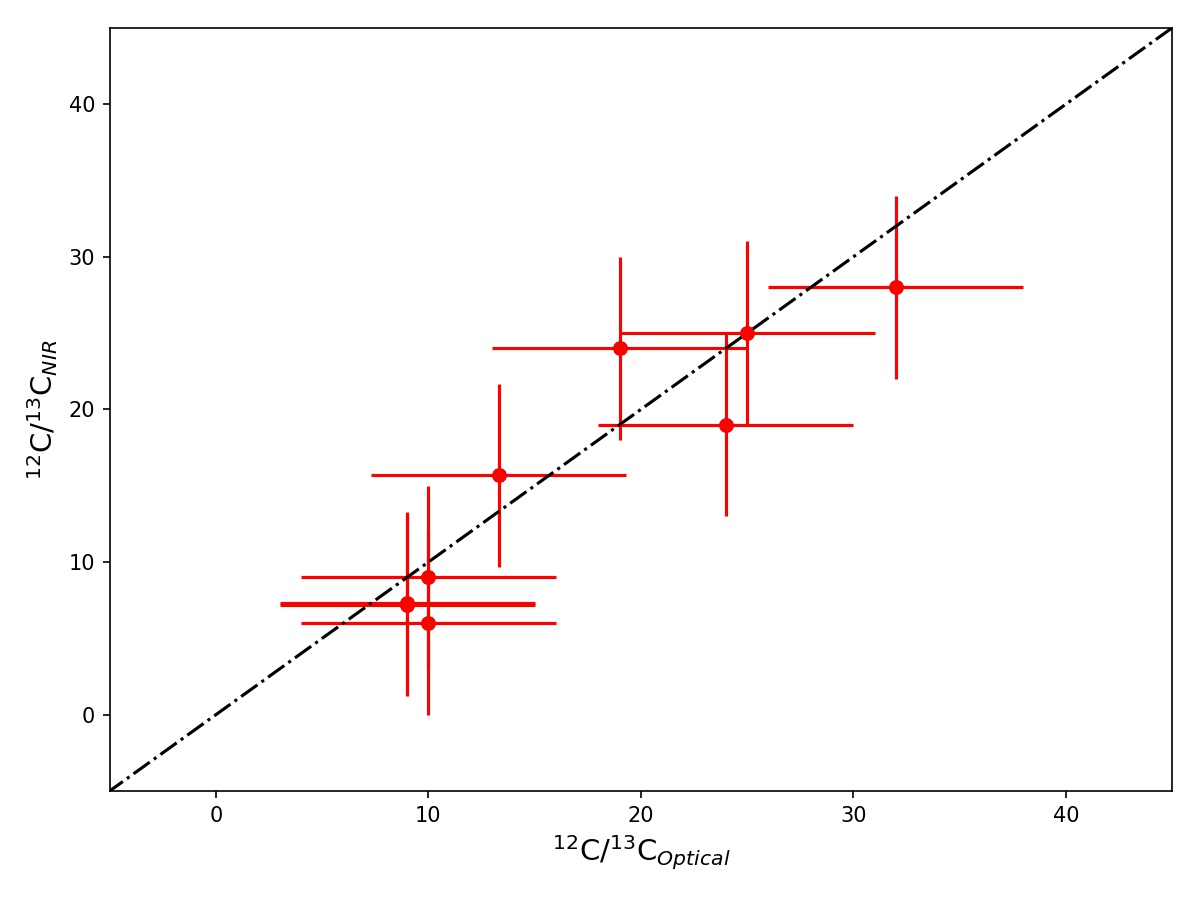
The ratio was calculated using the NIR and molecular band heads at 2.38 m (refer figure 3). We have also derived the carbon isotopic ratio from and band heads at 4737 and 4744 Å respectively (refer figure 6) to check the consistency of the values derived from low-resolution NIR spectra. We assign an uncertainty of 6 to the ratio measurements, below which the variation in the ratio could not be detected with the goodness of fit.
When comparing, we found that the ratios from optical spectra are matching with that derived from the NIR and molecular bands and compared these in the figure 7. The ratios derived from optical and NIR spectra are mentioned in table 5.
4.4 -elements and odd Z elements
Among the -elements, we derived the abundances of Mg and Ca. The Mg I triplet lines at 5172 Å and 5183 Å lines are very strong so we did not use them to derive the Mg abundance. Instead, we have used the 5528 Å and 5711 Å to derive the abundances, in particular, we have used 5711 Å for the abundance measurements only if the line is identified to be free from blending. The NLTE corrections for these lines are either negligible or not available for the parameter set of our program stars (Lind et al., 2011; Bergemann et al., 2017a; Bergemann
et al., 2017b). We have used four Ca I lines, whichever are free of blending with molecular features, to derive the Ca abundance. The median of the abundances from individual lines is calculated and provided in the table 3.
Among the odd Z elements, we derived the abundances of Na, Al, K and Sc using the high resolution spectra and the details of the lines are given in the table LABEL:tab:linelist. The Na D lines were not used as the lines are too strong for deriving the abundances. So we depended on the weaker lines 5682 Å and 5688 Å to derive the Na abundance. The NLTE corrections for these Na I lines were performed from Lind et al. (2011) whenever available and the average values are listed in the table 3. Al I lines at 6696 and 6698 are used for deriving the Al abundance and these lines have negligible contributions from NLTE effects (Baumueller &
Gehren, 1997; Nordlander &
Lind, 2017). For the case of K, whenever the feature at 7698.98 Å has contributions from telluric features, the abundance from 7664.87 Å is quoted, otherwise the average of the abundances from both the lines is quoted in table 3. Both these lines are sensitive to NLTE effects (Takeda et al., 2002; Kobayashi et al., 2006; Andrievsky
et al., 2010; Prantzos et al., 2018; Reggiani
et al., 2019) and the NLTE corrections depend on the effective temperature and surface gravity of the model. Using the NLTE grid provided in Reggiani
et al. (2019), we have estimated the NLTE corrections for the program stars and the NLTE corrected values are given in the table 3. The NLTE grid does not cover very low log values, so we could not estimate the NLTE corrections for HE 1152-0355 and HE 0314-0143. We could not measure the K abundance in HD 5223 due to the contamination from telluric features. For the case of Sc abundance, we could not find any study of Sc line formation in NLTE except in Zhang
et al. (2008) where they have studied the NLTE effects only for the sun and identified negligible NLTE effects for Sc II lines. So we report only LTE results for this element in the table 3. The resolution of the NIR spectra was too low to resolve the HF feature from the nearby features, so we could not derive F abundance in these stars.
The spectral features of the Fe-peak elements are severely blended with the molecular features of C and N to derive any meaningful abundances. So we could not make any reliable measurements of their abundances.
4.5 Neutron capture elements
We derived the abundances of light -process elements (ls: Y, Zr) as well as heavy -process elements (hs: Ba, La, Nd, Ce, Pr, ) and r-process elements(Eu and Sm) to understand the origin of neutron-capture elements using various spectral lines in the high-resolution optical spectrum. The [hs/ls] 666 This ratio defines the enrichment of the second peak of the -process (hs), with respect to the first peak, light -process (ls) elements. It is defined as [hs/ls] = [hs/Fe]- [ls/Fe] in the usual spectroscopic notation.We adopt [ls/Fe] = [Y+Zr/Fe]/2 and [hs/Fe] = [Ba+La+Ce/Fe]/3. ratio of all the program stars are provided in the table 3. The CN band head at 4215 Å is saturated in all our program stars. So the abundance of Sr could not be measured from the Sr II resonance line at 4216 Å. The details of the lines used for the abundance measurements are given in the table LABEL:tab:linelist. For the case of Rb abundance, we have quoted the abundance from the Rb I line at 7800.2 Å and we did not use the 7947.5 Å line since it was severely blended with the CN molecular feature. For Ba and Eu, we used the Ba II lines at 5853 Å and 6141 Å and Eu II line at 6645 Å for the abundance determination. We checked for available NLTE corrections to these features and identified to have negligible contributions from NLTE effects (Mashonkina et al., 1999; Mashonkina & Gehren, 2000; Mashonkina & Christlieb, 2014; Gallagher et al., 2020).
4.6 Oxygen abundance of the program stars
We derived the oxygen abundance of 9 carbon enhanced stars using both optical and NIR spectra. The oxygen abundances of HD 5223, HD 187216, BD+42 2173 and C*782 are not available so far in the literature. For the case of HE 1152-0355, HE 1418+0150, HE 0017+0055 and HE 0314-0143; Kennedy et al. (2011) had reported the oxygen abundances from the low-resolution NIR CO lines. Using low-resolution NIR and high resolution optical observations, we confirm the O abundances in these stars. The abundances are given in table 5. The stellar parameters and abundance details of C*782 and BD+41 2150 are not discussed elsewhere in the paper as their abundance pattern was found to be more complex and does not fit in the theme of this paper. So we confine the results from these two stars to the oxygen abundance and their carbon isotopic ratio. A detailed abundance analysis of the two objects will be discussed in an upcoming paper, Susmitha et al. (in prep).
| star name | [O/Fe] | |||
|---|---|---|---|---|
| Optical | NIR | Optical | NIR | |
| HD 5223 | 0.4 | 0.3 | 25 | 25 |
| HE 1152-0355 | 0.5 | 0.5 | 10 | 9 |
| HE 1418+0150 | 1.0 | 1.0 | 9 | 7 |
| BD+42 2173 | 0.4 | 0.3 | 39 | 32 |
| HD 187216 | 0.0 | 0.1 | 10 | 6 |
| HE 0017+0055 | 0.7 | 0.6 | 9 | 7 |
| HE 0314-0143 | 1.0 | 1.1 | 13 | 16 |
| BD+41 2150 | 0.6 | 0.5 | 24 | 19 |
| C* 782 | 0.4 | 0.3 | 32 | 28 |
4.7 Comparison with literature
Since our program stars were chosen from the literature, we compare the stellar parameters and various elemental abundances with the previous studies .
HD5223: This program star was studied by Goswami
et al. (2006) and classified as a CEMP- star based on the abundances from Ba, La and Ce. The derived stellar parameters from their study and from our study are matching within the error quoted in sec. 4.1. But the classification of HD 5223 as CEMP- stars is revisited here and classified it as CEMP- using the [Eu/Fe] abundances which was not done in the earlier studies.
HE 1152-0355: Goswami
et al. (2006) have reported the stellar parameters and classified the star as a CEMP- star. Kennedy
et al. (2011) have re-derived the stellar parameters and obtained the C and O abundances. Our stellar parameters and C and O abundances are also matching with the values from Kennedy
et al. (2011) within the uncertainties quoted in table 3.
HE 1418+0150: Kennedy
et al. (2011) have reported the stellar parameters and C and O abundances using low-resolution spectra.
We derived the stellar parameters and abundances using high resolution spectra and obtained a larger log and slightly higher metallicity (refer table 2). Hansen
et al. (2016c) has derived the Sr and Ba abundances of this star and classified them as MP(s). The abundances of rest of the neutron-capture elements in this star and their nucleosynthetic origin were not reported earlier. We classify the star as CEMP- using the [Eu/Fe] and [Ba/Fe] values.
HD 187216: Kipper &
Jorgensen (1994) reported this star as a possible intrinsic AGB star due to the high carbon and -process element abundances with a low log value and the non-detection of a binary companion. Jorissen
et al. (2016a) monitored the radial velocity and confirmed the binary nature with a period longer than 104 days. We classify this stars as CEMP- star based on the abundances of Ba and Eu.
HE 0017+0055: This star was identified as a CEMP- star using the excess abundance of C and -process and r-process elements and radial velocity variations with a period of 384 days (Jorissen
et al., 2016a, b). Kennedy
et al. (2011) derived the O abundance in the star using NIR CO lines. Our stellar parameters and the various elemental abundances are also inline with the estimates from Kennedy
et al. (2011) and Jorissen
et al. (2016b).
HE 0314-0143: Kennedy
et al. (2011) derived the stellar parameters, C and O abundances from low-resolution spectra. In the literature, this star was not classified into any sub category of carbon enhanced stars as no high-resolution observations were available. We classify this star as CEMP- based on the neutron-capture elemental abundances.
BD+42 2173: McClure &
Woodsworth (1990) identified this star showing radial velocity variations with a period of 328 days. Aoki &
Tsuji (1997) reported lower value whereas we have obtained a slightly higher value for ratio which is given in table 5.
5 Discussion
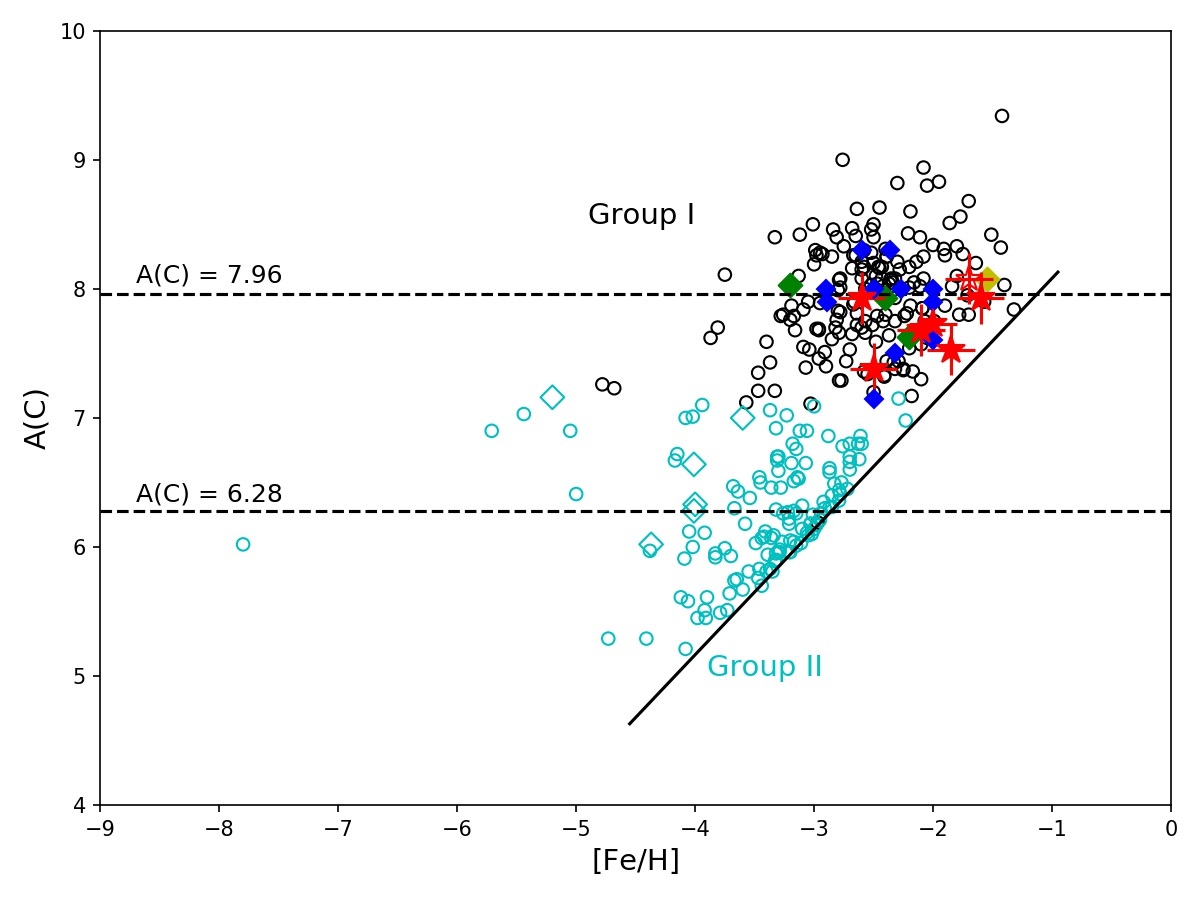
We studied the abundance pattern of 7 CEMP stars using optical and NIR spectroscopy. These stars exhibit high carbon abundance. Spite et al. (2013); Bonifacio et al. (2015); Hansen et al. (2015), and Yoon et al. (2016) identified the existence of bimodality in the distribution of A(C) for CEMP stars where most of the CEMP- stars populate the high-C band whereas most of the CEMP- stars populate the low-C band. We compared the C abundance of our program stars with the CEMP stars from the literature (Yoon et al., 2016; Bonifacio et al., 2018; Hansen et al., 2019b; Sbordone et al., 2020; Karinkuzhi et al., 2021, & references therein) to check any peculiar abundance trend is associated with CEMP- subcategory (refer figure 8). From the figure, it can be seen that the C abundance of CEMP- stars populate the high-C band region in the A(C) vs [Fe/H] space. While the A(C)-[Fe/H] diagram is useful in separating the CEMP- stars from other CEMP subclasses, it is not efficient in separating CEMP- stars from CEMP- sub-category.
The program stars also exhibit enhancement in the neutron-capture elements. The radial velocities measured from the current optical spectra and the literature values, show variations indicating the possibility of the program stars to be in a binary system. The enhancement in carbon along with the neutron-capture elements and radial velocity variations favor AGB mass transfer star as a possible mechanism for the enhanced carbon and n-capture elements. The extrinsic origin of C is further supported by the location of A(C) of these stars in the A(C)- [Fe/H] diagram. The abundance pattern exhibited by the CEMP stars provide clues about AGB nucleosynthesis at such low-metallicities. Here, we use the n-capture elements to understand the AGB nucleosynthesis and various mixing processes that will bring the carbon and neutron rich nuclei to the surface, while the abundance of light elements such as C,N,O and Na can be used to constrain the mass of the companion. So we divide the discussion into two parts. In the first part, we will show how the abundance of light elements such as C, N, O and Na can be used to constrain the mass of the companion AGB star and in the second part, we will discuss how the neutron capture elements can provide details of the inter-shell mixing and nucleosynthesis processes.
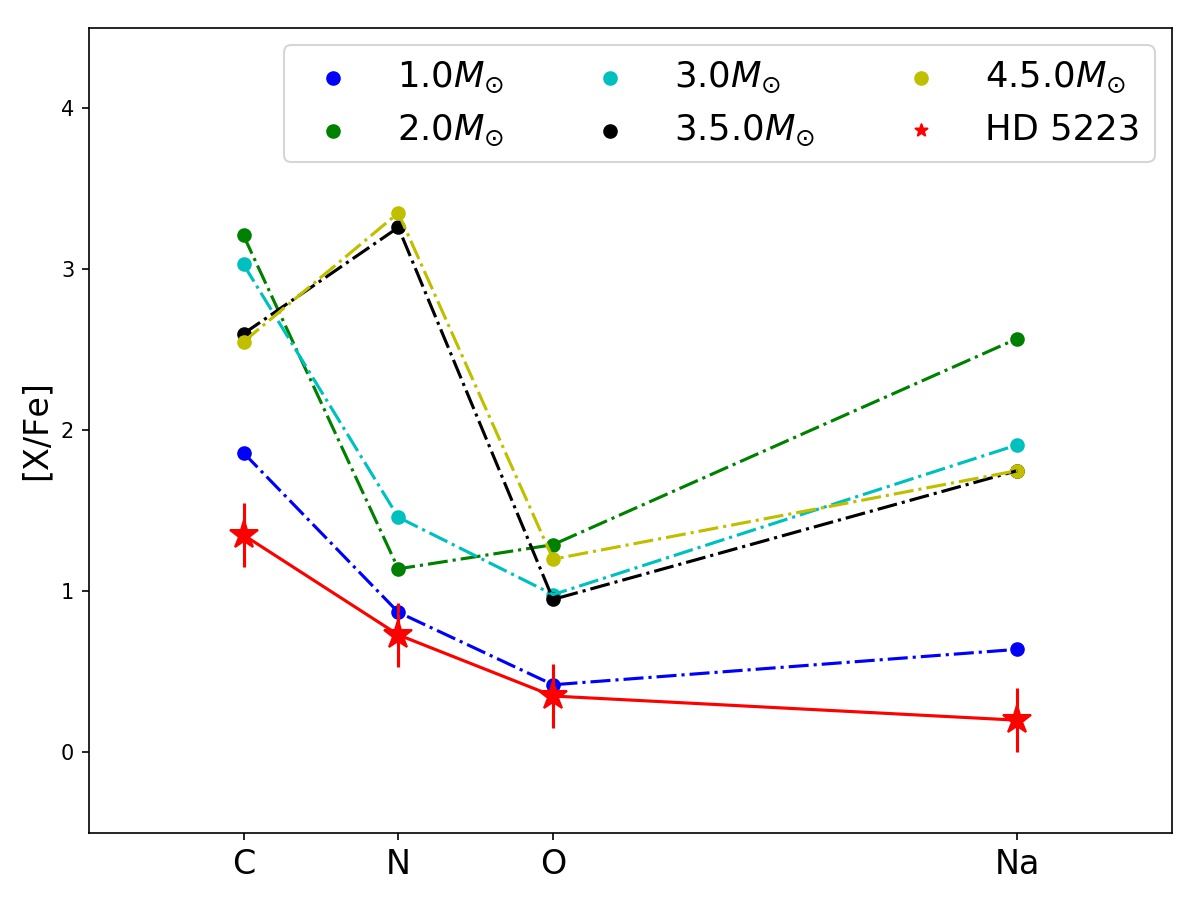
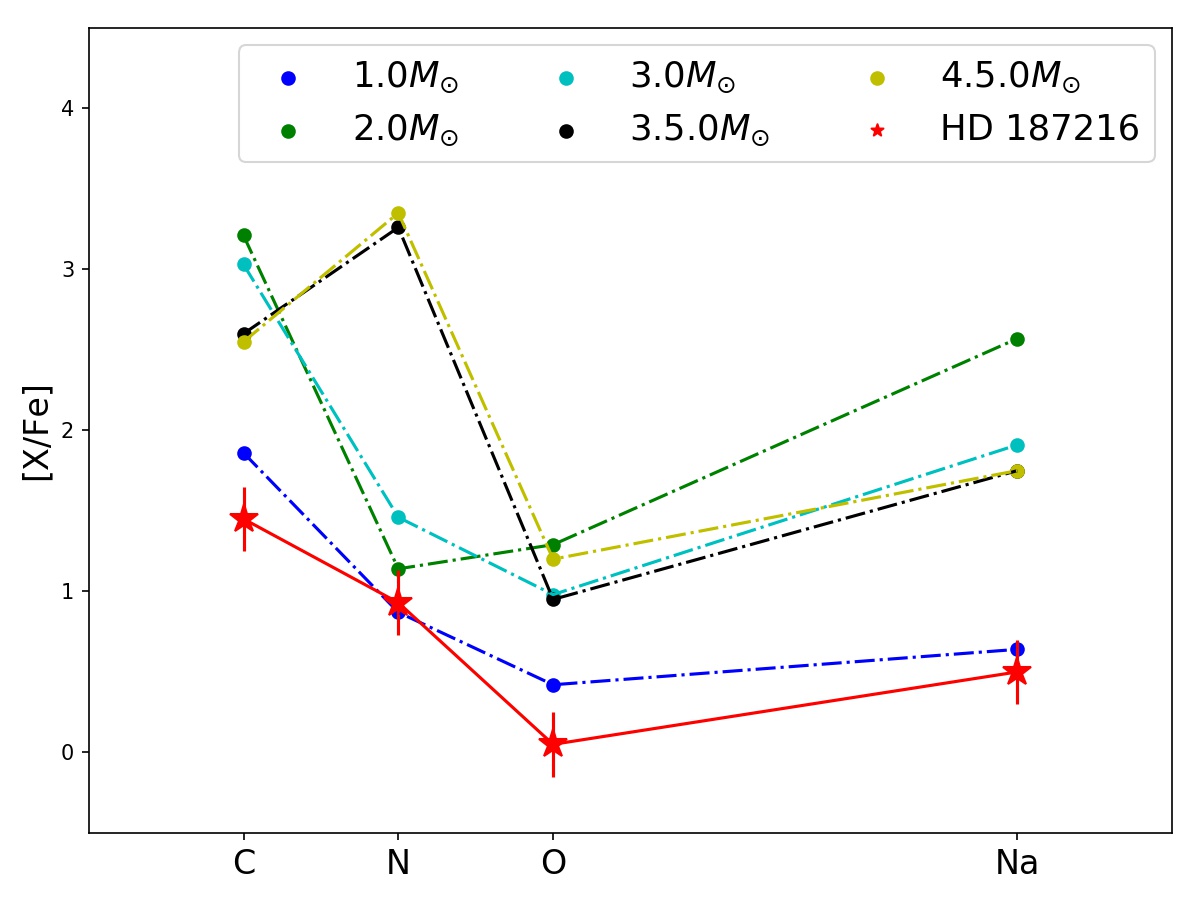
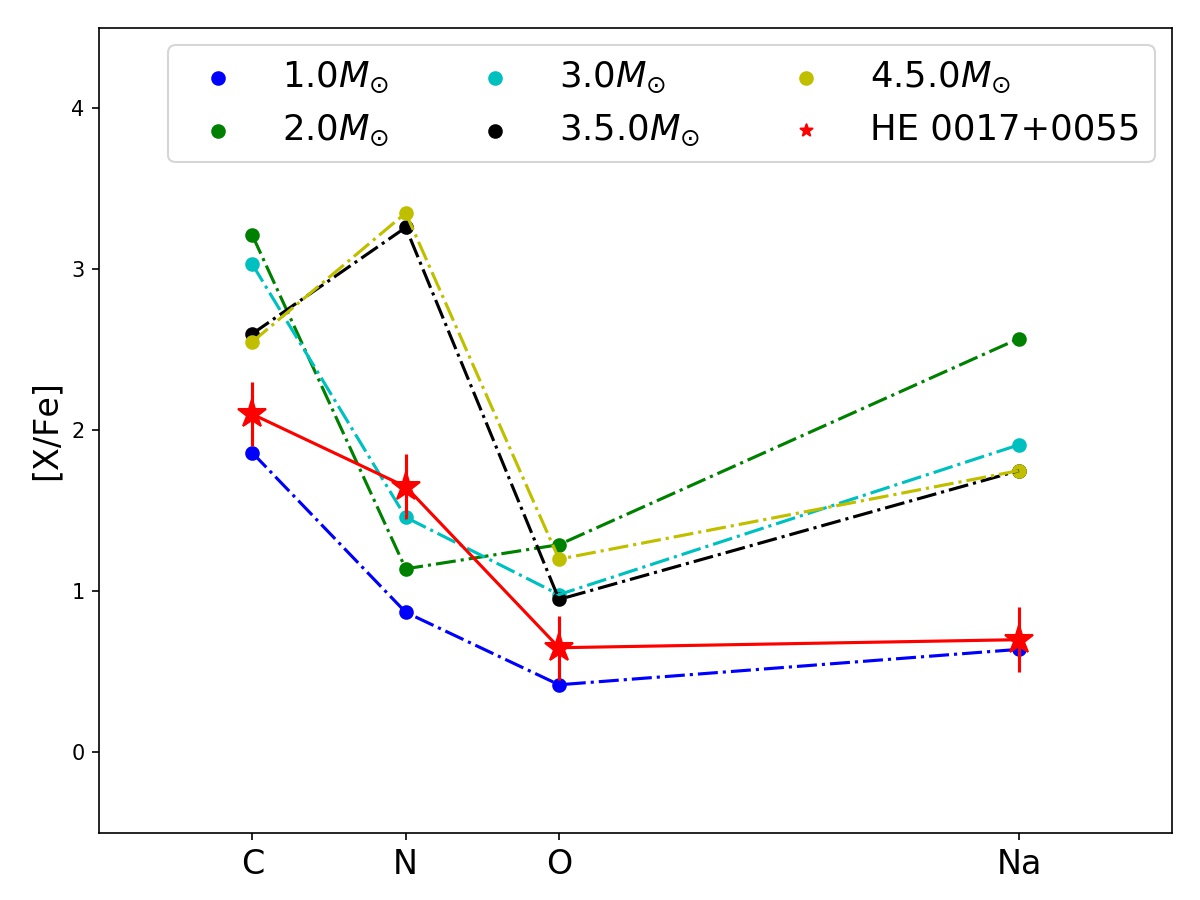
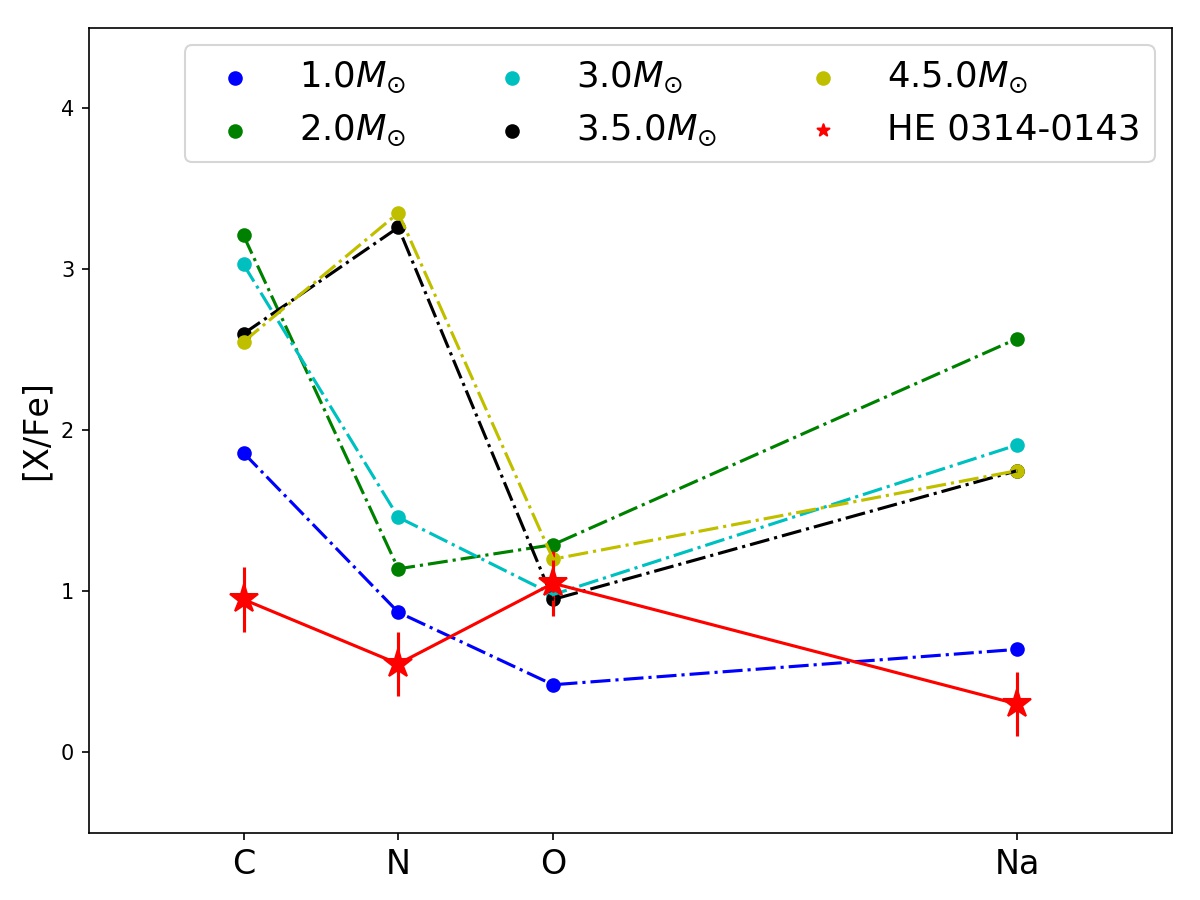
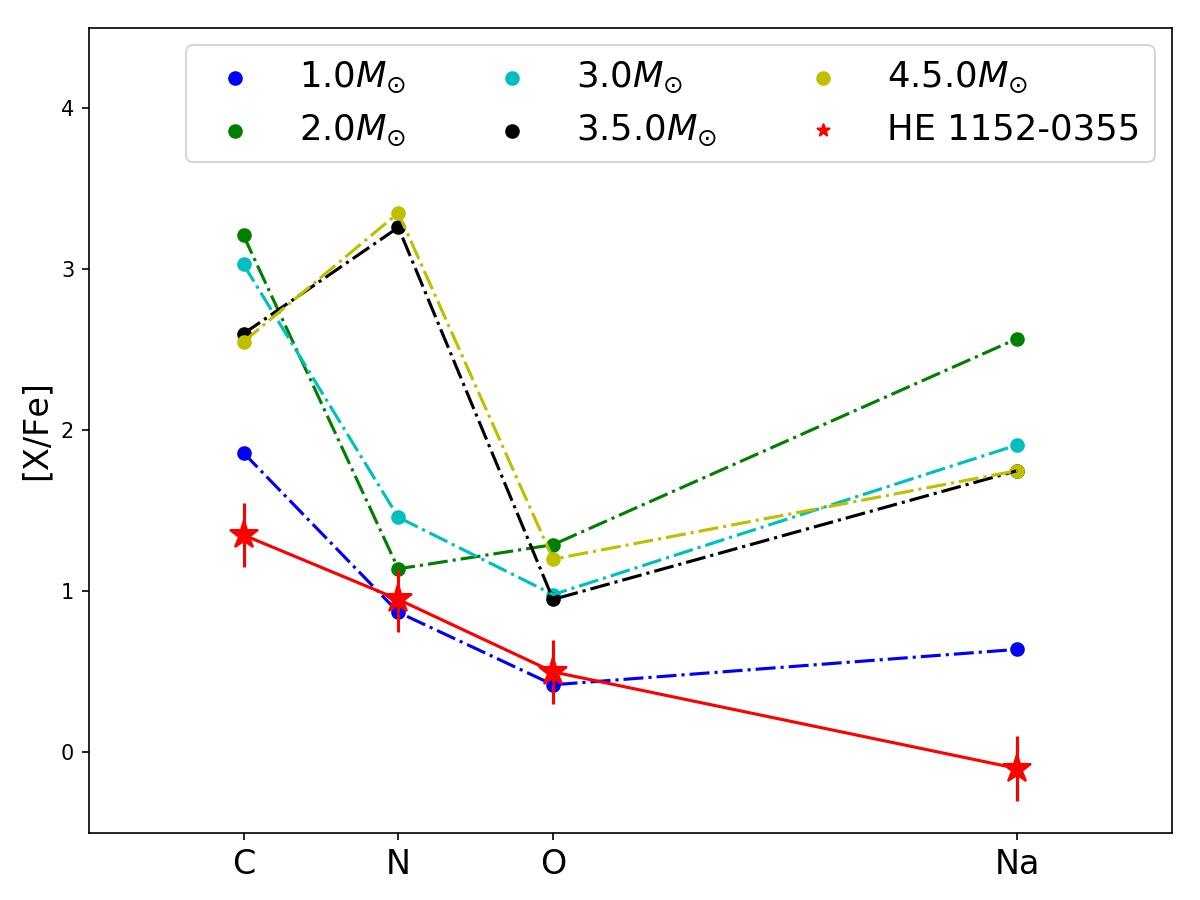
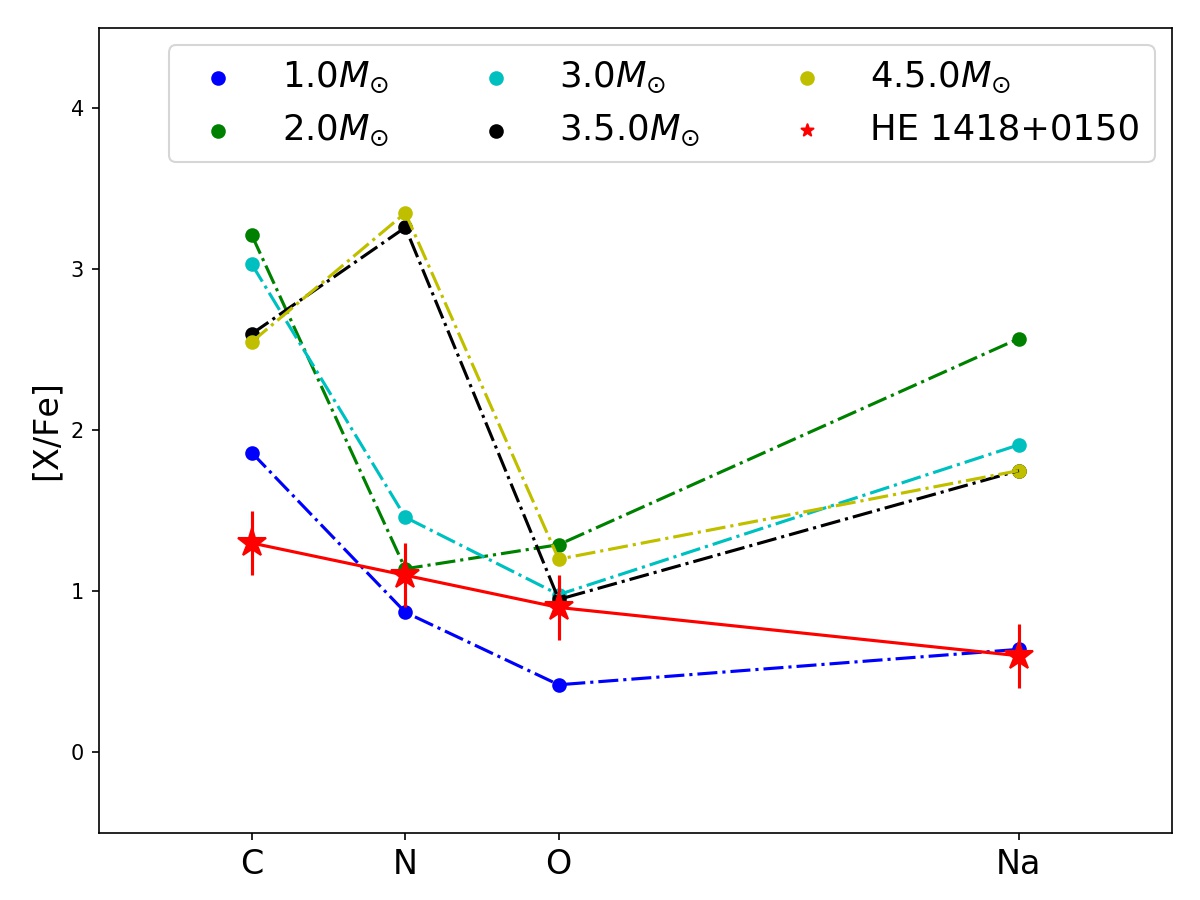
5.1 C,N,O and Na to constrain the AGB mass
The abundance pattern of C, N, O, and Na of our program stars,when compared with the models of AGB stars, indicate abundance trend with that of a low-mass AGB stars than higher mass AGB stars (refer figure 9).
 |
 |
 |
 |
 |
 |
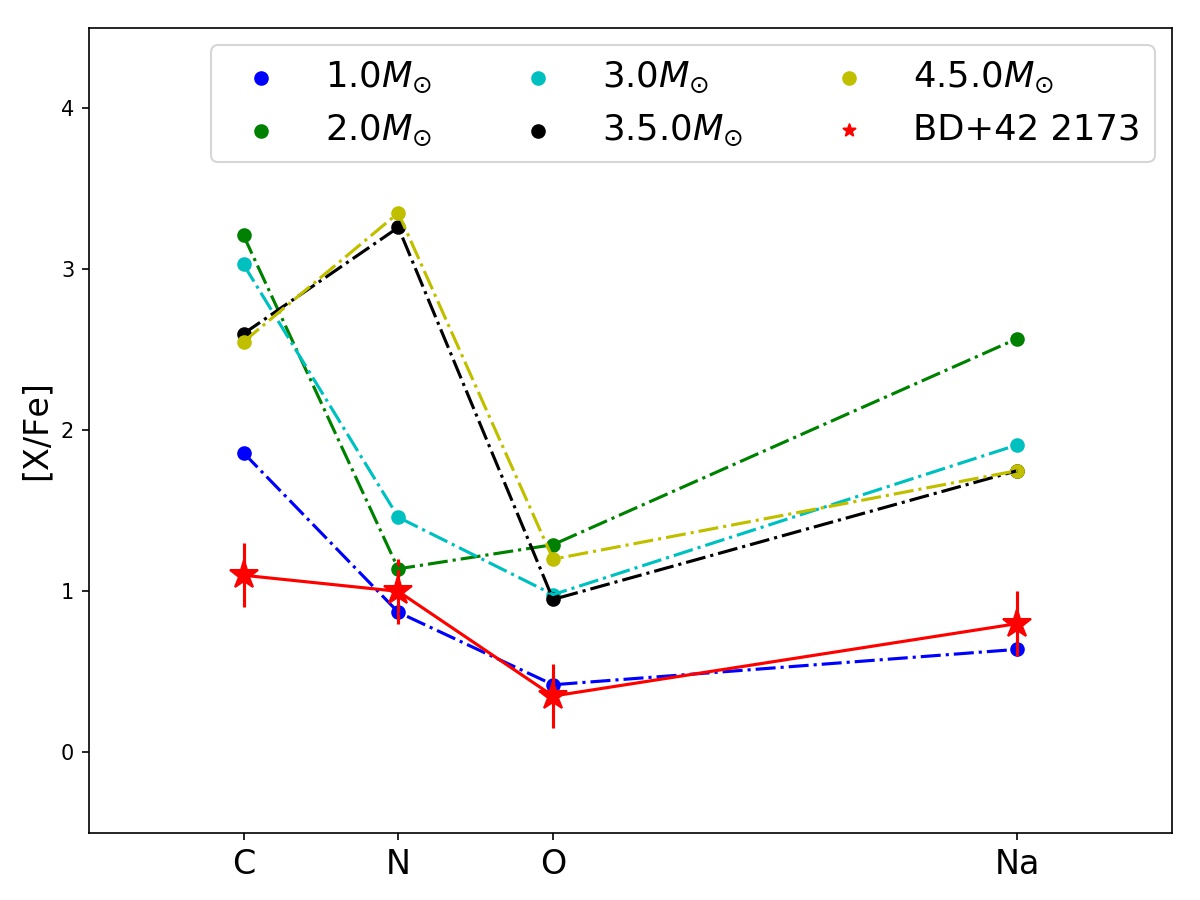 |
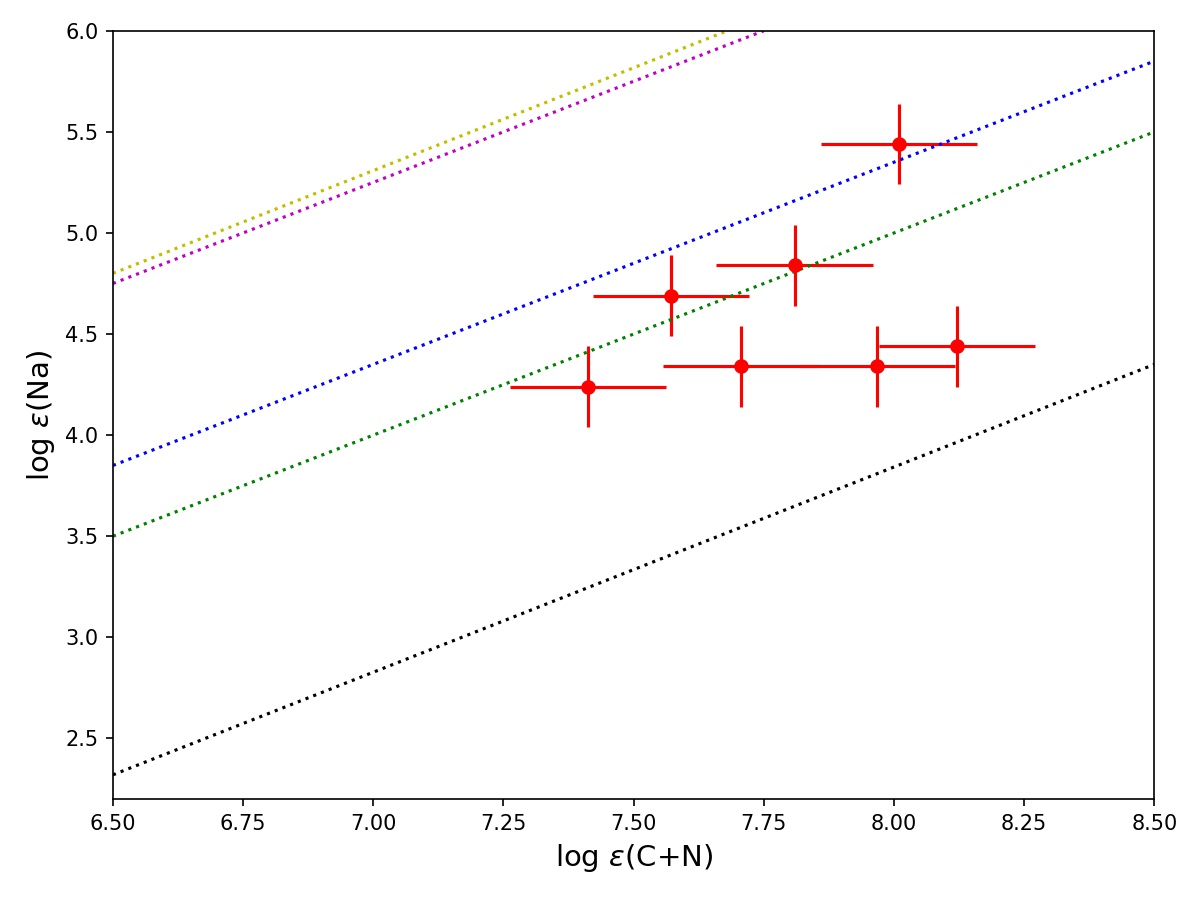
It can be seen that while the trend of observed abundance matches with that of the models, the observed abundance values are different from the model values. Several factors contribute to this difference including the nucleosynthesis and mixing in the AGB star, the mass of the accreted matter, mixing and dilution of accreted matter on the surface of the CEMP star etc. Since our program stars are all in the giant phase, the accreted matter would have experienced dilution and mixing of processed material from the deeper layers. The observed abundances are not corrected for any such mixing and dilution. The inclusion of mixing and dilution could alter the [C/N] ratios. According to Stancliffe et al. (2009), the observed C and N abundances among the CEMP giants are sensitive to the mass of the C-rich material accreted from the AGB companion. So the details of accreted mass are required to do the corrections. Hence, a direct comparison of the observed abundances with theoretical models is not performed here to constrain the actual mass of the AGB star instead we restrict our comparison to the trend of abundance distribution. The observed Na abundances of the sample is also consistent with low mass AGB contribution (refer figure 10).
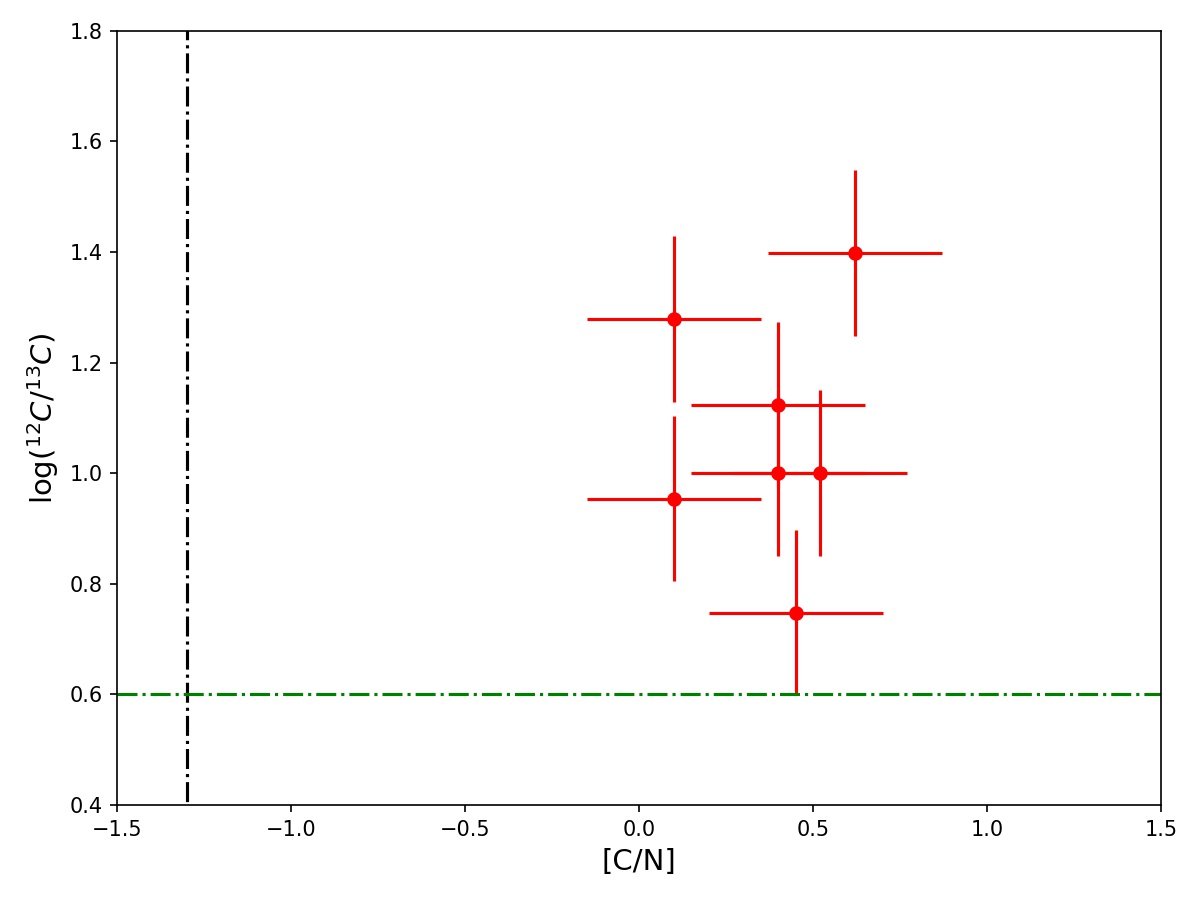
While there is an overall agreement to the trend of these elements, a discrepancy is found in the 12C/13C values.
According to low-mass AGB models, the 12C/13C should be very high upto log (12C/13C) = 3.4 for AGB stars of mass M 3M⊙
(Fishlock et al., 2014) so the observed high 12C in the CEMP
stars is considered to be due to the mass transfer from a low-mass AGB companion.
More massive AGB models (M 3M⊙) produce low carbon isotopic ratio (log (12C/13C) 2.0 ) through Hot Bottom Burning (HBB), a process that happens at the bottom of the convective envelope which converts carbon to nitrogen when the temperature
is sufficient for CN cycle. The values of carbon isotopic ratio thus obtained
are similar to the values observed in CEMP stars.
However, such massive companion stars also produce high nitrogen abundance resulting in [C/N] 0. HBB also results in the production of lighter -process elements than heavy -process elements resulting in [hs/ls] 0 which is not
found in any of the stars studied here.
This makes HBB an unlikely scenario for the observed low carbon isotopic ratios.
All the program stars in this study are giants
and they would have undergone several mixing episodes during the
first dredge-up, thermohaline mixing, extra mixing for the RGB bump, etc (Charbonnel et al., 1998; Stancliffe et al., 2007; Smiljanic et al., 2009).
This changes the surface composition of the carbon and carbon isotopes
that was originally accreted from the AGB companion and would finally
result in an intermediate nitrogen enhancement (still [C/N] 0.1)
as well as the low isotopic ratio (Proffitt &
Michaud, 1989; Barbuy et al., 1992; Keller
et al., 2001; Denissenkov
& Pinsonneault, 2008) (refer figure 11).
While the mixing in the CEMP star is put forward as one of the reasons for the low 12C/13C ratio, the CEMP stars in main-sequence or turn-off stage are also identified to be showing low carbon isotopic ratios (Aoki et al., 2002; Lucatello
et al., 2003; Masseron et al., 2010). So the measured low 12C/13C ratio could be the resultant of some extra mixing in the companion AGB star itself.
The concept of Cool Bottom Processing (CBP) can also be invoked
to explain the moderately high nitrogen abundance
and low 12C/13C.
In CBP, the material from the base of the convective envelope
is mixed into the radiative region located on top
of the H-burning shell where material captures protons and then
brought back to the envelope thereby leaving CN processed materials
at the surface of the star (Wasserburg et al., 1995). Nitrogen and 13C are being the byproducts of the CN cycle, a complete
CN cycle produces 12C/13C 4 and [C/N] 1.3.
Thus the observed low 12C/13C and [C/N] values
can be obtained when the carbon is partially processed
possibly in the H-burning shell before reaching the
convective envelope. Such a mechanism could explain the moderately high nitrogen abundance and low carbon isotopic ratio observed in CEMP stars.
CBP is hypothesized to occur in the RGB phase of stars
having M (Charbonnel, 1995)
and in AGB stars where an extra mixing happens at the bottom of the
AGB envelope, and a part of this envelope material turns carbon
into nitrogen through CN cycle (Nollett
et al., 2003; Lugaro
et al., 2017).
Though the physical mechanism causing the CBP is unclear,
an extra mixing process is required to explain the observed abundances,
which include the instabilities generated due to the
molecular weight inversion induced by 3He burning (Eggleton et al., 2008)
and the magnetic buoyancy induced by a stellar dynamo
(Busso et al., 2007; Palmerini et al., 2008).
For the case of oxygen abundance, low-metallicity AGB stars are expected to produce an elevated
oxygen abundance from 12C(, )16O reaction
activated due to the hotter conditions in the helium burning shell.
But the oxygen yields predicted by different models do not agree with
each other. Herwig (2004) find that the oxygen abundance
decreases with mass of the AGB star due to the dilution in the AGB
envelope. Though the dredge up matter brings more oxygen to the surface,
the dilution dominates the dredge up when the mass increases.
Karakas &
Lattanzio (2007) found a contradicting scenario.
According to their models, as the mass increases, in the He shell, the reaction 12C(, )16O is favored by the competition between the dilution and the hotter conditions and around 3M⊙,
maximum oxygen yield is predicted.
All the models assume a solar scaled abundance for the key
elements to start with. The amount of the elements produced
during AGB evolution is so high that the initial assumptions do
not affect the final composition. In contrary, the oxygen is produced in the scale of [O/Fe]0.5
in metal-poor stars (Lucatello et al., 2011) which is
greatly influenced by the initial composition.
Another scenario which can account for observed CNO abundance, especially
the low carbon isotopic ratio
and moderately high nitrogen abundance, is the Proton Ingestion Episodes
(PIEs). At the beginning of the thermally pulsating phase of low-mass low-metallicity AGB stars, the convective envelope
extends up to the base of the H-rich envelope and the
protons get mixed in to the convective shell which are captured by 12C. This produces 13C and 14N through various reactions
which results in a deep-Third Dredge Up (TDU). After the deep TDU,
the model follows the standard AGB evolution. Each thermal pulses
bring the synthesized material to the surface of the stellar envelope
resulting in constantly varying the surface composition. The observed
high 13C is also produced in the PIE. The final abundance
pattern at each TDU phases resembles to the CNO abundance pattern
exhibited by the stars in this study (refer figures 6 and 7 in Cristallo
et al. (2009).
Regardless of the abundance pattern exhibited, certain uncertainties
are also associated with the PIEs.
Enhancement in the alpha elements can suppress the PIEs as the proton
ingestion requires lower CNO abundance to break the entropy barrier.
Also the mixing and nucleosynthetic mechanisms in the convective
regions do not account for the assumptions of mixing length theory
and one dimensional spherically symmetric evolution (Cristallo
et al., 2009; Herwig
et al., 2011).
Nevertheless, we can associate the PIEs with a few TDUs contributing to the observed
CNO abundances and low isotopic ratio in CEMP stars.
5.2 Neutron capture elements to constrain the nucleosyntheses in the companion AGB star
.
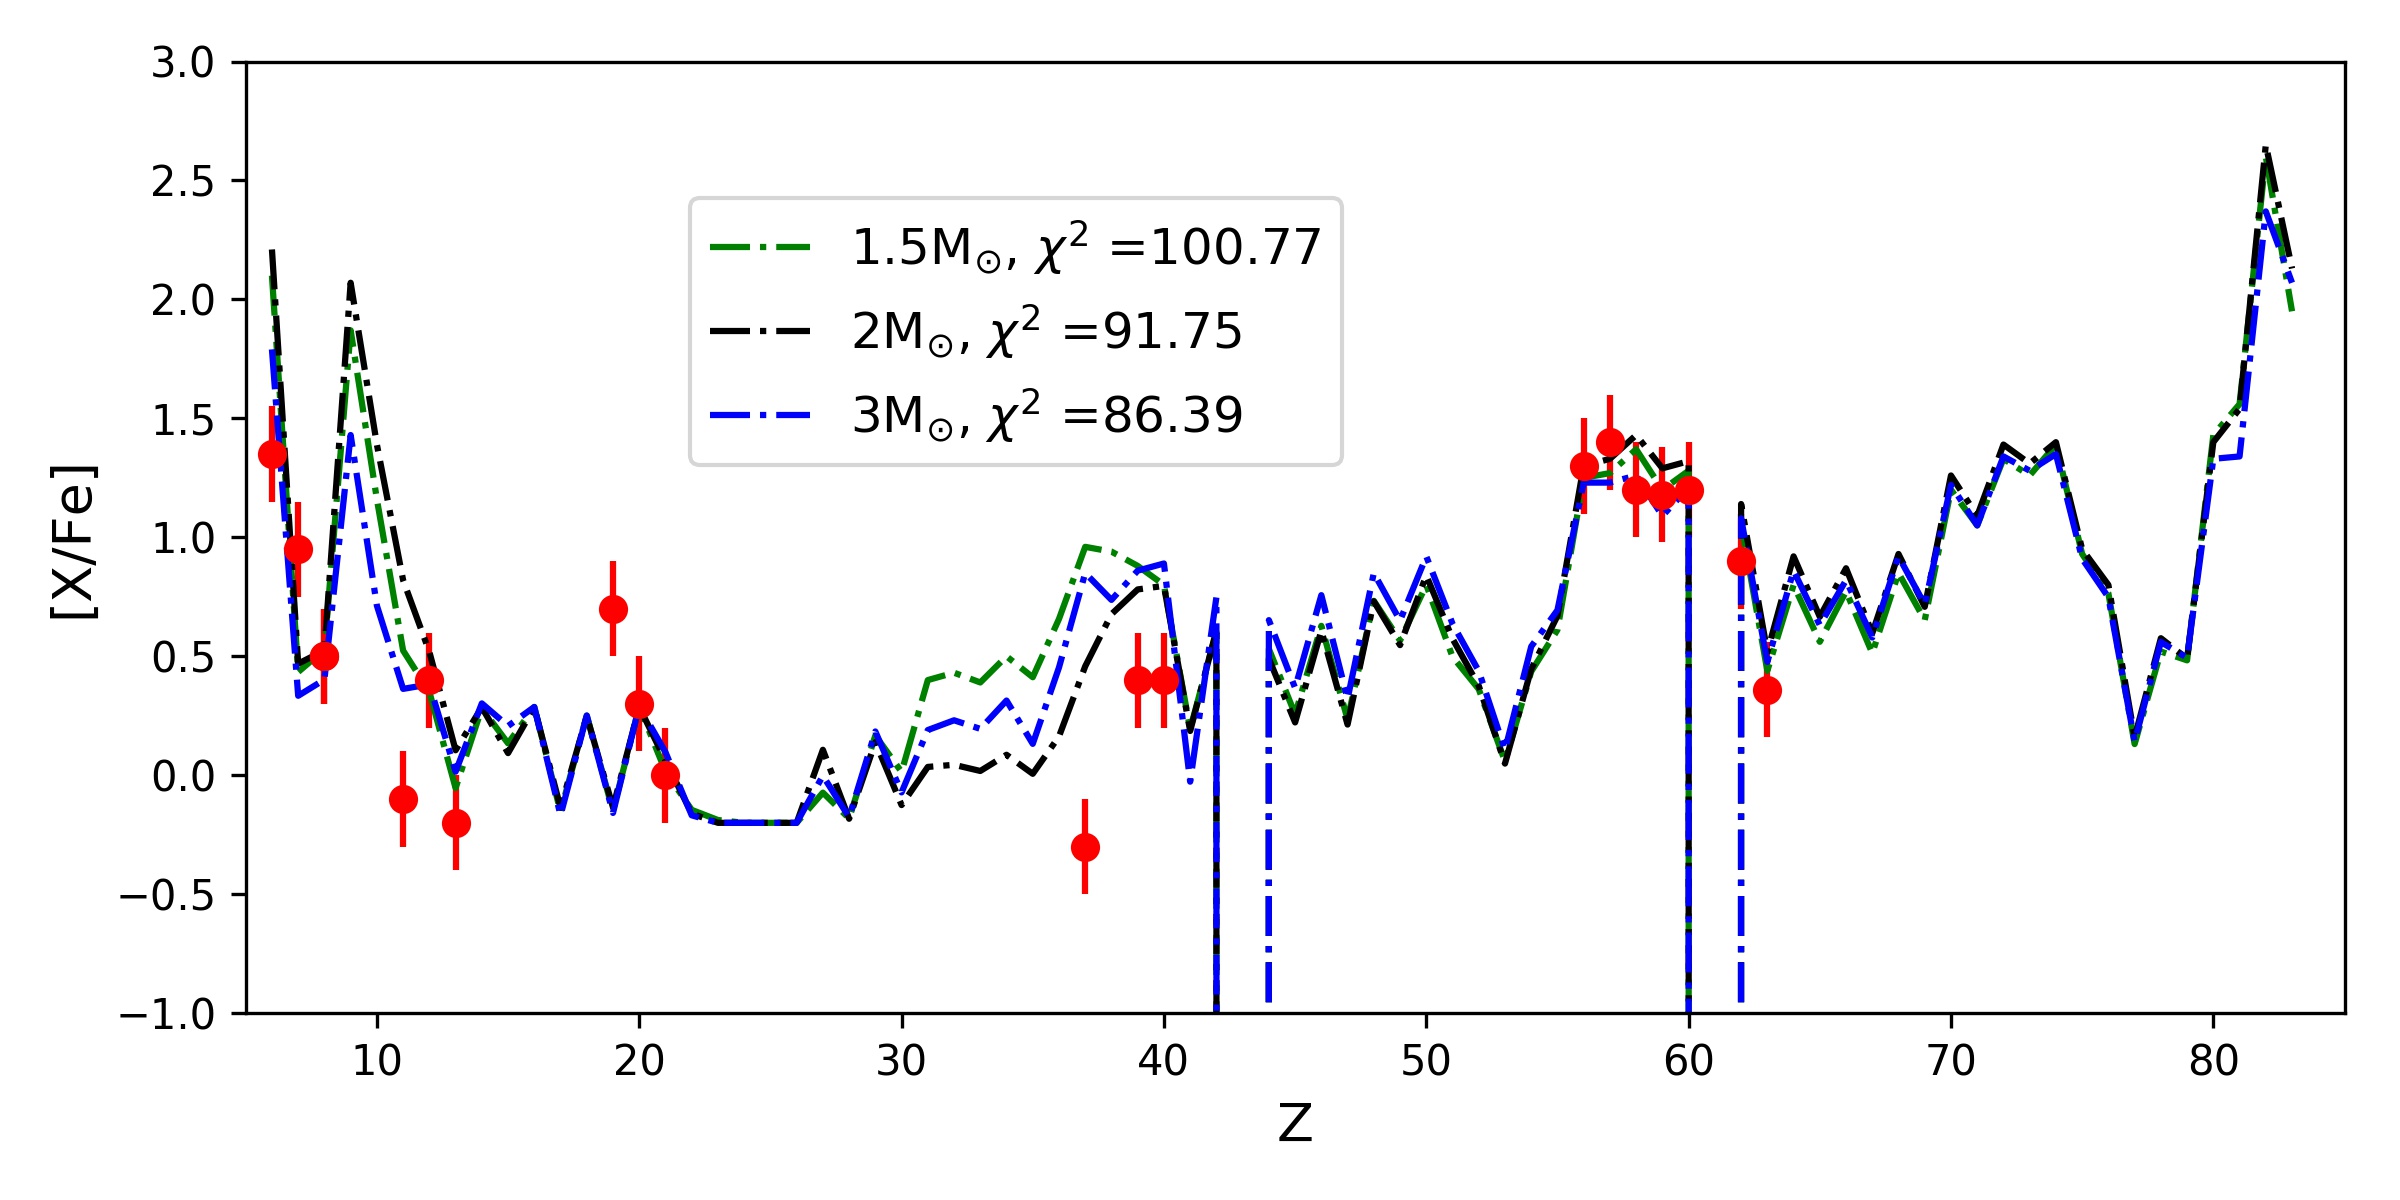
All the program stars in this study are rich in both -process and -process elements. Among the program stars, HE 1152-0355 satisfies the criteria to be classified as a CEMP- star. So the abundance pattern of this star is compared with that from low-mass AGB models. We compared the AGB models from F.R.U.T.Y (Full-network repository of Updated Isotopic Tables & Yields) database (Cristallo et al., 2011) where we chose models comparable to the metallicity of HE 1152-0355. [Rb/Zr] being an important tracer for the mass of the companion AGB stars in CEMP- population, we use the [Rb/Zr] ratio of the star to constrain the masses of the models. Since the star exhibits a low [Rb/Zr] ratio ([Rb/Zr] -0.7), we restricted the comparison to only low-mass models which is also consistent with the results from the section 5.1. The fitting is done with the available models (1.5M⊙, 2M⊙, 3M⊙) in the database and is shown in the figure 12. All these models exhibit similar distribution for most of the elements and the abundances of -elements in HE 1152-0355 matches with all the model values within the uncertainty. Since we do not have the information of mixing and dilution on the surface of the CEMP star and the efficiency of mass-transfer from the companion AGB star, we restrict our analysis to comparing the model values with the observed ones instead of addressing the reasons behind the difference in various abundances with the model predicted values. Except HE 1152-0355, all the stars have [Ba/Fe] 1.0, [Eu/Fe] 1.0 and [Ba/Eu] 0 (refer figure 13).
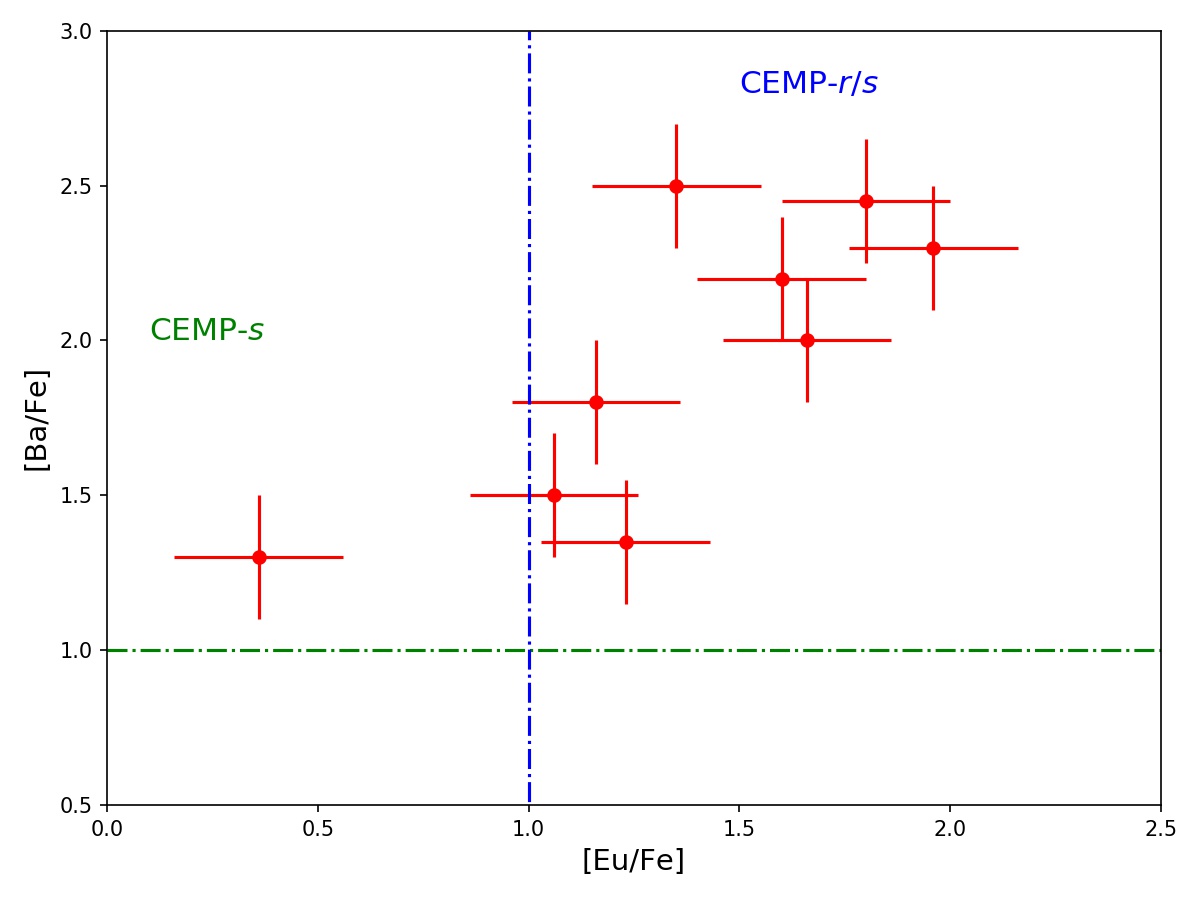
Thus we classify these stars as CEMP-. (refer table 2).
Various theories have been put forward to explain the origin of both - and -process elements in CEMP- stars. Eu being the r-process representative (Beers & Christlieb, 2005), its enhancement along with the enhancement in Ba, the -process representative, cannot be explained with standard -process in AGB stars (Lugaro et al., 2012).
 |
 |
 |
 |
 |
 |
While the -process requires neutron densities, 106 - 1010 cm-3 (Busso et al., 1999), the r-process requires higher than 1020 cm-3 (Goriely et al., 2005; Thielemann et al., 2011). So different formation sites have been proposed to explain the origin of these elements. In which, the carbon and -process elements originate from the AGB companion similar to that in CEMP- stars where the birth cloud of the binary system was previously enriched with the r-process elements from supernovae explosions and/or neutron star mergers (Bisterzo et al., 2012).
Recent computations explored an intermediate neutron densities to - and -processes and they were successful in producing the abundance patterns of CEMP- stars (Hampel et al., 2016; Denissenkov
et al., 2017). The neutron-capture process in this intermediate neutron density ( 1015 cm-3) is called as -process and is activated by the rapid ingestion
of a significant amount of H in He-burning convective regions (Cowan &
Rose, 1977).
Even though the nucleosynthetic sites for -process is still a debate, the proposed sites include: low-mass, low-metallicity AGB stars (Campbell &
Lattanzio, 2008; Campbell
et al., 2010; Cruz
et al., 2013; Cristallo et al., 2016), super-AGB stars (Doherty et al., 2015; Jones et al., 2016), evolved low-mass stars (Herwig
et al., 2011; Hampel et al., 2016, 2019), rapidly accreting white dwarfs (RAWD) in closed binary systems (Herwig et al., 2014; Denissenkov
et al., 2017) and massive metal-poor stars (Banerjee
et al., 2018; Clarkson et al., 2018).
We compared the neutron-capture elemental abundance pattern of our program stars with available -process models of similar metallicity (Hampel et al., 2016; Denissenkov
et al., 2019).
The figure 11 and 12 in Denissenkov
et al. (2019) predicts over enhancement for neutron-capture elements than the observationally derived values for our program stars. So the abundances are not matching with the RAWD models values (Denissenkov
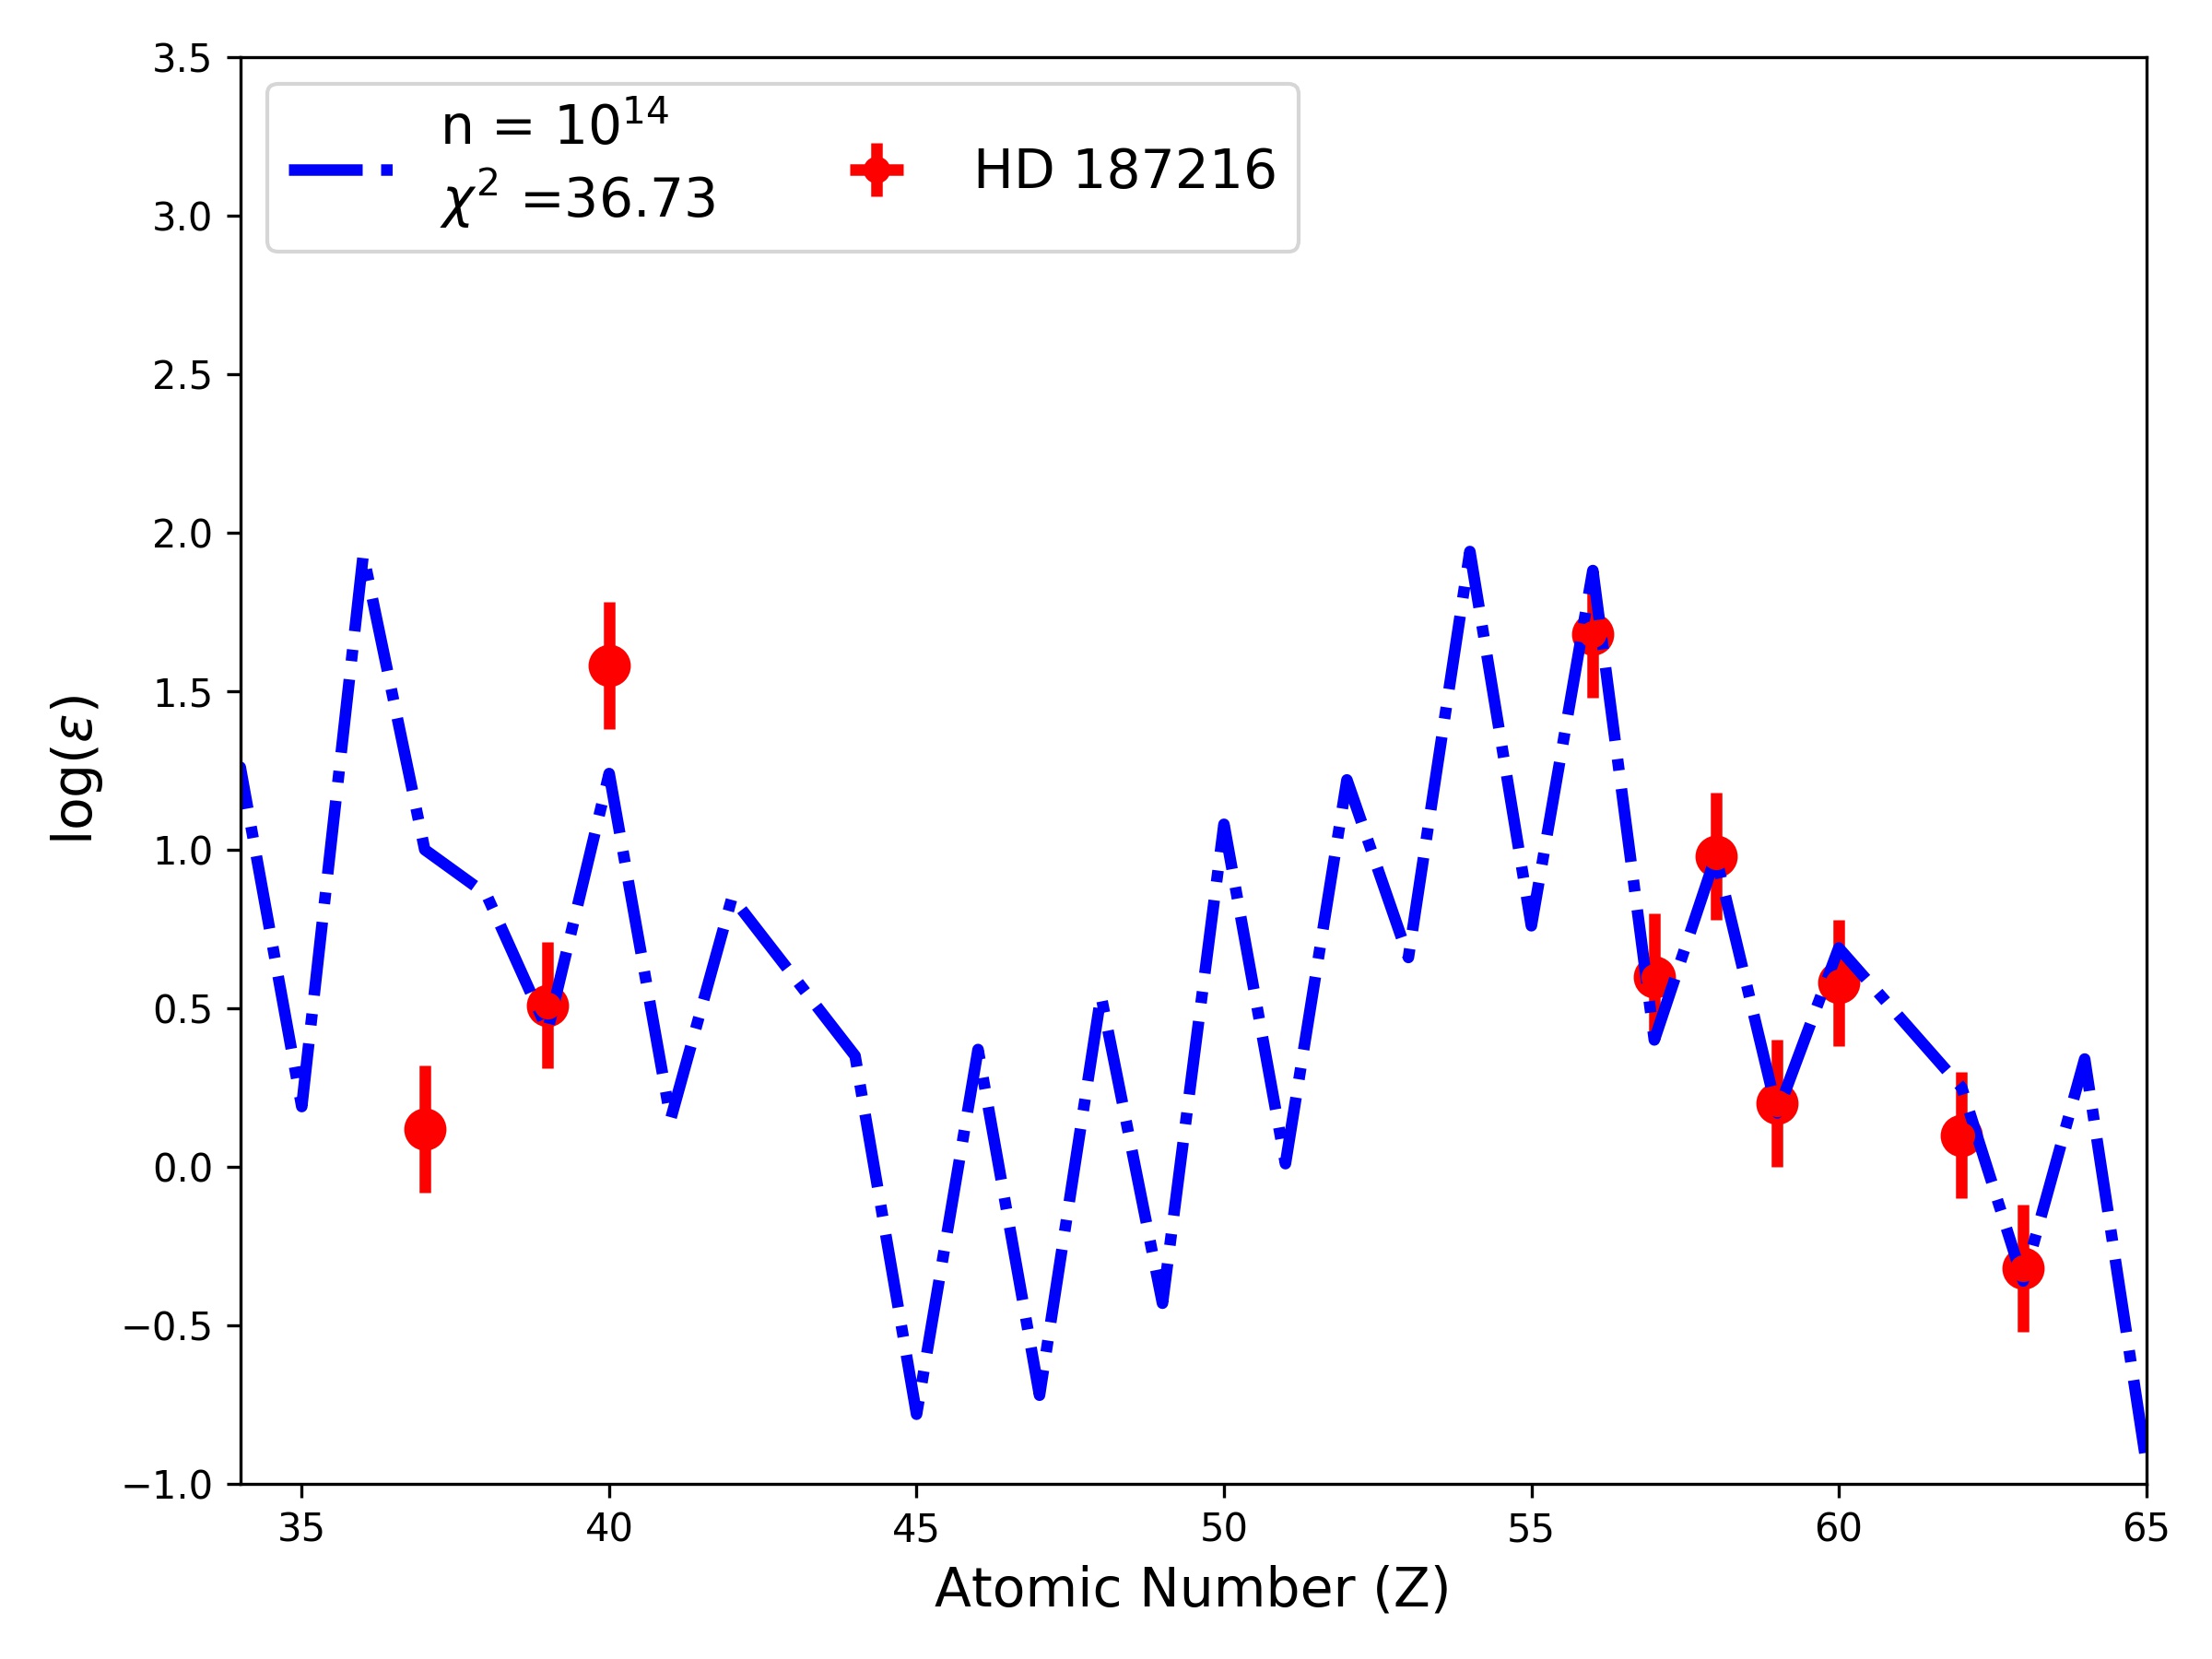
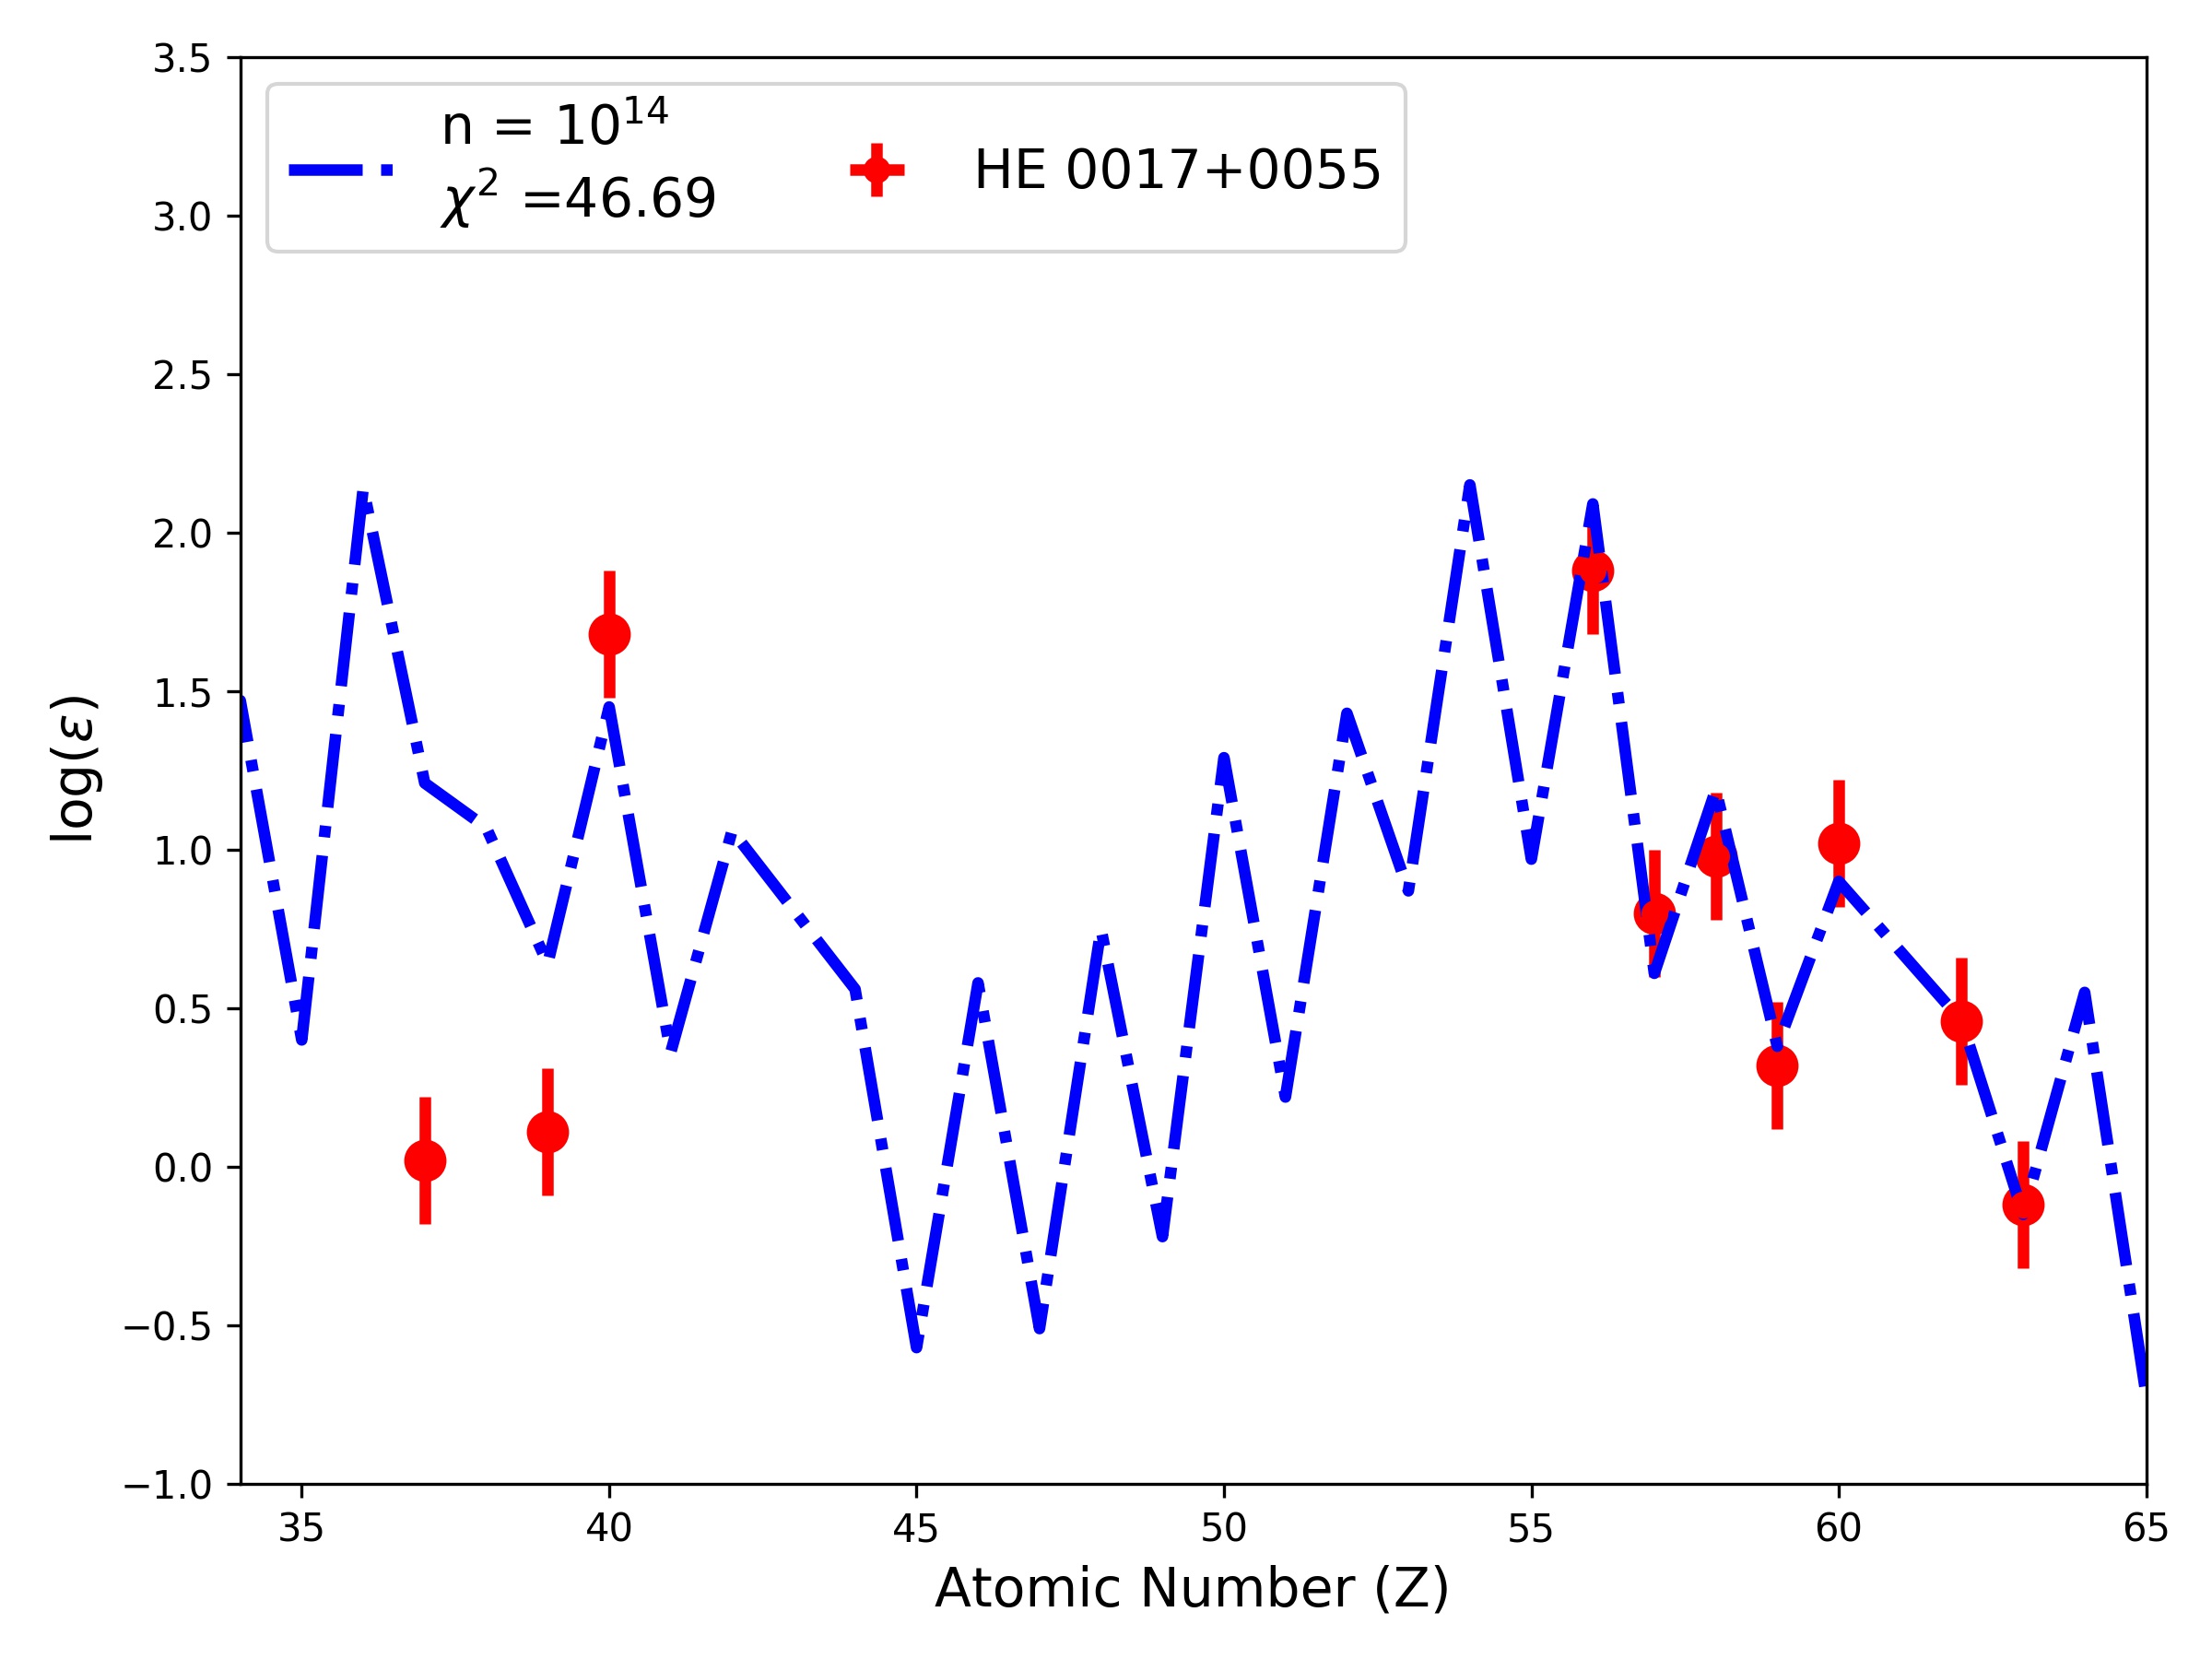
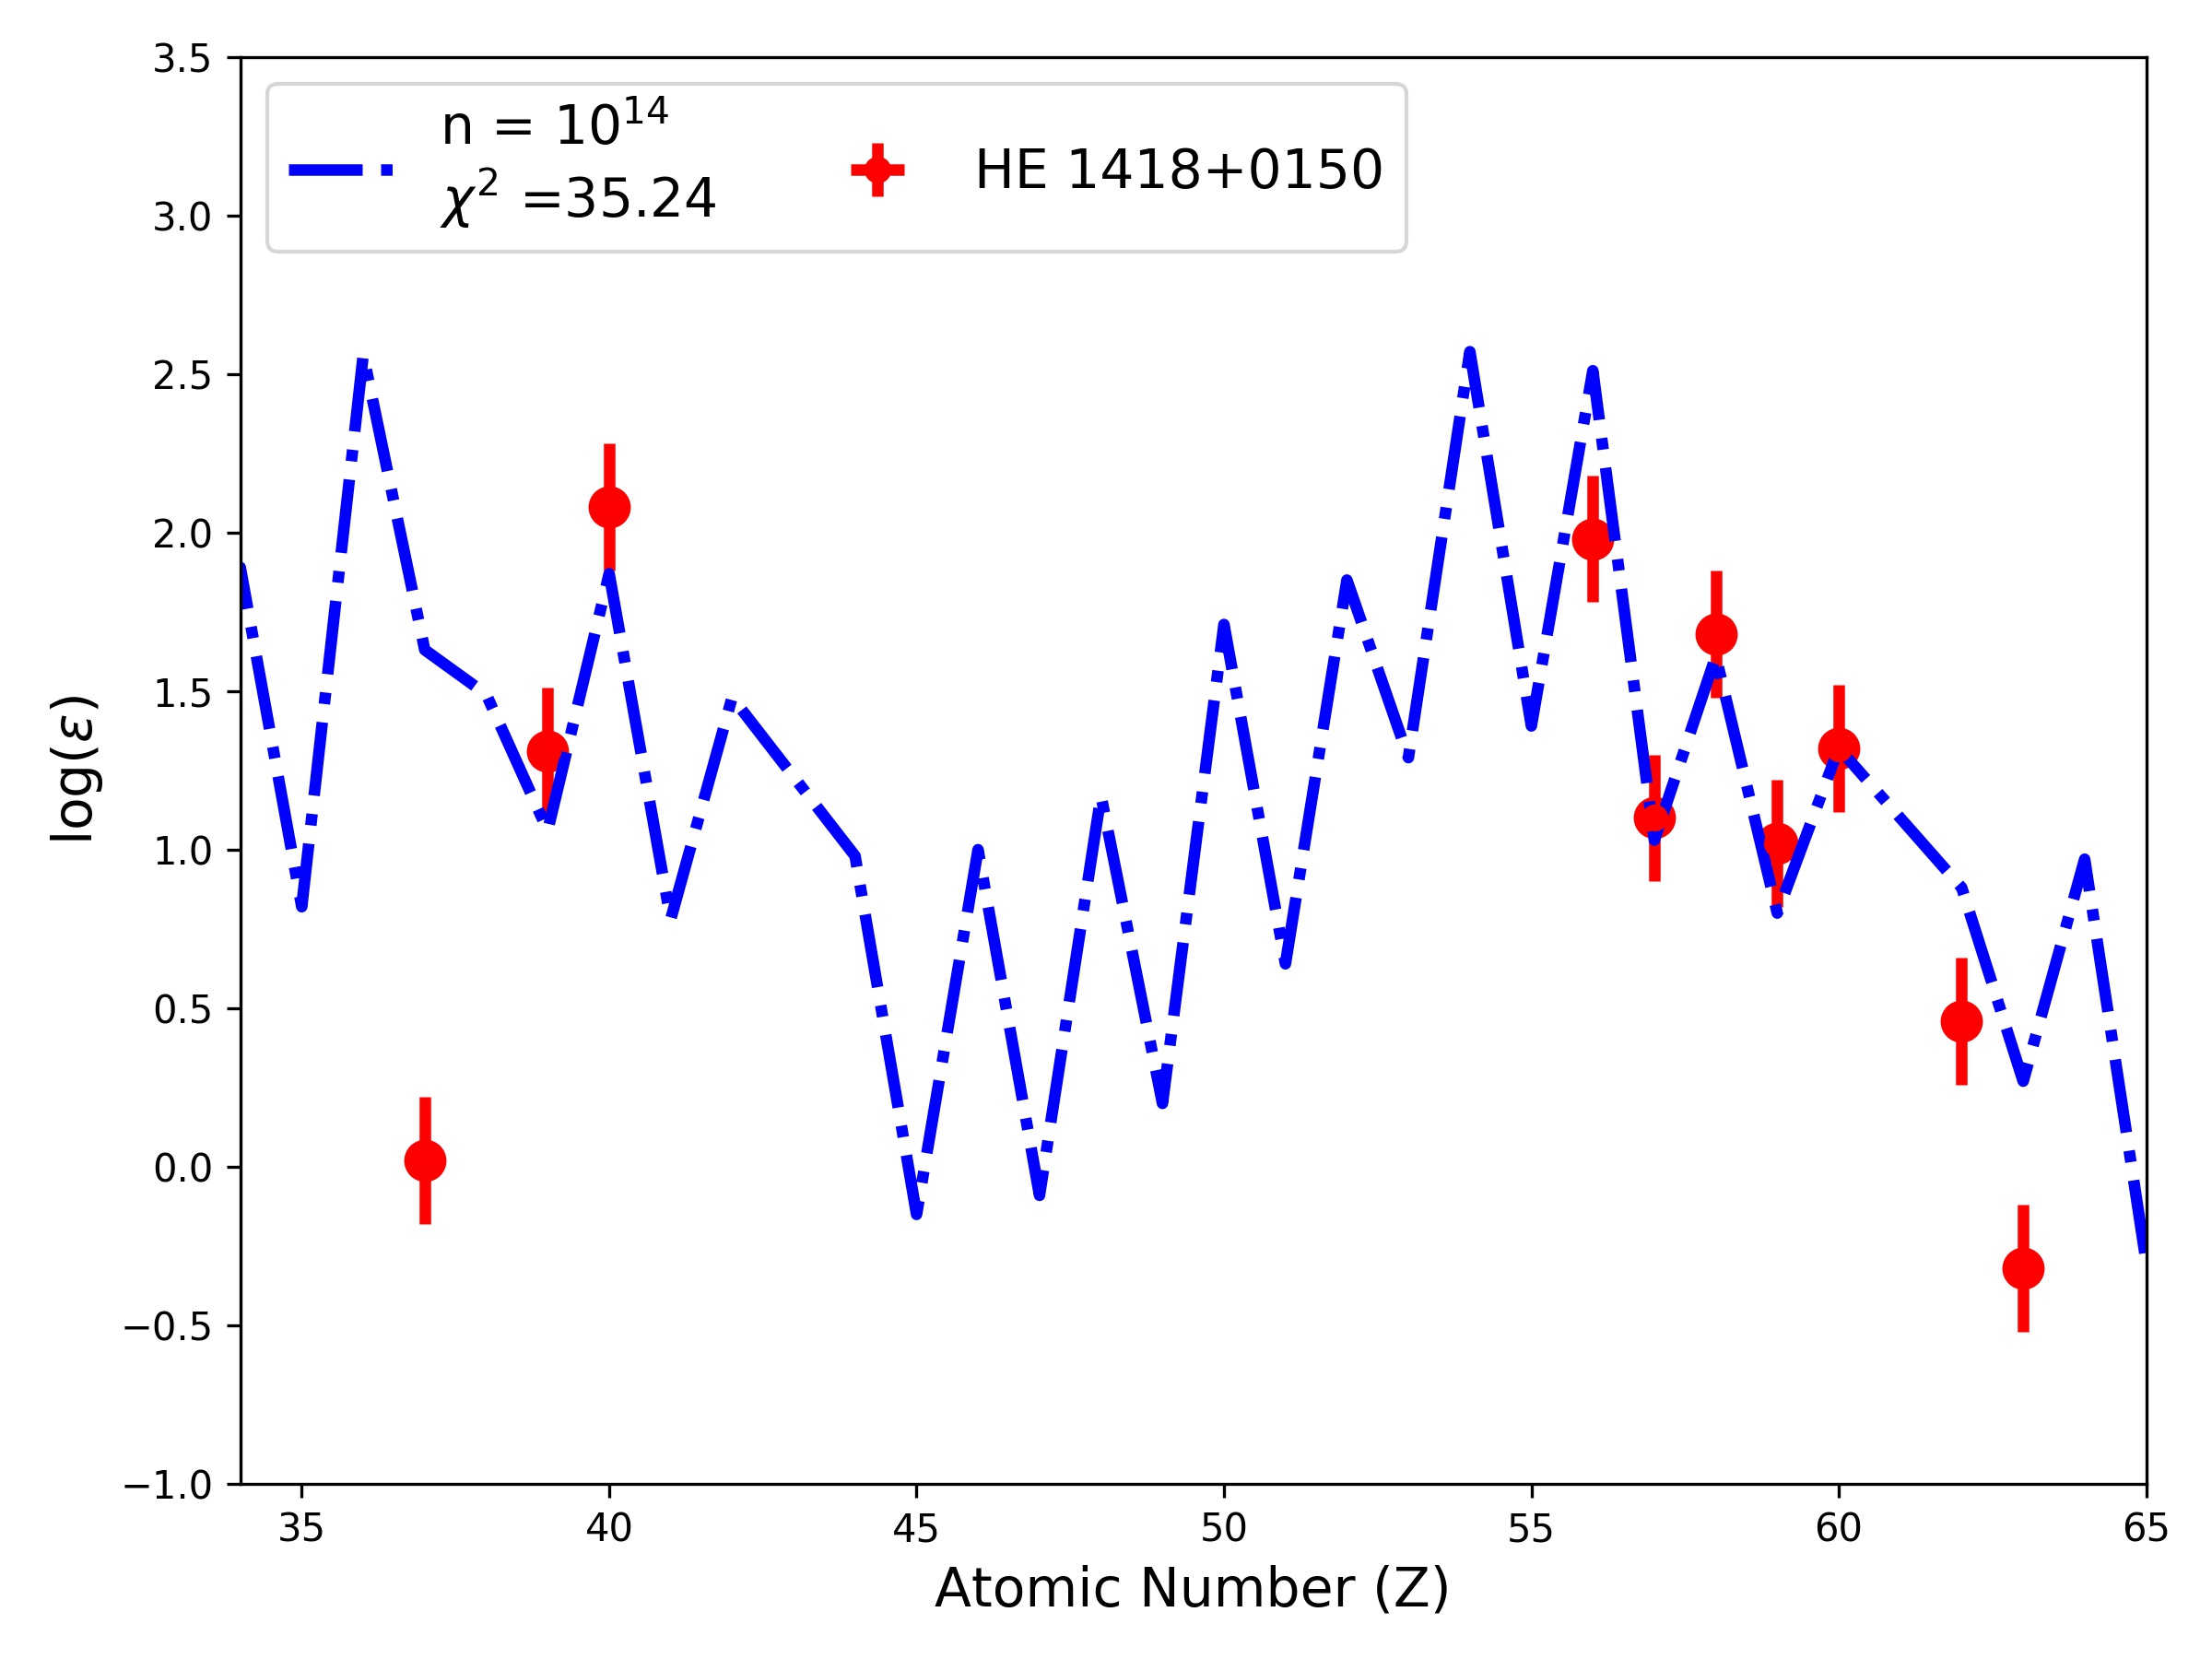
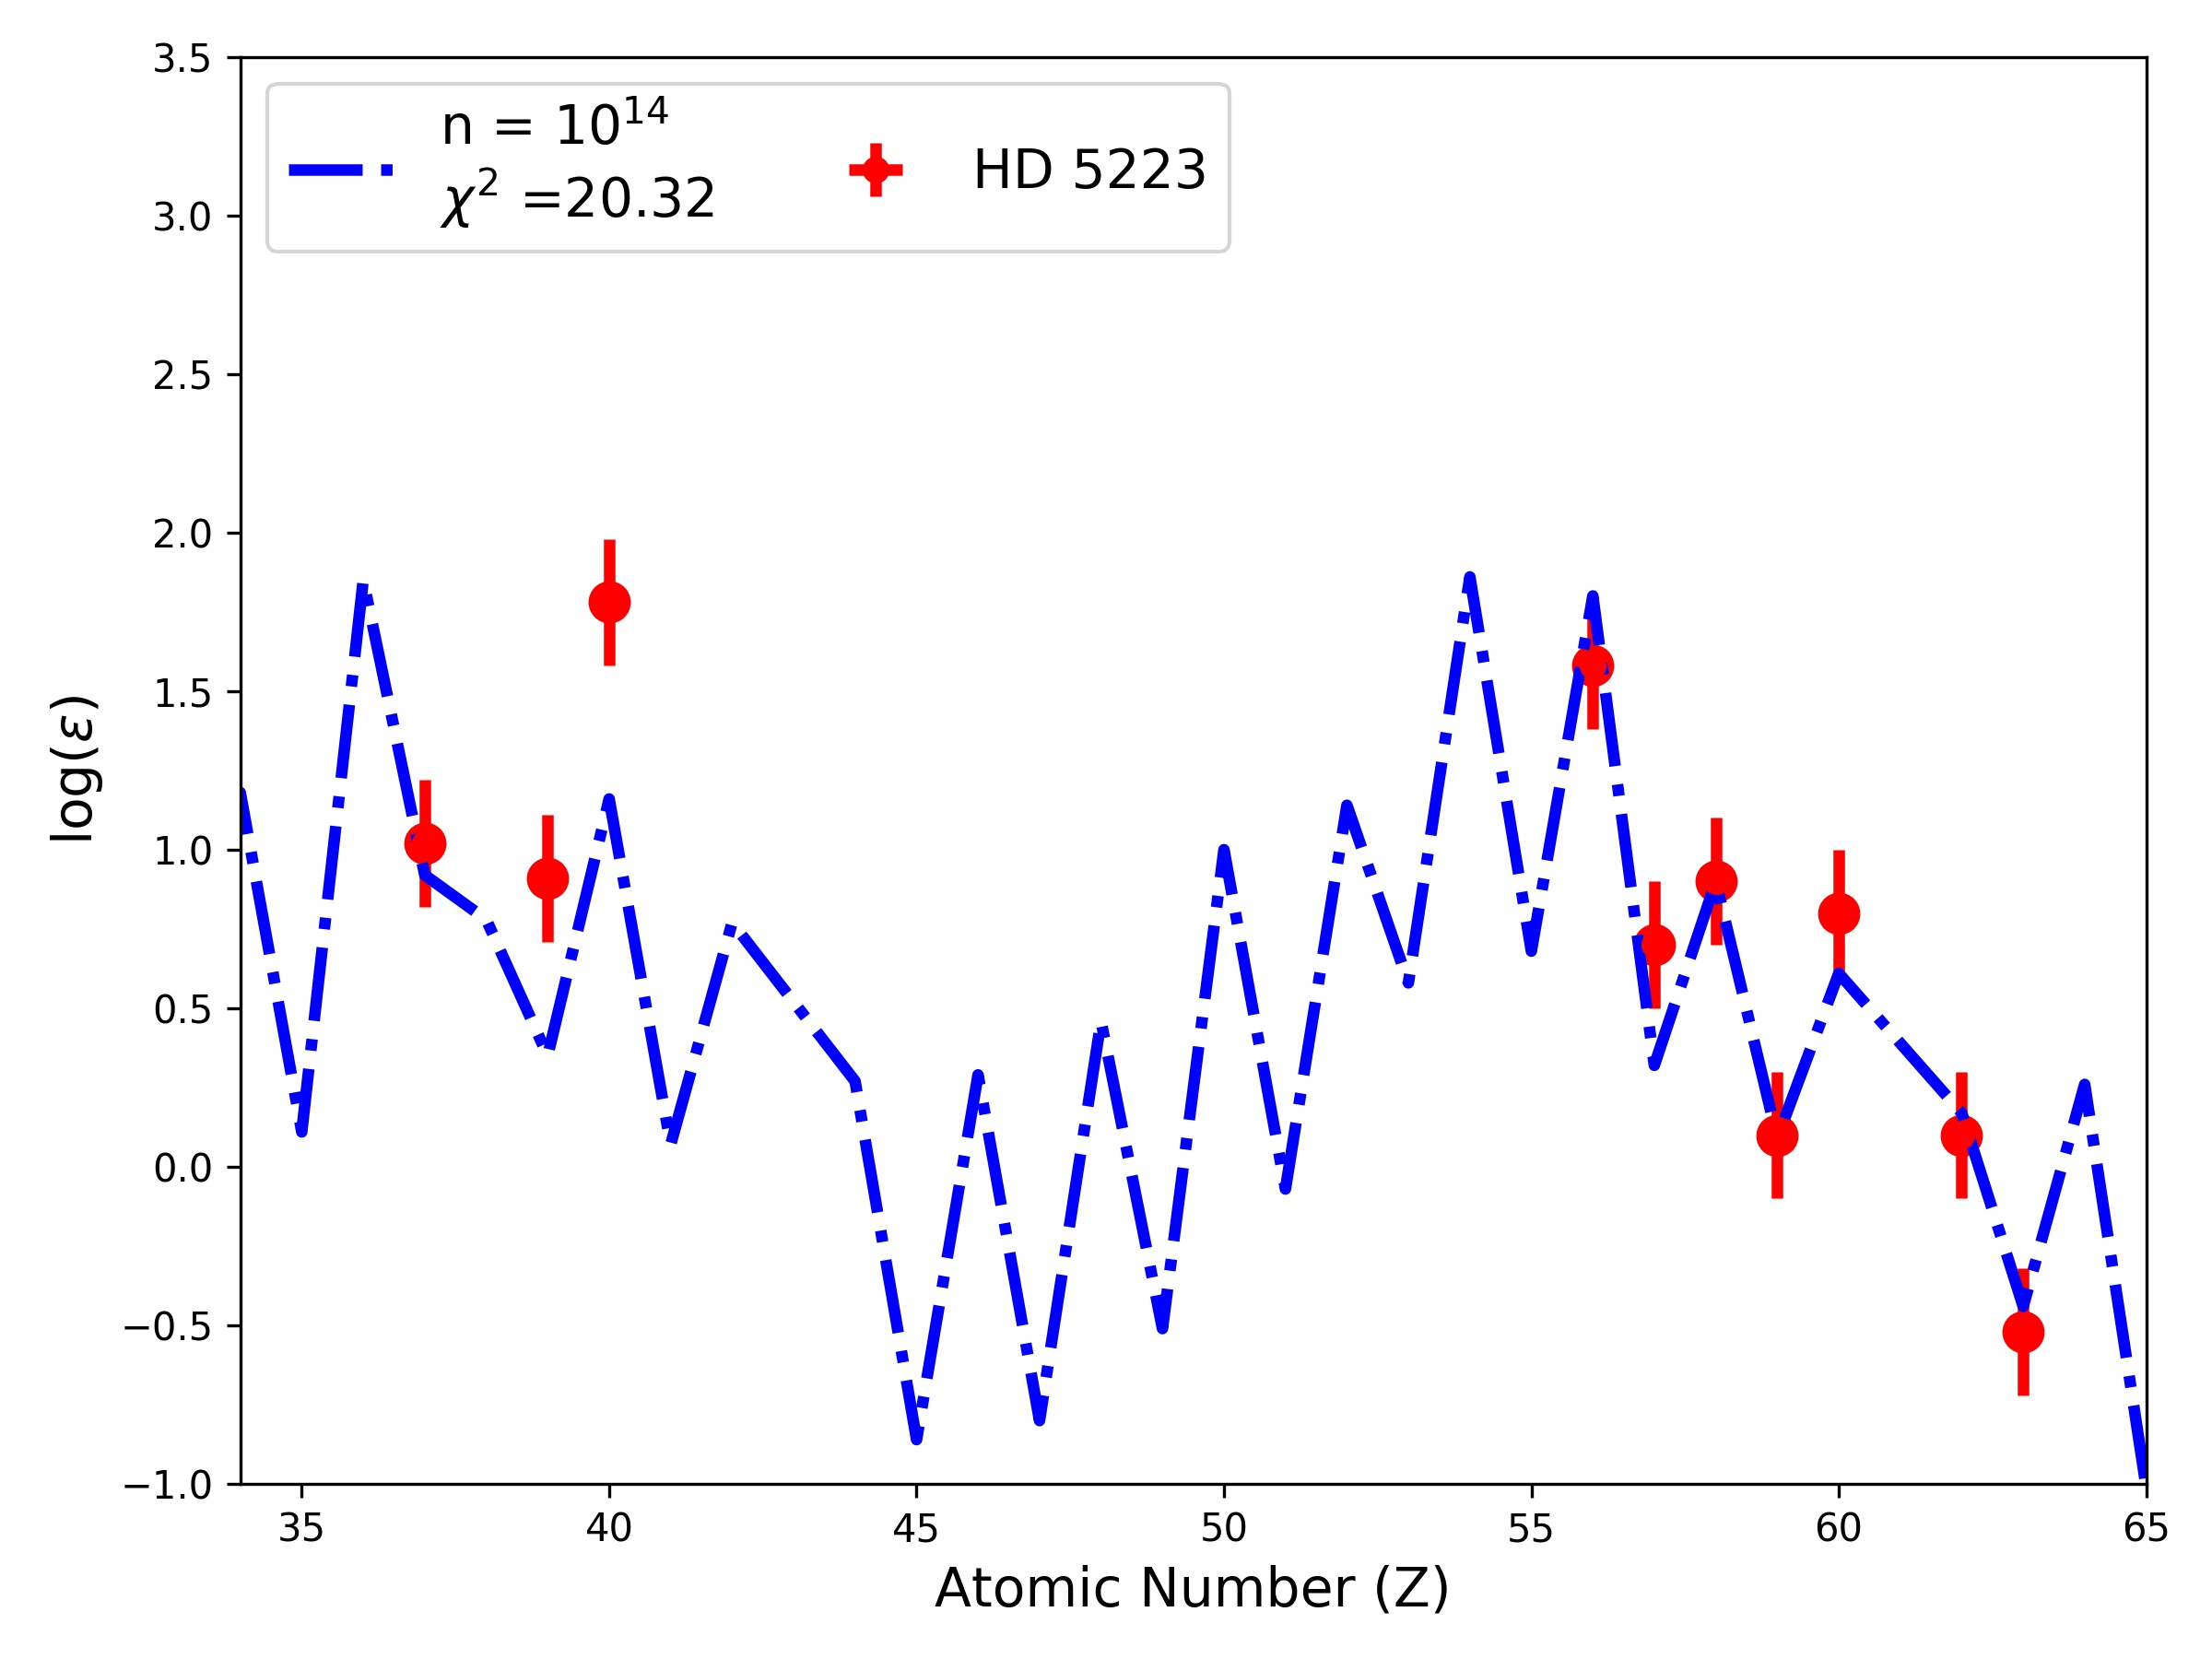
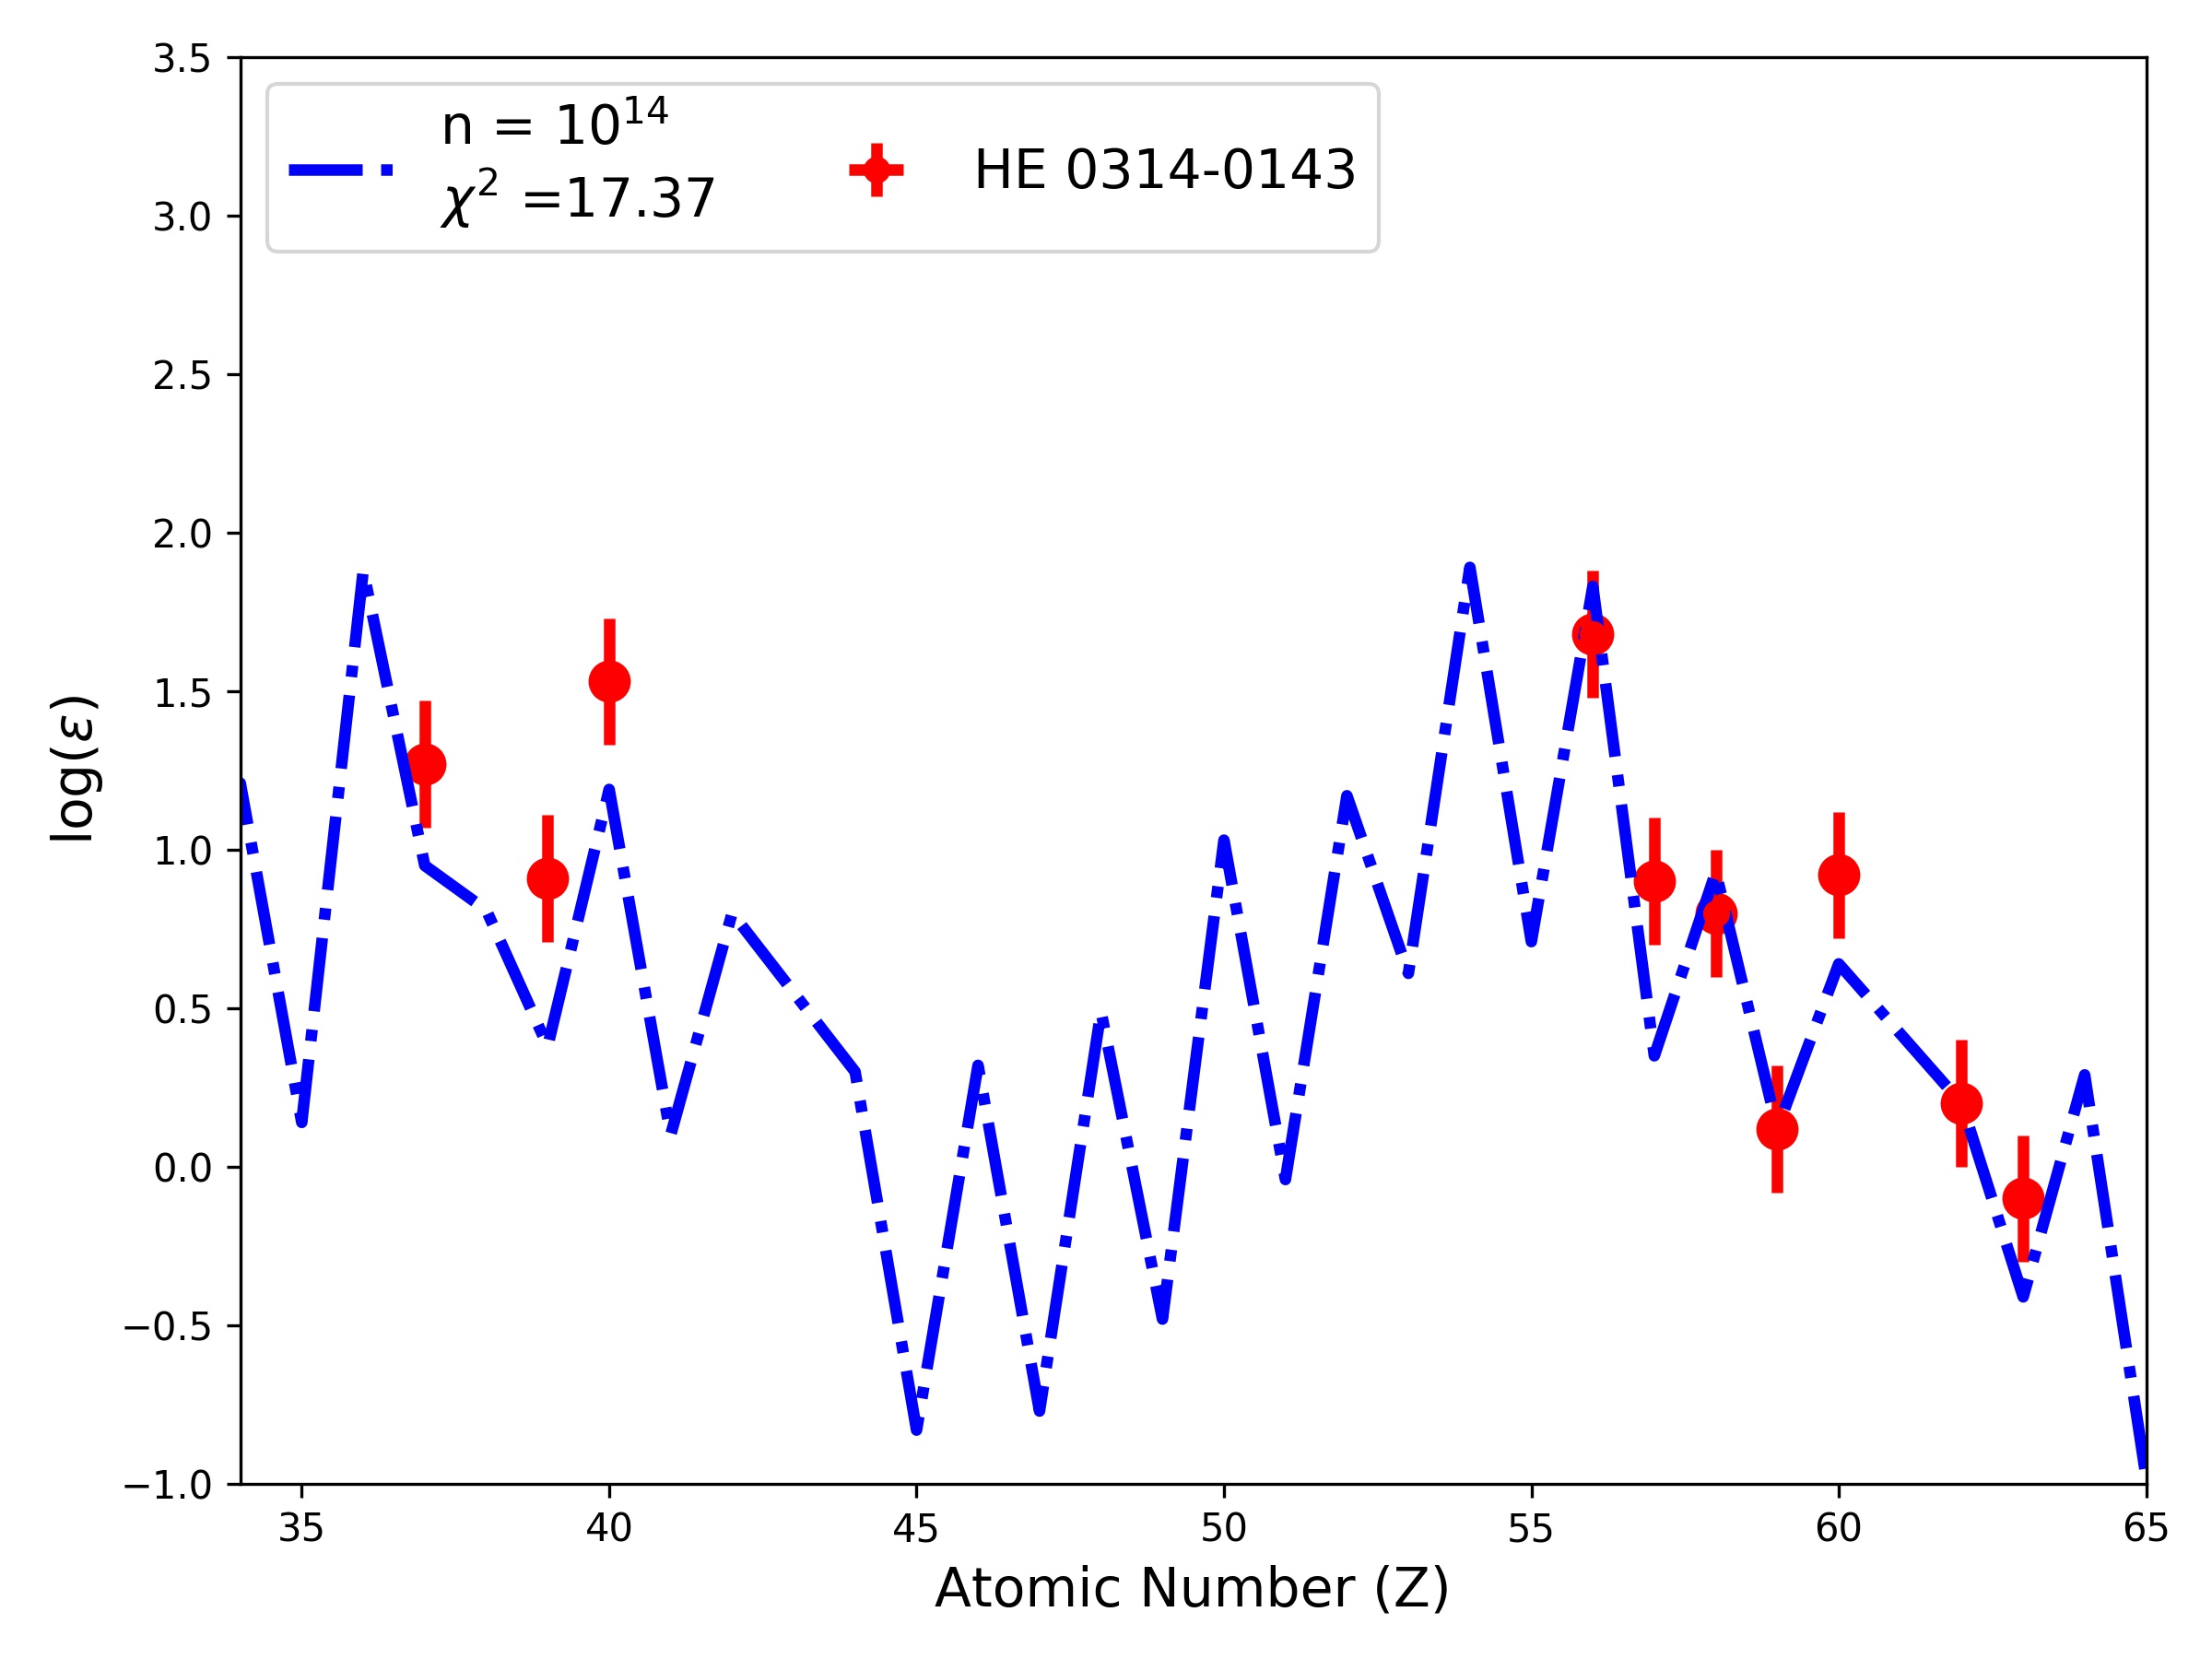
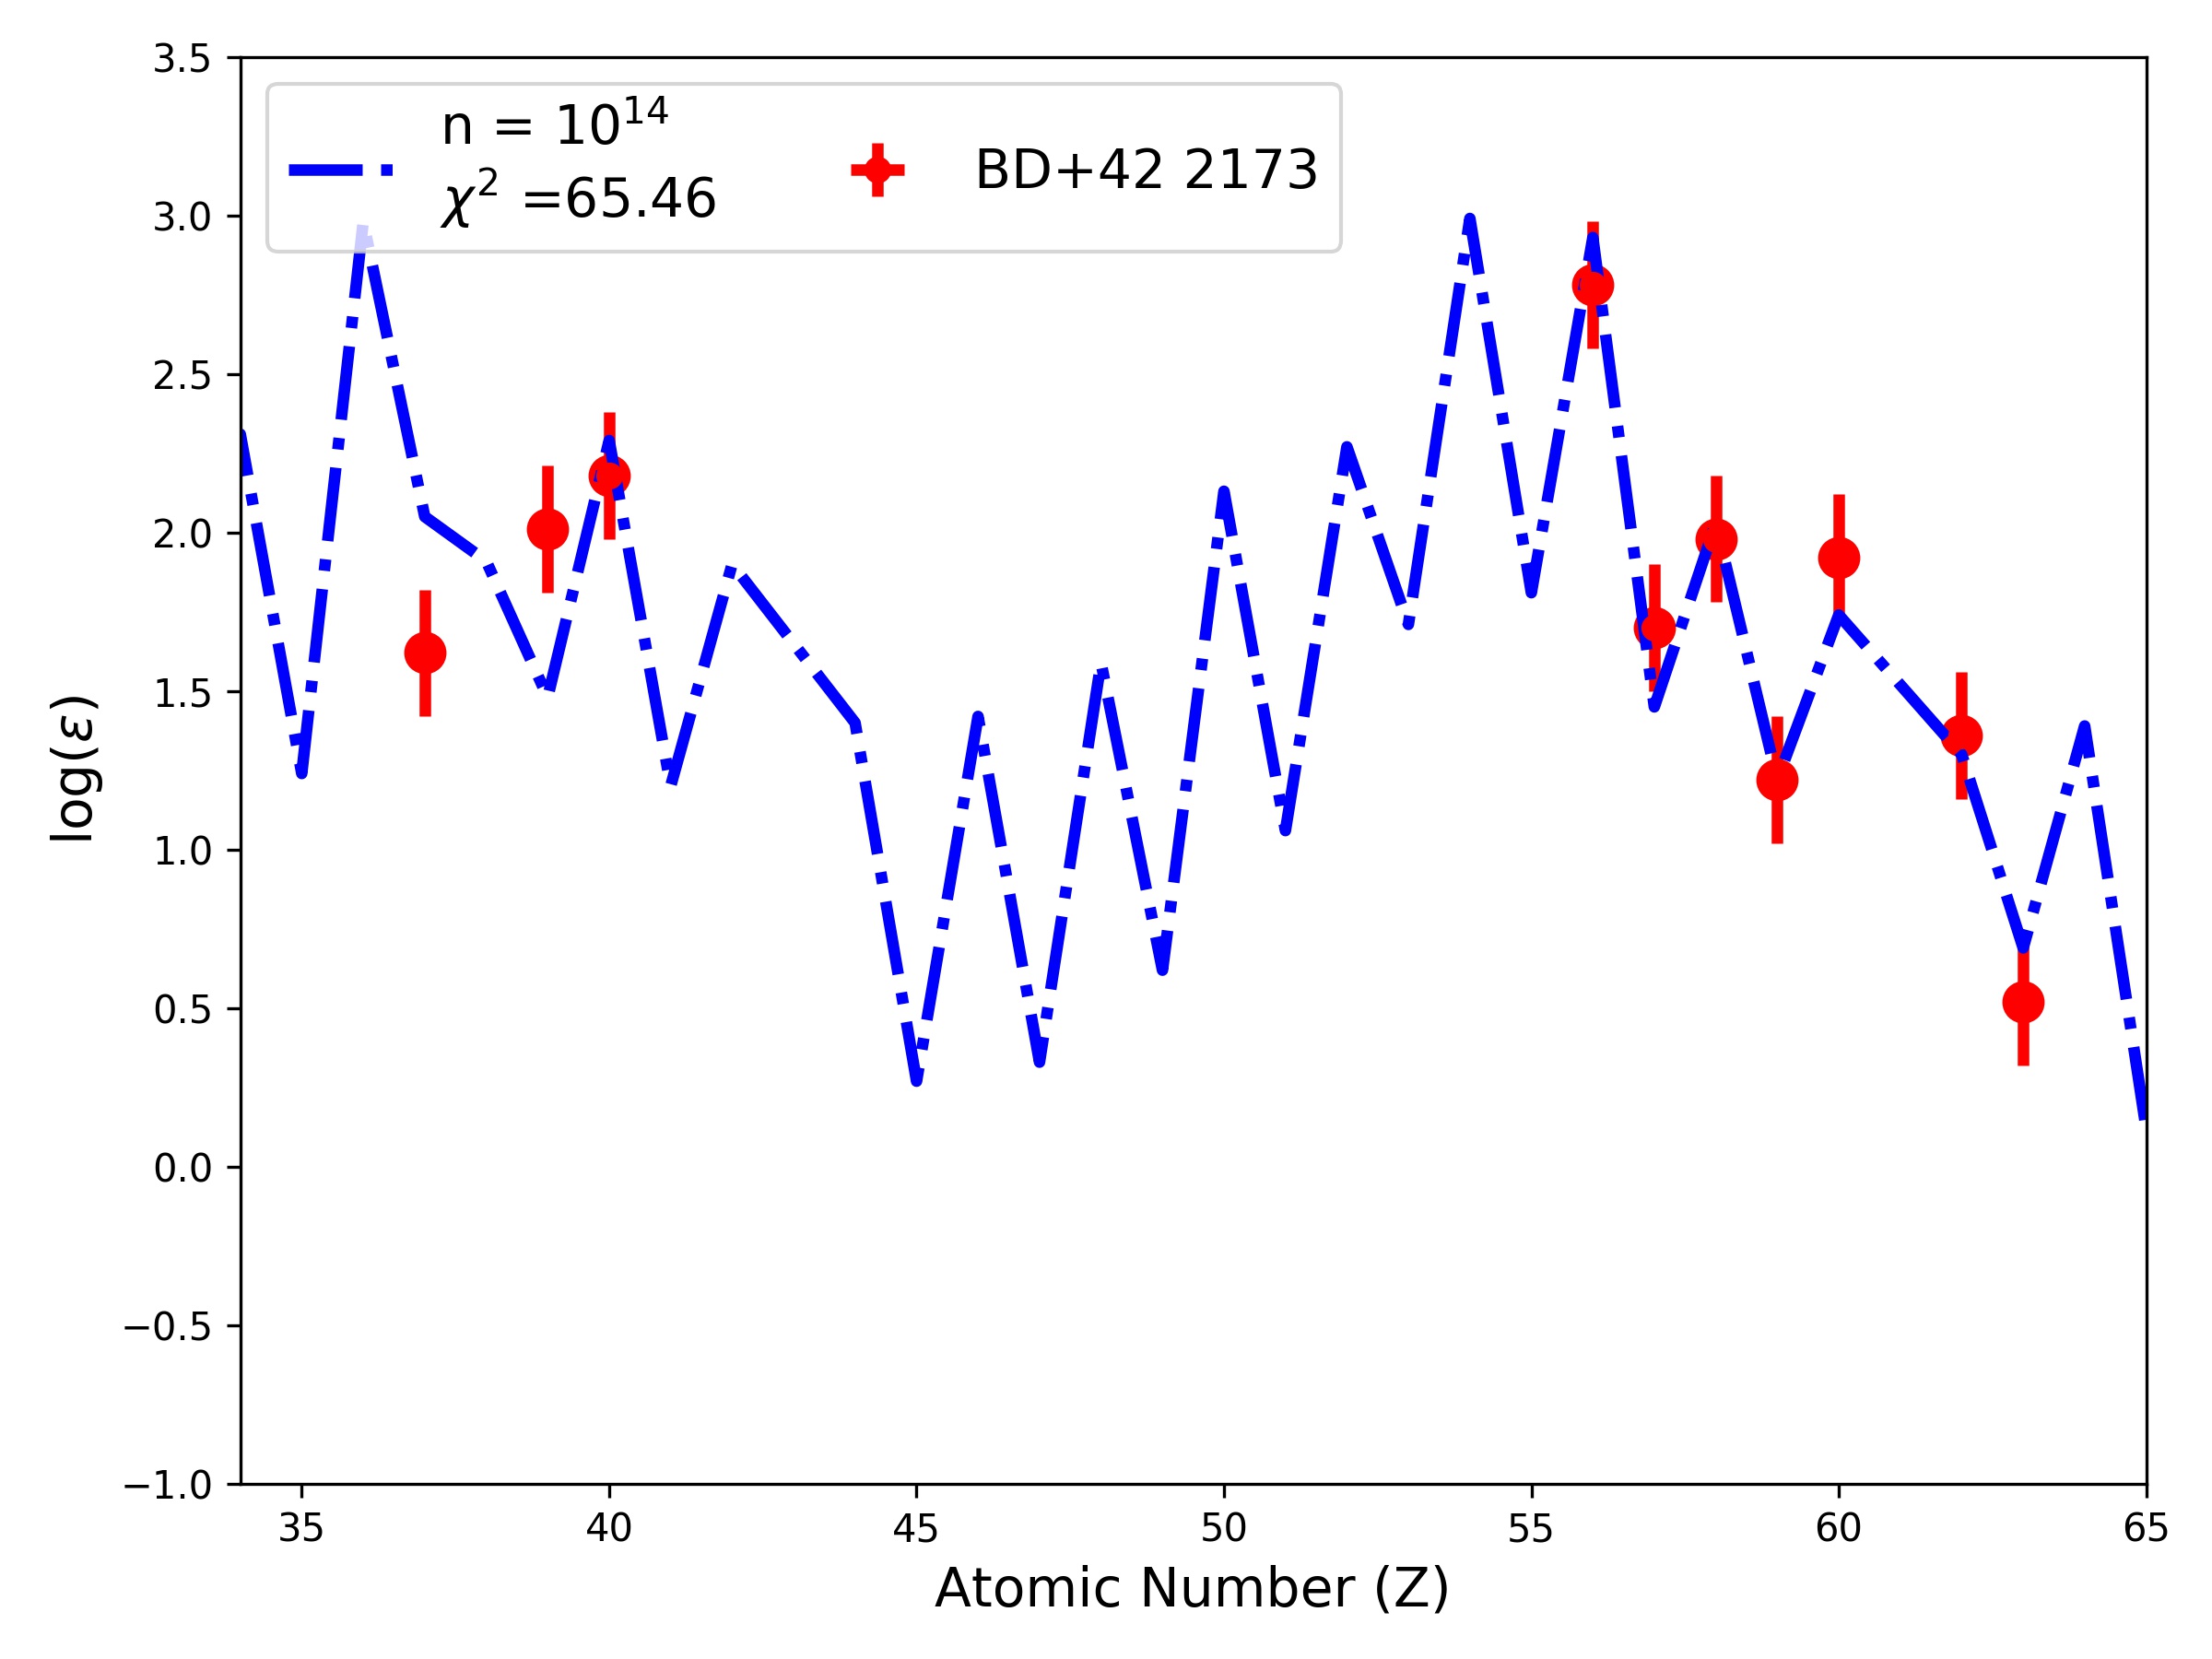
et al., 2019) whereas for the case of Hampel et al. (2016) models, we find a good agreement (refer figure 14).
As explained in the sec 5.1, at the bottom of the convective envelope, the 13C produced in PIEs acts as a source of neutrons through 13C(, n)16O reaction. These PIEs can produce necessary neutron densities as large as 1015 cm-3 (Cristallo
et al. (2009)).
We have only considered elements 37 Z 63 since the model is available only for elements heavier than Fe.
We used the equation given in Hampel et al. (2016) to calculate the model abundance on the surface of the CEMP- stars:
where is the calculated -process abundance of each element from the model, is the scaled-solar abundance, and d the dilution factor, which provides the measure of how much -processed material is mixed with unprocessed material. However, the dilution factor in this equation does not provide any quantitative measure on various specific mixing mechanisms on the AGB surface or mass-transfer onto the CEMP star (Hampel et al., 2019), instead it is a free parameter and is varied until we obtain a best-fitting for a model and the observed abundances for different neutron densities. Since the dilution factor does not have any physical significance, we are not quoting the value. The best-fit is calculated using the equation:
Where is the observational error of and and are observed and model abundances of the element with atomic number Z. indicates the goodness of the fit to tell which model matches the observations
best, but its value does not have the statistical meaning in the
conventional sense. The best fit model parameters and the corresponding is mentioned in each plot for all the program stars (refer figure 14).
The models from Hampel et al. (2016) provide a fairly good match with the observed data. However, the authors have noted that the neutron-capture processes considered in Hampel et al. (2016) use one-dimensional single-zone nuclear-network calculations without clearly distinguishing the stellar sites hosting such a process. So, in realistic scenarios, the heavy elements produced may demonstrate a different abundance pattern which cannot be clearly stated as there are no evidences to conclude so.
Hampel et al. (2016) also claim that the light-elements are not produced by a significant amount in the neutron-capture processes, but large production of 13C and 14N in PIEs are illustrated (Cristallo
et al., 2009; Cristallo et al., 2016). So, multidimensional simulations are required for the -process nucleosynthetic processes in order to accurately model the abundances of these light elements and their isotopic ratios (Herwig
et al., 2011; Stancliffe et al., 2011; Herwig et al., 2014).
Also, the effect of multiple PIEs to the enrichment of and are not available with current models. While the shorter neutron bursts can produce lighter s-peak elements, the longer neutron exposures produce the heavier s-peak elements (Koch et al., 2019). In the figure 14, the light -process elements, Y and Zr are not well-fitted, so a combination of the individual neutron burst events may be required to model the lighter -process elements. Moreover, the number of neutron-capture elements detected in the spectra of our program stars are rather small. So it is not very clear that the heavy element enrichment in our program stars are produced only through a pure i-process or a mixture of other neutron-capture processes along with the i-process.
6 Conclusions
We studied 7 CEMP stars using both high-resolution optical spectra and low-resolution NIR spectra. We derived the O and 12C /13C ratio using optical and NIR spectra and found good agreement in the derived abundances. All the CEMP stars in this study exhibit enhancement in both carbon and neutron-capture elements and also show radial velocity variations. This favors
AGB mass transfer scenario as a possible mechanism for the enhanced carbon and n-capture elements.
Both the light element and the n-capture elements indicate accretion from a low-mass AGB companion. The abundance pattern of C, N and O is compared with AGB models of different masses and all the stars in this study are found to have low-mass low-metallicity AGB stars as companions, This low-mass nature of the companion is further confirmed by the Na abundances.
We demonstrated that low-resolution NIR observations can complement high resolution optical observations to derive the oxygen abundance and 12C /13C ratio in cool CEMP stars. Since the abundance of C, N can also be derived using low-resolution spectra, it may be proposed that low-resolution optical and NIR observations are adequate to constrain the nature of binary companion in cool CEMP stars. This will enable us to probe fainter cool CEMP stars thereby probe several cool CEMP stars beyond Milky Way
All the 7 CEMP stars studied here are identified to be exhibiting enhancements in both Ba and Eu. Among them, one of the stars (HE 1152-0355) exhibits [Ba/Fe] 1.0, [Ba/Eu] 0.0 and [Eu/Fe] 1.0. These values sub-classify the star as a CEMP- category. The low-mass AGB models fit well with the observed abundance pattern of HE 1152-0355. Rest of the 6 stars exhibit [Ba/Fe] 1.0, [Ba/Eu] 0.0 and [Eu/Fe] 1.0. This indicates that these stars are enhanced in both -process and -process elements which sub-classify them as CEMP-. Among the 6 stars, 5 stars are classified as CEMP- in this study using their [Eu/Fe] abundances which were not available earlier in literature thus they were wrongly classified as CEMP- stars. The abundance pattern of the neutron-capture elements in these CEMP- stars when compared with the models of -process from Hampel et al. (2016) provides a good match. This support the idea of the operation of -process in the inter-shell region of low-mass low-metallicity AGB stars for the production of heavy elements seen in the CEMP- stars. While the Hampel et al. (2016) models provide a fairly good match in the fitting with the observed abundances, the light s-peak elements do not match well with the model as compared to the heavy s-peak elements. This may demand the inclusion of multiple PIEs of different neutron burst events which is currently not available with the existing models.
Also, the number of neutron-capture elements detected in the spectra of program stars are somewhat smaller than required to differentiate between a pure -process model and a mixture of neutron-capture events that would have contributed to the resultant abundance pattern.
Even though the low-resolution optical and NIR spectroscopy is sufficient to constrain the mass and metallicity of the companion AGB star of cool CEMP stars, high-resolution studies can provide the better understanding of the nucleosynthetic origin of various elements present in them. Combining the key elements such as Li, C, N, O abundances and n-capture elements will provide valuable insights to various mixing mechanism and nuclear process that might have contributed to the observed abundances in CEMP- stars.
Acknowledgements
We thank the anonymous referee for the useful comments. We thank the staff of IAO, Hanle and CREST, Hosakote, that made these observations possible. The facilities at IAO and CREST are operated by the Indian Institute of Astrophysics, Bangalore. AS and DKO acknowledge the support of the Department of Atomic Energy, Government of India, under Project Identification No. RTI 4002. AS thanks Drisya Karinkuzhi for the fruitful discussions on different AGB models and -process contributions to the enhancement of neutron-capture elements.
Data availability
The data underlying this article will be shared on reasonable request to the corresponding author.
References
- Abate et al. (2015) Abate C., Pols O. R., Izzard R. G., Karakas A. I., 2015, A&A, 581, A22
- Alonso et al. (1996) Alonso A., Arribas S., Martinez-Roger C., 1996, A&A, 313, 873
- Alonso et al. (1999) Alonso A., Arribas S., Martínez-Roger C., 1999, A&AS, 139, 335
- Amarsi et al. (2016) Amarsi A. M., Asplund M., Collet R., Leenaarts J., 2016, MNRAS, 455, 3735
- Amarsi et al. (2019) Amarsi A. M., Nissen P. E., Skúladóttir Á., 2019, A&A, 630, A104
- Andrievsky et al. (2009) Andrievsky S. M., Spite M., Korotin S. A., Spite F., François P., Bonifacio P., Cayrel R., Hill V., 2009, A&A, 494, 1083
- Andrievsky et al. (2010) Andrievsky S. M., Spite M., Korotin S. A., Spite F., Bonifacio P., Cayrel R., François P., Hill V., 2010, A&A, 509, A88
- Aoki & Tsuji (1997) Aoki W., Tsuji T., 1997, A&A, 317, 845
- Aoki et al. (2002) Aoki W., Ryan S. G., Norris J. E., Beers T. C., Ando H., Tsangarides S., 2002, ApJ, 580, 1149
- Aoki et al. (2007) Aoki W., Beers T. C., Christlieb N., Norris J. E., Ryan S. G., Tsangarides S., 2007, ApJ, 655, 492
- Aoki et al. (2013) Aoki W., et al., 2013, AJ, 145, 13
- Asplund et al. (2005) Asplund M., Grevesse N., Sauval A. J., 2005, in Barnes III T. G., Bash F. N., eds, Astronomical Society of the Pacific Conference Series Vol. 336, Cosmic Abundances as Records of Stellar Evolution and Nucleosynthesis. p. 25
- Asplund et al. (2009) Asplund M., Grevesse N., Sauval A. J., Scott P., 2009, ARA&A, 47, 481
- Banerjee et al. (2018) Banerjee P., Qian Y.-Z., Heger A., 2018, ApJ, 865, 120
- Barbuy et al. (1992) Barbuy B., Jorissen A., Rossi S. C. F., Arnould M., 1992, A&A, 262, 216
- Baumueller & Gehren (1997) Baumueller D., Gehren T., 1997, A&A, 325, 1088
- Beers & Christlieb (2005) Beers T. C., Christlieb N., 2005, ARA&A, 43, 531
- Beers et al. (1992) Beers T. C., Preston G. W., Shectman S. A., 1992, AJ, 103, 1987
- Beers et al. (2007) Beers T. C., Sivarani T., Marsteller B., Lee Y., Rossi S., Plez B., 2007, AJ, 133, 1193
- Bergemann et al. (2017a) Bergemann M., Collet R., Amarsi A. M., Kovalev M., Ruchti G., Magic Z., 2017a, ApJ, 847, 15
- Bergemann et al. (2017b) Bergemann M., Collet R., Schönrich R., Andrae R., Kovalev M., Ruchti G., Hansen C. J., Magic Z., 2017b, ApJ, 847, 16
- Bisterzo et al. (2011) Bisterzo S., Gallino R., Straniero O., Cristallo S., Käppeler F., 2011, MNRAS, 418, 284
- Bisterzo et al. (2012) Bisterzo S., Gallino R., Straniero O., Cristallo S., Käppeler F., 2012, MNRAS, 422, 849
- Bonifacio et al. (2015) Bonifacio P., et al., 2015, A&A, 579, A28
- Bonifacio et al. (2018) Bonifacio P., et al., 2018, A&A, 612, A65
- Busso et al. (1999) Busso M., Gallino R., Wasserburg G. J., 1999, ARA&A, 37, 239
- Busso et al. (2007) Busso M., Wasserburg G. J., Nollett K. M., Calandra A., 2007, ApJ, 671, 802
- Caffau et al. (2015) Caffau E., Ludwig H. G., Steffen M., Livingston W., Bonifacio P., Malherbe J. M., Doerr H. P., Schmidt W., 2015, A&A, 579, A88
- Campbell & Lattanzio (2008) Campbell S. W., Lattanzio J. C., 2008, A&A, 490, 769
- Campbell et al. (2010) Campbell S. W., Lugaro M., Karakas A. I., 2010, A&A, 522, L6
- Charbonnel (1995) Charbonnel C., 1995, ApJ, 453, L41
- Charbonnel et al. (1998) Charbonnel C., Brown J. A., Wallerstein G., 1998, A&A, 332, 204
- Christlieb et al. (2001) Christlieb N., Green P. J., Wisotzki L., Reimers D., 2001, A&A, 375, 366
- Clarkson et al. (2018) Clarkson O., Herwig F., Pignatari M., 2018, MNRAS, 474, L37
- Cowan & Rose (1977) Cowan J. J., Rose W. K., 1977, ApJ, 212, 149
- Cristallo et al. (2009) Cristallo S., Piersanti L., Straniero O., Gallino R., Domínguez I., Käppeler F., 2009, Publ. Astron. Soc. Australia, 26, 139
- Cristallo et al. (2011) Cristallo S., et al., 2011, ApJS, 197, 17
- Cristallo et al. (2016) Cristallo S., Karinkuzhi D., Goswami A., Piersanti L., Gobrecht D., 2016, ApJ, 833, 181
- Cruz et al. (2013) Cruz M. A., Serenelli A., Weiss A., 2013, A&A, 559, A4
- Denissenkov & Pinsonneault (2008) Denissenkov P. A., Pinsonneault M., 2008, ApJ, 679, 1541
- Denissenkov et al. (2017) Denissenkov P. A., Herwig F., Battino U., Ritter C., Pignatari M., Jones S., Paxton B., 2017, ApJ, 834, L10
- Denissenkov et al. (2019) Denissenkov P. A., Herwig F., Woodward P., Andrassy R., Pignatari M., Jones S., 2019, MNRAS, 488, 4258
- Doherty et al. (2015) Doherty C. L., Gil-Pons P., Siess L., Lattanzio J. C., Lau H. H. B., 2015, MNRAS, 446, 2599
- Eggleton et al. (2008) Eggleton P. P., Dearborn D. S. P., Lattanzio J. C., 2008, ApJ, 677, 581
- Fishlock et al. (2014) Fishlock C. K., Karakas A. I., Lugaro M., Yong D., 2014, ApJ, 797, 44
- Gallagher et al. (2020) Gallagher A. J., Bergemann M., Collet R., Plez B., Leenaarts J., Carlsson M., Yakovleva S. A., Belyaev A. K., 2020, A&A, 634, A55
- Goriely et al. (2005) Goriely S., Demetriou P., Janka H. T., Pearson J. M., Samyn M., 2005, Nuclear Phys. A, 758, 587
- Goswami et al. (2006) Goswami A., Aoki W., Beers T. C., Christlieb N., Norris J. E., Ryan S. G., Tsangarides S., 2006, MNRAS, 372, 343
- Gratton et al. (2000) Gratton R. G., Sneden C., Carretta E., Bragaglia A., 2000, A&A, 354, 169
- Hampel et al. (2016) Hampel M., Stancliffe R. J., Lugaro M., Meyer B. S., 2016, ApJ, 831, 171
- Hampel et al. (2019) Hampel M., Karakas A. I., Stancliffe R. J., Meyer B. S., Lugaro M., 2019, ApJ, 887, 11
- Hansen et al. (2015) Hansen T., et al., 2015, ApJ, 807, 173
- Hansen et al. (2016a) Hansen T. T., Andersen J., Nordström B., Beers T. C., Placco V. M., Yoon J., Buchhave L. A., 2016a, A&A, 586, A160
- Hansen et al. (2016b) Hansen T. T., Andersen J., Nordström B., Beers T. C., Placco V. M., Yoon J., Buchhave L. A., 2016b, A&A, 588, A3
- Hansen et al. (2016c) Hansen C. J., et al., 2016c, A&A, 588, A37
- Hansen et al. (2019a) Hansen C. J., Hansen T. T., Koch A., Beers T. C., Nordström B., Placco V. M., Andersen J., 2019a, A&A, 623, A128
- Hansen et al. (2019b) Hansen C. J., Hansen T. T., Koch A., Beers T. C., Nordström B., Placco V. M., Andersen J., 2019b, A&A, 623, A128
- Hansen et al. (2020) Hansen C. J., et al., 2020, A&A, 643, A49
- Herwig (2004) Herwig F., 2004, ApJS, 155, 651
- Herwig et al. (2011) Herwig F., Pignatari M., Woodward P. R., Porter D. H., Rockefeller G., Fryer C. L., Bennett M., Hirschi R., 2011, ApJ, 727, 89
- Herwig et al. (2014) Herwig F., Woodward P. R., Lin P.-H., Knox M., Fryer C., 2014, ApJ, 792, L3
- Jones et al. (2016) Jones S., Ritter C., Herwig F., Fryer C., Pignatari M., Bertolli M. G., Paxton B., 2016, MNRAS, 455, 3848
- Jonsell et al. (2006) Jonsell K., Barklem P. S., Gustafsson B., Christlieb N., Hill V., Beers T. C., Holmberg J., 2006, A&A, 451, 651
- Jorissen et al. (2016a) Jorissen A., et al., 2016a, A&A, 586, A158
- Jorissen et al. (2016b) Jorissen A., et al., 2016b, A&A, 586, A159
- Karakas & Lattanzio (2007) Karakas A., Lattanzio J. C., 2007, Publ. Astron. Soc. Australia, 24, 103
- Karinkuzhi et al. (2021) Karinkuzhi D., Van Eck S., Goriely S., Siess L., Jorissen A., Merle T., Escorza A., Masseron T., 2021, A&A, 645, A61
- Keller et al. (2001) Keller L. D., Pilachowski C. A., Sneden C., 2001, AJ, 122, 2554
- Kennedy et al. (2011) Kennedy C. R., et al., 2011, AJ, 141, 102
- Kipper & Jorgensen (1994) Kipper T., Jorgensen U. G., 1994, A&A, 290, 148
- Kobayashi et al. (2006) Kobayashi C., Umeda H., Nomoto K., Tominaga N., Ohkubo T., 2006, ApJ, 653, 1145
- Koch et al. (2019) Koch A., Reichert M., Hansen C. J., Hampel M., Stancliffe R. J., Karakas A., Arcones A., 2019, A&A, 622, A159
- Kupka et al. (1999) Kupka F., Piskunov N., Ryabchikova T. A., Stempels H. C., Weiss W. W., 1999, A&AS, 138, 119
- Lattimer & Schramm (1974) Lattimer J. M., Schramm D. N., 1974, ApJ, 192, L145
- Lind et al. (2009) Lind K., Primas F., Charbonnel C., Grundahl F., Asplund M., 2009, A&A, 503, 545
- Lind et al. (2011) Lind K., Asplund M., Barklem P. S., Belyaev A. K., 2011, A&A, 528, A103
- Lucatello et al. (2003) Lucatello S., Gratton R., Cohen J. G., Beers T. C., Christlieb N., Carretta E., Ramírez S., 2003, AJ, 125, 875
- Lucatello et al. (2005) Lucatello S., Tsangarides S., Beers T. C., Carretta E., Gratton R. G., Ryan S. G., 2005, ApJ, 625, 825
- Lucatello et al. (2006) Lucatello S., Beers T. C., Christlieb N., Barklem P. S., Rossi S., Marsteller B., Sivarani T., Lee Y. S., 2006, ApJ, 652, L37
- Lucatello et al. (2011) Lucatello S., Masseron T., Johnson J. A., Pignatari M., Herwig F., 2011, ApJ, 729, 40
- Lugaro et al. (2012) Lugaro M., Karakas A. I., Stancliffe R. J., Rijs C., 2012, ApJ, 747, 2
- Lugaro et al. (2017) Lugaro M., et al., 2017, Nature Astronomy, 1
- Mashonkina & Christlieb (2014) Mashonkina L., Christlieb N., 2014, A&A, 565, A123
- Mashonkina & Gehren (2000) Mashonkina L., Gehren T., 2000, A&A, 364, 249
- Mashonkina et al. (1999) Mashonkina L., Gehren T., Bikmaev I., 1999, A&A, 343, 519
- Masseron et al. (2010) Masseron T., Johnson J. A., Plez B., van Eck S., Primas F., Goriely S., Jorissen A., 2010, A&A, 509, A93
- McClure & Woodsworth (1990) McClure R. D., Woodsworth A. W., 1990, ApJ, 352, 709
- Mészáros et al. (2012) Mészáros S., et al., 2012, AJ, 144, 120
- Meynet et al. (2006) Meynet G., Ekström S., Maeder A., 2006, A&A, 447, 623
- Ninan et al. (2014) Ninan J. P., et al., 2014, Journal of Astronomical Instrumentation, 3, 1450006
- Nollett et al. (2003) Nollett K. M., Busso M., Wasserburg G. J., 2003, ApJ, 582, 1036
- Nordlander & Lind (2017) Nordlander T., Lind K., 2017, A&A, 607, A75
- Palmerini et al. (2008) Palmerini S., Nollett K., Busso M., 2008, in Nuclei in the Cosmos (NIC X).
- Pietrinferni et al. (2004) Pietrinferni A., Cassisi S., Salaris M., Castelli F., 2004, ApJ, 612, 168
- Placco et al. (2014) Placco V. M., Frebel A., Beers T. C., Stancliffe R. J., 2014, ApJ, 797, 21
- Plez (2012) Plez B., 2012, Turbospectrum: Code for spectral synthesis, Astrophysics Source Code Library (ascl:1205.004)
- Plez & Cohen (2005) Plez B., Cohen J. G., 2005, A&A, 434, 1117
- Prantzos et al. (2018) Prantzos N., Abia C., Limongi M., Chieffi A., Cristallo S., 2018, MNRAS, 476, 3432
- Proffitt & Michaud (1989) Proffitt C. R., Michaud G., 1989, ApJ, 345, 998
- Qian & Wasserburg (2007) Qian Y. Z., Wasserburg G. J., 2007, Phys. Rep., 442, 237
- Ramírez & Meléndez (2005) Ramírez I., Meléndez J., 2005, ApJ, 626, 465
- Reggiani et al. (2019) Reggiani H., et al., 2019, A&A, 627, A177
- Salvadori et al. (2015) Salvadori S., Skúladóttir Á., Tolstoy E., 2015, MNRAS, 454, 1320
- Sbordone et al. (2010) Sbordone L., et al., 2010, A&A, 522, A26
- Sbordone et al. (2020) Sbordone L., Hansen C. J., Monaco L., Cristallo S., Bonifacio P., Caffau E., Villanova S., Amigo P., 2020, A&A, 641, A135
- Schlegel et al. (1998) Schlegel D. J., Finkbeiner D. P., Davis M., 1998, ApJ, 500, 525
- Schuler et al. (2006) Schuler S. C., Hatzes A. P., King J. R., Kürster M., The L.-S., 2006, AJ, 131, 1057
- Sivarani et al. (2004) Sivarani T., et al., 2004, A&A, 413, 1073
- Sivarani et al. (2006) Sivarani T., et al., 2006, A&A, 459, 125
- Smiljanic et al. (2009) Smiljanic R., Gauderon R., North P., Barbuy B., Charbonnel C., Mowlavi N., 2009, A&A, 502, 267
- Sneden et al. (2003) Sneden C., et al., 2003, ApJ, 591, 936
- Sneden et al. (2008) Sneden C., Cowan J. J., Gallino R., 2008, ARA&A, 46, 241
- Spite et al. (2005) Spite M., et al., 2005, A&A, 430, 655
- Spite et al. (2006) Spite M., et al., 2006, A&A, 455, 291
- Spite et al. (2013) Spite M., Caffau E., Bonifacio P., Spite F., Ludwig H. G., Plez B., Christlieb N., 2013, A&A, 552, A107
- Sriram et al. (2018) Sriram S., et al., 2018, in Evans C. J., Simard L., Takami H., eds, Society of Photo-Optical Instrumentation Engineers (SPIE) Conference Series Vol. 10702, Ground-based and Airborne Instrumentation for Astronomy VII. p. 107026K, doi:10.1117/12.2313165
- Stancliffe et al. (2007) Stancliffe R. J., Glebbeek E., Izzard R. G., Pols O. R., 2007, A&A, 464, L57
- Stancliffe et al. (2009) Stancliffe R. J., Church R. P., Angelou G. C., Lattanzio J. C., 2009, MNRAS, 396, 2313
- Stancliffe et al. (2011) Stancliffe R. J., Dearborn D. S. P., Lattanzio J. C., Heap S. A., Campbell S. W., 2011, ApJ, 742, 121
- Starkenburg et al. (2014) Starkenburg E., Shetrone M. D., McConnachie A. W., Venn K. A., 2014, MNRAS, 441, 1217
- Takeda et al. (2002) Takeda Y., Zhao G., Chen Y.-Q., Qiu H.-M., Takada-Hidai M., 2002, PASJ, 54, 275
- Thielemann et al. (2011) Thielemann F. K., et al., 2011, Progress in Particle and Nuclear Physics, 66, 346
- Thielemann et al. (2017) Thielemann F. K., Eichler M., Panov I. V., Wehmeyer B., 2017, Annual Review of Nuclear and Particle Science, 67, 253
- Umeda & Nomoto (2003) Umeda H., Nomoto K., 2003, Nature, 422, 871
- Wasserburg et al. (1995) Wasserburg G. J., Boothroyd A. I., Sackmann I.-J., 1995, ApJ, 447, L37
- Watson et al. (2019) Watson D., et al., 2019, Nature, 574, 497
- Wheeler et al. (1998) Wheeler J. C., Cowan J. J., Hillebrandt W., 1998, ApJ, 493, L101
- Winteler et al. (2012) Winteler C., Käppeli R., Perego A., Arcones A., Vasset N., Nishimura N., Liebendörfer M., Thielemann F. K., 2012, ApJ, 750, L22
- Yanny et al. (2009) Yanny B., et al., 2009, AJ, 137, 4377
- Yong et al. (2013) Yong D., et al., 2013, ApJ, 762, 26
- Yoon et al. (2016) Yoon J., et al., 2016, ApJ, 833, 20
- Zhang et al. (2008) Zhang H. W., Gehren T., Zhao G., 2008, A&A, 481, 489
Appendix A Additional table of spectral lines used for abundance analysis
|
Appendix B Additional figures of spectral fitting