AC susceptometry of 2D van der Waals magnets enabled by the coherent control of quantum sensors
Abstract
Precision magnetometry is fundamental to the development of novel magnetic materials and devices. Recently, the nitrogen-vacancy (NV) center in diamond has emerged as a promising probe for static magnetism in 2D van der Waals materials, capable of quantitative imaging with nanoscale spatial resolution. However, the dynamic character of magnetism, crucial for understanding the magnetic phase transition and achieving technological applications, has rarely been experimentally accessible in single 2D crystals. Here, we coherently control the NV center’s spin precession to achieve ultra-sensitive, quantitative ac susceptometry of a 2D ferromagnet. Combining dc hysteresis with ac susceptibility measurements varying temperature, field, and frequency, we illuminate the formation, mobility, and consolidation of magnetic domain walls in few-layer . We show that domain wall mobility is enhanced in ultrathin , with minimal decrease for excitation frequencies exceeding hundreds of kilohertz, and is influenced by the domain morphology and local pinning of the flake. Our technique extends NV magnetometry to the multi-functional ac and dc magnetic characterization of wide-ranging spintronic materials at the nanoscale.
I Introduction
Two-dimensional van der Waals (vdW) magnetic materials have broached transformative concepts for integrating and controlling spintronic devices, but also presented unique challenges to their magnetic characterization [1, 2, 3]. Notably, the magnetic moment of a micron-sized exfoliated monolayer ( emu) lies below the sensitivity ( emu) of commercial magnetometers based on the superconducting quantum interference device (SQUID) [4], the benchmark for analyzing bulk magnetic materials. Key insights in vdW magnetism are most frequently provided by magneto-optical [5, 6, 7, 8] and photoluminescence (PL) imaging [9, 10], which feature high sensitivity, or by electrical measurements, which directly incorporate layers inside functional devices [11, 12, 13]. However, these approaches depend sensitively on material- and device-specific coupling of the sample’s magnetization to the measured optical or transport properties, which complicates quantitative interpretation and restricts generalizability [14, 15, 16]. A direct probe of the magnetic field associated with both static and dynamic magnetizations in 2D crystals would accelerate materials discovery and optimization.
Detecting stray fields from single 2D magnetic flakes is challenging due to the requirement of miniaturized sensors that must be deployed in nanoscale proximity to these microscopic samples. Pioneering efforts have utilized mesoscopic graphene-based Hall bars [17] and atomic-scale spin defects in diamond [18, 19, 20, 21] to measure static stray fields and quantify the absolute magnetization of mono- and few-layer ferromagnets. However, the dynamic signatures of 2D magnets [7, 8, 11, 22], which predominate near magnetic criticality, have yet to be investigated directly through magnetometry. In particular, ac susceptibility, which probes the response of the sample to an oscillating magnetic field, is a powerful technique for understanding magnetic phase transitions, relaxation times, and domain dynamics in diverse materials, including antiferromagnets, spin glasses, and ensembles of single-molecule magnets [23, 24]. At the Curie temperature () of the paramagnetic to ferromagnetic phase transition, the ac susceptibility diverges with a critical exponent characteristic of the universality class of the underlying interactions [25]. Below , senses magnetization rotation, domain wall motion, superparamagnetism, and the interactions of these processes with defects, strain, and external dc field [26].
In this work, we leverage the coherent manipulation of quantum sensors to probe both the dc and ac magnetic properties of a 2D vdW magnet. We exfoliate ultrathin flakes of the ferromagnetic insulator onto a diamond magnetometer chip containing a near-surface ensemble of nitrogen-vacancy (NV) centers. This versatile platform directly enables sensitive measurement of both the 2D ferromagnet’s dc magnetization through static shifts of the NV center’s spin energies [18, 19, 20, 21] and its ac susceptibility through dynamically coupling the NV center’s spin precession to ac fields using frequency-selective quantum control sequences [27, 28]. Our dc measurements of magnetic hysteresis reveal that the details of domain nucleation and pinning can differ significantly in ultrathin, exfoliated flakes of similar thickness (10 layers), pointing to large variability in the impact of the local microstructure. Moreover, ac susceptibility measurements on few-layer indicate a critical exponent for the ferromagnetic phase transition and display distinct features that illuminate the formation, mobility, and consolidation of single domain walls below , informing on the potential for domain-based memory and logic devices [29, 30, 31]. The remarkable ac field resolution of 40 nT achieved here represents the most sensitive magnetometry performed to date on exfoliated 2D magnets [17, 18, 19, 20, 21] and introduces a generic platform for understanding sub-gigahertz dynamical phenomena in 2D magnetism.
II Magnetic Properties Measurement System for 2D vdW Magnets
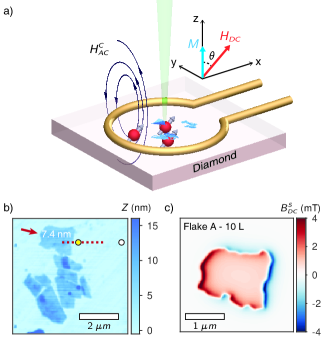
Figure 1a displays our experimental platform based on the optical readout of a layer of near-surface NV center spins (60 nm depth). We exfoliate flakes [32, 33] without encapsulation onto a diamond substrate inside an argon-filled glovebox and then transfer the substrate into our cryostat with minimized exposure to ambient (see Supplemental Material Sec. I). An insulated wire coil adjacent to the diamond delivers both the microwave pulses (GHz) for NV center spin manipulation and the radio frequency (100 kHz) excitation field for probing the ac response of the ferromagnet. In this paper, we use to denote the magnitude of a magnetic field (e.g., ), and to denote its projection onto the NV center axis (e.g., ). The external magnetic field is carefully aligned along one of the four NV center crystallographic orientations, forming an angle to the surface normal. Away from , the applied, in-plane component of in our experiments (0.05 T) can be neglected as possesses a large uniaxial anisotropy that pins the magnetization to the out-of-plane direction (-axis) [34].
We identify flakes as thin as 6 layers for low-temperature measurement by their optical contrast on diamond. The thicknesses of the investigated flakes are subsequently verified by atomic force microscopy (AFM), as exemplified in Fig. 1b, showing an image of a 7.4 nm-thick flake (Flake A). In Fig. 1c, we perform simulations of Flake A’s stray field at 60 nm beneath the diamond surface. We assume a saturated magnetic moment density of 148 (3.0 per Cr ion) for 10 layers with ferromagnetic interlayer coupling and plot , the projection of the sample’s stray field onto the oblique NV center axis [18]. In this work, we utilize the transition in the NV center ground state, which disperses with a slope MHz/mT [28]. Hence, outside the right edge of the flake, where many of our measurements are performed, we expect a strong positive (negative) Zeeman shift of the NV center’s transition frequency if the flake is magnetized parallel (anti-parallel) to the component of along the -axis.
III DC field sensing of magnetic hysteresis
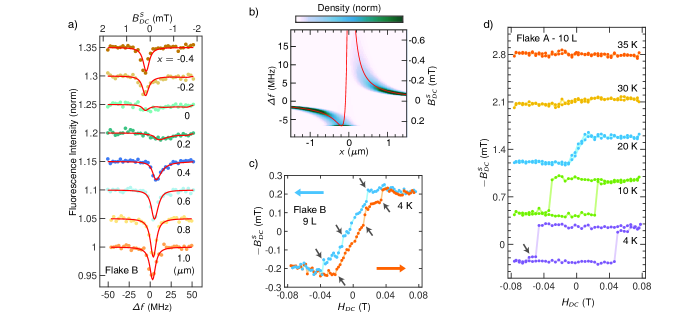
In Fig. 2a, we present the optically-detected magnetic resonance (ODMR) spectra at 4 K for a linecut across the right edge of another flake (Flake B, 6.7 nm/9 layers) with a long, straight edge (see Supplemental Material Sec. II for AFM image). Approaching the right edge of the flake from the outside (), the NV magnetic resonance shifts to higher frequencies, before switching to lower frequencies in the interior of the flake (), corroborating a ferromagnetic moment aligned with the out-of-plane component of . In comparison to single NV measurements [18], we observe broadening of the ensemble NV center linewidth due to spatial averaging over strong magnetic field gradients near the flake’s edge. The evolution of the lineshape, however, can be accurately modeled (solid lines in Fig. 2a) by summing intrinsic Lorentizian lineshapes with a distribution of center frequencies (see Supplemental Material Sec. III). For each center location of the optical spot, we determine the distribution of stray fields within the spot (Fig. 2b) by assuming a Gaussian beam shape (standard deviation 170 nm) and a stray field profile corresponding to the edge of a semi-infinite magnetic sheet [35]. Fitting the lineshapes simultaneously using this model, we extract the magnetization of Flake B to be . This value is lower than expected for 9-layer at saturation (133 ), and may be due to degradation of the surface layers during sample transfer or laser irradiation, as also observed in other NV center experiments [19, 21].
By parking the optical spot outside the flake, we demonstrate sensitive characterization of magnetic hysteresis in ultrathin (see Supplemental Material for data on additional flakes) [8]. Figure 2c displays the stray field due to Flake B as the applied field is swept, sensing the magnetization of a local region of the flake near the illuminated NV location. Lowering from mT, we observe that the magnetization begins to reverse at mT through the nucleation of domains. The magnetization decreases linearly with field and crosses zero magnetization slowly, revealing that a highly fragmented domain structure is stable and that domain wall pinning impedes the expansion of the reversed domains. Discrete Barkhausen jumps (gray arrows) are observed, corresponding to the hopping of individual domain walls between different pinning sites [17, 20]. Interestingly, in contrast to the “soft” magnetic behavior of Flake B (9 layer), the hysteresis curve for a similarly thick flake, Flake A (10 layer), is rectangular, displaying full remenance and a large coercive field (Fig. 2d). Only a single magnetization plateau is observed between the two saturated states, indicating a propensity to form large domains and few pinning centers in the vicinity of the NV center probe. These observations indicate that the metastable domain structures and magnetization reversal process in intermediate thickness flakes (9-10 layer) are extremely sensitive to details of the local microstructure. As the temperature increases, the hysteresis loop for Flake A narrows, and the magnetization disappears above 30 K.
IV Quantum-Enabled AC susceptometry technique
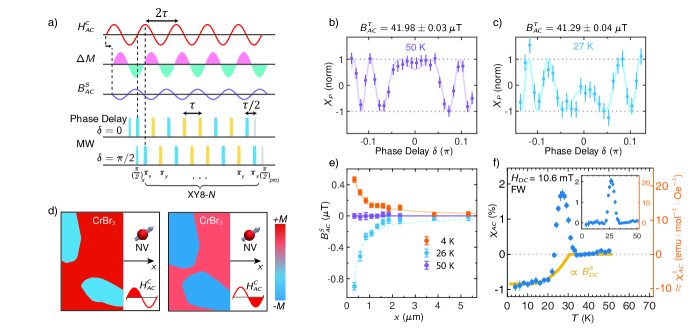
We now introduce the main innovation of our work: ac susceptometry via spin precession-based ac field sensing. Our protocol utilizes dynamical decoupling (DD) sequences (XY8-N) that consist of repeated spin inversions (-pulses) on an NV superposition state undergoing Larmor precession [36]. Similar to lock-in detection, the DD sequence allows only ac fields synchronized to the -pulse spacing to affect the NV precession, while blocking the influence of wideband magnetic noise. This approach extends the coherence time () of the NV superposition state and significantly enhances the magnetic field sensitivity compared to dc (ODMR) measurements, enabling detection of subtle phenomena in proximal systems, such as nuclear magnetic resonance [27, 37, 38], electron paramagnetic resonance [39], and photocurrent transport [28]. As outlined in Fig. 3a, an oscillating coil field with amplitude along the NV center axis and frequency (200 kHz) induces an ac magnetization response in the sample, which produces its own ac stray field . After an applied DD sequence with pulse spacing , the NV center precesses by a cumulative angle due to the total resonant ac field parallel to the NV axis, , containing contributions from both the coil and the sample.
The ac susceptibility is in general complex-valued, with a real (imaginary) part from the in-phase (out-of-phase) sample response. Our DD sequence is phase-sensitive by controlling the relative timing, denoted as the phase delay , between the applied coil field and the train of -pulses applied to the NV center. For , the NV precession detects , while for , it detects (Fig. 3a). Our measurement scans about to map a fringe pattern in the -projection, , of the final NV superposition state on the Bloch sphere. Fitting this fringe pattern allows us to robustly determine and resolve ambiguities in the NV’s acquired phase (see Supplemental Material Sec. IV). For the small amplitude excitation fields applied, we do not detect any out-of-phase response in flakes as thin as 10 layers within our experimental sensitivity. Hence, in our paper denotes solely the real part of the susceptibility, reflecting reversible magnetization changes. The absence of an imaginary component, due to dissipative or irreversible processes, is consistent with ac magneto-optic Kerr effect (ac-MOKE) measurements on multi-layer flakes at much lower = 36 Hz, although an imaginary component was observed for monolayer [7].
We first calibrate our measurement by detecting near the right edge of Flake A at = 50 K and = 10.6 mT (Fig. 3b). Far above of , is contributed only by the coil, which we determine to produce a peak amplitude of T along the NV center axis. Over the 33.6 s duration of the XY8- sequence used here, the coil field induces a large maximum precession angle for and leads to rapid oscillations in for small changes in . Tracking the same spot relative to the flake’s edge, we find that is reduced to T at 27 K (Fig. 3c). We verify that the coil field does not change with temperature by measuring NV centers far from any flakes (Supplemental Material). Hence, we conclude that Flake A produces an ac stray field T, which is remarkably 400 times smaller than its dc stray field at saturation (Fig. 2d).
As illustrated Fig. 3d, the susceptibility is contributed microscopically by both magnetization rotation (MR) and domain wall displacement (DWD). For MR, the coil field exerts a torque that aligns sample spins with variable orientations along the direction of , here predominantly along the -axis, also the easy-axis for . Alternatively for DWD, domains aligned with grow in area at the expense of anti-aligned domains. Hence, for both MR and DWD, of the flake is positively correlated to . This implies that the sample field should indeed have opposite sign to the coil field outside the flake’s right edge (cf. Fig. 1c).
Mapping versus in Fig. 3e, we corroborate that Flake A’s ac stray field is negative at 26 K and decays away from the flake’s edge; however, a surprising positive signal is observed at 4 K. The linecuts in Fig. 3e are obtained during field-warming (FW) at = 10.6 mT after fully polarizing the flake with = 76 mT. In this case, should be zero starting in the saturated, single domain state at 4 K. The observed positive signal is a measurement artifact that is induced by the flake’s dc stray field , which introduces a variable coupling to the component of the coil field perpendicular to the NV axis. As the flake is approached, the total dc field becomes misaligned from the NV center axis, and the NV spin precession is affected not only by (parallel to the NV axis), but also to a lesser degree by the component of perpendicular to the NV axis. This systematic deviation is resolved by the high precision of our measurements. We replicate this effect by deliberately translating our permanent magnet, which supplies , to show that the accumulated phase scales linearly in small dc fields perpendicular to the NV axis, in agreement with theoretical analysis (see Supplemental Material Sec. V).
Accordingly, the spatial dependence of the artifact at 4 K fits accurately to the decay (orange line) of the dc stray field perpendicular to the NV center axis due to the edge of a homogeneous, out-of-plane magnetized sheet [35]. On the other hand, the spatial dependence at 26 K, containing physical signals from ac magnetization changes inside the flake, displays a faster decay that is better approximated by the stray field parallel to the NV axis from the same magnetic edge. This fit (dashed blue line) may be imperfect, for example if the spatial distribution of domain walls is not homogeneous.
To demonstrate how to extract the physical ac susceptibility signal, we present the full temperature dependence of in Fig. 3f. The data here are measured at fixed location (m) during field-warming Flake A from the saturated state. We define a subjective metric, , where depends on the measurement location and the temperature-independent coil field is determined by measurements above (Fig. 3b). Since the spurious contribution to is proportional to the dc field perpendicular to the NV axis, we should subtract a baseline proportional to the temperature-dependent dc magnetization of the flake. For each temperature during the sweep, we simultaneously sample the dc magnetization by measuring via ODMR (see Supplemental Material for data). The baseline for (yellow curve in Fig. 3f) is thus determined by scaling by a multiplicative factor to match the raw data for 10 K, where the physical susceptibility should be zero since Flake A remains saturated based on the dc magnetization.
The baseline-subtracted , displayed in the inset of Fig. 3f, reveals the onset of susceptibility via domain nucleation upon warming to K. peaks at 27 K, below K of Flake A (determined by field-cooling (FC) initial susceptibility measurements presented in the next section). A peak in below is commonly observed in ferromagnets and is known generically as a Hopkinson peak, which can stem from different physical origins [23, 40]. The Hopkinson peak for the FW trace here originates from an increase in domain wall density and mobility as the temperature increases, which is ultimately counterbalanced by the loss of saturation magnetization towards .
To convert our data to quantitative units, we estimate the molar susceptiblity, , by accounting for the distance between the NV probe location and the flake’s edge and for the angle of flake’s edge with respect to the NV axis. By necessity, we disregard the spatial details of the source of susceptibility and consider the equivalent magnetization change, , of a semi-infinite, homogeneous flake that would produce the same at the NV location (see Supplemental Material Sec. VI). Dividing by the amplitude of along the -axis of , we obtain (Fig. 3f, secondary y-axis), where we assume the component of perpendicular to the easy axis makes a negligible contribution, which is valid for DWDs under strong magnetic anisotropy. During FW, the maximum for Flake A is 20 emu/(mol Oe) for T excitation. For reference, a peak emu/(mol Oe) was measured for bulk using a SQUID magnetometer [41]. While SQUID measurements treat the sample as a point dipole, our should be taken as a local measurement that may vary along the length of the flake.
V Initial AC Susceptibility
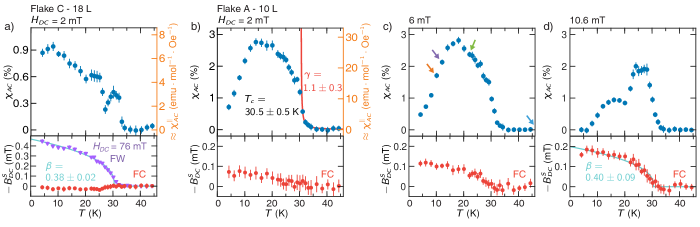
Having detailed our experimental technique and analysis, we now present baseline-corrected measurements of for few-layer during the initial magnetization process from the paramagnetic state. We begin with Flake C, a thicker 18-layer flake, that displays a hysteresis loop with minimal opening area at 4 K (see Supplemental Material), approaching the linear retraceability observed for bulk samples [32]. As shown in Fig. 4a (red points), the dc stray field for Flake C remains virtually vanishing throughout FC at small = 2 mT, indicating the stabilization of an equally-balanced, fine-grained domain structure. Indeed, electron microscopy observes periodic stripe-like domains in bulk with sub-micron widths [42], consistent with significantly reduced stray fields even when measured at our near-field location. The slight dip in around 25 K is reproducible between cooldowns and suggests that the closest domains to our NV location are anti-aligned with the external field . The domains, however, can be polarized along the dc field at = 76 mT (purple points). During subsequent FW, the magnetization, proportional to , is well described by a critical model with and K. These results are in close agreement with prior works which found for both bulk [43] and monolayer [34].
In contrast to its vanishing dc magnetization, the ac susceptibility for Flake C reveals distinct features that highlight the formation and mobility of domains (Fig. 4a, blue points). As is approached, the paramagnetic divergence of is stunted, and decreases initially, leading to a local maximum slightly below (Hopkinson peak). Monte Carlo simulations [44, 45] indicate that incipient domain-like patches begin to form a few Kelvin above , with the magnetic axes of the domains initially isotropically distributed. We attribute the initial rounding and decrease of to the formation of this domain structure, which impedes coherent MR relative to the paramagnetic state.
As temperature is reduced further, the measured for Flake C starts to steadily increase (Fig. 4a). Here, the magnetic anisotropy is increasing, and we expect a crossover to a 180∘ domain phase with magnetizations fully parallel or anti-parallel to the easy (-) axis [44, 45]. Accordingly, becomes dominated by DWD, while the MR contribution is phased out. For DWDs described by the membrane-like bulging of a domain wall between two pinned endpoints, the susceptibility is proportional to , where is the saturation magnetization, is the length between the pinned ends, and is the domain wall energy [26]. Here, is the exchange stiffness parameter and is the uniaxial anisotropy. Making the approximations and for bulk [46], the factor would decrease with decreasing temperature. Thus, the increasing observed experimentally instead suggests that the length of the domain wall that can be continuously displaced is increasing for a range of decreasing temperatures, assuming constant domain wall density [42]. This could reflect the change in the domain morphology observed in imaging experiments on bulk , where smoother, straighter striped domains evolve at low temperature from zigzag stripes near with short interlocking sections [42, 47].
We now present measurements during the initial magnetization process for Flake A, which in contrast to Flake C, displays a rectangular hysteresis curve at 4 K (Fig. 2d), characteristic of ultrathin (e.g. monolayer) flakes. This indicates that domain walls near the NV probe location can propagate freely once nucleated, allowing rapid formation of large domains. We hypothesize that Flake A’s domain morphology resembles the disordered, patchy domains visualized by scanning NV magnetometry for three to four layer [20], which also displayed rectangular hysteresis, rather than the periodic, narrow stripe patterns seen in bulk , where hysteresis and dc stray field are absent (e.g. Flake C).
For FC at low = 2 mT (Fig. 4b), we see a much stronger divergence of the paramagnetic susceptibility in absolute units for Flake A (3 times stronger than Flake C), suggesting reduced interference from a periodic domain structure. This allows us to extract K from the inflection point in versus temperature and a critical exponent in the scaling of above . This value of signals that Flake A is still proximal to the bulk, mean-field limit of magnetic interactions () [43]. However, its detailed domain dynamics below , as revealed through ac susceptibility, differs strongly from the thicker Flake C, also pointing to a different underlying domain morphology.
For Flake A, we observe only a small kink in at 29 K, rather than the broad Hopkinson peak seen for Flake C. reaches a maximum at an intermediate temperature (14 K), before decreasing to a small value at 4 K. The high peak value of corroborates the enhanced domain wall mobility suggested by the rectangular hysteresis curve. The eventual decrease of at lower temperatures reflects the combination of two factors. First, the net area of domain walls near the NV location decreases as the magnetic domains anti-parallel to shrink or disappear to minimize the domain wall energy [44]. This process is reflected by the increase in the dc magnetization of the flake during FC (Fig. 4b, red data). Second, the mobility for the remaining domain walls is reduced due to increasing magnetic anisotropy at lower temperatures, which will be corroborated by frequency-dependent measurements.
To gain further insight, we examine how features in the temperature dependence of for Flake A evolve with increasing bias field during FC. As shown in Fig. 4b-d, the behavior of for different closely overlaps in the paramagnetic region, but separates below . For larger , the enhanced field pressure accelerates the depinning and expansion of domains aligned with the field, causing a more rapid rise in the dc magnetization. Concomitantly, peaks at higher temperatures during FC and terminates at lower values at 4 K, reflecting accelerated domain consolidation and reduction of domain wall area.
These effects are particularly dramatic for FC at the highest = 10.6 mT (Fig. 4d), where is significantly reduced below as the flake immediately forms large domains. The dual-humped shape of should reflect the motion of only a handful of domain walls in the pinning landscape of Flake A, since the dc magnetization reaches approximately the saturated, single-domain value and drops to zero at 4 K. Away from , should evolve smoothly when averaging over the behavior of a statistical ensemble of domain walls. In contrast, the sharp turnaround of here at 20 K can be interpreted to correspond to the thermal depinning of a single domain wall from a strong pinning center, analogous to a Barkhausen jump in the dc hysteresis measurement.
VI Frequency-Dependent AC Susceptibility
Finally, we demonstrate frequency-dependent ac susceptibility measurements by sweeping of the coil field, while changing the repetition rate of the NV -pulses to maintain lock-in condition. We increase the number of -pulses for larger so that the total duration of the sensing sequence remains roughly constant, giving us similar precision on the determination of . For 6 mT, we gather data for spanning 119 kHz (using 8 -pulses) to 714 kHz (48 -pulses). The lower range is limited by the 13C nuclear spin bath inside diamond, which reduces the NV center coherence as overlaps the 13C Larmor frequency (64 kHz), and the upper by the finite duration of our -pulse. Intrinsically, NV susceptometry is applicable to a wider frequency range, leveraging longer coherence times in surface-engineered, isotopically-purified samples [48] and faster spin inversions in the strong driving regime (100 MHz effective Rabi frequency [49]).
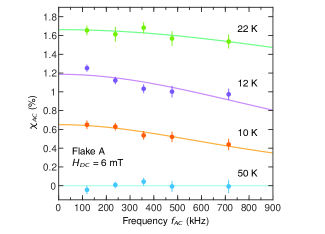
As displayed in Fig. 5, for Flake A is independent of well above (50 K, blue), as expected. At 22 K, however, during the initial rise of the field-cooling (green arrow in Fig. 4c), we observe a weak decrease in for higher excitation frequencies. This effect becomes more pronounced upon further cooling, as begins to decrease with temperature. Increasing sixfold from 119 kHz to 714 kHz, the susceptibility is reduced by a factor of at 22 K, at 12 K, and at 10 K.
As first elucidated by Döring [50], the displacement of a domain wall satisfies the phenomenological equation:
| (1) |
where is the apparent mass of the wall, is the viscous damping, is the restoring force due to the local potential, and is the driving force due to the field pressure on a 180∘ domain wall. For an oscillating field with , the susceptibility is proportional to the displacement and is thus analogous to the transfer function of a driven damped harmonic oscillator:
| (2) |
where is the dc susceptibility, is the domain wall resonance, and is a relaxation frequency, reflecting the timescale for displacements to decay. For dc fields , the phenomenological mobility of a uniform domain wall is in this model [51].
The domain wall resonance for thin platelets has been measured to exceed 700 MHz [52], and hence can be neglected for excitation frequencies applied here, leaving
| (3) |
The solid lines in Fig. 5 show fits of our data to Eq. 3. The fitted decreases monotonically from 2 MHz at 22 K to 1 MHz at 10 K, indicating longer relaxation times resulting most likely from stronger domain wall damping . For ferromagnetic insulators, is contributed by spin-lattice relaxation that similarly damps magnetization precession (Gilbert damping) and is proportional to , which increases with decreasing temperature [53]. In context, the robustness of here to frequencies exceeding hundreds of kilohertz contrasts with the behavior of conventional ferromagnetic materials that are commonly characterized in SQUID magnetometers with bandwidths of a few kilohertz. Our measurements thus underscore the overall low damping and high mobility of domain walls in ultrathin [44].
VII Conclusion
The ac susceptometry technique developed here establishes NV magnetometry as a true multi-modal probe for ultrathin magnetic materials, combining nanoscale spatial resolution and quantitative magnetization characterization previously demonstrated using dc field measurements [18, 19, 20, 21] with now access to a wide bandwidth of dynamical magnetization phenomena. Although we did not measure monolayer samples, the precision on our ac field measurements (40 nT), enabled by our active protection of the NV spin coherence, exceeds that of prior dc magnetometry on 2D magnetic monolayers by two orders of magnitude. This remarkable sensitivity allowed us to resolve the ac magnetic response due to paramagnetic spin rotation and domain wall motion in single, few-layer flakes, showing the latter to be strongly influenced by the domain morphology and local pinning landscape of the flake. A future opportunity lies in the investigation of the out-of-phase component of the ac susceptibility, which can be compared through the fluctuation-dissipation theorem to simultaneous spin noise spectra measured by NV magnetometry [54]. Our exciting development thus opens the door to understanding sub-gigahertz magnetic dynamics in diverse 2D materials, including antiferromagnets [13], superconductors [55], and quantum spin liquids [56] that lack magneto-optical coupling, and in single molecule magnets [57] and superparamagnetic nanoparticles [58] at the single particle limit.
VIII Acknowledgments
The authors thank B. Flebus and Q. Ma for valuable discussions. B.B.Z acknowledges support from the National Science Foundation award No. ECCS-2041779. F.T. acknowledges support from the National Science Foundation award No. DMR-1708929. M.J.G. was supported by the National Science Foundation grant DMR-2003343, and K.S.B. was supported by the Office of Naval Research under award No. N00014-20-1-2308.
X.-Y.Z. and B.B.Z. devised the experiment. X.-Y.Z. and Y.-X.W. built the cryogenic confocal system. X.-.Y.Z. acquired and analyzed the data with assistance from Y.-X.W., T.D., and B.B.Z. T.A.T and F.T. synthesized the samples. M.J.G. and K.S.B maintained the glovebox and AFM, and instructed X.-Y.Z. on their use. B.B.Z. and X.-Y.Z. wrote the paper with contributions from all authors.
References
- Burch et al. [2018] K. S. Burch, D. Mandrus, and J. G. Park, Magnetism in two-dimensional van der Waals materials, Nature 563, 47 (2018).
- Gong and Zhang [2019] C. Gong and X. Zhang, Two-dimensional magnetic crystals and emergent heterostructure devices, Science 363, eaav4450 (2019).
- Mak et al. [2019] K. F. Mak, J. Shan, and D. C. Ralph, Probing and controlling magnetic states in 2D layered magnetic materials, Nature Reviews Physics 1, 646 (2019).
- Buchner et al. [2018] M. Buchner, K. Höfler, B. Henne, V. Ney, and A. Ney, Tutorial: Basic principles, limits of detection, and pitfalls of highly sensitive SQUID magnetometry for nanomagnetism and spintronics, Journal of Applied Physics 124, 161101 (2018).
- Huang et al. [2017] B. Huang, G. Clark, E. Navarro-Moratalla, D. R. Klein, R. Cheng, K. L. Seyler, D. Zhong, E. Schmidgall, M. A. McGuire, D. H. Cobden, W. Yao, D. Xiao, P. Jarillo-Herrero, and X. Xu, Layer-dependent ferromagnetism in a van der Waals crystal down to the monolayer limit, Nature 546, 270 (2017).
- Gong et al. [2017] C. Gong, L. Li, Z. Li, H. Ji, A. Stern, Y. Xia, T. Cao, W. Bao, C. Wang, Y. Wang, Z. Q. Qiu, R. J. Cava, S. G. Louie, J. Xia, and X. Zhang, Discovery of intrinsic ferromagnetism in two-dimensional van der Waals crystals, Nature 546, 265 (2017).
- Jin et al. [2020] C. Jin, Z. Tao, K. Kang, K. Watanabe, T. Taniguchi, K. F. Mak, and J. Shan, Imaging and control of critical fluctuations in two-dimensional magnets, Nature Materials 19, 1290 (2020).
- Zhang et al. [2020] X. X. Zhang, L. Li, D. Weber, J. Goldberger, K. F. Mak, and J. Shan, Gate-tunable spin waves in antiferromagnetic atomic bilayers, Nature Materials 19, 838 (2020).
- Seyler et al. [2018] K. L. Seyler, D. Zhong, D. R. Klein, S. Gao, X. Zhang, B. Huang, E. Navarro-Moratalla, L. Yang, D. H. Cobden, M. A. McGuire, W. Yao, D. Xiao, P. Jarillo-Herrero, and X. Xu, Ligand-field helical luminescence in a 2D ferromagnetic insulator, Nature Physics 14, 277 (2018).
- Zhang et al. [2019] Z. Zhang, J. Shang, C. Jiang, A. Rasmita, W. Gao, and T. Yu, Direct Photoluminescence Probing of Ferromagnetism in Monolayer Two-Dimensional CrBr3, Nano Letters 19, 3138 (2019).
- Ghazaryan et al. [2018] D. Ghazaryan, M. T. Greenaway, Z. Wang, V. H. Guarochico-Moreira, I. J. Vera-Marun, J. Yin, Y. Liao, S. V. Morozov, O. Kristanovski, A. I. Lichtenstein, M. I. Katsnelson, F. Withers, A. Mishchenko, L. Eaves, A. K. Geim, K. S. Novoselov, and A. Misra, Magnon-assisted tunnelling in van der Waals heterostructures based on CrBr3, Nature Electronics 1, 344 (2018).
- Klein et al. [2018] D. R. Klein, D. MacNeill, J. L. Lado, D. Soriano, E. Navarro-Moratalla, K. Watanabe, T. Taniguchi, S. Manni, P. Canfield, J. Fernández-Rossier, and P. Jarillo-Herrero, Probing magnetism in 2D van der Waals crystalline insulators via electron tunneling, Science 360, 1218 (2018).
- Wang et al. [2019] Z. Wang, M. Gibertini, D. Dumcenco, T. Taniguchi, K. Watanabe, E. Giannini, and A. F. Morpurgo, Determining the phase diagram of atomically thin layered antiferromagnet CrCl3, Nature Nanotechnology 14, 1116 (2019).
- Wu et al. [2019] M. Wu, Z. Li, T. Cao, and S. G. Louie, Physical origin of giant excitonic and magneto-optical responses in two-dimensional ferromagnetic insulators, Nature Communications 10, 2371 (2019).
- Paudel and Tsymbal [2019] T. R. Paudel and E. Y. Tsymbal, Spin Filtering in CrI3 Tunnel Junctions, ACS Applied Materials & Interfaces 11, 15781 (2019).
- Molina-Sánchez et al. [2020] A. Molina-Sánchez, G. Catarina, D. Sangalli, and J. Fernández-Rossier, Magneto-optical response of chromium trihalide monolayers: chemical trends, Journal of Materials Chemistry C 8, 8856 (2020).
- Kim et al. [2019a] M. Kim, P. Kumaravadivel, J. Birkbeck, W. Kuang, S. G. Xu, D. G. Hopkinson, J. Knolle, P. A. McClarty, A. I. Berdyugin, M. Ben Shalom, R. V. Gorbachev, S. J. Haigh, S. Liu, J. H. Edgar, K. S. Novoselov, I. V. Grigorieva, and A. K. Geim, Micromagnetometry of two-dimensional ferromagnets, Nature Electronics 2, 457 (2019a).
- Thiel et al. [2019] L. Thiel, Z. Wang, M. A. Tschudin, D. Rohner, I. Gutiérrez-Lezama, N. Ubrig, M. Gibertini, E. Giannini, A. F. Morpurgo, and P. Maletinsky, Probing magnetism in 2D materials at the nanoscale with single-spin microscopy, Science 364, 973 (2019).
- Broadway et al. [2020] D. A. Broadway, S. C. Scholten, C. Tan, N. Dontschuk, S. E. Lillie, B. C. Johnson, G. Zheng, Z. Wang, A. R. Oganov, S. Tian, C. Li, H. Lei, L. Wang, L. C. L. Hollenberg, and J. Tetienne, Imaging Domain Reversal in an Ultrathin Van der Waals Ferromagnet, Advanced Materials 32, 2003314 (2020).
- Sun et al. [2021] Q.-C. Sun, T. Song, E. Anderson, A. Brunner, J. Förster, T. Shalomayeva, T. Taniguchi, K. Watanabe, J. Gräfe, R. Stöhr, X. Xu, and J. Wrachtrup, Magnetic domains and domain wall pinning in atomically thin CrBr3 revealed by nanoscale imaging, Nature Communications 12, 1989 (2021).
- Fabre et al. [2021] F. Fabre, A. Finco, A. Purbawati, A. Hadj-Azzem, N. Rougemaille, J. Coraux, I. Philip, and V. Jacques, Characterization of room-temperature in-plane magnetization in thin flakes of CrTe2 with a single-spin magnetometer, Physical Review Materials 5, 034008 (2021).
- Cenker et al. [2021] J. Cenker, B. Huang, N. Suri, P. Thijssen, A. Miller, T. Song, T. Taniguchi, K. Watanabe, M. A. McGuire, D. Xiao, and X. Xu, Direct observation of two-dimensional magnons in atomically thin CrI3, Nature Physics 17, 20 (2021).
- Bałanda [2013] M. Bałanda, AC susceptibility studies of phase transitions and magnetic relaxation: Conventional, molecular and low-dimensional magnets, Acta Physica Polonica A 124, 964 (2013).
- Topping and Blundell [2019] C. V. Topping and S. J. Blundell, A.C. susceptibility as a probe of low-frequency magnetic dynamics, Journal of Physics: Condensed Matter 31, 013001 (2019).
- Gibertini et al. [2019] M. Gibertini, M. Koperski, A. F. Morpurgo, and K. S. Novoselov, Magnetic 2D materials and heterostructures, Nature Nanotechnology 14, 408 (2019).
- Chikazumi [1997] S. Chikazumi, Physics of Ferromagnetism (Oxford University Press, Oxford, 1997) 2nd ed., Chap. 18.
- Lovchinsky et al. [2017] I. Lovchinsky, J. D. Sanchez-Yamagishi, E. K. Urbach, S. Choi, S. Fang, T. I. Andersen, K. Watanabe, T. Taniguchi, A. Bylinskii, E. Kaxiras, P. Kim, H. Park, and M. D. Lukin, Magnetic resonance spectroscopy of an atomically thin material using a single-spin qubit, Science 355, 503 (2017).
- Zhou et al. [2020] B. B. Zhou, P. C. Jerger, K.-H. Lee, M. Fukami, F. Mujid, J. Park, and D. D. Awschalom, Spatiotemporal Mapping of a Photocurrent Vortex in Monolayer MoS2 Using Diamond Quantum Sensors, Physical Review X 10, 011003 (2020).
- Parkin and Yang [2015] S. Parkin and S.-H. Yang, Memory on the racetrack, Nature Nanotechnology 10, 195 (2015).
- Vélez et al. [2019] S. Vélez, J. Schaab, M. S. Wörnle, M. Müller, E. Gradauskaite, P. Welter, C. Gutgsell, C. Nistor, C. L. Degen, M. Trassin, M. Fiebig, and P. Gambardella, High-speed domain wall racetracks in a magnetic insulator, Nature Communications 10, 4750 (2019).
- Grollier et al. [2020] J. Grollier, D. Querlioz, K. Y. Camsari, K. Everschor-Sitte, S. Fukami, and M. D. Stiles, Neuromorphic spintronics, Nature Electronics 3, 360 (2020).
- Abramchuk et al. [2018] M. Abramchuk, S. Jaszewski, K. R. Metz, G. B. Osterhoudt, Y. Wang, K. S. Burch, and F. Tafti, Controlling Magnetic and Optical Properties of the van der Waals Crystal CrCl(3-x)Br(x) via Mixed Halide Chemistry, Advanced Materials 30, 1801325 (2018).
- Tartaglia et al. [2020] T. A. Tartaglia, J. N. Tang, J. L. Lado, F. Bahrami, M. Abramchuk, G. T. McCandless, M. C. Doyle, K. S. Burch, Y. Ran, J. Y. Chan, and F. Tafti, Accessing new magnetic regimes by tuning the ligand spin-orbit coupling in van der Waals magnets, Science Advances 6, eabb9379 (2020).
- Kim et al. [2019b] H. H. Kim, B. Yang, S. Li, S. Jiang, C. Jin, Z. Tao, G. Nichols, F. Sfigakis, S. Zhong, C. Li, S. Tian, D. G. Cory, G.-X. Miao, J. Shan, K. F. Mak, H. Lei, K. Sun, L. Zhao, and A. W. Tsen, Evolution of interlayer and intralayer magnetism in three atomically thin chromium trihalides, Proceedings of the National Academy of Sciences 116, 11131 (2019b).
- Hingant et al. [2015] T. Hingant, J.-P. Tetienne, L. J. Martínez, K. Garcia, D. Ravelosona, J.-F. Roch, and V. Jacques, Measuring the Magnetic Moment Density in Patterned Ultrathin Ferromagnets with Submicrometer Resolution, Physical Review Applied 4, 014003 (2015).
- Degen et al. [2017] C. L. Degen, F. Reinhard, and P. Cappellaro, Quantum sensing, Reviews of Modern Physics 89, 035002 (2017).
- Aslam et al. [2017] N. Aslam, M. Pfender, P. Neumann, R. Reuter, A. Zappe, F. Fávaro de Oliveira, A. Denisenko, H. Sumiya, S. Onoda, J. Isoya, and J. Wrachtrup, Nanoscale nuclear magnetic resonance with chemical resolution, Science 357, 67 (2017).
- Glenn et al. [2018] D. R. Glenn, D. B. Bucher, J. Lee, M. D. Lukin, H. Park, and R. L. Walsworth, High-resolution magnetic resonance spectroscopy using a solid-state spin sensor, Nature 555, 351 (2018).
- Shi et al. [2015] F. Shi, Q. Zhang, P. Wang, H. Sun, J. Wang, X. Rong, M. Chen, C. Ju, F. Reinhard, H. Chen, J. Wrachtrup, J. Wang, and J. Du, Single-protein spin resonance spectroscopy under ambient conditions, Science 347, 1135 (2015).
- Salas and Mirabal-Garca [1990] F. H. Salas and M. Mirabal-Garca, Quenching of the Hopkinson maximum under contamination in the system Gd(0001)/W(110), Physical Review B 41, 10859 (1990).
- Liu and Petrovic [2018] Y. Liu and C. Petrovic, Anisotropic magnetocaloric effect in single crystals of CrI3, Physical Review B 97, 174418 (2018).
- Bostanjoglo and Vieweger [1970] O. Bostanjoglo and W. Vieweger, Magnetische Bereiche in Chromtrihalogeniden, Phys. Status Solidi B 39, 471 (1970).
- Ho and Litster [1969] J. T. Ho and J. D. Litster, Divergences of the Magnetic Properties of CrBr3 near the Critical Point, Journal of Applied Physics 40, 1270 (1969).
- Wahab et al. [2021] D. A. Wahab, M. Augustin, S. M. Valero, W. Kuang, S. Jenkins, E. Coronado, I. V. Grigorieva, I. J. Vera‐Marun, E. Navarro‐Moratalla, R. F. L. Evans, K. S. Novoselov, and E. J. G. Santos, Quantum Rescaling, Domain Metastability, and Hybrid Domain‐Walls in 2D CrI3 Magnets, Advanced Materials 33, 2004138 (2021).
- Tiwari et al. [2021] S. Tiwari, M. L. Van de Put, B. Sorée, and W. G. Vandenberghe, Critical behavior of the ferromagnets CrI3, CrBr3, and CrGeTe3 and the antiferromagnet FeCl2: A detailed first-principles study, Physical Review B 103, 014432 (2021).
- Richter et al. [2018] N. Richter, D. Weber, F. Martin, N. Singh, U. Schwingenschlögl, B. V. Lotsch, and M. Kläui, Temperature-dependent magnetic anisotropy in the layered magnetic semiconductors CrI3 and CrBr3, Physical Review Materials 2, 024004 (2018).
- Kuhlow and Lambeck [1975] B. Kuhlow and M. Lambeck, Magnetic domain structures in CrBr3, Physica B+C 80, 365 (1975).
- Eichhorn et al. [2019] T. R. Eichhorn, C. A. McLellan, and A. C. Bleszynski Jayich, Optimizing the formation of depth-confined nitrogen vacancy center spin ensembles in diamond for quantum sensing, Physical Review Materials 3, 113802 (2019).
- Fuchs et al. [2009] G. D. Fuchs, V. V. Dobrovitski, D. M. Toyli, F. J. Heremans, and D. D. Awschalom, Gigahertz Dynamics of a Strongly Driven Single Quantum Spin, Science 326, 1520 (2009).
- Rado et al. [1950] G. T. Rado, R. W. Wright, and W. H. Emerson, Ferromagnetism at Very High Frequencies. III. Two Mechanisms of Dispersion in a Ferrite, Physical Review 80, 273 (1950).
- Guyot and Cagan [1982] M. Guyot and V. Cagan, Temperature dependence of the domain wall mobility in YIG, deduced from the frequency spectra of the initial susceptibility of polycrystals, Journal of Magnetism and Magnetic Materials 27, 202 (1982).
- Jedryka et al. [1982] E. Jedryka, R. J. Yeh, M. Ramesh, P. E. Wigen, and A. Pajaczkowska, Temperature dependence of domain wall resonance in CrBr3, Journal of Applied Physics 53, 8357 (1982).
- Infante et al. [2009] G. Infante, R. Varga, G. A. Badini-Confalonieri, and M. Vázquez, Locally induced domain wall damping in a thin magnetic wire, Applied Physics Letters 95, 012503 (2009).
- Romach et al. [2015] Y. Romach, C. Müller, T. Unden, L. J. Rogers, T. Isoda, K. M. Itoh, M. Markham, A. Stacey, J. Meijer, S. Pezzagna, B. Naydenov, L. P. McGuinness, N. Bar-Gill, and F. Jelezko, Spectroscopy of Surface-Induced Noise Using Shallow Spins in Diamond, Physical Review Letters 114, 017601 (2015).
- Xi et al. [2016] X. Xi, Z. Wang, W. Zhao, J.-H. Park, K. T. Law, H. Berger, L. Forró, J. Shan, and K. F. Mak, Ising pairing in superconducting NbSe2 atomic layers, Nature Physics 12, 139 (2016).
- Xu et al. [2020] C. Xu, J. Feng, M. Kawamura, Y. Yamaji, Y. Nahas, S. Prokhorenko, Y. Qi, H. Xiang, and L. Bellaiche, Possible Kitaev Quantum Spin Liquid State in 2D Materials with S=3/2, Physical Review Letters 124, 087205 (2020).
- Guo et al. [2018] F.-S. Guo, B. M. Day, Y.-C. Chen, M.-L. Tong, A. Mansikkamäki, and R. A. Layfield, Magnetic hysteresis up to 80 kelvin in a dysprosium metallocene single-molecule magnet, Science 362, 1400 (2018).
- Van De Loosdrecht et al. [2019] M. M. Van De Loosdrecht, S. Draack, S. Waanders, J. G. Schlief, H. J. Krooshoop, T. Viereck, F. Ludwig, and B. Ten Haken, A novel characterization technique for superparamagnetic iron oxide nanoparticles: The superparamagnetic quantifier, compared with magnetic particle spectroscopy, Review of Scientific Instruments 90, 024101 (2019).