TAT-QA: A Question Answering Benchmark on a Hybrid of Tabular and Textual Content in Finance
Abstract
Hybrid data combining both tabular and textual content (e.g., financial reports) are quite pervasive in the real world. However, Question Answering (QA) over such hybrid data is largely neglected in existing research. In this work, we extract samples from real financial reports to build a new large-scale QA dataset containing both Tabular And Textual data, named TAT-QA, where numerical reasoning is usually required to infer the answer, such as addition, subtraction, multiplication, division, counting, comparison/sorting, and their compositions. We further propose a novel QA model termed TagOp, which is capable of reasoning over both tables and text. It adopts sequence tagging to extract relevant cells from the table along with relevant spans from the text to infer their semantics, and then applies symbolic reasoning over them with a set of aggregation operators to arrive at the final answer. TagOp achieves % in F1, which is an % absolute increase over the previous best baseline model, according to our experiments on TAT-QA. But this result still lags far behind the performance of human expert, i.e. % in F1. It demonstrates that our TAT-QA is very challenging and can serve as a benchmark for training and testing powerful QA models that address hybrid data. Our dataset is publicly available for non-commercial use at https://nextplusplus.github.io/TAT-QA/.
1 Introduction
Existing QA systems largely focus on only unstructured text Hermann et al. (2015); Rajpurkar et al. (2016); Dua et al. (2019); Yang et al. (2018); Li et al. (2020); Nie et al. (2020), structured knowledge base (KB) (Berant et al., 2013; Yih et al., 2015; Talmor and Berant, 2018), or semi-structured tables (Pasupat and Liang, 2015; Zhong et al., 2017; Yu et al., 2018; Zhang and Balog, 2019; Zhang et al., 2020). Though receiving growing interests (Das et al., 2017; Sun et al., 2019; Chen et al., 2020b, 2021), works on hybrid data comprising of unstructured text and structured or semi-structured KB/tables are rare. Recently, Chen et al. (2020b) attempt to simulate a type of hybrid data through manually linking table cells to Wiki pages via hyperlinks. However, such connection between table and text is relatively loose.
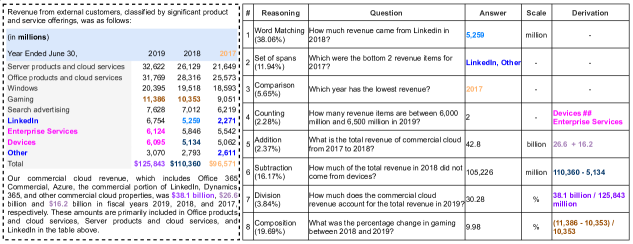
In the real world, a more common hybrid data form is, the table (that usually contains numbers) is more comprehensively linked to text, e.g., semantically related or complementary. Such hybrid data are very pervasive in various scenarios like scientific research papers, medical reports, financial reports, etc. The left box of Figure 1 shows a real example from some financial report, where there is a table containing row/column header and numbers inside, and also some paragraphs describing it. We call the hybrid data like this example hybrid context in QA problems, as it contains both tabular and textual content, and call the paragraphs associated paragraphs to the table. To comprehend and answer a question from such hybrid context relies on the close relation between table and paragraphs, and usually requires numerical reasoning. For example, one needs to identify “revenue from the external customers” in the describing text so as to understand the content of the table. As for “How much does the commercial cloud revenue account for the total revenue in 2019?”, one needs to get the total revenue in 2019, i.e. “ million” from the table and commercial cloud revenue, i.e. “ billion”, from the text to infer the answer.
To stimulate progress of QA research over such hybrid data, we propose a new dataset, named TAT-QA (Tabular And Textual dataset for Question Answering). The hybrid contexts in TAT-QA are extracted from real-world financial reports, each composed of a table with row/col header and numbers, as well as at least two paragraphs that describe, analyse or complement the content of this table. Given hybrid contexts, we invite annotators with financial knowledge to generate questions that are useful in real-world financial analyses and provide answers accordingly. It is worth mentioning that a large portion of questions in TAT-QA demand numerical reasoning, for which derivation of the answer is also labeled to facilitate developing explainable models. In total, TAT-QA contains questions associated with hybrid contexts from reports.
We further propose a novel TagOp model based on TAT-QA. Taking as input the given question, table and associated paragraphs, TagOp applies sequence tagging to extract relevant cells from the table and relevant spans from text as the evidences. Then it applies symbolic reasoning over them with a set of aggregation operators to arrive at the final answer. Predicting the magnitude of a number is an important aspect when tackling hybrid data in TAT-QA, including thousand, million, billion, etc. that are often omitted or shown only in headers or associated paragraphs of the table for brevity. We term such magnitude of a number as its scale. Take Question 6 in Figure 1 as an example: “How much of the total revenue in 2018 did not come from devices?” The numerical value in the answer is obtained by subtraction: “ - ”, while the scale “million” is identified from the first-row header of the table. In TagOp, we incorporate a multi-class classifier for scale prediction.
We test three types of QA models on TAT-QA, specially addressing tabular, textual, and hybrid data. Our TagOp achieves % in terms of F1, which is a % absolute increase over the best baseline model, according to our experiments on TAT-QA. It is worth noting that the results still lag far behind performance of human experts, i.e. % in F1. We can see that to tackle the QA task over the hybrid data as in TAT-QA is challenging and more effort is demanded. We expect our TAT-QA dataset and TagOp model to serve as a benchmark and baseline respectively to contribute to the development of QA models for hybrid data, especially those requiring numerical reasoning.
2 Dataset Construction and Analysis
We here explain how we construct TAT-QA and analyze its statistics to better reveal its proprieties.
2.1 Data Collection and Preprocessing
In TAT-QA there are two forms of data: tables and their relevant text, which are extracted from real-world financial reports.
In particular, we first download about financial reports released in the past two years from an online website111https://www.annualreports.com/. We adopt the table detection model in (Li et al., 2019) to detect tables in these reports, and apply Apache PDFBox222https://pdfbox.apache.org/ library to extract the table contents to be processed with our annotation tool. We only keep those tables with rows and columns. Finally, about candidate tables are retained, which have no standard schema and lots of numbers inside. The corresponding reports with selected tables are also kept. Note that these candidate tables may still contain errors, such as containing too few or many rows/cols, mis-detected numbers, which will be manually picked out and deleted or fixed during the annotation process.
2.2 Dataset Annotation
The annotation is done with our self-developed tool. All the annotators are with financial background knowledge.
Adding Relevant Paragraphs to Tables We build valid hybrid contexts based on the original reports kept in the previous step. A valid hybrid context in TAT-QA consists of a table and at least two associated paragraphs surrounding it, as shown in the left box in Figure 1. To associate enough relevant paragraphs to a candidate table, the annotators first check whether there are paragraphs around this table, and then check whether they are relevant, meaning the paragraphs should be describing, analysing or complementing the content in the table. If yes, then all the surrounding paragraphs will be associated to this table. Otherwise, the table will be skipped (discarded).333About two thirds of candidate tables were discarded.
Question-Answer Pair Creation Based on the valid hybrid contexts, the annotators are then asked to create question-answer pairs, where the questions need to be useful in real-world financial analyses. In addition, we encourage them to create questions that can be answered by people without much finance knowledge and use common words instead of the same words appeared in the hybrid context (Rajpurkar et al., 2016). Given one hybrid context, at least questions are generated, including extracted and calculated questions. For extracted questions, the answers can be a single span or multiple spans from either the table or the associated paragraphs. For calculated questions, numerical reasoning is required to produce the answers, including addition, subtraction, multiplication, division, counting, comparison/sorting and their compositions. Furthermore, we particularly ask the annotators to annotate the right scale for the numerical answer when necessary.
Answer Type and Derivation Annotation The answers in TAT-QA have three types: a single span or multiple spans extracted from the table or text, as well as a generated answer (usually obtained through numerical reasoning). The annotators will also need to label its type after they generate an answer. For generated answers, the corresponding derivations are provided to facilitate the development of explainable QA models, including two types: 1) an arithmetic expression, like ( - )/) for Question 8 in Figure 1, which can be executed to arrive at the final answer; and 2) a set of items separated with “##”, like “device ## enterprise services” for Question 4 in Figure 1 where the count of items equals the answer. We further divide questions in TAT-QA into four kinds: Span, Spans, Arithmetic and Counting, where the latter two kinds correspond to the above two types of deviations, to help us better investigate the numerical reasoning capability of a QA model.
Answer Source Annotation For each answer, annotators are required to specify the source(s) it is derived from, including Table, Text, and Table-text (both). This is to force the model to learn to aggregate information from hybrid sources to infer the answer, thus lift its generalizability. For example, to answer Question 7 in Figure 1: “How much does the commercial cloud revenue account for the total revenue in 2019?”, we can observe from the derivation that “ million” comes from the table while “ billion” from text.
2.3 Quality Control
To ensure the quality of annotation in TAT-QA, we apply strict quality control procedures.
Competent Annotators To build TAT-QA, financial domain knowledge is necessary. Hence, we employ about university students majored in finance or similar disciplines as annotators. We give all candidate annotators a minor test and only those with correct rate are hired. Before starting the annotation work, we give a training session to the annotators to help them fully understand our annotation requirements and also learn the usage of our annotation system.
Two-round Validation For each annotation, we ask two different verifiers to perform a two-round validation after it is submitted, including checking and approval, to ensure its quality. We have five verifiers in total, including two annotators who have good performance on this project and three graduate students with financial background. In the checking phase, a verifier checks the submitted annotation and asks the annotator to fix it if any mistake or problem is found. In the approval phase, a different verifier inspects the annotation again that has been confirmed by the first verifier, and then approves it if no problem is found.
2.4 Dataset Analysis
Averagely, an annotator can label two hybrid contexts per hour; the whole annotation work lasts about three months. Finally, we attain a total of hybrid contexts and corresponding question-answer pairs from financial reports. The hybrid contexts are randomly split into training set (), development set () and test set (); hence all questions about a particular hybrid context belong to only one of the splits. We show the basic statistics of each split in Table 1, and the question distribution regarding answer source and answer type in Table 2. In Figure 1, we give an example from TAT-QA, demonstrating the various reasoning types and percentage of each reasoning type over the whole dataset.
| Statistic | Train | Dev | Test |
| # of hybrid contexts | 2,201 | 278 | 278 |
| # of questions | 13,215 | 1,668 | 1,669 |
| Avg. rows / table | 9.4 | 9.7 | 9.3 |
| Avg. cols / table | 4.0 | 3.9 | 4.0 |
| Avg. paragraphs / table | 4.8 | 4.9 | 4.6 |
| Avg. paragraph len [words] | 43.6 | 44.8 | 42.6 |
| Avg. question len [words] | 12.5 | 12.4 | 12.4 |
| Avg. answer len [words] | 4.1 | 4.1 | 4.3 |
| Table | Text | Table-text | Total | |
| Span | 1,801 | 3,496 | 1,842 | 7,139 |
| Spans | 777 | 258 | 1,037 | 2,072 |
| Counting | 106 | 5 | 266 | 377 |
| Arithmetic | 4,747 | 143 | 2,074 | 6,964 |
| Total | 7,431 | 3,902 | 5,219 | 16,552 |
3 TagOp Model
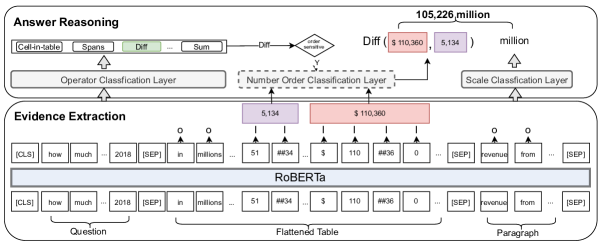
We introduce a novel QA model, named TagOp, which first applies sequence TAGging to extract relevant cells from the table and text spans from the paragraphs inspired by (Li et al., 2016; Sun et al., 2016; Segal et al., 2020). This step is analogy to slot filling or schema linking, whose effectiveness has been demonstrated in dialogue systems Lei et al. (2018); Jin et al. (2018) and semantic parsing Lei et al. (2020). And then TagOp performs symbolic reasoning over them with a set of aggregation OPerators to arrive at the final answer. The overall architecture is illustrated in Figure 2.
3.1 Sequence Tagging
Given a question, TagOp first extracts supporting evidences from its hybrid context (i.e. the table and associated paragraphs) via sequence tagging with the Inside–Outside tagging (IO) approach (Ramshaw and Marcus, 1995). In particular, it assigns each token either I or O label and takes those tagged with I as the supporting evidences for producing the answer. The given question, flattened table by row (Herzig et al., 2020) and associated paragraphs are input sequentially to a transformer-based encoder like RoBERTa (Liu et al., 2019), as shown in the bottom part of Figure 2, to obtain corresponding representations. Each sub-token is tagged independently, and the corresponding cell in the table or word in the paragraph would be regarded as positive if any of its sub-tokens is tagged with I. For the paragraphs, the continuous words that are predicted as positive are combined as a span. During testing, all positive cells and spans are taken as the supporting evidences. Formally, for each sub-token in the paragraph, the probability of the tag is computed as
| (1) |
where FFN is a two-layer feed-forward network with GELU (Hendrycks and Gimpel, 2016) activation and is the representation of sub-token .
3.2 Aggregation Operator
Next, we perform symbolic reasoning over obtained evidences to infer the final answer, for which we apply an aggregation operator. In our TagOp, there are ten types of aggregation operators. For each input question, an operator classifier is applied to decide which operator the evidences would go through; for some operators sensitive to the order of input numbers, an auxiliary number order classifier is used. The aggregation operators are explained as below, covering most reasoning types as listed in Figure 1.
-
•
Span-in-text: To select the span with the highest probability from predicted candidate spans. The probability of a span is the highest probability of all its sub-tokens tagged I.
-
•
Cell-in-table: To select the cell with the highest probability from predicted candidate cells. The probability of a cell is the highest probability of all its sub-tokens tagged I.
-
•
Spans: To select all the predicted cell and span candidates;
-
•
Sum: To sum all predicted cells and spans purely consisting of numbers;
-
•
Count: To count all predicted cells and spans;
-
•
Average: To average over all the predicted cells and spans purely consisting of numbers;
-
•
Multiplication: To multiply all predicted cells and spans purely consisting of numbers;
-
•
Division: To first rank all the predicted cells and spans purely consisting of numbers based on their probabilities, and then apply division calculation to top-two;
-
•
Difference: To first rank all predicted numerical cells and spans based on their probabilities, and then apply subtraction calculation to top-two.
-
•
Change ratio: For the top-two values after ranking all predicted numerical cells and spans based on their probabilities, compute the change ratio of the first value compared to the second one.
Operator Classifier To predict the right aggregation operator, a multi-class classifier is developed. In particular, we take the vector of [CLS] as input to compute the probability:
| (2) |
where FFN denotes a two-layer feed-forward network with the GELU activation.
Number Order Classifier For operators of Difference, Division and Change ratio, the order of the input two numbers matters in the final result. Hence we additionally append a number order classifier after them, formulated as
| (3) |
where FFN denotes a two-layer feed-forward network with the GELU activation, , are representations of the top two tokens according to probability, and “avg” means average. For a token, its probability is the highest probability of all its sub-tokens tagged I, and its representation is the average over those of its sub-tokens.
3.3 Scale Prediction
Till now we have attained the string or numerical value to be contained in the final answer. However, a right prediction of a numerical answer should not only include the right number but also the correct scale. This is a unique challenge over TAT-QA and very pervasive in the context of finance. We develop a multi-class classifier to predict the scale. Generally, the scale in TAT-QA may be None, Thousand, Million, Billion, and Percent. Taking as input the concatenated representation of [CLS], the table and paragraphs sequentially, the multi-class classifier computes the probability of the scale as
| (4) |
where and are the representations of the table and the paragraphs respectively, which are obtained by applying an average pooling over the representations of their corresponding tokens,“;” denotes concatenation, and FFN denotes a two-layer feed-forward network with the GELU activation.
After obtaining the scale, the numerical or string prediction is multiplied or concatenated with the corresponding scale as the final prediction to compare with the ground-truth answer respectively.
3.4 Training
To optimize TagOp, the overall loss is the sum of the loss of the above four classification tasks:
| (5) |
where NLL(·) is the negative log-likelihood loss, and come from the supporting evidences which are extracted from the annotated answer and derivation. We locate the evidence in the table first if it is among the answer sources, and otherwise in its associated paragraphs. Note we only keep the first found if an evidence appears multiple times in the hybrid context. uses the annotated scale of the answer; is needed when the ground-truth operator is one of Difference, Division and Change ratio, which is obtained by mapping the two operands extracted from their corresponding ground-truth deviation in the input sequence. If their order is the same as that in the input sequence, ; otherwise it is .
4 Experiments and Results
4.1 Baselines
Textual QA Models We adopt two reading comprehension (RC) models as baselines over textual data: BERT-RC (Devlin et al., 2018), which is a SQuAD-style RC model; and NumNet+ V2 444https://github.com/llamazing/numnet_plus (Ran et al., 2019), which achieves promising performance on DROP that requires numerical reasoning over textual data. We adapt them to our TAT-QA as follows. We convert the table to a sequence by row, also as input to the models, followed by tokens from the paragraphs. Besides, we add a multi-class classifier, exactly as in our TagOp, to enable the two models to predict the scale based on Eq. (4).
Tabular QA Model We employ TaPas for WikiTableQuestion (WTQ) (Herzig et al., 2020) as a baseline over tabular data. TaPas is pretrained over large-scale tables and associated text from Wikipedia jointly for table parsing. To train it, we heuristically locate the evidence in the table with the annotated answer or derivation, which is the first matched one if a same value appears multiple times. In addition, we remove the “numerical rank id” feature in its embedding layer, which ranks all values per numerical column in the table but does not make sense in TAT-QA. Similar to above textual QA setting, we add an additional multi-class classifier to predict the scale as in Eq. (4).
Hybrid QA Model We adopt HyBrider (Chen et al., 2020b) as our baseline over hybrid data, which tackles tabular and textual data from Wikipedia. We use the code released in the original paper555https://github.com/wenhuchen/HybridQA, but adapt it to TAT-QA. Concretely, each cell in the table of TAT-QA is regarded as “linked” with associated paragraphs of this table, like hyperlinks in the original paper, and we only use its cell matching mechanism to link the question with the table cells in its linking stage. The selected cells and paragraphs are fed into the RC model in the last stage to infer the answer. For ease of training on TAT-QA, we also omit the prediction of the scale, i.e. we regard the predicted scale by this model as always correct.
4.2 Evaluation Metrics
We adopt the popular Exact Match (EM) and numeracy-focused F1 score (Dua et al., 2019) to measure model performance on TAT-QA. However, the original implementation of both metrics is insensitive to whether a value is positive or negative in the answer as the minus is omitted in evaluation. Since this issue is crucial for correctly interpreting numerical values, especially in the finance domain, we keep the plus-minus of a value when calculating them. In addition, the numeracy-focused F1 score is set to unless the predicted number multiplied by predicted scale equals exactly the ground truth.
4.3 Results and Analysis
In the following, we report our experimental results on dev and test sets of TAT-QA.
Comparison with Baselines We first compare our TagOp with three types of previous QA models as described in Section 4.1. The results are summarized in Table 3. It can be seen that our model is always superior to other baselines in terms of both metrics, with very large margins over the second best, namely 50.1/58.0 vs. 37.0/46.9 in EM/F1 on test set of TAT-QA respectively. This well reveals the effectiveness of our method that reasons over both tabular and textual data involving lots of numerical contents. For two textual QA baselines, NumNet+ V2 performs better than BERT-RC, which is possibly attributed to the stronger capability of numerical reasoning of the latter, but it is still worse than our method. The tabular QA baseline Tapas for WTQ is trained with only tabular data in TAT-QA, showing very limited capability to process hybrid data, as can be seen from its performance. The HyBrider is the worst among all baseline models, because it is designed for HybridQA (Chen et al., 2020b) which does not focus on the comprehensive interdependence of table and paragraphs, nor numerical reasoning.
However, all the models perform significantly worse than human performance666The human performance is evaluated by asking annotators to answer 50 randomly sampled hybrid contexts (containing 301 questions) from our test set. Note the human performance is still not 100% correct because our questions require relatively heavy cognitive load like tedious numerical calculations. Comparing human performance of F1 in SQUAD (Rajpurkar et al., 2016) (%) and DROP (Dua et al., 2019)) (%), the score (%) in our dataset already indicates a good quality and annotation consistency in our dataset., indicating TAT-QA is challenging to current QA models and more efforts on hybrid QA are demanded.
Answer Type and Source Analysis Furthermore, we analyze detailed performance of TagOp w.r.t answer type and source in Table 4. It can be seen that TagOp performs better on the questions whose answers rely on the tables compared to those from the text. This is probably because table cells have clearer boundaries than text spans to the model, thus it is relatively easy for the model to extract supporting evidences from the tables leveraging sequence tagging techniques. In addition, TagOp performs relatively worse on arithmetic questions compared with other types. This may be because the calculations for arithmetic questions are diverse and harder than other types, indicating the challenge of TAT-QA, especially for the requirement of numerical reasoning.
| Method | Dev | Test | ||
| EM | F1 | EM | F1 | |
| Human | - | - | 84.1 | 90.8 |
| Textual QA | ||||
| BERT-RC | 9.5 | 17.9 | 9.1 | 18.7 |
| NumNet+ V2 | 38.1 | 48.3 | 37.0 | 46.9 |
| Tabular QA | ||||
| TaPas for WTQ | 18.9 | 26.5 | 16.6 | 22.8 |
| Hybrid QA | ||||
| HyBrider | 6.6 | 8.3 | 6.3 | 7.5 |
| TagOp | 55.2 | 62.7 | 50.1 | 58.0 |
| Table | Text | Table-text | Total | |
| EM/F1 | EM/F1 | EM/F1 | EM/F1 | |
| Span | 56.5/57.8 | 45.2/70.6 | 68.2/71.7 | 54.1/67.9 |
| Spans | 66.3/77.0 | 19.0/59.1 | 63.2/76.9 | 60.0/75.1 |
| Counting | 63.6/63.6 | -/- | 62.1/62.1 | 62.5/62.5 |
| Arithmetic | 41.1/41.1 | 27.3/27.3 | 46.5/46.5 | 42.5/42.5 |
| Total | 47.8/49.3 | 43.3/68.7 | 58.3/62.2 | 50.1/58.0 |
Results of TagOp with Different Operators We here investigate the contributions of the ten aggregation operators to the final performance of TagOp. As shown in Table 5, we devise nine variants of the full model of TagOp; based on the variant of TagOp with only one operator (e.g. Span-in-text), for each of other variants, we add one more operator back. As can be seen from the table, all added operators can benefit the model performance. Furthermore, we find that some operators like Span-in-text, Cell-in-table, Difference and Average make more contributions than others. In comparison, Sum and Multiplication bring little gain or even decline. After analysis, we find this is because the instances of Sum or Multiplication are minor in our test set, which are easily influenced by randomness.
| Model | Dev | Test | ||
| EM | F1 | EM | F1 | |
| + Span-in-text | 13.4 | 20.5 | 14.1 | 21.8 |
| + Cell-in-table | 25.4 | 36.0 | 24.1 | 35.3 |
| + Spans | 33.6 | 41.3 | 31.3 | 39.4 |
| + Sum | 33.8 | 41.3 | 31.2 | 39.1 |
| + Count | 35.9 | 43.5 | 32.7 | 40.6 |
| + Average | 43.3 | 50.6 | 38.2 | 45.9 |
| + Multiplication | 44.2 | 51.4 | 37.9 | 46.0 |
| + Division | 45.0 | 52.5 | 39.2 | 47.5 |
| + Difference | 51.4 | 58.7 | 45.1 | 53.3 |
| + Change ratio (Full) | 55.2 | 62.7 | 50.1 | 58.0 |
Error Analysis We further investigate our TagOp by analysing error cases. We randomly sample error instances from the test set, and classify them into five categories as shown in Table 6, each with an example: (1) Wrong Evidence (%), meaning the model obtained wrong supporting evidence from the hybrid context; (2) Missing Evidence (%), meaning the model failed to extract the supporting evidence for the answer; (3) Wrong Calculation (%), meaning the model failed to compute the answer with the correct supporting evidence; (4) Unsupported Calculation (%), meaning the ten operators defined cannot support this calculation; (5) Scale Error (%), meaning the model failed to predict the scale of the numerical value in an answer.
We can then observe about % error is caused by the failure to extract the supporting evidence from the table and paragraphs given a question. This demonstrates more efforts are needed to strengthen the model’s capability of precisely aggregating information from hybrid contexts.
After instance-level analysis, we find another interesting error resource is the dependence on domain knowledge. While we encourage annotators to create questions answerable by humans without much finance knowledge, we still find domain knowledge is required for some questions. For example, given the question “What is the gross profit margin of the company in 2015?”, the model needs to extract the gross profit and revenue from the hybrid context and compute the answer according to the finance formula (“gross profit margin = gross profit / revenue”). How to integrate such finance knowledge into QA models to answer questions in TAT-QA still needs further exploration.
| Wrong Evidence (55%) | Q: How much did the level 2 OFA change by from 2018 year end to 2019 year end? |
| G: 375 - 2,032 | |
| P: 1,941 - 2,032 | |
| Missing Evidence (29%) | Q: How many years did adjusted EBITDA exceed $4,000 million? |
| G: count(2017, 2018, 2019) | |
| P: count(2017, 2018) | |
| Wrong Calculation (9%) | Q: What is the change in the % of pre-tax loss from 2018 to 2019? |
| G: 39% - 20% | |
| P: 20% - 39% | |
| Unsupported Calculation (4%) | Q: What is the proportion of investor relations and consultants over the total operating expense in 2019? |
| G: (105,639 + 245,386) /19,133,139 | |
| P: 245,386 / 19,133,139 | |
| Scale Error (3%) | Q: What is the closing price in March, 2020? |
| G: 0.22 | |
| P: 0.22 million |
5 Related Work
QA Datasets Currently, there are many datasets for QA tasks, focusing on text, or KB/table. Textual ones include CNN/Daily Mail Hermann et al. (2015), SQuAD Rajpurkar et al. (2016), etc. Recently deep reasoning over textual data has gained increasing attention Zhu et al. (2021), e.g. multi-hop reasoning (Yang et al., 2018; Welbl et al., 2018). DROP (Dua et al., 2019) is built to develop numerical reasoning capability of QA models, which in this sense is similar to TAT-QA, but only focuses on textual data. KB/Tabular QA aims to automatically answer questions via well-structured KB (Berant et al., 2013; Talmor and Berant, 2018; Yih et al., 2015) or semi-structured tables (Pasupat and Liang, 2015; Zhong et al., 2017; Yu et al., 2018). Comparably, QA over hybrid data receives limited efforts, focusing on mixture of KB/tables and text. HybridQA (Chen et al., 2020b) is one existing hybrid dataset for QA tasks, where the context is a table connected with Wiki pages via hyperlinks.
Numerical Reasoning Numerical reasoning is key to many NLP tasks like question answering (Dua et al., 2019; Ran et al., 2019; Andor et al., 2019; Chen et al., 2020a; Pasupat and Liang, 2015; Herzig et al., 2020; Yin et al., 2020; Zhang and Balog, 2020) and arithmetic word problems (Kushman et al., 2014; Mitra and Baral, 2016; Huang et al., 2017; Ling et al., 2017). To our best knowledge, no prior work attempts to develop models able to perform numerical reasoning over hybrid contexts.
6 Conclusion
We propose a new challenging QA dataset TAT-QA, comprising real-word hybrid contexts where the table contains numbers and has comprehensive dependencies on text in finance domain. To answer questions in TAT-QA, the close relation between table and paragraphs and numerical reasoning are required. We also propose a baseline model TagOp based on TAT-QA, aggregating information from hybrid context and performing numerical reasoning over it with pre-defined operators to compute the final answer. Experiments show TAT-QA dataset is very challenging and more effort is demanded for tackling QA tasks over hybrid data. We expect our TAT-QA dataset and TagOp model would serve as a benchmark and baseline respectively to help build more advanced QA models, facilitating the development of QA technologies to address more complex and realistic hybrid data, especially those requiring numerical reasoning.
Acknowledgments
The authors gratefully acknowledge Zhuyun Dai for giving valuable suggestions on this study, Xinnan Zhang for developing the data annotation tool, and Tong Ye and Ming Wei Chan for their work on checking the annotation quality. Our thanks also go to all the anonymous reviewers for their positive feedback. This research is supported by the NExT Research Centre, Singapore.
References
- Andor et al. (2019) Daniel Andor, Luheng He, Kenton Lee, and Emily Pitler. 2019. Giving BERT a calculator: Finding operations and arguments with reading comprehension. In EMNLP-IJCNLP, pages 5947–5952. ACL.
- Berant et al. (2013) Jonathan Berant, Andrew Chou, Roy Frostig, and Percy Liang. 2013. Semantic parsing on Freebase from question-answer pairs. In Proceedings of the 2013 Conference on Empirical Methods in Natural Language Processing, pages 1533–1544, Seattle, Washington, USA. ACL.
- Chen et al. (2020a) Kunlong Chen, Weidi Xu, Xingyi Cheng, Zou Xiaochuan, Yuyu Zhang, Le Song, Taifeng Wang, Yuan Qi, and Wei Chu. 2020a. Question directed graph attention network for numerical reasoning over text. In EMNLP-IJCNLP, pages 6759–6768. ACL.
- Chen et al. (2021) Wenhu Chen, Ming-Wei Chang, Eva Schlinger, William Yang Wang, and William W. Cohen. 2021. Open question answering over tables and text. In ICLR.
- Chen et al. (2020b) Wenhu Chen, Hanwen Zha, Zhiyu Chen, Wenhan Xiong, Hong Wang, and William Yang Wang. 2020b. HybridQA: A dataset of multi-hop question answering over tabular and textual data. In Findings of the Association for Computational Linguistics: EMNLP, pages 1026–1036. ACL.
- Das et al. (2017) Rajarshi Das, Manzil Zaheer, Siva Reddy, and Andrew McCallum. 2017. Question answering on knowledge bases and text using universal schema and memory networks. In Proceedings of the 55th Annual Meeting of the Association for Computational Linguistics, pages 358–365. ACL.
- Devlin et al. (2018) Jacob Devlin, Ming-Wei Chang, Kenton Lee, and Kristina Toutanova. 2018. BERT: pre-training of deep bidirectional transformers for language understanding. CoRR, abs/1810.04805.
- Dua et al. (2019) Dheeru Dua, Yizhong Wang, Pradeep Dasigi, Gabriel Stanovsky, Sameer Singh, and Matt Gardner. 2019. DROP: A reading comprehension benchmark requiring discrete reasoning over paragraphs. In Proc. of NAACL.
- Hendrycks and Gimpel (2016) Dan Hendrycks and Kevin Gimpel. 2016. Bridging nonlinearities and stochastic regularizers with gaussian error linear units. CoRR, abs/1606.08415.
- Hermann et al. (2015) Karl Moritz Hermann, Tomáš Kočiský, Edward Grefenstette, Lasse Espeholt, Will Kay, Mustafa Suleyman, and Phil Blunsom. 2015. Teaching machines to read and comprehend. In Proceedings of the 28th International Conference on Neural Information Processing Systems, pages 1693–1701. MIT Press.
- Herzig et al. (2020) Jonathan Herzig, Pawel Krzysztof Nowak, Thomas Müller, Francesco Piccinno, and Julian Eisenschlos. 2020. TaPas: Weakly supervised table parsing via pre-training. In Proceedings of the 58th Annual Meeting of the Association for Computational Linguistics, pages 4320–4333. ACL.
- Huang et al. (2017) Danqing Huang, Shuming Shi, Chin-Yew Lin, and Jian Yin. 2017. Learning fine-grained expressions to solve math word problems. In Proceedings of the 2017 Conference on Empirical Methods in Natural Language Processing, pages 805–814. ACL.
- Jin et al. (2018) Xisen Jin, Wenqiang Lei, Zhaochun Ren, Hongshen Chen, Shangsong Liang, Yihong Zhao, and Dawei Yin. 2018. Explicit state tracking with semi-supervisionfor neural dialogue generation. In Proceedings of the 27th ACM International Conference on Information and Knowledge Management, pages 1403–1412.
- Kushman et al. (2014) Nate Kushman, Yoav Artzi, Luke Zettlemoyer, and Regina Barzilay. 2014. Learning to automatically solve algebra word problems. In Proceedings of the 52nd Annual Meeting of the Association for Computational Linguistics, pages 271–281. ACL.
- Lei et al. (2018) Wenqiang Lei, Xisen Jin, Min-Yen Kan, Zhaochun Ren, Xiangnan He, and Dawei Yin. 2018. Sequicity: Simplifying task-oriented dialogue systems with single sequence-to-sequence architectures. In Proceedings of the 56th Annual Meeting of the Association for Computational Linguistics (Volume 1: Long Papers), pages 1437–1447.
- Lei et al. (2020) Wenqiang Lei, Weixin Wang, Zhixin Ma, Tian Gan, Wei Lu, Min-Yen Kan, and Tat-Seng Chua. 2020. Re-examining the role of schema linking in text-to-sql. In Proceedings of the 2020 Conference on Empirical Methods in Natural Language Processing (EMNLP), pages 6943–6954.
- Li et al. (2020) Jiaqi Li, Ming Liu, Min-Yen Kan, Zihao Zheng, Zekun Wang, Wenqiang Lei, Ting Liu, and Bing Qin. 2020. Molweni: A challenge multiparty dialogues-based machine reading comprehension dataset with discourse structure. CoRR, abs/2004.05080.
- Li et al. (2019) Minghao Li, Lei Cui, Shaohan Huang, Furu Wei, Ming Zhou, and Zhoujun Li. 2019. Tablebank: A benchmark dataset for table detection and recognition.
- Li et al. (2016) Peng Li, Wei Li, Zhengyan He, Xuguang Wang, Ying Cao, Jie Zhou, and Wei Xu. 2016. Dataset and neural recurrent sequence labeling model for open-domain factoid question answering.
- Ling et al. (2017) Wang Ling, Dani Yogatama, Chris Dyer, and Phil Blunsom. 2017. Program induction by rationale generation: Learning to solve and explain algebraic word problems. In Proceedings of the 55th Annual Meeting of the Association for Computational Linguistics, pages 158–167. ACL.
- Liu et al. (2019) Yinhan Liu, Myle Ott, Naman Goyal, Jingfei Du, Mandar Joshi, Danqi Chen, Omer Levy, Mike Lewis, Luke Zettlemoyer, and Veselin Stoyanov. 2019. Roberta: A robustly optimized BERT pretraining approach. CoRR, abs/1907.11692.
- Mitra and Baral (2016) Arindam Mitra and Chitta Baral. 2016. Learning to use formulas to solve simple arithmetic problems. In Proceedings of the 54th Annual Meeting of the Association for Computational Linguistics, pages 2144–2153. ACL.
- Nie et al. (2020) Liqiang Nie, Yongqi Li, Fuli Feng, Xuemeng Song, Meng Wang, and Yinglong Wang. 2020. Large-scale question tagging via joint question-topic embedding learning. ACM Transactions on Information Systems (TOIS), 38(2):1–23.
- Pasupat and Liang (2015) Panupong Pasupat and Percy Liang. 2015. Compositional semantic parsing on semi-structured tables. In Proceedings of the 53rd Annual Meeting of the Association for Computational Linguistics and the 7th International Joint Conference on Natural Language Processing, pages 1470–1480. ACL.
- Rajpurkar et al. (2016) Pranav Rajpurkar, Jian Zhang, Konstantin Lopyrev, and Percy Liang. 2016. SQuAD: 100,000+ questions for machine comprehension of text. In EMNLP-IJCNLP, pages 2383–2392. ACL.
- Ramshaw and Marcus (1995) Lance Ramshaw and Mitch Marcus. 1995. Text chunking using transformation-based learning. In Third Workshop on Very Large Corpora.
- Ran et al. (2019) Qiu Ran, Yankai Lin, Peng Li, Jie Zhou, and Zhiyuan Liu. 2019. NumNet: Machine reading comprehension with numerical reasoning. In EMNLP-IJCNLP, pages 2474–2484.
- Segal et al. (2020) Elad Segal, Avia Efrat, Mor Shoham, Amir Globerson, and Jonathan Berant. 2020. A simple and effective model for answering multi-span questions. In EMNLP-IJCNLP, pages 3074–3080. ACL.
- Sun et al. (2019) Haitian Sun, Tania Bedrax-Weiss, and William Cohen. 2019. PullNet: Open domain question answering with iterative retrieval on knowledge bases and text. In EMNLP-IJCNLP, pages 2380–2390. ACL.
- Sun et al. (2016) Huan Sun, Hao Ma, Xiaodong He, Wen-tau Yih, Yu Su, and Xifeng Yan. 2016. Table cell search for question answering. In Proceedings of the 25th International Conference on World Wide Web, WWW ’16, page 771–782. International World Wide Web Conferences Steering Committee.
- Talmor and Berant (2018) Alon Talmor and Jonathan Berant. 2018. The web as a knowledge-base for answering complex questions. In Proceedings of the 2018 Conference of the North American Chapter of the Association for Computational Linguistics: Human Language Technologies, Volume 1 (Long Papers), pages 641–651.
- Welbl et al. (2018) Johannes Welbl, Pontus Stenetorp, and Sebastian Riedel. 2018. Constructing datasets for multi-hop reading comprehension across documents. Transactions of the Association for Computational Linguistics, pages 287–302.
- Yang et al. (2018) Zhilin Yang, Peng Qi, Saizheng Zhang, Yoshua Bengio, William Cohen, Ruslan Salakhutdinov, and Christopher D. Manning. 2018. HotpotQA: A dataset for diverse, explainable multi-hop question answering. In Proceedings of the 2018 Conference on Empirical Methods in Natural Language Processing. ACL.
- Yih et al. (2015) Wen-tau Yih, Ming-Wei Chang, Xiaodong He, and Jianfeng Gao. 2015. Semantic parsing via staged query graph generation: Question answering with knowledge base. In Proceedings of the 53rd Annual Meeting of the Association for Computational Linguistics and the 7th International Joint Conference on Natural Language Processing, pages 1321–1331.
- Yin et al. (2020) Pengcheng Yin, Graham Neubig, Wen-tau Yih, and Sebastian Riedel. 2020. TaBERT: Pretraining for joint understanding of textual and tabular data. In ACL, pages 8413–8426. ACL.
- Yu et al. (2018) Tao Yu, Rui Zhang, Kai Yang, Michihiro Yasunaga, Dongxu Wang, Zifan Li, James Ma, Irene Li, Qingning Yao, Shanelle Roman, et al. 2018. Spider: A large-scale human-labeled dataset for complex and cross-domain semantic parsing and text-to-sql task. In Proceedings of the 2018 Conference on Empirical Methods in Natural Language Processing, pages 3911–3921.
- Zhang and Balog (2019) Shuo Zhang and Krisztian Balog. 2019. Auto-completion for data cells in relational tables. In Proceedings of the 28th ACM International Conference on Information and Knowledge Management, CIKM ’19, pages 761–770.
- Zhang and Balog (2020) Shuo Zhang and Krisztian Balog. 2020. Web table extraction, retrieval, and augmentation: A survey. ACM Trans. Intell. Syst. Technol., 11(2):13:1–13:35.
- Zhang et al. (2020) Shuo Zhang, Zhuyun Dai, Krisztian Balog, and Jamie Callan. 2020. Summarizing and exploring tabular data in conversational search. SIGIR ’20, pages 1537–1540.
- Zhong et al. (2017) Victor Zhong, Caiming Xiong, and Richard Socher. 2017. Seq2sql: Generating structured queries from natural language using reinforcement learning. CoRR, abs/1709.00103.
- Zhu et al. (2021) Fengbin Zhu, Wenqiang Lei, Chao Wang, Jianming Zheng, Soujanya Poria, and Tat-Seng Chua. 2021. Retrieving and reading: A comprehensive survey on open-domain question answering. CoRR, abs/2101.00774.
Appendix A Appendix
A.1 Table Analysis
To maintain the semi-structured nature of financial tables, we almost keep the same table structure in TAT-QA as that in the original financial reports. We sample hybrid contexts from the training set to conduct a manual evaluation to assess the complexity of the table structures. Specifically, we analyze the distribution w.r.t. the number of row headers, as shown in Table 7. It can be seen that around of the tables have two or more row-headers, indicating large difficulty in interpreting financial tables. In addition, we have also found that all sampled tables all have one column header.
| # of Row Header | Proportion (%) |
| 1 | 21 |
| 2 | 68 |
| 3 | 9 |
| more than 3 | 2 |
A.2 Operator Classifier
We present the proportion of questions that should go through each aggregation operator (ground truth), as well as the performance of our operator classifier on dev and test set in Table 8.
| Operator | Dev | Test | ||
| % | Acc | % | Acc | |
| Span-in-text | 20.9 | 92.3 | 21.3 | 91.6 |
| Cell-in-table | 21.1 | 91.2 | 21.6 | 86.7 |
| Spans | 13.0 | 96.8 | 12.6 | 93.8 |
| Sum | 3.4 | 86.0 | 2.5 | 76.2 |
| Count | 1.9 | 93.8 | 2.4 | 100.0 |
| Average | 8.5 | 100.0 | 5.9 | 100.0 |
| Multiplication | 0.2 | 33.3 | 0.1 | 0.0 |
| Division | 1.0 | 76.5 | 1.0 | 87.5 |
| Difference | 14.1 | 96.6 | 15.9 | 96.6 |
| Change ratio | 9.3 | 96.1 | 10.2 | 95.3 |
| Other | 6.6 | 0.0 | 6.6 | 0.0 |
A.3 Scale Prediction
We report the proportion of the ground truth scale in an answer and also the performance of our scale predictor on dev and test set in Table 9.
| Scale | Dev | Test | ||
| % | Acc | % | Acc | |
| None | 47.6 | 92.4 | 50.3 | 90.1 |
| Thousand | 20.7 | 96.8 | 19.2 | 95.3 |
| Million | 15.2 | 92.1 | 12.9 | 90.2 |
| Billion | 0.4 | 28.6 | - | - |
| Percent | 16.1 | 95.9 | 17.7 | 95.9 |