A global view on star formation: The GLOSTAR Galactic plane survey
The Cygnus X complex is covered by the Global View of Star Formation in the Milky Way (GLOSTAR) survey, an unbiased radio-wavelength Galactic plane survey, in 4–8 GHz continuum radiation and several spectral lines. The GLOSTAR survey observed the 6.7 GHz transition of methanol (CH3OH), an exclusive tracer of high-mass young stellar objects. Using the Very Large Array in both the B and D configurations, we observed an area in Cygnus X of in size and simultaneously covered the methanol line and the continuum, allowing cross-registration. We detected thirteen sources with Class II methanol maser emission and one source with methanol absorption. Two methanol maser sources are newly detected; in addition, we found four new velocity components associated with known masers. Five masers are concentrated in the DR21 ridge and W75N. We determined the characteristics of the detected masers and investigated the association with infrared, (sub)millimeter, and radio continuum emission. All maser sources are associated with (sub)millimeter dust continuum emission, which is consistent with the picture of masers tracing regions in an active stage of star formation. On the other hand, only five masers () have radio continuum counterparts seen with GLOSTAR within 1′′, testifying to their youth. Comparing the distributions of the bolometric luminosity and the luminosity-to-mass ratio of cores that host 6.7 GHz methanol masers with those of the full core population, we identified lower limits and for a dust source to host maser emission.
Key Words.:
masers, ISM: molecules, techniques: interferometric, radio lines: ISM, radio continuum: ISM, stars: formation1 Introduction
The Cygnus X complex is a nearby (1.4 kpc111This distance comes from the average of the individual distances to several star-forming regions in Cygnus X North. AFGL 2591, which is projected in the direction of Cygnus X South, was found to be more distant, at 3.3 kpc. Whether Cygnus X is a single connected region is still under debate.; Rygl et al. 2012), 10o wide region rich in molecular clouds that is undergoing active star formation and hosts a number of OB associations that testify to the prodigious star formation that has occurred over the past few million years. The vast richness of the present star formation activity in this region is revealed by a multitude of observations of centimeter-wavelength free-free radio emission, (sub)millimeter molecular line emission, dust continuum emission, and infrared-wavelength imaging (see Reipurth & Schneider 2008 for a review). Numerous (150) massive dense cores and young stellar objects have been identified (Motte et al. 2007; Beerer et al. 2010; Bontemps et al. 2010; Cao et al. 2019), as have around ten ultracompact (UC) HII regions (Roy et al. 2011; Cao et al. 2019) and hundreds of more developed compact and extended HII regions (Wendker et al. 1991). Products of past star formation manifest themselves as OB associations, with the 3–5 Myr old Cygnus OB2 association being the most prominent (Wright et al. 2010), as well as dozens of evolved objects, including Wolf–Rayet and carbon stars, planetary nebulae, supernova remnants, and the famous X-ray binary Cygnus X 1 (Uyanıker et al. 2001; Kraemer et al. 2010). Figure 1 of Wendker (1984) gives a schematic overview of Cygnus X and its rich composition.
| Observing Date | Observing Date | Galactic coverage | Beam sizea𝑎aa𝑎aThese values are for the methanol dirty cubes constructed for the D-array configuration data. ; PA | |
|---|---|---|---|---|
| D-conf. | B-conf. | (arcsecarcsec; deg) | ||
| 2014-08-16 | 2015-05-02 | ; | ||
| 2014-08-25 | 2015-05-08 | ; | ||
| 2014-08-27 | 2015-05-07 | ; | ||
| 2014-08-24 | 2015-05-06 | ; | ||
| 2014-08-22 | 2015-04-25 | ; | ||
| 2014-08-07 | 2015-04-04 | ; | ||
| 2014-08-16 | 2015-04-24 | ; | ||
| 2014-08-15 | 2015-04-26 | ; | ||
| 2014-08-11 | 2015-05-14 | ; | ||
| 2014-08-17 | 2015-05-03 | ; | ||
| 2014-08-06 | 2015-05-08 | ; | ||
| 2014-08-18 | 2015-05-10 | ; | ||
| 2014-08-26 | 2015-05-09 | ; | ||
| 2014-08-12 | 2015-05-09 | ; |
Due to its proximity (being one of the nearest massive star-forming regions) and large gas reservoir, Cygnus X serves as an excellent laboratory for studying the formation process of high-mass stars. The region extends roughly between and in Galactic longitude and and in latitude (see Fig. 1 in Schneider et al. 2006). With a total mass of (Schneider et al. 2006), this complex is one of the most massive giant molecular clouds (GMCs) in the extended solar neighborhood.
The line of methanol at 6.7 GHz was first detected in the interstellar medium by Menten (1991b). The observed complex line shapes, high intensities, and association with star-forming regions immediately indicated maser emission – in fact, after the 22.2 GHz transition from H2O, it is the second strongest and second most frequently found interstellar maser line (e.g., Caswell et al. 1995).
The comprehensive Methanol Multibeam (MMB) survey in this transition that covered the Galactic plane from to found 972 maser sources (see Green et al. 2009, 2010, 2012, 2017; Caswell et al. 2010, 2011). Various studies have shown that 6.7 GHz methanol masers are exclusively associated with high-mass star formation (Minier et al. 2003; Bourke et al. 2005; Ellingsen 2006; Pandian et al. 2008; Xu et al. 2008; Pandian et al. 2010). Most of these masers were found to have no radio continuum counterpart (at the few mJy sensitivity level of previous observational efforts) by Walsh et al. (1998), who first suggested that most methanol masers are associated with massive young (proto)stellar objects (MYSOs) in their earliest evolutionary phases (i.e., before they excite a UC HII region), which has been widely confirmed. The comprehensive studies of Urquhart et al. (2013, 2015) and Billington et al. (2019) found that 99% of the 958 methanol masers identified by the MMB in the Galactic plane are also associated with submillimeter continuum radiation from dust detected by the m APEX Telescope Survey of the Galaxy (ATLASGAL; Schuller et al. 2009; Csengeri et al. 2014; Urquhart et al. 2014) and the m JCMT Plane Survey (Moore et al. 2015; Eden et al. 2017) conducted with the 15 meter James Clerk Maxwell Telescope (JCMT). Given that 99% of sources have been associated with dust, it is probably safe to assume that all methanol masers are thus associated with compact dust clumps that are massive enough to harbor at least one high-mass (proto)star, along with its associated lower-mass (proto)stellar cluster members. We note further that the 6.7 GHz line is a Class II methanol maser transition and thus, by definition, is radiatively pumped (Batrla et al. 1987; Menten 1991a, b). These masers thus naturally require a source emitting strongly in the mid-infrared regime in their close vicinity (Sobolev & Deguchi 1994; Cragg et al. 2005), which gives a natural explanation for the above-discussed maser–MYSO association.
The Global View of Star Formation in the Milky Way (GLOSTAR) project is a large radio survey aimed at mapping a significant part of the Galactic mid-plane to characterize the properties of sites with star formation in the earliest evolutionary stages. It takes advantage of the upgraded wideband capabilities of the Karl G. Jansky Very Large Array (VLA), which provides a vastly increased bandwidth and better sensitivity. An overview of the survey is given by Brunthaler et al. (2021), while the first catalog of continuum radio sources detected in our pilot region ( to with ) is presented in Medina et al. (2019).
Here we report on new VLA observations of 6.7 GHz methanol masers that were carried out in the course of our GLOSTAR coverage of the Cygnus X region, from to and to (see Fig. 1 for survey coverage). Primarily, this paper presents the properties of the detected methanol masers and their association with radio continuum emission. Since the maser positions are accurate at the subarcsecond level, we establish their associations with other tracers of star formation to investigate the relationship between methanol masers and massive star formation in the Cygnus X complex. In Sect. 2 we describe the observations and data analysis. Section 3 presents the method for source extraction and the detected methanol masers. In Sect. 4 we discuss the properties of the masers and their association with radio continuum, (sub)millimeter, and infrared emission. We also investigate the properties of the dust cores with which the masers are associated and comment on the possible nature of each maser source. Finally, in Sect. 5 we discuss the relationship between maser emission and dust continuum source properties.
2 Observations and data reduction
The observations were carried out as part of the GLOSTAR survey, which is described in detail in Brunthaler et al. (2021). Here we discuss the Cygnus X region portion of the survey. To characterize the radio emission and various tracers of star formation, we carried out simultaneous observations of C-band continuum emission (covering 4.2–5.2 and 6.5-7.5 GHz), the methanol (CH3OH) line at 6.7 GHz, seven radio recombination lines (H96, H98, H99, H110, H112, H113, and H114), and formaldehyde (H2CO) transition at 4.8 GHz. Observations were taken in both the D and B configurations to simultaneously achieve the best sensitivity for extended emission and excellent angular resolution (see Table 1 for details). The D- and B-configuration data provide angular resolutions of and , respectively. This corresponds to approximate physical scales of 0.1 pc and 1700 au, respectively, at a distance of 1.4 kpc. Two 1 GHz wide base bands in full polarization mode were registered for the continuum. These were centered at 4.7 and 6.9 GHz and consisted of eight 128 MHz wide spectral windows each. The methanol maser line, which has a rest frequency of 6668.5192 MHz (Breckenridge & Kukolich 1995), was observed with 8 MHz of bandwidth and 2048 channels, resulting in a channel spacing of 0.176 km s-1, and a total velocity coverage of 360 km s-1.
Our observations, which covered almost the whole Cygnus X complex (i.e., an area of ), required a total of 28 epochs, which were scheduled as part of GLOSTAR under program ID 14A-420. Each epoch observed a strip (see Table 1), typically using 532 single pointings. Two 11-second scans were spent on each pointing for a total (on-source) integration time of 15 seconds. The spectral line data from each epoch were calibrated independently within the Common Astronomy Software Applications (CASA) package using version v4.6.0 and a customized version of the VLA pipeline333https://science.nrao.edu/facilities/vla/data-processing/pipeline. The continuum subtraction was performed on the visibility data using the CASA task uvcontsub, where we excluded channels expected to contain emission lines in order to fit the continuum. Specifically, we excluded the local standard of rest (LSR) velocity range from to km s-1 for the methanol line, which covers the velocity range of the complex (Schneider et al. 2006).
The calibrated visibilities were imaged using the CLEAN algorithm as implemented in the package tclean within CASA version v5.4 with a pixel size of and for D- and B-configuration data, respectively, and a spectral resolution of 0.18 km s-1. Each stripe requires 28002800 pixels in D-configuration maps, while B-configuration maps require about 100 times more pixels. Due to limitations of the computer resources required to perform the deconvolution of such a large map over a large number of spectral channels, we only constructed dirty D-configuration images for the methanol line and performed the maser detection search on these dirty cubes (this is described in more detail in Sect. 3). Dirty cubes of the methanol line were produced for the velocity range from to km s-1. Maps of the B-configuration data were only constructed, in a subsequent step, for smaller regions () centered at the positions of the detected masers determined in the D-configuration cubes and using the data from all neighboring pointings. The synthesized beams are on average at position angle (PA)= and at PA= in the D and B configuration, respectively. The 1 rms noise measured in channels free of maser emission is, on average, 0.028 Jy beam-1 per 0.18 km s-1 channel for both configurations.
To complement our study, we also analyzed GLOSTAR continuum images toward sites with maser emission. A full description of the GLOSTAR continuum data calibration and imaging is given in Brunthaler et al. (2021), while the full analysis of continuum images of Cygnus X will be presented in a forthcoming paper. Here, we briefly discuss the imaging strategy. The calibration and imaging of the continuum data was performed with the Obit package (Cotton 2008). The 2 GHz bandwidth was first rearranged into nine frequency subbands, which were used to image each pointing individually. Then, for each frequency subband the pointings were combined into large individual mosaics to cover the entire observed area. Finally, we combined the different frequencies to obtain the image at the reference frequency, which has circular beams of 19′′ and 1.5′′ in the D and B configuration, respectively. Continuum and methanol line maps from Effelsberg observations have also been obtained as part of the GLOSTAR survey (Brunthaler et al. 2021, Rugel et al. in prep.) We note that continuum images were constructed for Effelsberg data, the VLA D configuration, the VLA B configuration, a combination of the VLA D and B (D+B) configurations, and a combination of the VLA D configuration and Effelsberg observations. The central frequency of these images is 5.8 GHz. Here, we only use B-configuration continuum maps to study the region of the investigated methanol maser positions and D+B maps of the region around DR21 (see Sect. 4.5). Methanol line data from Effelsberg were also inspected to look for flux variations in the VLA-detected masers (Sect. 4.4). The noise in the continuum images is not uniform, but rather varies across the mapped region, and can be high around strong sources with complex or extended emission. We locally measured the noise in regions close to the maser locations, resulting in 1 values in the range from 0.056 to 0.43 mJy beam-1 for B-configuration images. For the D configuration, the 1 rms noise ranges from 0.10 to 2.6 mJy beam-1. The higher values measured in D-configuration data are due to bright extended emission, which is present across the Cygnus X region, and are resolved out by the array in the B configuration. The highest local rms noise occurs around the strong radio source, DR21, a compact HII region.
| Maser | Name | / | / | Common | |||
|---|---|---|---|---|---|---|---|
| ID | (h:m:s)/(arcsec) | (o:′:′′)/(arcsec) | (km s-1) | (Jy beam-1) | (Jy) | Name | |
| (1) | (2) | (3) | (4) | (5) | (6) | (7) | (8) |
| 1 | G76.0932+0.1580 | 20:23:23.683 | +37:35:36.17 | 4.84 | 0.54 0.02 | 0.55 0.03 | – |
| 0.46 | 0.70 | -6.50 | 0.46 0.02 | 0.53 0.04 | |||
| 1.52 | -1.32 | 6.46 | 0.41 0.02 | 0.49 0.04 | |||
| 2 | G76.8437+0.1233 | 20:25:43.758 | +38:11:13.26 | -5.42 | 4.61 0.04 | 4.70 0.08 | – |
| 3 | G78.8870+0.7087 | 20:29:24.947 | +40:11:19.81 | -7.04 | 0.77 0.02 | 0.80 0.04 | AFGL2591 |
| 4 | G78.9690+0.5410 | 20:30:22.725 | +40:09:23.90 | 4.84 | 1.16 0.03 | 1.22 0.06 | IRAS 20286+3959 |
| 5 | G78.9884+0.2211 | 20:31:47.286 | +39:59:00.52 | -68.60 | 1.87 0.03 | 1.97 0.06 | – |
| -0.34 | -0.64 | -66.26 | 0.29 0.02 | 0.32 0.04 | |||
| -0.72 | 1.28 | -55.46 | 0.21 0.02 | 0.20 0.03 | |||
| -0.00 | -0.06 | -54.92 | 0.20 0.02 | 0.18 0.03 | |||
| 1.66 | -2.84 | -60.32 | 0.14 0.02 | 0.15 0.03 | |||
| 6 | G79.7358+0.9904 | 20:30:50.699 | +41:02:27.43 | -5.60 | 23.21 0.10 | 23.42 0.17 | IRAS 20290+4052 |
| 0.13 | -0.10 | -3.98 | 5.03 0.03 | 5.04 0.06 | |||
| 0.09 | -0.07 | -3.08 | 4.28 0.04 | 4.38 0.06 | |||
| 7 | G80.8617+0.3834 | 20:37:00.991 | +41:34:56.18 | -4.16 | 11.79 0.07 | 11.89 0.12 | DR20 |
| 0.04 | 0.29 | -2.00 | 4.18 0.03 | 4.21 0.06 | |||
| -1.09 | -0.58 | -11.00 | 0.90 0.02 | 0.98 0.04 | |||
| -0.12 | -0.60 | -12.26 | 0.49 0.01 | 0.51 0.03 | |||
| -1.96 | -0.05 | 1.06 | 0.35 0.02 | 0.36 0.03 | |||
| 0.52 | 0.21 | -1.10 | 0.30 0.02 | 0.33 0.04 | |||
| 8a𝑎aa𝑎aSeen in absorption. | G81.6790+0.5378 | 20:39:01.165 | +42:19:33.34 | -1.10 | -0.70 0.03 | -1.04 0.07 | DR21 |
| 9 | G81.7219+0.5711 | 20:39:01.066 | +42:22:48.89 | -2.72 | 5.11 0.04 | 5.09 0.06 | DR21(OH) |
| 0.11 | -0.02 | -3.08 | 3.79 0.03 | 3.73 0.06 | |||
| -0.29 | -0.23 | -3.80 | 1.43 0.03 | 1.50 0.05 | |||
| -1.88 | -0.78 | 8.98 | 0.23 0.03 | 0.38 0.07 | |||
| 10 | G81.7444+0.5910 | 20:39:00.369 | +42:24:37.00 | 4.48 | 11.72 0.21 | 12.32 0.39 | W75S-FIR1 / |
| 0.19 | -0.00 | 3.76 | 8.68 0.10 | 9.02 0.18 | DR21 Bb𝑏bb𝑏bAlternative nomenclature used by Rygl et al. (2012). | ||
| 11 | G81.7523+0.5908 | 20:39:01.996 | +42:24:59.13 | -8.66 | 14.06 0.07 | 14.37 0.13 | W75S-FIR2 / |
| -0.06 | -0.07 | -5.78 | 7.09 0.05 | 7.30 0.09 | DR21 Ab𝑏bb𝑏bAlternative nomenclature used by Rygl et al. (2012). | ||
| 0.03 | -0.06 | -6.86 | 4.88 0.05 | 5.03 0.10 | |||
| 0.24 | -0.32 | -2.90 | 1.80 0.05 | 1.92 0.09 | |||
| 0.27 | -0.17 | -2.36 | 1.11 0.04 | 1.14 0.08 | |||
| 12 | G81.7655+0.5972 | 20:39:02.945 | +42:25:50.93 | -1.28 | 3.18 0.17 | 3.82 0.33 | CygX-N53 |
| 13 | G81.8713+0.7807 | 20:38:36.435 | +42:37:34.70 | 7.18 | 336.19 1.65 | 334.63 2.89 | W75N(B) |
| -0.16 | 0.39 | 4.66 | 286.99 1.50 | 288.37 2.65 | |||
| -0.13 | 0.46 | 4.12 | 235.08 1.17 | 236.85 2.06 | |||
| -0.27 | 0.34 | 5.74 | 120.86 0.58 | 121.43 1.02 | |||
| -0.26 | 0.38 | 5.20 | 109.74 0.55 | 110.23 0.97 | |||
| -0.12 | 0.45 | 3.40 | 92.67 0.40 | 94.04 0.71 | |||
| -0.14 | -0.43 | 9.34 | 37.03 0.16 | 37.43 0.29 | |||
| 14 | G82.3079+0.7296 | 20:40:16.642 | +42:56:29.12 | 10.42 | 20.67 0.07 | 20.78 0.13 | – |
| Maser | Name | / | / | Common | |||
|---|---|---|---|---|---|---|---|
| ID | (h:m:s)/(arcsec) | (o:′:′′)/(arcsec) | (km s-1) | (Jy beam-1) | (Jy) | Name | |
| (1) | (2) | (3) | (4) | (5) | (6) | (7) | (8) |
| 1 | G76.0932+0.1580 | 20:23:23.7140 | +37:35:35.558 | 6.64 | 0.57 0.01 | 0.59 0.02 | – |
| -0.103 | 0.055 | 4.84 | 0.38 0.01 | 0.48 0.01 | |||
| -0.281 | -0.005 | -6.50 | 0.17 0.01 | 0.18 0.01 | |||
| 2 | G76.8437+0.1233 | 20:25:43.7657 | +38:11:12.734 | -5.42 | 0.17 0.00 | 0.17 0.01 | – |
| 3 | G78.8870+0.7087 | 20:29:24.9436 | +40:11:19.626 | -7.04 | 0.10 0.01 | 0.19 0.03 | AFGL2591 |
| 4 | G78.9690+0.5410 | 20:30:22.6762 | +40:09:23.348 | 4.84 | 1.25 0.01 | 1.28 0.02 | IRAS 20286+3959 |
| 5 | G78.9884+0.2211 | 20:31:47.3082 | +39:58:59.903 | -68.96 | 0.25 0.01 | 0.30 0.01 | – |
| -0.028 | -0.103 | -66.26 | 0.21 0.01 | 0.30 0.02 | |||
| 6 | G79.7358+0.9904 | 20:30:50.6680 | +41:02:27.403 | -5.42 | 22.96 0.21 | 23.81 0.39 | IRAS 20290+4052 |
| 0.055 | -0.010 | -3.98 | 5.88 0.09 | 6.11 0.15 | |||
| 0.045 | -0.039 | -3.26 | 4.97 0.06 | 5.07 0.12 | |||
| 7 | G80.8617+0.3834 | 20:37:00.9571 | +41:34:55.606 | -3.98 | 4.61 0.11 | 5.02 0.21 | DR20 |
| -0.029 | 0.331 | -2.00 | 1.56 0.06 | 1.77 0.12 | |||
| 9 | G81.7219+0.5711 | 20:39:01.0501 | +42:22:49.124 | -2.72 | 4.07 0.05 | 4.30 0.10 | DR21(OH) |
| 0.202 | 0.048 | -3.08 | 2.72 0.05 | 3.12 0.10 | |||
| -0.325 | -0.133 | -3.80 | 1.30 0.03 | 1.43 0.05 | |||
| -1.163 | -0.226 | 8.98 | 1.22 0.03 | 1.25 0.06 | |||
| 10 | G81.7444+0.5910 | 20:39:00.3722 | +42:24:37.089 | 4.48 | 17.18 0.12 | 17.88 0.22 | W75S-FIR1 |
| 0.015 | 0.020 | 3.58 | 6.58 0.08 | 6.61 0.14 | |||
| 11 | G81.7523+0.5908 | 20:39:01.9870 | +42:24:59.261 | -8.66 | 15.19 0.10 | 15.67 0.19 | W75S-FIR2 |
| -0.014 | -0.140 | -5.78 | 7.93 0.07 | 8.12 0.13 | |||
| -0.036 | -0.107 | -6.86 | 4.29 0.04 | 4.37 0.08 | |||
| 0.123 | -0.300 | -2.36 | 1.33 0.03 | 1.45 0.06 | |||
| 0.074 | -0.363 | -2.90 | 1.52 0.03 | 1.70 0.07 | |||
| 12 | G81.7655+0.5972 | 20:39:02.9329 | +42:25:50.954 | -1.28 | 3.90 0.05 | 4.09 0.09 | CygX-N53 |
| 13 | G81.8713+0.7807 | 20:38:36.4232 | +42:37:34.756 | 7.18 | 336.13 0.96 | 346.76 1.73 | W75N(B) |
| -0.176 | 0.425 | 4.66 | 324.83 1.15 | 336.46 2.08 | |||
| -0.170 | 0.444 | 4.48 | 238.51 1.07 | 246.98 1.95 | |||
| -0.261 | 0.346 | 5.74 | 126.12 0.76 | 128.52 1.37 | |||
| -0.241 | 0.352 | 5.20 | 114.47 0.74 | 116.80 1.33 | |||
| -0.100 | 0.480 | 3.40 | 88.83 0.80 | 90.64 1.43 | |||
| -0.122 | -0.424 | 9.34 | 31.67 0.61 | 35.80 1.16 | |||
| 14 | G82.3079+0.7296 | 20:40:16.6487 | +42:56:29.288 | 10.42 | 23.82 0.18 | 24.19 0.31 | – |

3 Source detection
We searched for methanol line sources in the D-configuration dirty cubes using the source extraction code introduced in Brunthaler et al. (2021). Briefly, this code scans through the full data cubes to locate brightness peaks with a signal-to-noise ratio (S/N) above a fixed value; here we chose a threshold of S/N = 4, which was found to be a good balance between detecting weak sources and dismissing artifacts. For the calculation of the S/N, the rms noise was measured in a small spatial box (typically with a size of 5050 pixel). Starting at the bottom-left corner of the image, a pixel within this box is considered to represent a potential source if the S/N of the emission remains above the S/N threshold in at least three consecutive spectral channels. After scanning the bandwidth for this spatial box, the search was repeated in the next adjacent spatial box until the full image (16002300 pixel) was scanned. A few additional filters were applied to the candidate detection list in order to remove duplicate detections (both in position and velocity) and spurious detections caused by, for example, sidelobes. That is, we checked if the candidate detection was within 200 pixels of any previous detection. We kept the detection as a potential one when it appeared in the same channel range as the previous detection and had a higher S/N (in this case, we discarded the previous detection) or when it appeared in a different channel range regardless of its S/N. A full description of the source finding algorithm will be given in an upcoming paper (Nguyen et al., in prep).
Once a list of potential detections was produced by the extraction code, we imaged a region of pixel ( pixel) or 21 () for the D configuration (B configuration) centered on the recorded brightness peak position. Additionally, we used the visibility data from all VLA pointings (observed at any date) that lay within the region. The cubes were CLEANed to the expected rms by setting a threshold of 38 mJy. This threshold corresponds to the expected 1 rms for a single field. The final sensitivities, however, are higher (cf. Sect. 2) because each field was covered by six neighboring fields. D- and B-configuration data were imaged separately using a velocity spacing of 0.18 km s-1. The spectral extent of these cubes covers LSR velocities from to km s-1. The CLEANed cubes produced for all potential source candidates were first scanned with our source extraction code and then inspected visually to search for detections. Finally, we manually collected a list of channels that showed spectral peaks with a signal above 4. From this list we obtained the source positions and flux densities at individual channels by performing two-dimensional Gaussian fits to the brightness distribution with the CASA task imfit. For the Gaussian fits we selected a box, typically with spatial extents of pixel and pixel in the D and B configuration, respectively (1.3-1.7 times the beam), centered on the position of the brightest pixel.
The statistical error in maser position is given by the astrometric uncertainty, , where is the full width at half maximum (FWHM) size of the restoring beam and S/N is that of the source (Thompson et al. 2017). The D- and B-configuration maps of methanol have an average beam size of and , respectively. For a maser detected at S/N=10, the formal (statistical) precision in position is and for the D and B configurations, respectively. However, additional errors – due to, for instance, uncompensated atmospheric delays that arise when applying the phase corrections determined for the calibrator sources to the Cygnus X data – likely worsen the position accuracy. In order to estimate realistic position uncertainties, we compared our VLA positions with the positions determined from observations with the European Very-long-baseline interferometry (VLBI) Network (EVN; Rygl et al. 2012; see Appendix A for details). For the B configuration, the differences have rms values of and and mean values of and in RA and Dec., respectively. Thus, additional position errors of and , respectively, need to be added to the formal errors. Similarly, from the differences between the VLA D configuration and EVN positions, we obtained systematic errors of and in RA and Dec., respectively, for the D configuration.
4 Results
4.1 Detected methanol masers
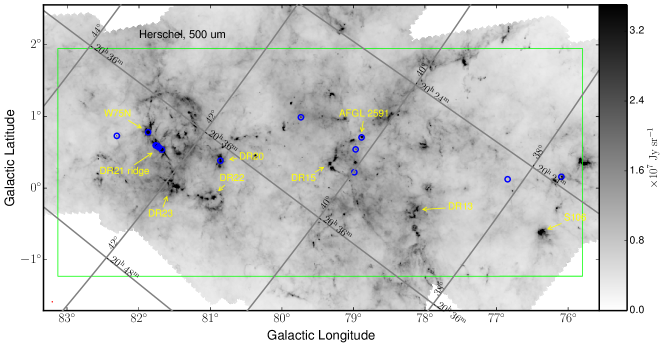
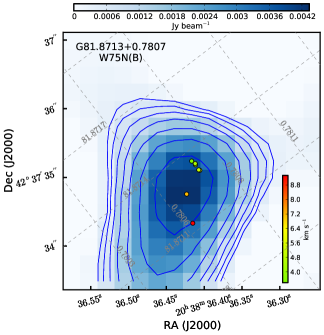
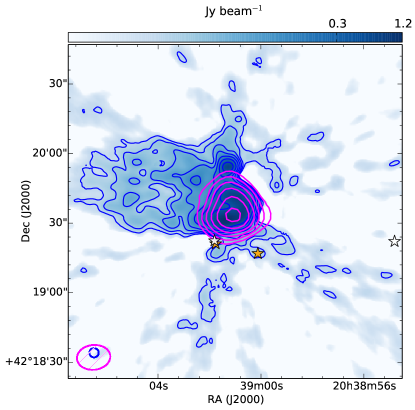
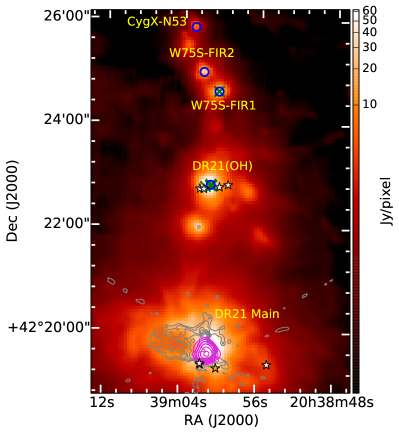
We detected methanol maser emission toward 13 different locations and one case of methanol absorption (toward the continuum emission of the compact HII region DR21); two of these maser sources (G76.8437+0.1233 and G78.9884+0.2211) are newly detected. The spatial distribution of these methanol sources is shown in Fig. 1, overlaid on a mosaic image obtained at 500 m with the Spectral and Photometric Imaging REceiver (SPIRE) aboard the Herschel Space Observatory (Cao et al. 2019) from data taken as part of the Herschel imaging survey of OB Young Stellar objects (HOBYS; Motte et al. 2010; Hennemann et al. 2014) and the Herschel infrared Galactic Plane Survey (Hi-Gal; Molinari et al. 2010). Remarkably, several of the masers (five in total) are associated with the ridge of dense molecular material that extends from DR21 to W75N, which is the region with the highest degree of star formation activity in Cygnus X and home to numerous high-mass stars.
Table 2 lists the names, equatorial coordinates, peak LSR velocity, and peak and integrated fluxes of the main velocity components (or “features”) of the methanol sources detected in the D-configuration maps. Maser properties of the features as measured in the B-configuration cubes are shown in Table 3, while properties and maps of the distribution of all detected maser spots above 4 are provided in the appendix (Table LABEL:tab:catalog and Fig. A.3, respectively). Here, “spot” refers to emission detected in a single velocity channel and “feature” to emission observed in contiguous velocity channels at nearly the same position. The features consist of several contributing spots.
Class II methanol masers are, in general, time variable, and the 8–9 month time span between our D- and B-configuration observations (see Table 1) allows us to check the variability in our sources. Individual maser components can spread by up to several arcseconds on the sky (see Fig. A.3 and also Hu et al. 2016), which is comparable to our B-configuration synthesized beam; as such, to allow for a meaningful comparison, we convolved the B-configuration cubes to the D-configuration beam and then, for every source, extracted each spectrum at the same pixel.
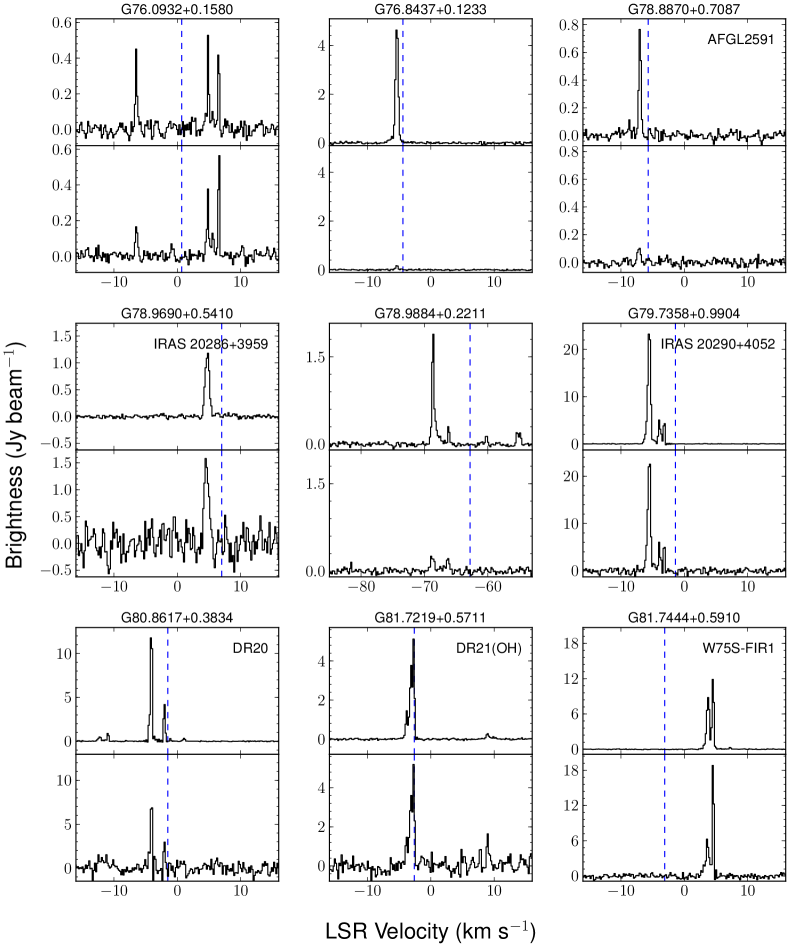
In Fig. 2, the D- and B-configuration spectra are compared with one another. We note that the noise in the B-configuration images convolved with the D-configuration beam is higher by a factor of 10. However, this is expected since the noise, in brightness temperature units, decreases with the square root of the beam area, and the brightness temperature is converted to flux density by multiplying with the beam area. This results in a linear increase in the noise with the beam size. Because of this, we do not show the spectra from the convolved data cubes for the weakest lines (those with Jy beam-1) in Fig. 2. At our 0.18 km s-1 channel spacing, even narrow single velocity features are generally spectrally resolved. In a few cases, extremely narrow features are unresolved or only partially resolved. In the case of strong features, this leads to observable “Gibbs ringing,” which appears most pronounced in the G82.3079+0.7296 spectrum between 7 and 10 km s-1 but can also be seen in a few of the other maser spectra. The vertical lines show the systemic velocities of the molecular gas in the line of sight, which were taken from the literature. The LSR velocity of all but one of the maser features ranges from to km s-1. The exception is source G78.9884+0.2211, which has km s-1. In all cases, methanol-maser velocities are observed to be close, within km s-1, to the systemic velocities.
| GLOSTAR | Common | Size | ||||||||
|---|---|---|---|---|---|---|---|---|---|---|
| Name | Name | (km s-1) | (km s-1) | () | () | (′′) | () | (K) | () | () |
| (1) | (2) | (3) | (4) | (5) | (6) | (7) | (8) | (9) | (10) | (11) |
| G76.0932+0.1580 | - | 1.3 | 1.6 | 5.8 | 5.9 | 18 | 27 3 | 20.4 0.9 | 189 | 227 |
| G76.8437+0.1233 | - | 2.2 | 0.5 | 3.8 | 1.0 | 25 | 12 2 | 16.0 0.7 | 19 | 26 |
| G78.8870+0.7087 | AFGL2591 | 0.7 | 0.9 | 2.3 | 2.4 | 24 | 937 72 | 30.2 1.9 | 67750 | 66262 |
| G78.9690+0.5410 | IRAS 20286+3959 | 1.4 | 1.4 | 1.3 | 1.4 | 22 | 72 9 | 13.0 0.4 | 33 | 42 |
| G78.9884+0.2211a𝑎aa𝑎aThe mass, FIR luminosity, and bolometric luminosity of this core must be rescaled to 347 , 3093 , and 6237 , respectively, for a distance of 9.35 kpc (see Sect. 4.4). | - | 3.6 | 0.7 | 1.8 | 2.9 | 25 | 8 1 | 21.3 1.2 | 69 | 176 |
| G79.7358+0.9904 | IRAS 20290+4052 | 3.4 | 3.2 | 2.4 | 2.4 | 19 | 42 4 | 17.7 0.5 | 122 | 233 |
| G80.8617+0.3834 | DR20 | 4.7 | 1.4 | 1.0 | 3.7 | 23 | 122 11 | 20.9 0.8 | 972 | 1328 |
| G81.7219+0.5711 | DR21(OH) | 2.3 | 2.5 | 5.2 | 4.9 | 16 | 930 140 | 20.9 1.3 | 7344 | 7299 |
| G81.7444+0.5910 | W75S-FIR1 | 2.2 | 2.2 | 1.3 | 1.3 | 11 | 74 5 | 21.9 0.6 | 776 | 1487 |
| G81.7523+0.5908 | W75S-FIR2 | 5.4 | 5.4 | 1.8 | 2.0 | 9 | 298 34 | 16.4 0.6 | 552 | 955 |
| G81.7655+0.5972 | CygX-N53 | 1.3 | 1.6 | 2.3 | 2.2 | 11 | 325 27 | 14.5 0.3 | 294 | 221 |
| G81.8713+0.7807 | W75N(B) | 10.3 | 7.2 | 5.8 | 5.8 | – | 1020 91 | 27.3 1.3 | 40588 | 32930 |
| G82.3079+0.7296 | - | 2.3 | 1.3 | 1.2 | 1.3 | 16 | 24 3 | 19.7 0.8 | 139 | 183 |
We see small differences in the maser emission between D- and B-configuration data. In general, fewer maser features (i.e., emission observed in contiguous velocity channels at nearly the same position) are seen in the B-configuration images. The peak fluxes are also weaker in the B-configuration data for five sources; for these sources we see variations in the range of 20–90%, while the velocity profiles do not change significantly (Fig. 2). This variability is further discussed for individual sources in Sect. 4.4.
Maser luminosities were estimated using
| (1) |
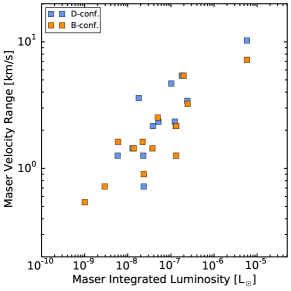
where , in units of Jy km s-1, is the maser flux integrated over the velocity range (i.e., across the maser line with emission above 4, MHz is the rest frequency of the methanol line, is the speed of light, and is the distance to the source. The term takes the change in frequency, , into account, resulting from a change in velocity of km s-1. The velocity ranges as well as the resulting values of the maser luminosity are given in Table 4. For all sources (except AFGL 2591) we used a distance of kpc, which is the average distance of the Cygnus X complex measured from trigonometric parallaxes of several maser sources (Rygl et al. 2012; see also Dzib et al. 2013, who obtain a parallax measurement to a radio continuum source in the Cygnus OB2 association). On the other hand, source AFGL 2591 is much farther away, at 3.33 kpc (Rygl et al. 2012), based also on maser parallax measurements. Figure 3 shows the velocity range of the maser emission as a function of integrated maser luminosity. As expected, the maser velocity range (which can be used as a proxy for the line profile complexity) increases with maser luminosity. A similar relation was previously noticed by, for example, Breen et al. (2011) and Billington et al. (2019). This may simply be the result of the fact that for a maser whose strongest component has a low flux density, any additional even weaker velocity components are below the S/N cutoff.
4.2 Association with millimeter-to-submillimeter emission
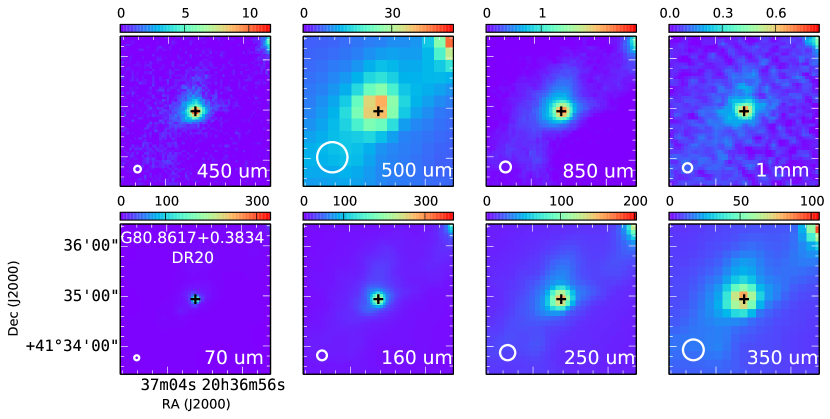
To compare the 6.7 GHz methanol maser activity with other tracers of star formation, we first compared the maser positions with those of the submillimeter continuum sources that pinpoint the high density gas. For this, we used JCMT Submillimeter Common-User Bolometer Array 2 (SCUBA-2) maps of Cygnus X at 450 and 850 micron (Cao et al. 2019). We found that all detected masers have associated 850 m emission (Fig. 4) with a comparable beam size of 13′′ (cf. Table 1 in Cao et al. 2019). Thus, all our methanol masers are associated with dust continuum emission. This is consistent with the results of Urquhart et al. (2015) and Billington et al. (2019), who found an almost ubiquitous association (99%) between the 6.7 GHz methanol maser and dust continuum sources. In order to derive the properties (mass, temperature, and luminosities) of these dust cores, we fit the spectral energy distribution (SED) of the dust emission with a modified blackbody model,
| (2) |
where is the Planck function for the temperature, , of the dust and is the core mass. Here, we adopted a dust mass opacity of , where , THz, and . For the construction of the SED (see Fig. B.1), we used data from Herschel obtained as part of the HOBYS (Motte et al. 2010; Hennemann et al. 2014) and Hi-GAL projects (Molinari et al. 2010) in the Photodetector Array Camera and Spectrometer (PACS) 70 and 160 m and the Spectral and Photometric Imaging Receiver (SPIRE) 250, 350, and 500 m bands777Data were retrieved from the Canadian Astronomy Data Centre., as well as JCMT SCUBA-2 data at 450 and 850 m (Cao et al. 2019). In addition, data at 1.1 mm are available from the Bolocam instrument installed at the 10.4 m Caltech Submillimeter Observatory, which have a resolution of 33′′ and were taken as part of the Bolocam Galactic Plane Survey (BGPS; Aguirre et al. 2011; Rosolowsky et al. 2010). At a higher angular resolution of 11′′, 1.2 mm data are also available from the Max-Planck-Millimeter-Bolometer (MAMBO/MAMBO-2) instruments installed at the Institut de Radioastronomie Millimétrique (IRAM) telescope (Motte et al. 2007). Not all dust cores associated with the methanol sources were covered by the observations of Motte et al. (2007). Thus, we used 1.2 mm IRAM data for eight sources and 1.1 mm Bolocam data for six sources. Figure 4 displays the images of (sub)millimeter continuum data for the GLOSTAR 6.7 GHz methanol masers. The images are in size and are centered at the positions of the masers.
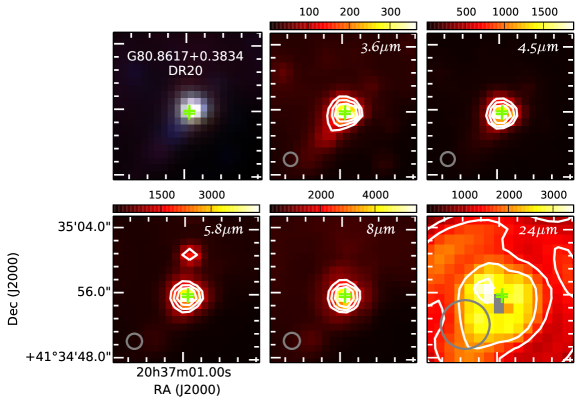
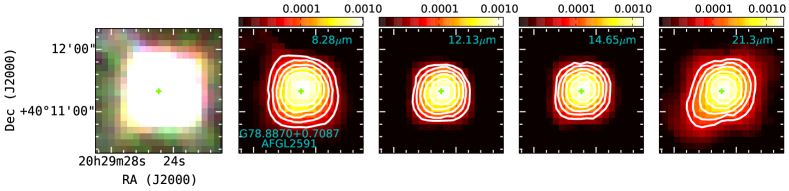
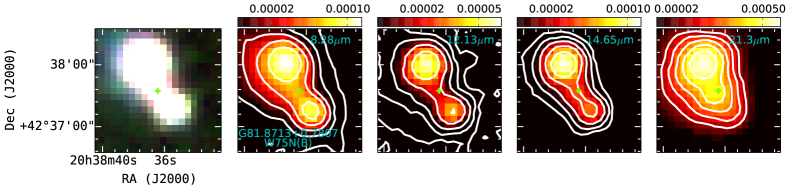
In the SED we also show infrared data from the Infrared Array Camera (IRAC) 3.6, 4.5, 5.8, and 8 m and the Multiband Imaging Photometer for Spitzer (MIPS) 24 m bands taken as part of the Spitzer Legacy Survey of the Cygnus X Complex (Beerer et al. 2010). IRAC aperture photometry and MIPS point spread function (PSF) photometry were retrieved from the NASA/IPAC Infrared Science Archive (IRSA888https://irsa.ipac.caltech.edu/data/SPITZER/Cygnus-X/). The corresponding images can be seen in Fig. 5, where we present both three-color infrared images and single band images of in size around the location of the masers.
| Name | a𝑎aa𝑎aA upper limit is given for the cases where no radio continuum emission is detected around the position of methanol masers. | SNR | Offsetb𝑏bb𝑏bOffset in position of the radio continuum source from the methanol maser intensity peak. | ||||
| (o) | (o) | (J2000) | (J2000) | (mJy beam-1) | (′′) | ||
| (1) | (2) | (3) | (4) | (5) | (6) | (7) | (8) |
| G78.8870+0.7087 | 78.886737 | 0.708870 | 20h29m24.85s | +40d11m19.7s | 1.69 0.37 | 4.5 | 1.2 |
| G80.8617+0.3834 | 80.861469 | 0.383462 | 20h37m00.91s | +41d34m56.0s | 0.79 0.13 | 6.0 | 0.6 |
| G81.6790+0.5378c𝑐cc𝑐cMethanol line is seen in absorption. | 81.678758 | 0.537054 | 20h39m01.30s | +42d19m31.5s | 1210 4d𝑑dd𝑑dThis flux was measured in the map made for the combination of D- and B-configuration data. | 333 | 2.4 |
| G81.7219+0.5711 | 81.721609 | 0.571246 | 20h39m00.95s | +42d22m48.8s | 3.05 0.40 | 7.6 | 0.3 |
| G81.7444+0.5910 | 81.744319 | 0.591176 | 20h39m00.30s | +42d24m37.4s | 1.69 0.22 | 7.8 | 0.8 |
| G81.8713+0.7807 | 81.871218 | 0.780755 | 20h38m36.39s | +42d37m34.9s | 4.44 0.08 | 58.2 | 0.4 |
| G76.0932+0.1580 | – | – | – | – | – | ||
| G76.8437+0.1233 | – | – | – | – | – | ||
| G78.9690+0.5410 | – | – | – | – | – | ||
| G78.9884+0.2211 | – | – | – | – | – | ||
| G79.7358+0.9904 | – | – | – | – | – | ||
| G81.7523+0.5908 | – | – | – | – | – | ||
| G81.7655+0.5972 | – | – | – | – | – | ||
| G82.3079+0.7296 | – | – | – | – | – |
| ID | GLOSTAR Name | SIMBAD or Common Name | Possible | 1.2 mm | 6-GHz | b𝑏bb𝑏bSystemic LSR velocity of molecular gas. | |
|---|---|---|---|---|---|---|---|
| Nature | corea𝑎aa𝑎aFrom Motte et al. (2007). | continuum | (km s-1) | Ref. | |||
| (1) | (2) | (3) | (4) | (5) | (6) | (7) | (8) |
| 1 | G76.0932+0.1580 | J202323.73+373535.16d𝑑dd𝑑dFrom Kryukova et al. (2014). | pre-UC HII | - | - | 0.7 | 1 |
| 2 | G76.8437+0.1233 | J202543.79+381112.98d𝑑dd𝑑dFrom Kryukova et al. (2014). | pre-UC HII | - | - | -4.4 | 1 |
| 3 | G78.8870+0.7087 | AFGL2591 | UC HII region | S26 | yes | -5.7 | 2 |
| 4 | G78.9690+0.5410 | IRAS 20286+3959 | pre-UC HII | - | - | 7.0 | 3 |
| 5 | G78.9884+0.2211 | J203147.25+395900.33d𝑑dd𝑑dFrom Kryukova et al. (2014). | pre-UC HII | - | - | -62.8 | 4 |
| 6 | G79.7358+0.9904 | IRAS 20290+4052 | pre-UC HII | - | - | -1.4 | 5 |
| 7 | G80.8617+0.3834 | DR20, IRAS 20352+4124 | UC or HC HII region | N14 | yes | -1.5 | 6 |
| 8c𝑐cc𝑐cSeen in absorption. | G81.6790+0.5378 | DR21 | UC HII region | N46 | yes | -3.0 | 7 |
| 9 | G81.7219+0.5711 | DR21(OH) | UC HII region | N44 | yes | -2.6 | 3 |
| 10 | G81.7444+0.5910 | W75S-FIR1, DR21 B | UC or HC HII region | N43 | yes | -3.1 | 7 |
| 11 | G81.7523+0.5908 | W75S-FIR2, DR21 A | high-luminosity IR protostellar core | N51 | - | -3.3 | 7 |
| 12 | G81.7655+0.5972 | CygX-N53 | massive IR-quiet protostellar core | N53 | - | -4.4 | 8 |
| 13 | G81.8713+0.7807 | W75N(B) | UC HII region | N30 | yes | 12.0 | 9 |
| 14 | G82.3079+0.7296 | J204016.75+425629.49d𝑑dd𝑑dFrom Kryukova et al. (2014). | pre-UC HII | - | - | 11.4 | 1 |
The mass and luminosity of five maser-associated cores are not available in the literature, while for the other eight these properties have been measured, for example by Cao et al. (2019). We thus derived these properties from the SED fitting not only for the five missing cores, but – for consistency and to avoid systematic deviations introduced by different extraction techniques – for all cores that have associated methanol maser emission detected by GLOSTAR. When fitting the SED, we note that the point at 70 m shows, in almost all cases, significant excess emission to the fit since emission at this wavelength traces warm dust that cannot be reproduced with a single-temperature model (Cao et al. 2019; König et al. 2017). The 70 and 24 m data points can be reproduced if we add a second, warmer component to the SED fit (see Fig. B.1). We thus carried out a two-component fit for sources for which 70 and 24 m data are both available. We fit Eq. 2 to 24–70 m and 160–1000 m data for the warm and cold component, respectively. The fit was done with the Python routine curve_fit from the scipy package. The fluxes from all images that are saturated at the location of the masers (cf. Fig. 14 and A.2) are not shown in the SED and were thus not used in the fitting. Specifically, saturation occurs for G78.8870+0.7087111111The image of this source has issues in the 3.6, 4.5, 5.8, and 8 m bands as well. Thus, the fluxes from these bands are not shown in the SED. (24 and 250 m), G80.8617+0.3834 (24 m), G81.7219+0.5711 (250 and 350 m), G81.7444+0.5910 (24 m), G81.7523+0.5908 (24 m), and G81.8713+0.7807 (24, 160, 250, and 350 m). In the case of G78.8870+0.7087 and G81.8713+0.7807, for which we have a limited number of data points due to saturation, the 70 m point was included in the fit of the cold component, and the data were weighted with their 20% flux errors. The IRAC data points between 3.6 and 8 m – likely originating from a third, hot and inner component – were not used in the SED fitting.
Finally, far-infrared (FIR) luminosities were obtained by integrating the SED of the cold component over wavelength,
| (3) |
To obtain bolometric luminosities from the SED, we should also have integrated the emission from the near- and mid-infrared; however, these data are not available for all our sources (cf. Fig. A.2). Instead, we estimated the bolometric luminosities of the cores by using the empirical relation between luminosity and 70 m flux found by Dunham et al. (2008),
| (4) |
The derived parameters for the cold components (masses, FIR luminosities, and bolometric luminosities) are listed in Table 4, and the SED and model fit are shown in Fig. B.1. We found that the two methods give luminosities that agree within 1 in eleven sources and within 3 in two sources. We now compare our results with those previously published in the literature.
For the core extraction, Cao et al. (2019) selected regions with column density , which, for typical deconvolved sizes of 0.1 pc, corresponds to core masses above 23 . Additional criteria were used by Cao et al. (2019) to reject cores with poorly extracted fluxes and/or large relative errors in mass and temperature estimation from the SED fitting, resulting in a minimum mass of 36 in their catalog. We see that some methanol maser-associated cores not reported previously have masses close to the threshold of 23 adopted by Cao et al. (2019), which explains why they were not reported by these authors. Although we follow a similar approach to Cao et al. (2019) to estimate core properties, here the fluxes were extracted individually at each wavelength using the radio flux plug-in in DS9121212https://www.extragalactic.info/~mjh/radio-flux.html. The integrated source flux was obtained over an aperture that delimits emission within a 30% contour. The local background flux was estimated over an aperture farther out from the source and then subtracted from the source flux. We note that fluxes extracted in this way do not show large deviations from the model fit, unlike some fluxes extracted with the getsources package used by Cao et al. (2019), especially at 450 m. The (sub)millimeter emission in the DR21 ridge is complex and extended, which probably affects the performance of background subtraction by getsources. As a result, the masses derived by us agree with those from Cao et al. (2019) within 55%.
When comparing the estimated masses with the masses obtained by Motte et al. (2007) for the eight overlapping cores from 1.2 mm data alone, after correcting for the different distance and dust mass opacity used by these authors, we see a slightly better agreement, with a relative difference of 50% on average. The properties derived above for the dust cores that are associated with a methanol maser source are used in Sect. 5 to investigate the relationship between methanol masers and massive star-forming dust cores.

4.3 Comparison with other maser surveys
Pestalozzi et al. (2005) published a catalog of all known 6.7 GHz methanol masers from both targeted and unbiased surveys in the Galactic plane. Their catalog contains six masers spread throughout the region observed by GLOSTAR in Cygnus X. Out of these six masers, four have a GLOSTAR counterpart within 1′, which is the average of the uncertainties in the maser coordinates of Pestalozzi’s catalog. The sources from Pestalozzi et al. (2005) without counterparts are G78.62+0.98 and G80.85+0.43. Source G78.62+0.98 has a quoted peak flux of 3 Jy ( Jy) at km s-1. This velocity is very different from the velocities of our masers detected with GLOSTAR. The source G80.85+0.43 has a quoted peak flux of 4.3 Jy at km s-1. This source is away from a strong maser detected by GLOSTAR (G80.8617+0.3834/DR20), which shows a peak flux of 12 Jy ( Jy) at km s-1 and is not reported by Pestalozzi et al. (2005). The two masers G80.85+0.43 and G80.8617+0.3834/DR20 could correspond to the same source given that the Pestalozzi et al. (2005) catalog collects positions obtained with a variety of single dish observations and hence different positional accuracy. They report an uncertainty of up to 3′ for their Galactic coordinates that would suggest that these two sources are the same. We created cleaned images centered at the position of sources G80.85+0.43 and G78.62+0.98 and did not see emission. These masers are not detected in our Effelsberg maps either.
Another targeted survey of this methanol maser line was conducted by Hu et al. (2016) with the VLA in C configuration. They selected all known methanol masers visible from the northern hemisphere and with peak fluxes above 2 Jy. The eight maser sources listed in this catalog within and were also detected in our survey. More recently, Yang et al. (2019) performed a new targeted survey in the whole Galaxy with the 65 m Shanghai Tianma Radio Telescope. They observed targets from the all-sky Wide Field Infrared Survey Explorer (WISE) point source catalog that could be associated with 6.7 GHz methanol masers based on their WISE magnitudes. We detected their three new masers and the five already known masers with WISE bright emission listed in Yang et al. (2019). The only maser from this catalog not detected by us, likely due to variability, is G81.794+0.911. However, we do not see this maser in recent Effelsberg data either. In summary, out of thirteen GLOSTAR masers, four were previously reported by both Pestalozzi et al. (2005) and Hu et al. (2016), five by both Hu et al. (2016) and Yang et al. (2019), three others by Hu et al. (2016), and three others by Yang et al. (2019). Two maser sources (G76.8437+0.1233 and G78.9884+0.2211) are newly detected by our observations. These two sources display high flux variations between the two observed epochs, which may explain why they were missed by previous surveys. Names, positions, and fluxes of all velocity components detected in the surveys by Hu et al. (2016) and Yang et al. (2019) are listed for reference in Table 8 of the appendix.
4.4 Comments on individual sources and their possible nature
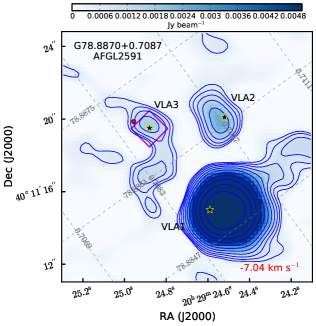
In this section we give a short description of each 6.7 GHz methanol source detected in Cygnus X (here, sources are referred to by their GLOSTAR identifier, GLL.llll+/-BB.bbbb, and also by their most common names if they are known sources). In order to discuss the association between these sources and their radio continuum emission, we show in Fig. 6 the positions of maser components determined from the B-configuration images, overlaid on GLOSTAR radio continuum emission that is also from B-configuration data. Maser positions measured from D-configuration images are less precise as compared with B-configuration positions, and thus they do not provide additional information on the distribution of maser spots. For this reason, we do not show D-configuration positions in Fig. 6.
A clear association between maser (colored circles) and continuum emission (blue scale) and within a radius of 1′′ is seen in five cases. The coordinates, peak fluxes, and the S/N of the detected radio continuum sources as measured with BLOBCAT (Hales et al. 2012; Medina et al. 2019) are given in Table 5. A upper limit is given in the table when no radio continuum emission is detected.
G78.8870+0.7087/AFGL2591. This maser is close (; cf. Table 5) to the VLA3 hot core (Campbell 1984; Johnston et al. 2013; Gieser et al. 2019) in the well-known high-mass star-forming region AFGL2591. VLA3 is also detected in the GLOSTAR B-configuration map (see panel 1 of Fig. 6). A spectral index of between 8.3 and 43 GHz was estimated by Johnston et al. (2013) for VLA3. Extended bright infrared emission at 3.6–24 m is also present in the environment of the maser (see Figs. A.2 and 7). However, this infrared source is saturated in the Spitzer images. Motte et al. (2007) identified a dust core in their 1.2 mm observations whose peak position is closest to VLA3, and this dust core was recognized as a UC HII region. More recently, Gieser et al. (2019) resolved the millimeter emission toward VLA3 with higher angular observations taken with the NOrthern Extended Millimeter Array (NOEMA) and revealed an extended, almost spherically symmetric envelope at scales. We note that both the maser and the radio continuum emission lie within the extension of this source, which is approximately depicted by the magenta circle in panel 1 of Fig. 6. The integrated flux of this maser in the peak channel changes from Jy in the D-configuration image to Jy in the B-configuration image due to potential variability. The Effelsberg data, however, show an integrated flux of 0.7 Jy, which is consistent with the flux seen in the D-configuration map. Its 3.3 kpc maser parallax distance places AFGL 2591, like Cygnus X, in the local arm (see, e.g., Fig. 1 of Reid et al. 2019).
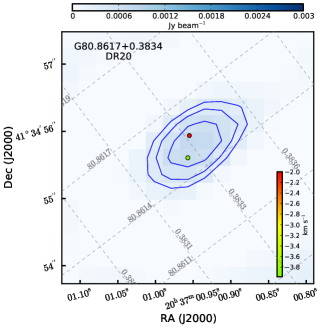
G80.8617+0.3834/DR20. We detected two additional features in the D-configuration spectrum, at and 1 km s-1, which were not seen in the spectrum from Hu et al. (2016) and Yang et al. (2019). We note that these two components and the component at 11 km s-1 are not detected in the B-configuration data, likely due to variability. We see a weak source ( = 0.79 mJy beam-1) in the B-array radio continuum map coincident with the location of the maser (panel 2 of Fig. 6). The infrared environment around the maser shows slightly extended 3.6–8 m emission (Fig. A.2). The source at 24 m is saturated. This object is recognized as a high-luminosity infrared protostellar core (Motte et al. 2007).
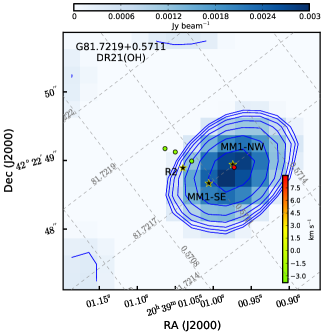
G81.7219+0.5711/DR21(OH). Compared to the spectrum from Hu et al. (2016), we detected an additional weak feature at 9 km s-1. A bright infrared peak is seen at 3.6–24 m close to the location of the maser (Fig. A.2); however, its position does not exactly coincide with the maser intensity peak, showing a small offset of 1′′. This maser is associated with the well-known high-mass star-forming region DR21(OH). Its position coincides with the main core in DR21(OH), which is a massive infrared-quiet (¡10 Jy at 21 m) protostar in an early evolutionary stage (Motte et al. 2007). We see a weak source in the B-array radio continuum map close to the location of the masers (panel 3 of Fig. 6). The strongest maser component is offset by with respect to the peak position of the continuum source; however, the component at km s-1 coincides in position with the continuum source. The continuum source has a peak flux density of mJy beam-1. In a previous work, Araya et al. (2009) conducted radio continuum observations at 3.6, 1.3, and 0.7 cm toward DR21(OH) at subarcsecond angular resolution. They detected a cluster of radio sources; their source MM1-NW ( mJy beam-1 at 8.46 GHz) is the closest to the source we detect in our GLOSTAR B-array continuum data. Source MM1-NW is also coincident with the maser at km s-1, while source R2 is the closest to the masers at smaller velocities (see panel 3 of Fig. 6). Araya et al. (2009) suggested that the two brightest sources detected toward the molecular core (MM1-NW and MM1-SE) trace radio emission from shock-ionized gas in a jet, while the radio emission from source R2 was proposed to be gyrosynchrotron radiation from a low-mass star. We cannot resolve these individual continuum components in the GLOSTAR data, which prevents us from estimating spectral indices of the individual radio sources to confirm or reject the conclusion by Araya et al. (2009). Based on their higher angular resolution images, Araya et al. (2009) measured a spectral index of 0.80.2 between 8.4 and 43 GHz for both MM1-NW and MM1-SE, and 0.10.2 for R2. Thus, given the correspondence in the positions measured by these authors with the maser positions, it is tempting to suggest that MM1-NW and R2 are UC HII regions.
G81.7444+0.5910/W75S-FIR1. We see a weak source in the B-array radio continuum map very close (at ) to the location of the maser position (panel 4 of Fig. 6). The continuum source has a peak flux density of mJy. The maser has associated compact emission at 3.6–8 m (Fig. A.2). At 24 m the source is saturated, but we see some extended emission surrounding the maser. The source with which this maser is associated is the high-luminosity () infrared object W75S FIR1 (Harvey et al. 1986), a well-known massive embedded protostar (Chandler et al. 1993; Motte et al. 2007).
G81.8713+0.7807/W75N(B). We see that the masers trace a velocity gradient of a few km s-1 in the north-south direction across a scale of 2′′. We detect continuum emission close to this maser in both D-array and B-array VLA maps. The maser position is within of a radio continuum peak ( mJy) seen in the B-array map (panel 5 of Fig. 6). The radio continuum peak corresponds to VLA 1, a source that was found to have a jet-like appearance at 1.3 cm (Torrelles et al. 1997). Recently, Rodríguez-Kamenetzky et al. (2020) conducted multifrequency VLA observations and concluded that VLA1 consists of a thermal radio jet surrounded by a hyper-compact (HC) HII region. The infrared environment toward the maser shows three peaks in the 3.6–8 m maps (Fig. A.2). At 24 m, the source is saturated. The maser seems to be located between two infrared peaks seen in the 5.8 m map, but its position coincides with an infrared peak we see at 21.3 m in the Midcourse Space Experiment (MSX) map (see the bottom panel of Fig. 7). The maser is found in the star-forming region W75N(B), which is mainly composed of two UC HII regions (Hunter et al. 1994), namely W75N(Ba) and W75N(Bb) (also known as VLA1 and VLA3, respectively, in the nomenclature of Torrelles et al. 1997).
The following maser sources do not have counterparts in either our VLA radio continuum maps or previous radio continuum surveys (within a matching radius of 10′′).
G76.0932+0.1580. Yang et al. (2019) reported on the velocity components detected at 4.8 and 6.4 km s-1 (see Table 8). Here, we detect an additional component at 6.5 km s-1 in the D-array VLA spectrum. The maser is associated with a compact weak source seen at 4.5-24 m (Fig. A.2). The infrared source has been classified as a protostar candidate by Kryukova et al. (2014) and shows a rising infrared SED.
G76.8437+0.1233. This source is a newly detected 6.7 GHz maser. The maser is associated with compact bright emission at 4.5-24 m (Fig. 5). It also appears in the catalog of protostar candidates by Kryukova et al. (2014) as a rising SED protostar. One single strong velocity component with an integrated flux in the peak channel of Jy is detected in the D-configuration image taken in August 2014. The flux declines to Jy in the B-configuration image taken in May 2015. The maser is undetected in Effelsberg observations taken in August 2019 with a 3 upper limit of 0.36 Jy beam-1. Such variability in the 6.7 GHz emission may explain why the maser has not been reported in previous surveys of methanol masers.
G78.9690+0.5410/IRAS 20286+3959. This maser was recently detected by Yang et al. (2019), with a peak velocity and peak flux very consistent with our VLA detection. The maser is associated with slightly extended emission at 3.6–24 m (Fig. A.2). It has also been classified as a rising infrared SED protostar (Kryukova et al. 2014).
G78.9884+0.2211. This 6.7 GHz maser has not been reported before. The maser LSR velocity ( km s-1) is completely different from the velocities of the other masers detected in Cygnus X, which are within 15 to 15 km s-1; therefore, this maser is probably at a different distance. The maser has five velocity components, with the strongest component having an integrated flux density at the peak channel of Jy in the D-configuration image. This declines to Jy in the B-configuration image, while the Effelsberg spectrum shows only one velocity component with an integrated flux of 0.6 Jy. The second strongest component does not change in flux between the two VLA epochs, while the other three velocity components are not seen in the B-configuration map nor in the Effelsberg data.
We inspected CO () data131313https://cygnus45.github.io/ taken with the 45 m Nobeyama telescope by Yamagishi et al. (2018). The spectrum extracted from the maser position shows two peaks, one at km s-1 and one at km s-1, the latter of which is close to the methanol maser velocity. The emission at this velocity is distributed across a region of , while emission around km s-1 is more diffuse and extended. We calculated the distance to the km s-1 component using the Bayesian distance estimator developed by Reid et al. (2016)141414http://bessel.vlbi-astrometry.org/bayesian. The estimator yields a distance of kpc with an integrated probability of 100% association with the Outer Arm. At a similar Galactic longitude there are two maser stars in the Outer Arm with parallaxes that are consistent with this distance (G075.29+01.32 and G073.65+00.19; Sanna et al. 2011; Reid et al. 2019). Certainly, the CO-traced km s-1 cloud associated with the methanol maser and likely also the km s-1 cloud are not part of the Cygnus X region, but are rather unrelated clouds lying on the same line of sight by chance.
Assuming that G78.9884+0.2211 is at 9.35 kpc, the mass, FIR luminosity, and bolometric luminosity must be rescaled to , , and, , respectively. Given the uncertainty in the distance, we do not include this maser source in the analysis presented in Sect. 5.
Wendker (1970) reported on radio continuum emission at 2.695 GHz, but at from the maser location. There are several bright infrared peaks seen at 3.6–24 m in the vicinity of the maser surrounded by extended emission (Fig. A.2). The maser position coincides with one infrared peak. This infrared source also shows a rising SED (Kryukova et al. 2014).
G79.7358+0.9904/IRAS 20290+4052. This maser is associated with bright, somewhat extended 3.6–24 m emission (Fig. A.2). Kryukova et al. (2014) classified the infrared source as a protostar candidate with a rising SED. The infrared source was also recognized early on as a UC HII region based on their FIR colors (Bronfman et al. 1996; van der Walt et al. 1996), which meet the criteria for UC HII regions proposed by Wood & Churchwell (1989). However, as already pointed out, no radio continuum emission has been detected toward this source, which suggests that this object may be a precursor of a UC HII region.
G81.7523+0.5908/W75S-FIR2. The infrared environment toward this maser shows bright and slightly extended 3.6–8 m emission (Fig. A.2). The source is saturated at 24 m. The maser position coincides with the location of object W75S FIR2 (Harvey et al. 1986), a high-luminosity infrared protostellar core (Motte et al. 2007).
G81.7655+0.5972/CygX-N53. The emission seen in the D-array spectrum close to 7 km s-1 is from sidelobes by the strong nearby maser G81.8713+0.7807/W75N(B). The 3.6–8 m emission seen at the location of the maser (Fig. A.2) is remarkably weak (measured flux density at the location of the maser is 1–11 mJy beam-1, respectively). The associated molecular core has been recognized as a massive infrared-quiet protostellar core (Motte et al. 2007). Observations at 1.3 mm with the IRAM Plateau de Bure interferometer revealed that the core is broken up into four smaller fragments (Bontemps et al. 2010). The maser position coincides with the strongest fragment, CygX-N53 MM1, which is a self-gravitating protostellar object and a good candidate to be a precursor of an OB star (Bontemps et al. 2010). Among the sample of 17 massive infrared-quiet protostellar cores identified by Motte et al. (2007), CygX-N53 and DR21(OH) are the only ones that show maser emission. However, the infrared emission from CygX-N53 is about an order of magnitude weaker than that of DR21(OH). The sample of Motte et al. (2007) comprises other infrared-quiet protostars (¡10 Jy at 21 m) with similar properties (mass, size, density) as CygX-N53, also located in the DR21 ridge; thus, it is unclear which conditions favor the onset of maser emission in CygX-N53 and not in the other cores that have similar physical properties.
G82.3079+0.7296. This maser was recently detected by Yang et al. (2019). They reported a peak flux of 58.4 Jy, which is more than two times higher than the flux we detected with the VLA. The maser is associated with extended m emission (Fig. A.2). The infrared source has been classified as a rising SED protostar (Kryukova et al. 2014).
4.5 Methanol absorption toward DR21
The region surrounding the prominent thermal radio source DR21 (Downes & Rinehart 1966) hosts a compact (about ) and massive molecular core, which is located near the southern end of a long molecular cloud ridge oriented in the north-south direction and referred to as the DR21 ridge (see, e.g., Reipurth & Schneider 2008; Hennemann et al. 2012). This core harbors a group of five compact HII regions that are surrounded by a diffuse halo of ionized gas with a cometary morphology, with the most prominent compact component, DR21 M, at the head of the “comet” (Harris 1973; Roelfsema et al. 1989; Cyganowski et al. 2003).
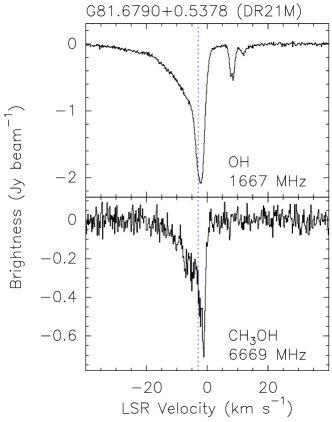
The DR21 M HII region itself is surrounded by a dense molecular envelope with a photodissociation region (PDR) as an interface (Ossenkopf et al. 2010). The more compact and denser envelopes of UC HII regions often host Class II CH3OH and OH masers, with W3(OH) the archetypal example (Menten et al. 1992). In contrast, the more developed envelope of DR21 M does not host any masers, but exhibits absorption features of OH in the hyperfine transitions of the rotational ground and excited states against the strong continuum emission of the compact HII region (see Jones et al. 1994, and references therein). As shown in Fig. 8, we detect absorption in the 6.7 GHz methanol line with a shape similar to that of the 1667 MHz OH line (taken from Koley et al. 2020). While the OH line extends to much lower velocities than that of CH3OH, this may be a result of the poorer S/N of the latter. Both lines show their deepest absorption at about , close to the systemic velocity of DR21 M, –3 km s-1. Figure 9 shows that the methanol absorption is seen only against the strongest continuum from DR21 M, although this may also be caused by our limited S/N toward regions with weaker extended continuum emission.
We note that the OH transition, but not the CH3OH transition, also shows absorption at velocities between +6 and +12 km s-1. This represents low density material from a second extended molecular cloud, sometimes called the “W75 N 9 km s-1 cloud,” that covers the part of the W75 region that is kinematically distinct from the cloud, which is also extended, at the LSR velocity of DR21 (Dickel et al. 1978). Emission or absorption from this cloud is only observed from transitions with a low critical density, that is, ground-state or near ground-state lines (see Koley et al. 2020).
We searched the D-configuration data cubes for other sources of methanol absorption, specifically toward the DR21 ridge, but did not detect absorption at any other location. In particular, we did not find absorption toward the Class I methanol maser sources in the vicinity of DR21(OH) and DR 21 (see Fig. 10). As explained by Menten (1991b) and Leurini et al. (2016), the same (purely collisional) pumping process that inverts the energy levels of the Class I maser lines of -type CH3OH () in molecular outflows also “anti-inverts” those of the 6.7 GHz line, causing enhanced absorption (overcooling) over more extended regions; this has actually been observed with single dish telescopes (Menten 1991b)151515Analogously, for -type CH3OH, the lines () are masing, whereas the 12.1 GHz line is overcooled.. Apparently, in our data of the DR21 region, absorption signals confined to compact Class I maser spots are not strong enough to be detectable at our sensitivity. In Appendix D we discuss constraints on the methanol abundance in the DR21 M molecular core derived from our absorption spectrum.
5 Discussion
5.1 Association with radio continuum emission
One important aspect to establish an evolutionary sequence model of methanol masers in star-forming regions is the coincidence of masers and UC HII regions. Walsh et al. (1998) proposed that methanol masers are present before the formation of a UC HII region around a massive star and persist until the destruction of methanol as the UC HII region evolves. Our high angular resolution observations can probe, for the first time, the coincidence of masers and UC HII regions (by means of their radio continuum emission) in the Cygnus X complex down to scales of 1700 au. While the GLOSTAR observations are not ultra deep (our sensitivity limit is 0.06 mJy beam-1), they are more sensitive than most previous efforts and, notably, have resulted in the detection of weak (a few mJy) continuum emission toward five of our maser sources.
We found that five masers without a radio continuum counterpart are associated with infrared sources that show a rising SED between 4.5 and 24 m (Kryukova et al. 2014), suggesting that they host high-mass protostellar objects. Since they do not have associated radio continuum, these sources may be in a younger evolutionary state compared to the UC HII region (pre-UC HII). Three masers are associated with known UC HII regions identified previously in the literature (AFGL2591, Motte et al. 2007; IRAS 20290+4052, Bronfman et al. 1996; and W75N(B), Hunter et al. 1994). However, we found that G79.7358+0.9904/IRAS 20290+4052 does not show radio continuum emission at a 3 level of 0.22 mJy; thus, it could be in a pre-UC HII state. DR21 is also associated with a UC HII region; however, it does not have maser emission but rather absorption in the methanol line. Three other masers are found to be coincident (within 1′′) with sources of compact radio continuum emission; therefore, they are likely UC HII or HC HII regions. We have indicated in Col. (4) of Table 6 whether the masers are associated with a pre-UC HII or a UC or HC HII region. In total, five dust cores host both a UC or HC HII region and maser emission161616 We found that the number of expected background sources inside our matching radius is well below one source (see Appendix E). This implies a very low probability for the association between masers and continuum on the line of sight being just by chance., and all of them have . This implies an association rate between masers and HII regions of , which is consistent within the error with that found in other studies (Walsh et al. 1998; Beuther et al. 2002; Walsh et al. 2003; Hill et al. 2005; Hu et al. 2016; Billington et al. 2019). However, we should note here that our sample is much smaller than the samples studied in these previous works, which is reflected by the large uncertainty in the association rate. As discussed in Sect. 1, many of the MYSOs that power a methanol maser could be in the HC HII stage. Because of their small angular size (0.03 pc; Kurtz 2005), such sources are expected to have weak radio emission (20 mJy at 1.4 kpc; Thompson et al. 2016) that, because of their high electron density (106 cm-3; Kurtz 2005), would be optically thick up to high radio frequency, implying a spectral index of 2. Unfortunately, the low flux levels of the continuum sources (which causes these sources to remain undetected at the individual subbands across the bandwidth; cf. Sect. 2) and the very limited frequency range covered (of only 2 GHz) preclude a meaningful determination of their spectral indices, which would have allowed us to unambiguously classify them as HC HII regions.
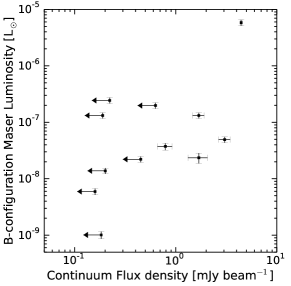
In Fig. 11 we show the 6.7 GHz maser integrated luminosity against continuum flux density for the five methanol masers that are associated with compact radio continuum emission as well as the 3 upper limits for the non-detections. We find no significant correlation between these values (a Spearman correlation test yields a coefficient of 0.67 with a -value ). If confirmed with more significant statistics, for instance by the GLOSTAR observations from the full Galactic plane, this would suggest that the 6.7 GHz maser phenomenon is not directly linked to the ionizing radiation.

5.2 Mass and luminosity correlation
We estimated the properties of the dust cores that are associated with a methanol source (Sect. 4.2). In order to study the relationship between methanol masers and massive star-forming dust cores, in this section we investigate the physical properties of dust cores with and without associated masers as well as the correlations between the methanol masers and dust core properties.
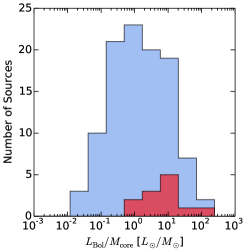
The upper panel of Fig. 12 shows the distribution of bolometric luminosity for the sample of Cao et al. (2019) and the maser associated cores. Although the sample of cores with associated masers is small, it does seem to cover a narrower range in luminosity than the range occupied by the full sample of massive dense cores; however, it still covers a range of a few orders of magnitude (from to ). A similar result was reported by Billington et al. (2019) for the ATLASGAL clumps. They found that maser associated clumps have, on average, higher luminosities when compared to their full sample. Figure 12 also suggests a luminosity limit for maser emission of 200 , which is lower than the limit of estimated by Bourke et al. (2005) and more similar to the limit found in Paulson & Pandian (2020) and Jones et al. (2020). The bottom panel of Fig. 12 shows the distribution of the bolometric luminosity-to-core-mass ratio, , for the sample of Cao et al. (2019) and the maser associated cores found with GLOSTAR. There seems to be a threshold of this parameter for maser emission since the minimum of a source that is associated with maser emission is . A similar value was suggested by Billington et al. (2019).
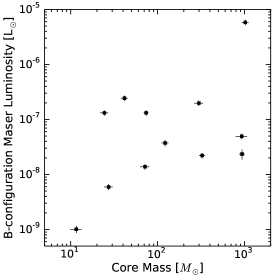
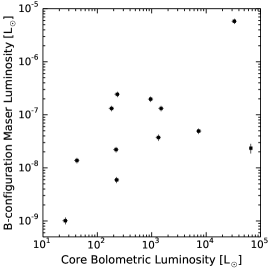
Figure 13 shows the correlations between methanol masers and dust core properties. The left and middle panels present maser integrated luminosity as a function of core mass and bolometric luminosity, respectively. We see in these figures that if we exclude the maser with the strongest luminosity, the correlation between these properties is nearly nonexistent. However, this may be due to the limited size of our sample. Billington et al. (2019) found a weak correlation between clump bolometric luminosity and maser luminosity for a much larger sample (958 dust clumps that host methanol masers). In another study, Paulson & Pandian (2020) also found a weak correlation between clump and maser luminosity for their sample of 320 MMB masers. These authors also noted that the relationship between clump and maser luminosity for the low-luminosity () maser population is consistent with no correlation. If this non-correlation is confirmed for a larger sample, it would suggest that, for low-luminosity masers, the maser luminosity is probably not mainly driven by core luminosity but by other factors, as suggested by Paulson & Pandian (2020), such as gas density, gas temperature, and methanol fractional abundance, which are not explored in this paper. We note that the two new detected masers are associated with dust cores that have the lowest mass, , and also have the lowest luminosity, (cf. Table 4). While previous maser studies toward Cygnus X have selected the brightest sources (e.g., Hu et al. 2016; Yang et al. 2019), GLOSTAR is an unbiased survey and is also more sensitive than most of these previous efforts, allowing the detection of more new masers at the lower end of the maser luminosity distribution function.
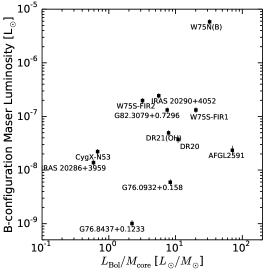
The luminosity-to-mass () ratio has been proposed to be an evolutionary indicator during the formation process of massive clumps (e.g., Molinari et al. 2008, see, however, Ma et al. 2013). The ratio increases with age as a result of the envelope mass falling into the forming star. Previous works have found a weak correlation between the ratio of maser associated clumps and maser luminosity (e.g., Billington et al. 2019), suggesting that higher-luminosity masers are associated with more evolved clumps. We investigated this relation for the maser host cores in Cygnus X. The right panel of Fig. 13 shows maser integrated luminosity against the ratio. The correlation between these quantities is not significant (the Spearman correlation coefficient is 0.3 with -value =0.3), which can be attributed to the large scatter of the measurements and the small size of our sample. However, we note that the masers associated with UC or HC HII regions (cf. Table 6) occupy the region in this diagram with high ratios, as expected for more evolved objects; specifically, they all lie above .
In summary, the results above suggest that there is a core bolometric luminosity threshold for the maser emission of 200 , which is in agreement with that found in recent works that have studied a significant sample of maser host clumps in the Galactic plane but excluded the Cygnus X complex. For the minimum core mass, we found a value of 10 in our sample (cf. Table 4), which is likely sufficient to form a single high-mass star. In a previous study, Billington et al. (2019) reported a minimum FWHM mass (mass within 50% of the 850 or 870 m contour) of 17 M⊙ for their distance-limited sample of cores that host methanol masers, while the minimum mass reported by Paulson & Pandian (2020) is . The distribution of the luminosity-to-mass ratio of dust cores that host maser emission is narrower than the distribution of the full core population, with methanol host cores having ratios between 1 and . This is consistent with that expected from the evolutionary sequence model of Breen et al. (2010) and Billington et al. (2019), who suggest that the maser emission starts at a ratio of , followed by the maser emission and continuum emission from the HII region being simultaneously detectable at higher values of , leading to the final decline of the maser emission due to the disruptive effects of the HII region at a value of . The threshold of the luminosity-to-mass ratio of 1 is also consistent with what has been measured for a larger sample of star-forming regions in the Galactic plane (Billington et al. 2019, 2020).
6 Conclusions
We have conducted the first unbiased survey of Class II methanol masers at 6.7 GHz in the Cygnus X complex. A total of 13 masers were detected in the observed area, for which we derive fluxes and integrated luminosities, as well as absolute positions of the maser features. In addition, methanol absorption is detected toward DR21 against the compact continuum from the HII regions inside the DR21 core. We have established the associations between maser sources and radio continuum, (sub)millimeter, and infrared emission to within . All masers are associated with dust continuum cores, and all of them are close to or coincident with near-infrared or FIR peaks, as expected from the maser-MYSO relationship. Only a fraction of them () have radio continuum detected by our survey or in previous observations. These sources are more likely to be UC HII or HC HII regions.
By fitting the SED to the dust continuum emission, we have derived the properties of the cores that host maser emission and compared their distributions with those of the full population of dust cores in the Cygnus X complex identified in the literature. We found thresholds for maser emission in luminosity and the luminosity-to-mass ratio of and , respectively. These values are in agreement with recent works that have investigated a larger sample of methanol maser hosts in the Galactic plane.
Acknowledgements.
The authors are grateful to the anonymous referee, whose comments helped to improve this paper. G.N.O.-L. would like to thank Antonio Hernandez-Gómez for a detailed reading of an early version of the manuscript and valuable suggestions. We thank Yue Cao and Keping Qiu for providing mosaics maps of (sub)millimeter emission. We also thank Nicola Schneider for sharing her IRAM CO data. G.N.O.-L. acknowledges support from the von Humboldt Stiftung. T.Cs. has received financial support from the French State in the framework of the IdEx Université de Bordeaux Investments for the future Program. H.B. acknowledges support from the European Research Council under the European Community’s Horizon 2020 framework program (2014-2020) via the ERC Consolidator grant “From Cloud to Star Formation (CSF)” (project number 648505). H.B. further acknowledges support from the Deutsche Forschungsgemeinschaft (DFG) via Sonderforschungsbereich (SFB) 881 “The Milky Way System” (sub-project B1). The National Radio Astronomy Observatory (NRAO) is operated by Associated Universities Inc., under cooperative agreement with the National Science Foundation.References
- Aguirre et al. (2011) Aguirre, J. E., Ginsburg, A. G., Dunham, M. K., et al. 2011, ApJS, 192, 4
- Anglada et al. (1998) Anglada, G., Villuendas, E., Estalella, R., et al. 1998, AJ, 116, 2953
- Araya et al. (2009) Araya, E. D., Kurtz, S., Hofner, P., & Linz, H. 2009, ApJ, 698, 1321
- Argon et al. (2000) Argon, A. L., Reid, M. J., & Menten, K. M. 2000, ApJS, 129, 159
- Batrla et al. (1987) Batrla, W., Matthews, H. E., Menten, K. M., & Walmsley, C. M. 1987, Nature, 326, 49
- Beerer et al. (2010) Beerer, I. M., Koenig, X. P., Hora, J. L., et al. 2010, ApJ, 720, 679
- Beuther et al. (2002) Beuther, H., Walsh, A., Schilke, P., et al. 2002, A&A, 390, 289
- Billington et al. (2020) Billington, S. J., Urquhart, J. S., König, C., et al. 2020, MNRAS
- Billington et al. (2019) Billington, S. J., Urquhart, J. S., König, C., et al. 2019, MNRAS, 490, 2779
- Bonfand et al. (2017) Bonfand, M., Belloche, A., Menten, K. M., Garrod, R. T., & Müller, H. S. P. 2017, A&A, 604, A60
- Bontemps et al. (2010) Bontemps, S., Motte, F., Csengeri, T., & Schneider, N. 2010, A&A, 524, A18
- Bourke et al. (2005) Bourke, T. L., Hyland, A. R., & Robinson, G. 2005, ApJ, 625, 883
- Breckenridge & Kukolich (1995) Breckenridge, S. M. & Kukolich, S. G. 1995, ApJ, 438, 504
- Breen et al. (2011) Breen, S. L., Ellingsen, S. P., Caswell, J. L., et al. 2011, ApJ, 733, 80
- Breen et al. (2010) Breen, S. L., Ellingsen, S. P., Caswell, J. L., & Lewis, B. E. 2010, MNRAS, 401, 2219
- Bronfman et al. (1996) Bronfman, L., Nyman, L. A., & May, J. 1996, A&AS, 115, 81
- Brunthaler et al. (2021) Brunthaler, A., Menten, K. M., Dzib, S. A., et al. 2021, arXiv e-prints, arXiv:2106.00377
- Campbell (1984) Campbell, B. 1984, ApJ, 287, 334
- Cao et al. (2019) Cao, Y., Qiu, K., Zhang, Q., et al. 2019, ApJS, 241, 1
- Caswell et al. (2010) Caswell, J. L., Fuller, G. A., Green, J. A., et al. 2010, MNRAS, 404, 1029
- Caswell et al. (2011) Caswell, J. L., Fuller, G. A., Green, J. A., et al. 2011, MNRAS, 417, 1964
- Caswell et al. (1995) Caswell, J. L., Vaile, R. A., Ellingsen, S. P., Whiteoak, J. B., & Norris, R. P. 1995, MNRAS, 272, 96
- Chandler et al. (1993) Chandler, C. J., Gear, W. K., & Chini, R. 1993, MNRAS, 260, 337
- Cotton (2008) Cotton, W. D. 2008, PASP, 120, 439
- Cragg et al. (2005) Cragg, D. M., Sobolev, A. M., & Godfrey, P. D. 2005, MNRAS, 360, 533
- Csengeri et al. (2014) Csengeri, T., Urquhart, J. S., Schuller, F., et al. 2014, A&A, 565, A75
- Cyganowski et al. (2003) Cyganowski, C. J., Reid, M. J., Fish, V. L., & Ho, P. T. P. 2003, ApJ, 596, 344
- Dickel et al. (1978) Dickel, J. R., Dickel, H. R., & Wilson, W. J. 1978, ApJ, 223, 840
- Downes & Rinehart (1966) Downes, D. & Rinehart, R. 1966, ApJ, 144, 937
- Duarte-Cabral et al. (2014) Duarte-Cabral, A., Bontemps, S., Motte, F., et al. 2014, A&A, 570, A1
- Dunham et al. (2008) Dunham, M. M., Crapsi, A., II, N. J. E., et al. 2008, The Astrophysical Journal Supplement Series, 179, 249
- Dzib et al. (2013) Dzib, S. A., Rodríguez, L. F., Loinard, L., et al. 2013, ApJ, 763, 139
- Eden et al. (2017) Eden, D. J., Moore, T. J. T., Plume, R., et al. 2017, MNRAS, 469, 2163
- Ellingsen (2006) Ellingsen, S. P. 2006, ApJ, 638, 241
- Gieser et al. (2019) Gieser, C., Semenov, D., Beuther, H., et al. 2019, A&A, 631, A142
- Gottschalk et al. (2012) Gottschalk, M., Kothes, R., Matthews, H. E., Land ecker, T. L., & Dent, W. R. F. 2012, A&A, 541, A79
- Green et al. (2017) Green, J. A., Breen, S. L., Fuller, G. A., et al. 2017, MNRAS, 469, 1383
- Green et al. (2009) Green, J. A., Caswell, J. L., Fuller, G. A., et al. 2009, MNRAS, 392, 783
- Green et al. (2010) Green, J. A., Caswell, J. L., Fuller, G. A., et al. 2010, MNRAS, 409, 913
- Green et al. (2012) Green, J. A., Caswell, J. L., Fuller, G. A., et al. 2012, MNRAS, 420, 3108
- Hales et al. (2012) Hales, C. A., Murphy, T., Curran, J. R., et al. 2012, MNRAS, 425, 979
- Harris (1973) Harris, S. 1973, MNRAS, 162, 5P
- Harvey et al. (1986) Harvey, P. M., Joy, M., Lester, D. F., & Wilking, B. A. 1986, ApJ, 300, 737
- Hennemann et al. (2014) Hennemann, M., Motte, F., & Schneider, N. 2014, in The Labyrinth of Star Formation, Vol. 36, 271
- Hennemann et al. (2012) Hennemann, M., Motte, F., Schneider, N., et al. 2012, A&A, 543, L3
- Hill et al. (2005) Hill, T., Burton, M. G., Minier, V., et al. 2005, MNRAS, 363, 405
- Hu et al. (2016) Hu, B., Menten, K. M., Wu, Y., et al. 2016, ApJ, 833, 18
- Hunter et al. (1994) Hunter, T. R., Taylor, G. B., Felli, M., & Tofani, G. 1994, A&A, 284, 215
- Johnston et al. (2013) Johnston, K. G., Shepherd, D. S., Robitaille, T. P., & Wood, K. 2013, A&A, 551, A43
- Jones et al. (2020) Jones, B. M., Fuller, G. A., Breen, S. L., et al. 2020, MNRAS, 493, 2015
- Jones et al. (1994) Jones, K. N., Field, D., Gray, M. D., & Walker, R. N. F. 1994, A&A, 288, 581
- Kauffmann et al. (2008) Kauffmann, J., Bertoldi, F., Bourke, T. L., Evans, II, N. J., & Lee, C. W. 2008, A&A, 487, 993
- Keown et al. (2019) Keown, J., Di Francesco, J., Rosolowsky, E., et al. 2019, ApJ, 884, 4
- Koley et al. (2020) Koley, A., Roy, N., Menten, K. M., et al. 2020, arXiv e-prints, arXiv:2012.08253
- König et al. (2017) König, C., Urquhart, J. S., Csengeri, T., et al. 2017, A&A, 599, A139
- König et al. (2021) König, C., Urquhart, J. S., Wyrowski, F., Colombo, D., & Menten, K. M. 2021, A&A, 645, A113
- Kraemer et al. (2010) Kraemer, K. E., Hora, J. L., Egan, M. P., et al. 2010, AJ, 139, 2319
- Kryukova et al. (2014) Kryukova, E., Megeath, S. T., Hora, J. L., et al. 2014, AJ, 148, 11
- Kurtz (2005) Kurtz, S. 2005, in Massive Star Birth: A Crossroads of Astrophysics, ed. R. Cesaroni, M. Felli, E. Churchwell, & M. Walmsley, Vol. 227, 111–119
- Kurtz et al. (2004) Kurtz, S., Hofner, P., & Álvarez, C. V. 2004, ApJS, 155, 149
- Leurini et al. (2016) Leurini, S., Menten, K. M., & Walmsley, C. M. 2016, A&A, 592, A31
- Ma et al. (2013) Ma, B., Tan, J. C., & Barnes, P. J. 2013, ApJ, 779, 79
- Medina et al. (2019) Medina, S. N. X., Urquhart, J. S., Dzib, S. A., et al. 2019, A&A, 627, A175
- Menten (1991a) Menten, K. M. 1991a, in Astronomical Society of the Pacific Conference Series, Vol. 16, Atoms, Ions and Molecules: New Results in Spectral Line Astrophysics, ed. A. D. Haschick & P. T. P. Ho, 119–136
- Menten (1991b) Menten, K. M. 1991b, ApJ, 380, L75
- Menten et al. (1992) Menten, K. M., Reid, M. J., Pratap, P., Moran, J. M., & Wilson, T. L. 1992, ApJ, 401, L39
- Menten et al. (1988) Menten, K. M., Walmsley, C. M., Henkel, C., & Wilson, T. L. 1988, A&A, 198, 253
- Minier et al. (2003) Minier, V., Ellingsen, S. P., Norris, R. P., & Booth, R. S. 2003, A&A, 403, 1095
- Molet et al. (2019) Molet, J., Brouillet, N., Nony, T., et al. 2019, A&A, 626, A132
- Molinari et al. (2008) Molinari, S., Pezzuto, S., Cesaroni, R., et al. 2008, A&A, 481, 345
- Molinari et al. (2010) Molinari, S., Swinyard, B., Bally, J., et al. 2010, PASP, 122, 314
- Moore et al. (2015) Moore, T. J. T., Plume, R., Thompson, M. A., et al. 2015, MNRAS, 453, 4264
- Motte et al. (2007) Motte, F., Bontemps, S., Schilke, P., et al. 2007, A&A, 476, 1243
- Motte et al. (2010) Motte, F., Zavagno, A., Bontemps, S., et al. 2010, A&A, 518, L77
- Müller et al. (2005) Müller, H. S. P., Schlöder, F., Stutzki, J., & Winnewisser, G. 2005, Journal of Molecular Structure, 742, 215
- Norris et al. (1982) Norris, R. P., Booth, R. S., Diamond, P. J., & Porter, N. D. 1982, MNRAS, 201, 191
- Ossenkopf & Henning (1994) Ossenkopf, V. & Henning, T. 1994, A&A, 291, 943
- Ossenkopf et al. (2010) Ossenkopf, V., Röllig, M., Simon, R., et al. 2010, A&A, 518, L79
- Pandian et al. (2008) Pandian, J. D., Leurini, S., Menten, K. M., Belloche, A., & Goldsmith, P. F. 2008, A&A, 489, 1175
- Pandian et al. (2010) Pandian, J. D., Momjian, E., Xu, Y., Menten, K. M., & Goldsmith, P. F. 2010, A&A, 522, A8
- Paulson & Pandian (2020) Paulson, S. T. & Pandian, J. D. 2020, MNRAS, 492, 1335
- Pestalozzi et al. (2005) Pestalozzi, M. R., Minier, V., & Booth, R. S. 2005, A&A, 432, 737
- Pipenbrink & Wendker (1988) Pipenbrink, A. & Wendker, H. J. 1988, A&A, 191, 313
- Plambeck & Menten (1990) Plambeck, R. L. & Menten, K. M. 1990, ApJ, 364, 555
- Price et al. (2001) Price, S. D., Egan, M. P., Carey, S. J., Mizuno, D. R., & Kuchar, T. A. 2001, AJ, 121, 2819
- Purcell et al. (2013) Purcell, C. R., Hoare, M. G., Cotton, W. D., et al. 2013, ApJS, 205, 1
- Reid et al. (2016) Reid, M. J., Dame, T. M., Menten, K. M., & Brunthaler, A. 2016, ApJ, 823, 77
- Reid et al. (2019) Reid, M. J., Menten, K. M., Brunthaler, A., et al. 2019, ApJ, 885, 131
- Reipurth & Schneider (2008) Reipurth, B. & Schneider, N. 2008, Star Formation and Young Clusters in Cygnus, ed. B. Reipurth, Vol. 4, 36
- Rodríguez-Kamenetzky et al. (2020) Rodríguez-Kamenetzky, A., Carrasco-González, C., Torrelles, J. M., et al. 2020, MNRAS, 496, 3128
- Roelfsema et al. (1989) Roelfsema, P. R., Goss, W. M., & Geballe, T. R. 1989, A&A, 222, 247
- Rosolowsky et al. (2010) Rosolowsky, E., Dunham, M. K., Ginsburg, A., et al. 2010, ApJS, 188, 123
- Roy et al. (2011) Roy, A., Ade, P. A. R., Bock, J. J., et al. 2011, ApJ, 727, 114
- Rygl et al. (2012) Rygl, K. L. J., Brunthaler, A., Sanna, A., et al. 2012, A&A, 539, A79
- Sanna et al. (2011) Sanna, A., Reid, M. J., Dame, T. M., et al. 2011, The Astrophysical Journal, 745, 82
- Schneider et al. (2006) Schneider, N., Bontemps, S., Simon, R., et al. 2006, A&A, 458, 855
- Schuller et al. (2009) Schuller, F., Menten, K. M., Contreras, Y., et al. 2009, A&A, 504, 415
- Sobolev & Deguchi (1994) Sobolev, A. M. & Deguchi, S. 1994, A&A, 291, 569
- Thompson et al. (2017) Thompson, A. R., Moran, J. M., & Swenson, George W., J. 2017, Interferometry and Synthesis in Radio Astronomy, 3rd Edition
- Thompson et al. (2016) Thompson, M., Goedhart, S., Goedhart, S., et al. 2016, in MeerKAT Science: On the Pathway to the SKA, 15
- Torrelles et al. (1997) Torrelles, J. M., Gómez, J. F., Rodríguez, L. F., et al. 1997, ApJ, 489, 744
- Urquhart et al. (2014) Urquhart, J. S., Csengeri, T., Wyrowski, F., et al. 2014, A&A, 568, A41
- Urquhart et al. (2015) Urquhart, J. S., Moore, T. J. T., Menten, K. M., et al. 2015, MNRAS, 446, 3461
- Urquhart et al. (2013) Urquhart, J. S., Moore, T. J. T., Schuller, F., et al. 2013, MNRAS, 431, 1752
- Uyanıker et al. (2001) Uyanıker, B., Fürst, E., Reich, W., Aschenbach, B., & Wielebinski, R. 2001, A&A, 371, 675
- van der Tak et al. (2007) van der Tak, F. F. S., Black, J. H., Schöier, F. L., Jansen, D. J., & van Dishoeck, E. F. 2007, A&A, 468, 627
- van der Tak et al. (1999) van der Tak, F. F. S., van Dishoeck, E. F., Evans, Neal J., I., Bakker, E. J., & Blake, G. A. 1999, ApJ, 522, 991
- van der Walt et al. (1996) van der Walt, D. J., Retief, S. J. P., Gaylard, M. J., & MacLeod, G. C. 1996, MNRAS, 282, 1085
- Walsh et al. (1998) Walsh, A. J., Burton, M. G., Hyland, A. R., & Robinson, G. 1998, MNRAS, 301, 640
- Walsh et al. (2003) Walsh, A. J., Macdonald, G. H., Alvey, N. D. S., Burton, M. G., & Lee, J. K. 2003, A&A, 410, 597
- Wendker (1970) Wendker, H. J. 1970, A&A, 4, 378
- Wendker (1984) Wendker, H. J. 1984, A&AS, 58, 291
- Wendker et al. (1991) Wendker, H. J., Higgs, L. A., & Landecker, T. L. 1991, A&A, 241, 551
- Wood & Churchwell (1989) Wood, D. O. S. & Churchwell, E. 1989, ApJ, 340, 265
- Wright et al. (2010) Wright, N. J., Drake, J. J., Drew, J. E., & Vink, J. S. 2010, ApJ, 713, 871
- Xu et al. (2008) Xu, Y., Li, J. J., Hachisuka, K., et al. 2008, A&A, 485, 729
- Yamagishi et al. (2018) Yamagishi, M., Nishimura, A., Fujita, S., et al. 2018, ApJS, 235, 9
- Yang et al. (2019) Yang, K., Chen, X., Shen, Z.-Q., et al. 2019, ApJS, 241, 18
Appendix A Supplementary figures and tables
In this appendix, Figs. 14 and A.2 show (sub)millimeter dust emission and Spitzer infrared emission in a region of and , respectively, around maser positions.
Table LABEL:tab:catalog lists the catalog of maser spots detected above 4 in B-configuration data.
Figure A.3 displays the distribution of all methanol maser spots measured in the B-configuration images. For five of our sources, the 6.7 GHz methanol maser emission was imaged by Rygl et al. (2012) with the EVN with a resolution of a few milliarcseconds (mas), much better than our . A comparison between the EVN positions, which have absolute position uncertainties better than 1 mas, and even our higher resolution B-array VLA data is not straightforward for several reasons: Generally, in the VLA images several maser spots remain spatially unresolved, and our positions represent averages. Moreover, for several sources the EVN data show maser emission only over a fraction of the velocity range of the VLA data, leaving the determination of an emission centroid biased. Nevertheless, we note that for most sources the EVN-determined maser spots lie within the distributions of the VLA B-array spots (within tens of mas). For two sources, G81.7219+0.5711 [DR21(OH)] and G81.8713+0.78-7 [W75N(B)], we find offsets between the EVN and VLA positions of and , respectively. For DR21(OH), the significance of the offset is difficult to assess as many fewer spots (a total of three) appear in the EVN data than in the VLA data over a much narrower velocity range. Still, the offsets are smaller than or comparable to the position uncertainty discussed in Sect. 3.
| Name | Ref. RA | Ref. Dec. | |||||
|---|---|---|---|---|---|---|---|
| (h:m:s) | (o:′:′′) | (arcsec) | (arcsec) | (km s-1) | (Jy beam-1) | (Jy) | |
| (1) | (2) | (3) | (4) | (5) | (6) | (7) | (8) |
| G76.0932+0.1580 | 20:23:23.7140 | +37:35:35.558 | 0.000 | 0.000 | 6.64 | 0.57 0.01 | 0.59 0.02 |
| G76.0932+0.1580 | 20:23:23.7140 | +37:35:35.558 | -0.089 | -0.024 | 6.46 | 0.38 0.01 | 0.44 0.02 |
| G76.0932+0.1580 | 20:23:23.7140 | +37:35:35.558 | -0.103 | 0.055 | 4.84 | 0.38 0.01 | 0.48 0.01 |
| G76.0932+0.1580 | 20:23:23.7140 | +37:35:35.558 | -0.281 | -0.005 | -6.50 | 0.17 0.01 | 0.18 0.01 |
| G76.0932+0.1580 | 20:23:23.7140 | +37:35:35.558 | -0.067 | -0.132 | 5.56 | 0.15 0.01 | 0.12 0.01 |
| G76.0932+0.1580 | 20:23:23.7140 | +37:35:35.558 | -0.202 | -0.126 | -6.32 | 0.14 0.01 | 0.12 0.01 |
| G76.0932+0.1580 | 20:23:23.7140 | +37:35:35.558 | 0.015 | -0.005 | 4.66 | 0.15 0.00 | 0.18 0.01 |
| G76.0932+0.1580 | 20:23:23.7140 | +37:35:35.558 | -0.143 | 0.135 | 5.02 | 0.10 0.01 | 0.12 0.01 |
| G76.0932+0.1580 | 20:23:23.7140 | +37:35:35.558 | -0.172 | -0.183 | 5.74 | 0.11 0.01 | 0.11 0.01 |
| G76.8437+0.1233 | 20:25:43.7657 | +38:11:12.734 | 0.000 | 0.000 | -5.42 | 0.17 0.00 | 0.17 0.01 |
| G76.8437+0.1233 | 20:25:43.7657 | +38:11:12.734 | 0.082 | 0.079 | -5.24 | 0.15 0.00 | 0.18 0.01 |
| G76.8437+0.1233 | 20:25:43.7657 | +38:11:12.734 | 0.110 | 0.156 | -5.60 | 0.07 0.00 | 0.06 0.01 |
| G78.8870+0.7087 | 20:29:24.9436 | +40:11:19.626 | 0.000 | 0.000 | -7.04 | 0.10 0.01 | 0.19 0.03 |
| G78.8870+0.7087 | 20:29:24.9436 | +40:11:19.626 | -0.054 | -0.160 | -7.22 | 0.09 0.01 | 0.11 0.01 |
| G78.8870+0.7087 | 20:29:24.9436 | +40:11:19.626 | 0.170 | -0.404 | -7.40 | 0.09 0.01 | 0.09 0.01 |
| G78.9690+0.5410 | 20:30:22.6762 | +40:09:23.348 | 0.000 | 0.000 | 4.84 | 1.25 0.01 | 1.28 0.02 |
| G78.9690+0.5410 | 20:30:22.6762 | +40:09:23.348 | -0.008 | -0.063 | 4.66 | 1.07 0.00 | 1.08 0.01 |
| G78.9690+0.5410 | 20:30:22.6762 | +40:09:23.348 | 0.035 | -0.014 | 4.48 | 0.95 0.01 | 1.02 0.01 |
| G78.9690+0.5410 | 20:30:22.6762 | +40:09:23.348 | 0.063 | -0.019 | 5.02 | 0.88 0.01 | 0.94 0.01 |
| G78.9690+0.5410 | 20:30:22.6762 | +40:09:23.348 | 0.025 | -0.131 | 4.30 | 0.57 0.01 | 0.61 0.01 |
| G78.9690+0.5410 | 20:30:22.6762 | +40:09:23.348 | 0.021 | 0.038 | 5.20 | 0.21 0.01 | 0.21 0.01 |
| G78.9690+0.5410 | 20:30:22.6762 | +40:09:23.348 | -0.098 | -0.019 | 4.12 | 0.12 0.00 | 0.10 0.00 |
| G78.9690+0.5410 | 20:30:22.6762 | +40:09:23.348 | 0.181 | -0.099 | 5.38 | 0.10 0.00 | 0.09 0.01 |
| G78.9884+0.2211 | 20:31:47.3082 | +39:58:59.903 | 0.000 | 0.000 | -68.96 | 0.25 0.01 | 0.30 0.01 |
| G78.9884+0.2211 | 20:31:47.3082 | +39:58:59.903 | -0.224 | 0.096 | -66.44 | 0.20 0.00 | 0.16 0.01 |
| G78.9884+0.2211 | 20:31:47.3082 | +39:58:59.903 | -0.028 | -0.103 | -66.26 | 0.21 0.01 | 0.30 0.02 |
| G78.9884+0.2211 | 20:31:47.3082 | +39:58:59.903 | -0.564 | 0.122 | -68.78 | 0.22 0.01 | 0.34 0.03 |
| G79.7358+0.9904 | 20:30:50.6680 | +41:02:27.403 | 0.000 | 0.000 | -5.42 | 22.96 0.21 | 23.81 0.39 |
| G79.7358+0.9904 | 20:30:50.6680 | +41:02:27.403 | -0.029 | -0.001 | -5.60 | 21.87 0.24 | 22.88 0.44 |
| G79.7358+0.9904 | 20:30:50.6680 | +41:02:27.403 | -0.028 | -0.009 | -5.78 | 11.84 0.16 | 12.70 0.30 |
| G79.7358+0.9904 | 20:30:50.6680 | +41:02:27.403 | -0.007 | -0.016 | -5.24 | 7.38 0.09 | 7.85 0.17 |
| G79.7358+0.9904 | 20:30:50.6680 | +41:02:27.403 | -0.047 | -0.001 | -5.96 | 5.62 0.08 | 5.79 0.15 |
| G79.7358+0.9904 | 20:30:50.6680 | +41:02:27.403 | 0.055 | -0.010 | -3.98 | 5.88 0.09 | 6.11 0.15 |
| G79.7358+0.9904 | 20:30:50.6680 | +41:02:27.403 | 0.045 | -0.039 | -3.26 | 4.97 0.06 | 5.07 0.12 |
| G79.7358+0.9904 | 20:30:50.6680 | +41:02:27.403 | 0.074 | -0.022 | -3.08 | 4.62 0.09 | 4.81 0.17 |
| G79.7358+0.9904 | 20:30:50.6680 | +41:02:27.403 | -0.010 | -0.015 | -3.80 | 2.86 0.06 | 2.88 0.11 |
| G79.7358+0.9904 | 20:30:50.6680 | +41:02:27.403 | 0.088 | -0.026 | -3.62 | 2.34 0.05 | 2.41 0.10 |
| G79.7358+0.9904 | 20:30:50.6680 | +41:02:27.403 | -0.013 | 0.004 | -6.14 | 2.26 0.04 | 2.35 0.08 |
| G79.7358+0.9904 | 20:30:50.6680 | +41:02:27.403 | 0.180 | 0.021 | -4.88 | 0.95 0.04 | 1.03 0.07 |
| G79.7358+0.9904 | 20:30:50.6680 | +41:02:27.403 | 0.018 | 0.020 | -6.32 | 0.90 0.04 | 0.93 0.07 |
| G79.7358+0.9904 | 20:30:50.6680 | +41:02:27.403 | 0.062 | 0.002 | -4.70 | 0.86 0.03 | 0.82 0.05 |
| G79.7358+0.9904 | 20:30:50.6680 | +41:02:27.403 | 0.012 | -0.054 | -4.16 | 0.68 0.06 | 0.74 0.10 |
| G79.7358+0.9904 | 20:30:50.6680 | +41:02:27.403 | -0.132 | -0.111 | -5.06 | 0.39 0.05 | 0.55 0.10 |
| G79.7358+0.9904 | 20:30:50.6680 | +41:02:27.403 | -0.250 | -0.031 | -4.52 | 0.37 0.02 | 0.33 0.03 |
| G79.7358+0.9904 | 20:30:50.6680 | +41:02:27.403 | -0.070 | 0.017 | -4.34 | 0.14 0.01 | 0.10 0.01 |
| G80.8617+0.3834 | 20:37:00.9571 | +41:34:55.606 | 0.000 | 0.000 | -3.98 | 4.61 0.11 | 5.02 0.21 |
| G80.8617+0.3834 | 20:37:00.9571 | +41:34:55.606 | -0.003 | 0.001 | -4.16 | 4.10 0.12 | 4.55 0.24 |
| G80.8617+0.3834 | 20:37:00.9571 | +41:34:55.606 | -0.029 | 0.331 | -2.00 | 1.56 0.06 | 1.77 0.12 |
| G80.8617+0.3834 | 20:37:00.9571 | +41:34:55.606 | 0.153 | -0.035 | -4.34 | 1.24 0.07 | 1.42 0.14 |
| G80.8617+0.3834 | 20:37:00.9571 | +41:34:55.606 | -0.000 | 0.320 | -2.18 | 0.89 0.06 | 1.02 0.11 |
| G80.8617+0.3834 | 20:37:00.9571 | +41:34:55.606 | 0.206 | -0.093 | -4.52 | 0.61 0.06 | 0.81 0.13 |
| G80.8617+0.3834 | 20:37:00.9571 | +41:34:55.606 | 0.603 | 0.044 | -3.44 | 0.14 0.04 | 0.61 0.20 |
| G80.8617+0.3834 | 20:37:00.9571 | +41:34:55.606 | -0.095 | 0.204 | -3.62 | 0.23 0.02 | 0.26 0.04 |
| G81.7219+0.5711 | 20:39:01.0501 | +42:22:49.124 | 0.000 | 0.000 | -2.72 | 4.07 0.05 | 4.30 0.10 |
| G81.7219+0.5711 | 20:39:01.0501 | +42:22:49.124 | 0.202 | 0.048 | -3.08 | 2.72 0.05 | 3.12 0.10 |
| G81.7219+0.5711 | 20:39:01.0501 | +42:22:49.124 | 0.216 | 0.044 | -3.26 | 2.19 0.04 | 2.49 0.07 |
| G81.7219+0.5711 | 20:39:01.0501 | +42:22:49.124 | 0.098 | 0.034 | -2.90 | 2.36 0.04 | 2.54 0.07 |
| G81.7219+0.5711 | 20:39:01.0501 | +42:22:49.124 | -0.325 | -0.133 | -3.80 | 1.30 0.03 | 1.43 0.05 |
| G81.7219+0.5711 | 20:39:01.0501 | +42:22:49.124 | -0.023 | 0.025 | -2.54 | 1.60 0.04 | 1.79 0.07 |
| G81.7219+0.5711 | 20:39:01.0501 | +42:22:49.124 | -1.163 | -0.226 | 8.98 | 1.22 0.03 | 1.25 0.06 |
| G81.7219+0.5711 | 20:39:01.0501 | +42:22:49.124 | 0.187 | 0.073 | -3.44 | 0.89 0.02 | 1.03 0.05 |
| G81.7219+0.5711 | 20:39:01.0501 | +42:22:49.124 | -0.433 | -0.126 | -3.98 | 0.88 0.02 | 0.87 0.04 |
| G81.7219+0.5711 | 20:39:01.0501 | +42:22:49.124 | -1.240 | -0.223 | 8.80 | 0.68 0.03 | 0.70 0.05 |
| G81.7219+0.5711 | 20:39:01.0501 | +42:22:49.124 | -0.320 | -0.141 | -3.62 | 0.55 0.04 | 0.63 0.07 |
| G81.7219+0.5711 | 20:39:01.0501 | +42:22:49.124 | -1.305 | -0.011 | 9.16 | 0.18 0.02 | 0.33 0.06 |
| G81.7219+0.5711 | 20:39:01.0501 | +42:22:49.124 | -0.467 | -0.105 | -4.16 | 0.15 0.01 | 0.12 0.01 |
| G81.7219+0.5711 | 20:39:01.0501 | +42:22:49.124 | -1.415 | -0.087 | 9.34 | 0.13 0.01 | 0.13 0.01 |
| G81.7444+0.5910 | 20:39:00.3722 | +42:24:37.089 | 0.000 | 0.000 | 4.48 | 17.18 0.12 | 17.88 0.22 |
| G81.7444+0.5910 | 20:39:00.3722 | +42:24:37.089 | 0.002 | 0.010 | 4.66 | 11.57 0.09 | 11.89 0.17 |
| G81.7444+0.5910 | 20:39:00.3722 | +42:24:37.089 | 0.015 | 0.020 | 3.58 | 6.58 0.08 | 6.61 0.14 |
| G81.7444+0.5910 | 20:39:00.3722 | +42:24:37.089 | 0.006 | 0.002 | 3.76 | 5.37 0.07 | 5.42 0.12 |
| G81.7444+0.5910 | 20:39:00.3722 | +42:24:37.089 | -0.025 | 0.004 | 3.94 | 2.89 0.05 | 3.00 0.09 |
| G81.7444+0.5910 | 20:39:00.3722 | +42:24:37.089 | -0.045 | 0.015 | 3.40 | 2.52 0.04 | 2.56 0.08 |
| G81.7444+0.5910 | 20:39:00.3722 | +42:24:37.089 | -0.027 | -0.039 | 4.30 | 2.00 0.03 | 1.92 0.06 |
| G81.7444+0.5910 | 20:39:00.3722 | +42:24:37.089 | -0.001 | 0.044 | 4.12 | 1.72 0.04 | 1.73 0.07 |
| G81.7444+0.5910 | 20:39:00.3722 | +42:24:37.089 | -0.074 | 0.049 | 3.22 | 1.50 0.03 | 1.54 0.06 |
| G81.7444+0.5910 | 20:39:00.3722 | +42:24:37.089 | -0.030 | 0.009 | 3.04 | 1.20 0.03 | 1.25 0.05 |
| G81.7444+0.5910 | 20:39:00.3722 | +42:24:37.089 | -0.005 | -0.089 | 5.02 | 0.27 0.03 | 0.35 0.05 |
| G81.7444+0.5910 | 20:39:00.3722 | +42:24:37.089 | 0.073 | -0.040 | 5.38 | 0.17 0.01 | 0.12 0.01 |
| G81.7523+0.5908 | 20:39:01.9870 | +42:24:59.261 | 0.000 | 0.000 | -8.66 | 15.19 0.10 | 15.67 0.19 |
| G81.7523+0.5908 | 20:39:01.9870 | +42:24:59.261 | 0.030 | 0.010 | -8.48 | 11.28 0.09 | 11.62 0.17 |
| G81.7523+0.5908 | 20:39:01.9870 | +42:24:59.261 | -0.014 | -0.140 | -5.78 | 7.93 0.07 | 8.12 0.13 |
| G81.7523+0.5908 | 20:39:01.9870 | +42:24:59.261 | 0.018 | -0.141 | -5.96 | 5.47 0.06 | 5.63 0.11 |
| G81.7523+0.5908 | 20:39:01.9870 | +42:24:59.261 | -0.036 | -0.107 | -6.86 | 4.29 0.04 | 4.37 0.08 |
| G81.7523+0.5908 | 20:39:01.9870 | +42:24:59.261 | 0.005 | 0.003 | -8.30 | 5.21 0.06 | 5.52 0.10 |
| G81.7523+0.5908 | 20:39:01.9870 | +42:24:59.261 | 0.020 | 0.021 | -8.12 | 4.44 0.04 | 4.65 0.08 |
| G81.7523+0.5908 | 20:39:01.9870 | +42:24:59.261 | 0.053 | -0.127 | -5.60 | 2.52 0.04 | 2.65 0.07 |
| G81.7523+0.5908 | 20:39:01.9870 | +42:24:59.261 | 0.009 | -0.110 | -6.68 | 2.56 0.03 | 2.65 0.05 |
| G81.7523+0.5908 | 20:39:01.9870 | +42:24:59.261 | -0.022 | -0.111 | -6.32 | 1.88 0.03 | 1.97 0.06 |
| G81.7523+0.5908 | 20:39:01.9870 | +42:24:59.261 | 0.002 | -0.094 | -7.04 | 1.97 0.03 | 2.06 0.05 |
| G81.7523+0.5908 | 20:39:01.9870 | +42:24:59.261 | -0.038 | -0.125 | -5.42 | 1.72 0.03 | 1.83 0.05 |
| G81.7523+0.5908 | 20:39:01.9870 | +42:24:59.261 | -0.020 | -0.020 | -8.84 | 1.81 0.04 | 1.91 0.07 |
| G81.7523+0.5908 | 20:39:01.9870 | +42:24:59.261 | -0.020 | -0.112 | -6.50 | 1.58 0.03 | 1.69 0.06 |
| G81.7523+0.5908 | 20:39:01.9870 | +42:24:59.261 | 0.123 | -0.300 | -2.36 | 1.33 0.03 | 1.45 0.06 |
| G81.7523+0.5908 | 20:39:01.9870 | +42:24:59.261 | 0.023 | 0.001 | -9.02 | 1.15 0.02 | 1.17 0.04 |
| G81.7523+0.5908 | 20:39:01.9870 | +42:24:59.261 | 0.074 | -0.363 | -2.90 | 1.52 0.03 | 1.70 0.07 |
| G81.7523+0.5908 | 20:39:01.9870 | +42:24:59.261 | -0.037 | -0.018 | -9.20 | 0.77 0.02 | 0.89 0.04 |
| G81.7523+0.5908 | 20:39:01.9870 | +42:24:59.261 | 0.035 | -0.124 | -5.24 | 0.66 0.02 | 0.70 0.04 |
| G81.7523+0.5908 | 20:39:01.9870 | +42:24:59.261 | -0.014 | -0.374 | -3.26 | 0.99 0.04 | 1.19 0.09 |
| G81.7523+0.5908 | 20:39:01.9870 | +42:24:59.261 | -0.055 | -0.090 | -7.22 | 0.50 0.02 | 0.56 0.04 |
| G81.7523+0.5908 | 20:39:01.9870 | +42:24:59.261 | -0.094 | -0.431 | -3.08 | 0.73 0.04 | 0.86 0.07 |
| G81.7523+0.5908 | 20:39:01.9870 | +42:24:59.261 | 0.110 | -0.365 | -2.72 | 0.78 0.05 | 1.03 0.10 |
| G81.7523+0.5908 | 20:39:01.9870 | +42:24:59.261 | 0.022 | -0.188 | -2.18 | 0.27 0.02 | 0.34 0.04 |
| G81.7523+0.5908 | 20:39:01.9870 | +42:24:59.261 | 0.113 | -0.051 | -6.14 | 0.28 0.02 | 0.34 0.04 |
| G81.7523+0.5908 | 20:39:01.9870 | +42:24:59.261 | 0.075 | 0.009 | -2.54 | 0.22 0.04 | 0.52 0.11 |
| G81.7523+0.5908 | 20:39:01.9870 | +42:24:59.261 | -0.106 | 0.155 | -9.38 | 0.12 0.02 | 0.34 0.08 |
| G81.7523+0.5908 | 20:39:01.9870 | +42:24:59.261 | -0.013 | -0.173 | -5.06 | 0.14 0.02 | 0.19 0.03 |
| G81.7523+0.5908 | 20:39:01.9870 | +42:24:59.261 | -0.062 | 0.090 | -7.40 | 0.10 0.00 | 0.15 0.01 |
| G81.7523+0.5908 | 20:39:01.9870 | +42:24:59.261 | 0.059 | 0.013 | -7.76 | 0.09 0.00 | 0.11 0.01 |
| G81.7655+0.5972 | 20:39:02.9329 | +42:25:50.954 | 0.000 | 0.000 | -1.28 | 3.90 0.05 | 4.09 0.09 |
| G81.7655+0.5972 | 20:39:02.9329 | +42:25:50.954 | -0.037 | 0.017 | -1.46 | 2.38 0.03 | 2.49 0.06 |
| G81.7655+0.5972 | 20:39:02.9329 | +42:25:50.954 | -0.009 | -0.003 | -1.10 | 1.32 0.03 | 1.49 0.06 |
| G81.7655+0.5972 | 20:39:02.9329 | +42:25:50.954 | 0.015 | 0.061 | -1.64 | 0.45 0.04 | 0.70 0.09 |
| G81.7655+0.5972 | 20:39:02.9329 | +42:25:50.954 | 0.171 | -0.057 | -1.82 | 0.16 0.02 | 0.18 0.03 |
| G81.7655+0.5972 | 20:39:02.9329 | +42:25:50.954 | -0.010 | -0.140 | -2.00 | 0.13 0.01 | 0.16 0.03 |
| G81.7655+0.5972 | 20:39:02.9329 | +42:25:50.954 | -0.359 | -0.088 | -0.74 | 0.09 0.01 | 0.07 0.01 |
| G81.7655+0.5972 | 20:39:02.9329 | +42:25:50.954 | -0.085 | 0.039 | -0.92 | 0.08 0.01 | 0.07 0.01 |
| G81.7655+0.5972 | 20:39:02.9329 | +42:25:50.954 | 0.154 | -0.025 | -2.18 | 0.08 0.01 | 0.06 0.01 |
| G81.8713+0.7807 | 20:38:36.4232 | +42:37:34.756 | 0.000 | 0.000 | 7.18 | 336.13 0.96 | 346.76 1.73 |
| G81.8713+0.7807 | 20:38:36.4232 | +42:37:34.756 | -0.176 | 0.425 | 4.66 | 324.83 1.15 | 336.46 2.08 |
| G81.8713+0.7807 | 20:38:36.4232 | +42:37:34.756 | -0.158 | 0.491 | 4.12 | 231.68 0.89 | 238.50 1.61 |
| G81.8713+0.7807 | 20:38:36.4232 | +42:37:34.756 | -0.170 | 0.444 | 4.48 | 238.51 1.07 | 246.98 1.95 |
| G81.8713+0.7807 | 20:38:36.4232 | +42:37:34.756 | -0.021 | 0.018 | 7.36 | 199.40 0.95 | 206.21 1.71 |
| G81.8713+0.7807 | 20:38:36.4232 | +42:37:34.756 | -0.124 | 0.470 | 3.94 | 181.99 0.88 | 188.35 1.59 |
| G81.8713+0.7807 | 20:38:36.4232 | +42:37:34.756 | -0.261 | 0.346 | 5.74 | 126.12 0.76 | 128.52 1.37 |
| G81.8713+0.7807 | 20:38:36.4232 | +42:37:34.756 | -0.241 | 0.352 | 5.20 | 114.47 0.74 | 116.80 1.33 |
| G81.8713+0.7807 | 20:38:36.4232 | +42:37:34.756 | -0.100 | 0.480 | 3.40 | 88.83 0.80 | 90.64 1.43 |
| G81.8713+0.7807 | 20:38:36.4232 | +42:37:34.756 | -0.233 | 0.349 | 5.02 | 89.76 0.83 | 91.29 1.49 |
| G81.8713+0.7807 | 20:38:36.4232 | +42:37:34.756 | -0.101 | 0.474 | 3.58 | 64.76 0.74 | 66.49 1.33 |
| G81.8713+0.7807 | 20:38:36.4232 | +42:37:34.756 | -0.022 | -0.138 | 6.82 | 41.99 0.58 | 45.36 1.08 |
| G81.8713+0.7807 | 20:38:36.4232 | +42:37:34.756 | -0.122 | -0.424 | 9.34 | 31.67 0.61 | 35.80 1.16 |
| G81.8713+0.7807 | 20:38:36.4232 | +42:37:34.756 | -0.309 | 0.381 | 5.56 | 35.79 0.69 | 37.69 1.26 |
| G81.8713+0.7807 | 20:38:36.4232 | +42:37:34.756 | -0.315 | 0.352 | 5.92 | 30.37 0.61 | 31.77 1.12 |
| G81.8713+0.7807 | 20:38:36.4232 | +42:37:34.756 | -0.193 | 0.414 | 4.84 | 45.54 0.76 | 47.59 1.38 |
| G81.8713+0.7807 | 20:38:36.4232 | +42:37:34.756 | -0.113 | -0.435 | 9.52 | 16.86 0.52 | 20.40 1.04 |
| G81.8713+0.7807 | 20:38:36.4232 | +42:37:34.756 | -0.229 | 0.347 | 5.38 | 25.80 0.64 | 28.06 1.19 |
| G81.8713+0.7807 | 20:38:36.4232 | +42:37:34.756 | -0.199 | 0.444 | 3.76 | 20.97 0.46 | 22.90 0.87 |
| G81.8713+0.7807 | 20:38:36.4232 | +42:37:34.756 | -0.076 | 0.000 | 7.72 | 6.08 0.37 | 8.11 0.79 |
| G81.8713+0.7807 | 20:38:36.4232 | +42:37:34.756 | -0.130 | 0.442 | 3.22 | 10.31 0.44 | 12.30 0.88 |
| G81.8713+0.7807 | 20:38:36.4232 | +42:37:34.756 | -0.172 | -0.060 | 6.46 | 2.47 0.26 | 4.53 0.70 |
| G81.8713+0.7807 | 20:38:36.4232 | +42:37:34.756 | 0.044 | -0.287 | 9.16 | 2.89 0.32 | 6.33 0.97 |
| G81.8713+0.7807 | 20:38:36.4232 | +42:37:34.756 | -0.025 | -0.349 | 8.80 | 0.93 0.12 | 2.03 0.36 |
| G81.8713+0.7807 | 20:38:36.4232 | +42:37:34.756 | -0.100 | -0.261 | 7.00 | 7.90 0.62 | 9.60 1.22 |
| G81.8713+0.7807 | 20:38:36.4232 | +42:37:34.756 | -0.099 | -0.366 | 8.98 | 2.15 0.24 | 4.27 0.69 |
| G81.8713+0.7807 | 20:38:36.4232 | +42:37:34.756 | -0.174 | 0.410 | 2.86 | 0.79 0.10 | 1.88 0.31 |
| G81.8713+0.7807 | 20:38:36.4232 | +42:37:34.756 | 0.130 | -0.086 | 9.70 | 0.90 0.10 | 2.19 0.35 |
| G81.8713+0.7807 | 20:38:36.4232 | +42:37:34.756 | -0.566 | 0.371 | 6.28 | 1.00 0.10 | 1.46 0.24 |
| G81.8713+0.7807 | 20:38:36.4232 | +42:37:34.756 | -0.426 | 0.400 | 4.30 | 7.97 0.52 | 9.50 1.04 |
| G81.8713+0.7807 | 20:38:36.4232 | +42:37:34.756 | -0.387 | -0.150 | 6.64 | 1.72 0.25 | 3.76 0.77 |
| G81.8713+0.7807 | 20:38:36.4232 | +42:37:34.756 | -0.021 | 0.108 | 8.08 | 0.60 0.09 | 1.17 0.26 |
| G81.8713+0.7807 | 20:38:36.4232 | +42:37:34.756 | -0.019 | -0.017 | 6.10 | 0.85 0.15 | 1.95 0.48 |
| G81.8713+0.7807 | 20:38:36.4232 | +42:37:34.756 | -0.053 | -0.448 | 8.62 | 0.52 0.06 | 0.92 0.17 |
| G81.8713+0.7807 | 20:38:36.4232 | +42:37:34.756 | 0.113 | -0.042 | 8.44 | 0.27 0.05 | 0.71 0.18 |
| G81.8713+0.7807 | 20:38:36.4232 | +42:37:34.756 | 0.081 | -0.498 | 9.88 | 0.27 0.04 | 0.48 0.10 |
| G81.8713+0.7807 | 20:38:36.4232 | +42:37:34.756 | 0.127 | 0.048 | 10.42 | 0.27 0.04 | 0.69 0.14 |
| G81.8713+0.7807 | 20:38:36.4232 | +42:37:34.756 | -0.213 | 0.344 | 2.50 | 0.26 0.03 | 0.64 0.11 |
| G81.8713+0.7807 | 20:38:36.4232 | +42:37:34.756 | 0.066 | -0.038 | 10.06 | 0.23 0.03 | 0.67 0.12 |
| G81.8713+0.7807 | 20:38:36.4232 | +42:37:34.756 | -0.574 | 0.603 | 2.68 | 0.14 0.03 | 0.28 0.07 |
| G82.3079+0.7296 | 20:40:16.6487 | +42:56:29.288 | 0.000 | 0.000 | 10.42 | 23.82 0.18 | 24.19 0.31 |
| G82.3079+0.7296 | 20:40:16.6487 | +42:56:29.288 | 0.027 | 0.006 | 10.24 | 15.28 0.13 | 15.85 0.23 |
| G82.3079+0.7296 | 20:40:16.6487 | +42:56:29.288 | 0.006 | 0.001 | 10.78 | 6.38 0.07 | 6.46 0.12 |
| G82.3079+0.7296 | 20:40:16.6487 | +42:56:29.288 | -0.079 | -0.048 | 10.60 | 4.47 0.05 | 4.54 0.09 |
| G82.3079+0.7296 | 20:40:16.6487 | +42:56:29.288 | 0.072 | 0.006 | 9.88 | 1.27 0.03 | 1.30 0.05 |
| G82.3079+0.7296 | 20:40:16.6487 | +42:56:29.288 | -0.042 | -0.021 | 11.14 | 1.04 0.04 | 1.27 0.07 |
| G82.3079+0.7296 | 20:40:16.6487 | +42:56:29.288 | 0.212 | -0.053 | 9.52 | 0.24 0.03 | 0.39 0.08 |
| Notes. The position uncertainties are and in RA and Dec., respectively (see Sect. 3). | |||||||
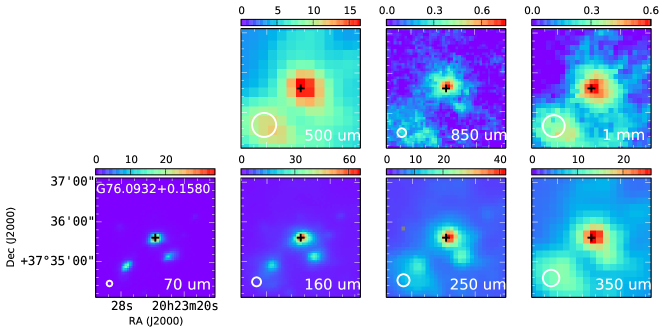
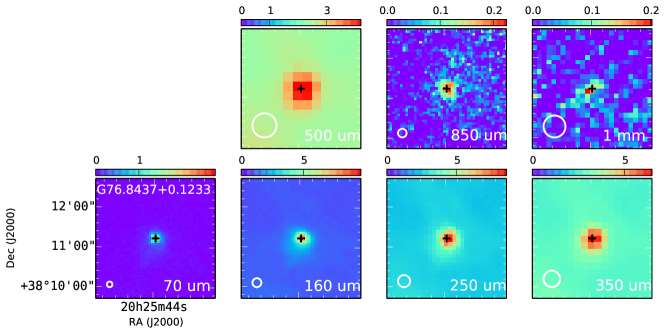
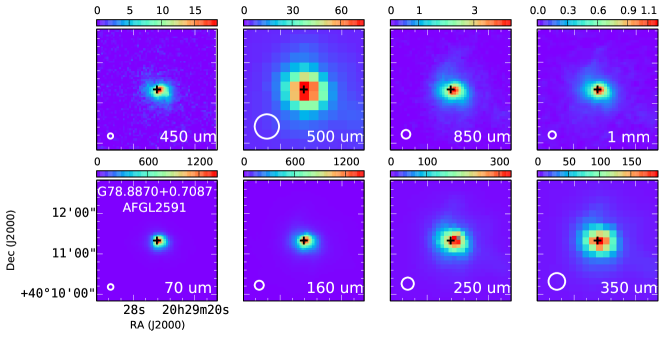
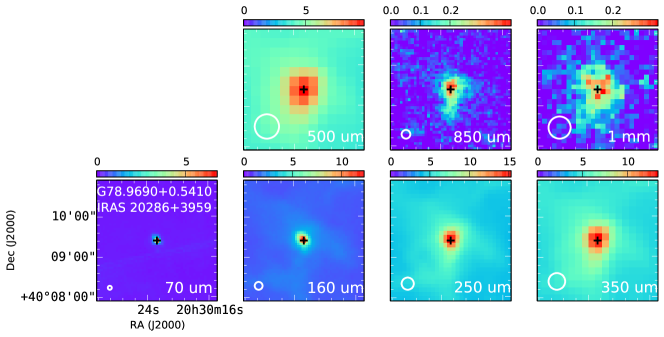
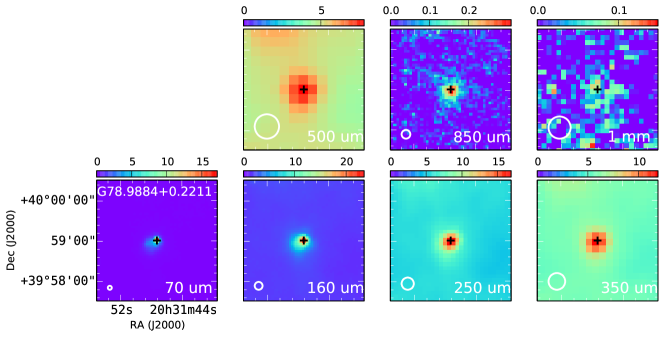
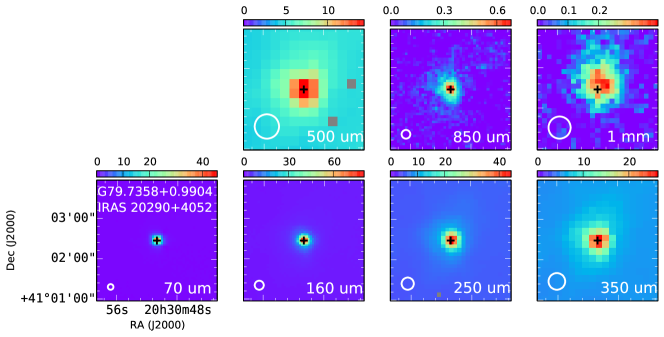
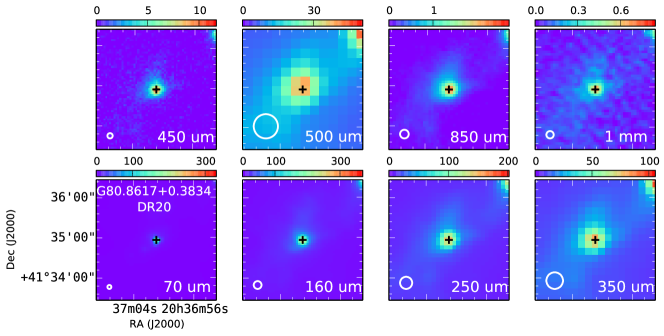
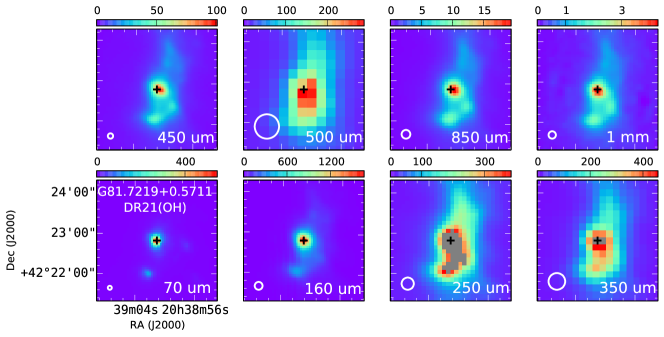
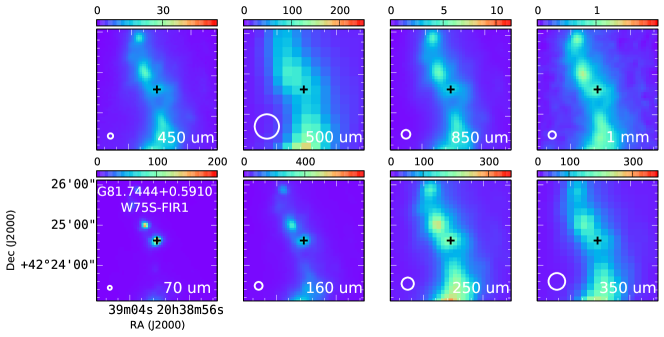
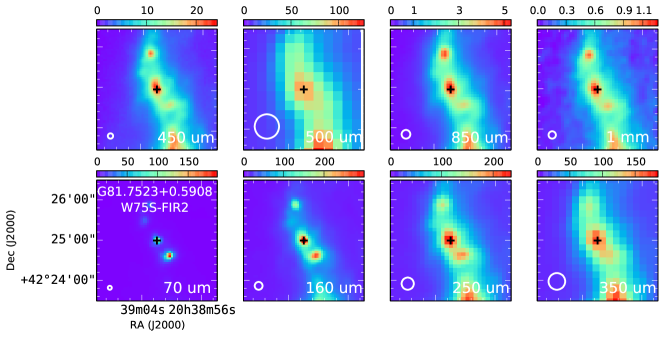
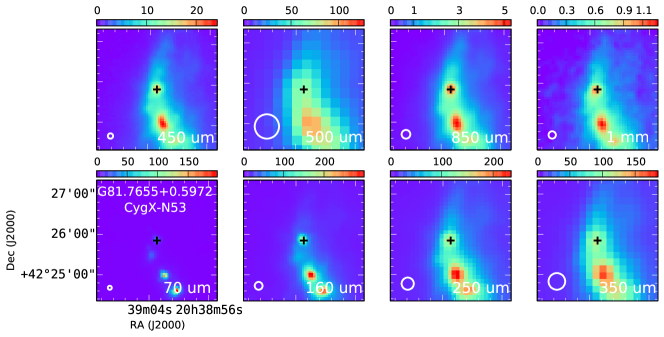
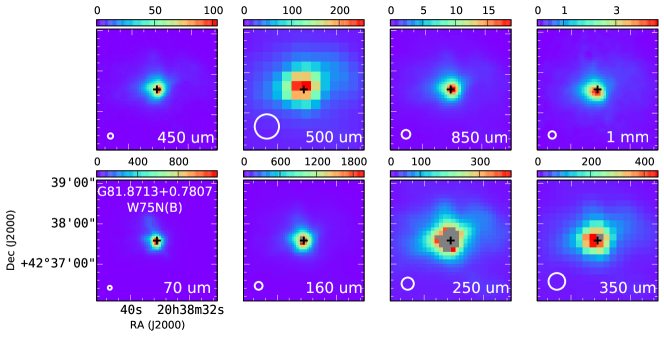
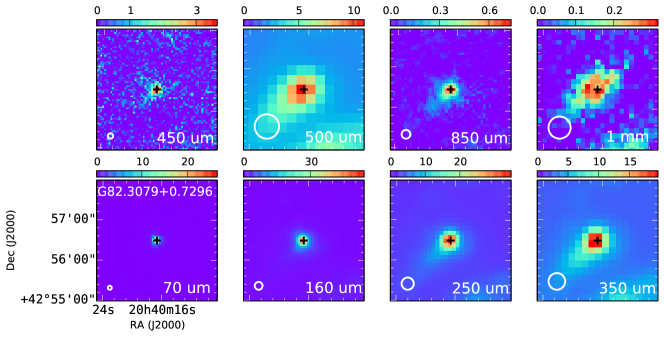
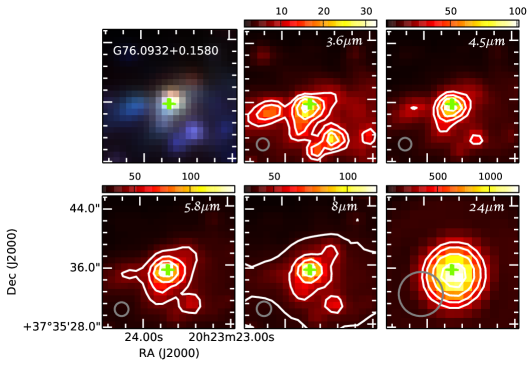
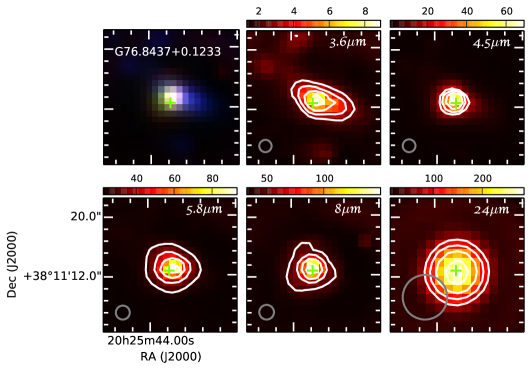
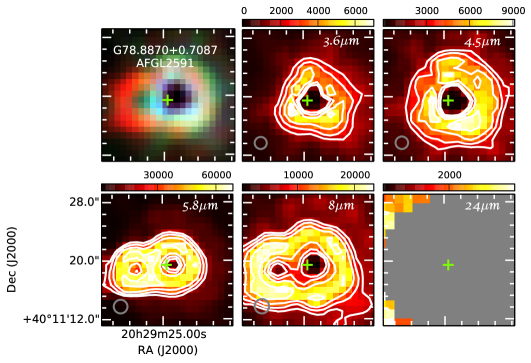

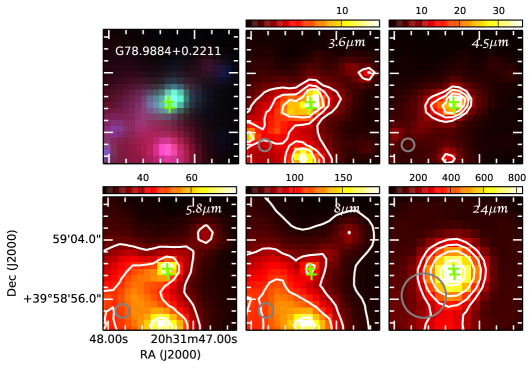
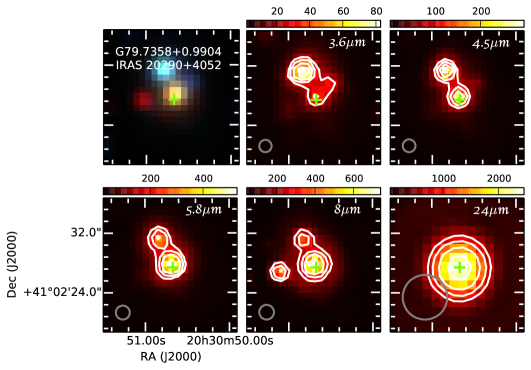
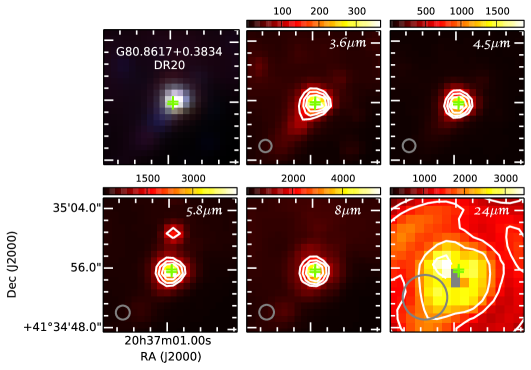
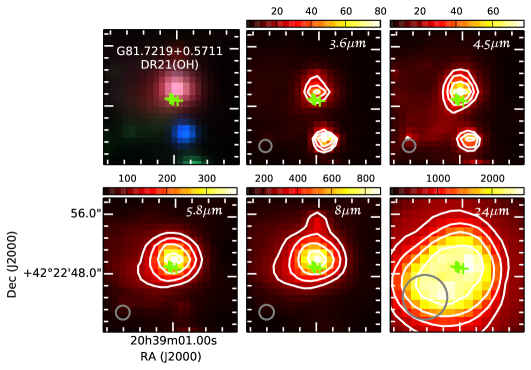
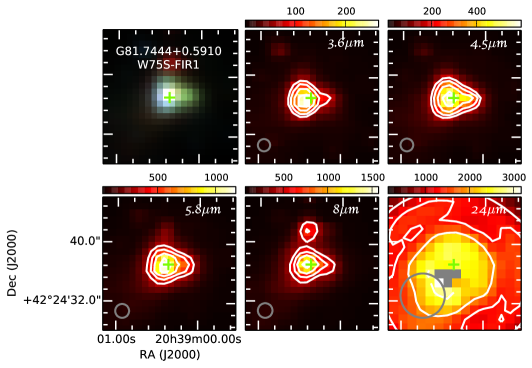
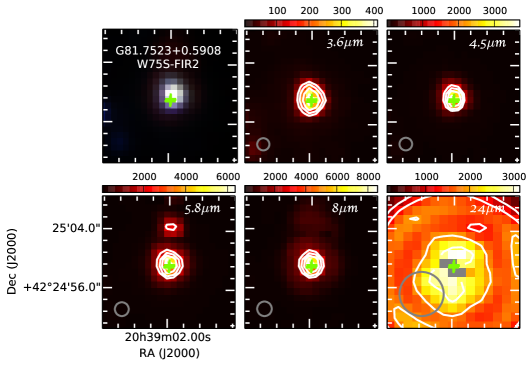

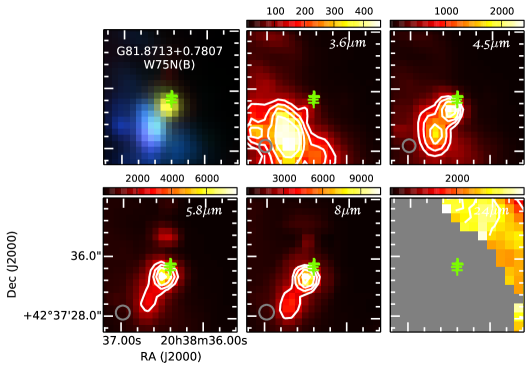
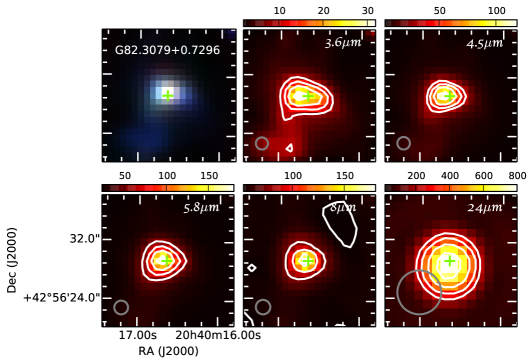
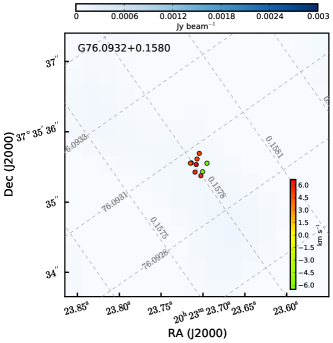
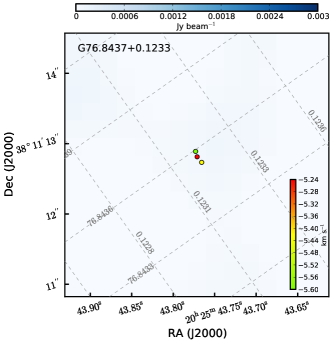
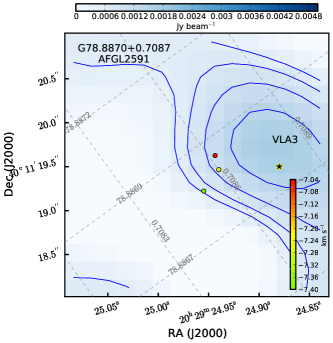
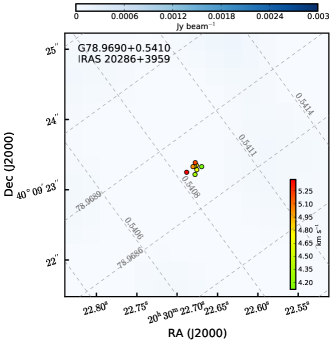
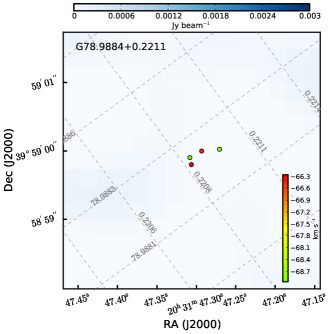
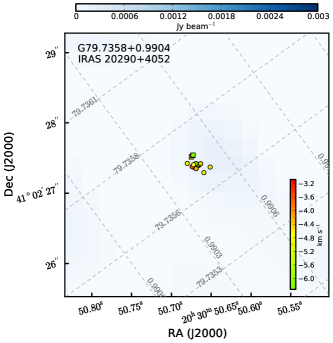
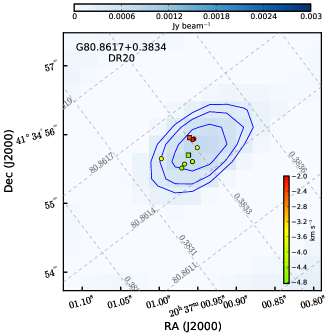
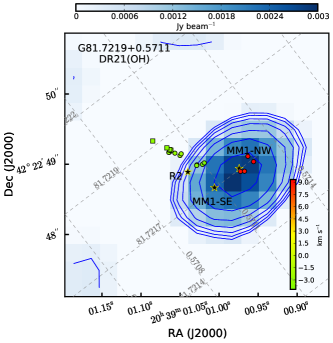
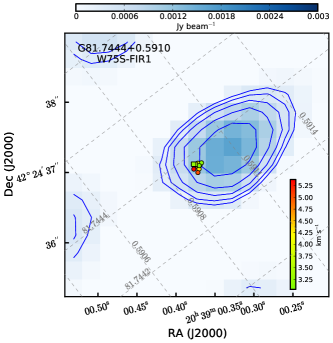
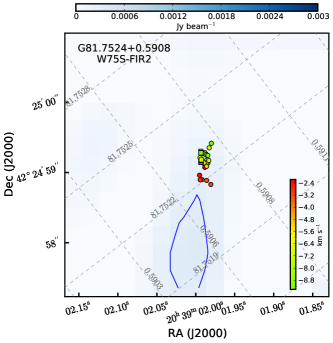
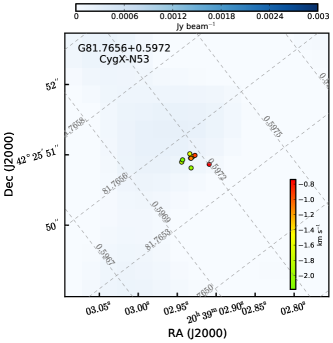
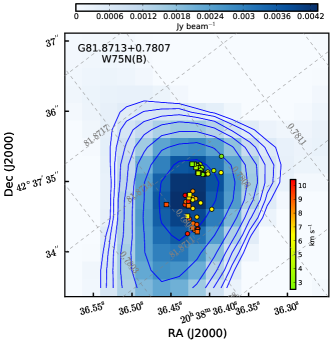
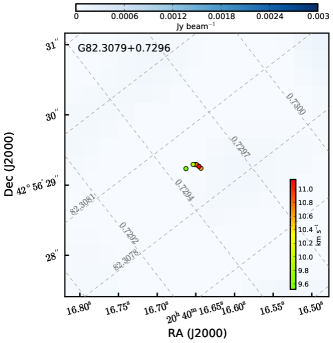
Appendix B SED fitting
Figure B.1 displays the SED fitting of the dust cores that host maser emission.
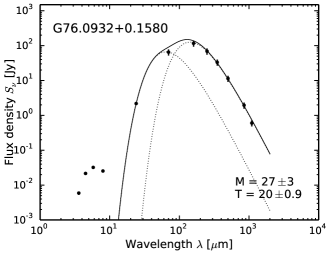
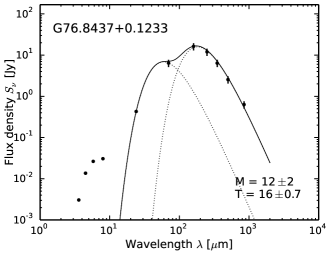
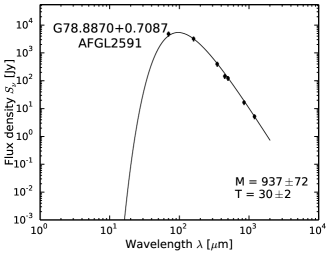
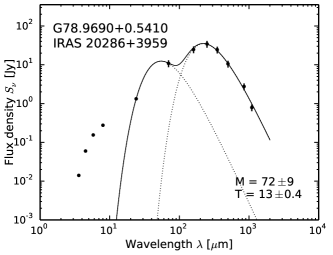
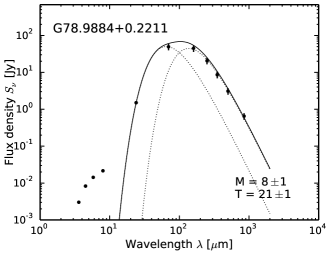
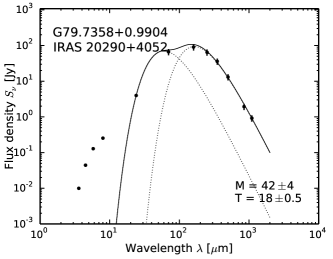
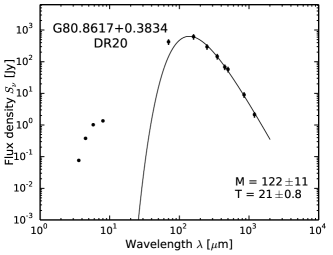
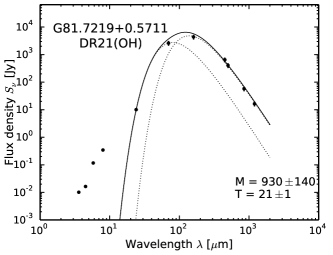
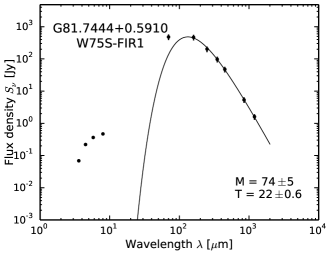
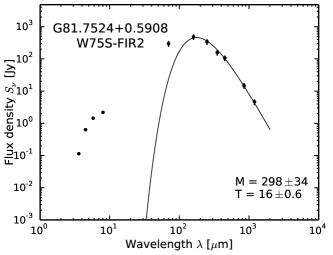

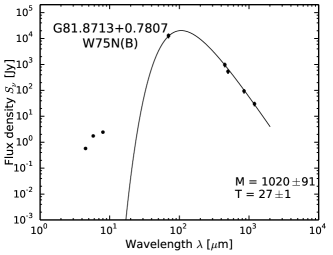

Appendix C Previously detected masers
Methanol masers at 6.7 GHz detected in previous surveys by Hu et al. (2016) and Yang et al. (2019) are listed in Table 8.
| RA | Dec. | Name | ||
| (km s-1) | (Jy beam-1) | |||
| 20 29 24.937 | +40 11 19.29 | G078.886+0.708 | -7.02 | 0.54 |
| 20 30 50.685 | +41 02 27.50 | G079.735+0.990 | -5.44 | 23.17 |
| -3.86 | 5.00 | |||
| -3.16 | 1.91 | |||
| 20 37 00.980 | +41 34 55.05 | G080.861+0.383 | -11.06 | 2.53 |
| -4.04 | 8.52 | |||
| -1.93 | 1.17 | |||
| 20 39 00.879 | +42 22 48.93 | G081.721+0.571 | -3.51 | 0.86 |
| -2.63 | 2.96 | |||
| 20 39 00.378 | +42 24 36.92 | G081.744+0.590 | 3.86 | 3.82 |
| 4.57 | 5.53 | |||
| 20 39 01.573 | +42 24 59.09 | G081.752+0.590 | -8.60 | 8.35 |
| -6.67 | 3.43 | |||
| -5.80 | 3.87 | |||
| -2.81 | 1.51 | |||
| -2.28 | 0.90 | |||
| 20 39 02.274 | +42 25 50.81 | G081.765+0.597 | -1.23 | 2.54 |
| 20 38 36.423 | +42 37 35.01 | G081.871+0.780 | 3.51 | 42.91 |
| 4.04 | 99.94 | |||
| 4.74 | 166.73 | |||
| 5.27 | 76.09 | |||
| 5.80 | 67.27 | |||
| 7.20 | 174.93 | |||
| 9.48 | 17.48 | |||
| , | ||||
| (km s-1) | (Jy) | |||
| 20 23 23.65 | +37 35 34.3 | G76.093+0.158 | 4.92 (4.27, 6.90) | 0.49 |
| 20 29 20.35 | +40 11 37.5 | G78.882+0.723 | -6.94 (-7.41, -6.51) | 0.95 |
| 20 30 22.77 | +40 09 23.2 | G78.969+0.541 | 4.74 (4.01, 5.48) | 1.24 |
| 20 30 50.70 | +41 02 28.8 | G79.736+0.991 | -5.51 (-6.63, -2.84) | 19.4 |
| 20 37 01.02 | +41 34 56.9 | G80.862+0.383 | -4.01 (-4.57, -1.77) | 9.67 |
| 20 39 02.01 | +42 24 59.3 | G81.752+0.591 | -8.57 (-9.39, 5.04) | 15.4 |
| 20 37 47.39 | +42 38 39.0 | G81.794+0.911a𝑎aa𝑎aNot detected in GLOSTAR. | 7.19 (-4.73, 7.54) | 0.59 |
| 20 38 36.67 | +42 37 30.6 | G81.871+0.779 | 4.53 (2.55, 9.87) | 225.7 |
| 20 40 16.72 | +42 56 28.6 | G82.308+0.729 | 10.3 (10.0, 11.3) | 58.4 |
Appendix D Methanol absorption toward DR21
Based on our absorption spectrum, we now constrain the methanol abundance in DR21 M. In local thermodynamic equilibrium (LTE), the column density in a spectral line’s lower energy level is given by the line’s observed optical depth, , integrated over the line profile,
| (5) |
from which the total column density of the molecule, , can be calculated:
| (6) |
Here, , , and are the Planck constant, the Boltzmann constant, and the speed of light, respectively, and and are the degeneracies of the line’s lower and upper energy levels, respectively ( and ); is the partition function, and is the energy above ground state of the lower energy level (48.7 K). Integrating our absorption spectrum from to km s-1, we determine an integrated optical depth of 0.47 km s-1.
By definition, under LTE, the excitation temperature and rotation temperature of the line are the same and are also equal to the kinetic temperature, . A question then arises as to the appropriate temperature for the calculation of the methanol column density.
Modeling a variety of radio-wavelength OH absorption lines, Jones et al. (1994) derived an H2 density of cm-3 and a kinetic temperature of 175 K for the part of DR21 M’s dense molecular core from which the OH-bearing gas originates, namely the dense PDR interface with the compact HII region (see Sect. 4.5). These numbers might not be representative of the more extended condensation that gives rise to the methanol absorption.
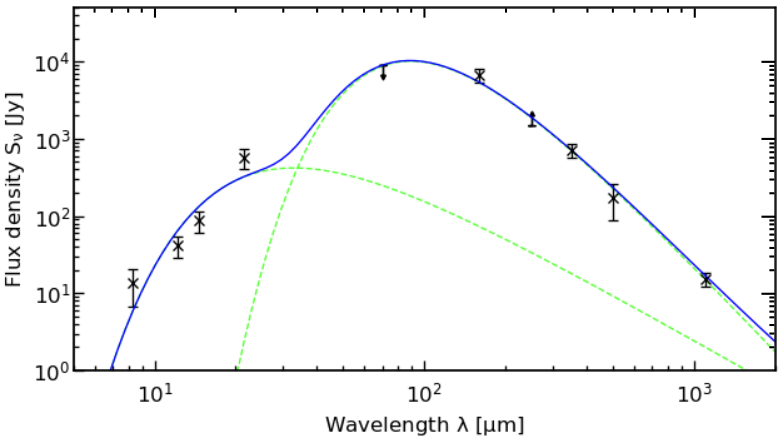
Therefore, we characterized the molecular gas associated with DR21 M by fitting its dust SED (Fig. D.1) obtained through aperture photometry of mid-infrared to submillimeter continuum maps to derive its temperature, source size, H2 column, and volume density.
Using the same procedures as described in König et al. (2021), we determined the flux densities from Herschel/Hi-GAL (Molinari et al. 2010) and MSX (Price et al. 2001) continuum maps in nine bands using an aperture-annulus approach. As the 160 m PACS band and the D-configuration maps of methanol have similar beam widths (i.e., and 13′′, respectively), we estimated the source size (i.e., the ) through a two-dimensional Gaussian fit to the emission in the 160 m PACS band centered on the peak of the emission. The same position, aperture, and annulus sizes were subsequently used for all bands to measure the source and background flux, from which the background corrected source flux was calculated. The resulting SED was then fit with a two-component model consisting of a blackbody for the warm emission originating from the evolving star and a gray body representing the cold dust envelope, yielding the dust temperature, .
With the ratio of the measured flux density, , to the gray body’s intensity, , reflecting the dust emissivity, we calculated the H2 column density according to
| (7) |
where (the gas-to-dust ratio), cm2g-1 (the dust opacity at 350 m calculated as the mean of the dust models from Ossenkopf & Henning 1994), is the source solid angle, is the mean molecular weight of the interstellar medium with respect to a hydrogen molecule (Kauffmann et al. 2008), and is the mass of a hydrogen atom.
Using a distance of kpc to DR21 and taking into account the fact that the measured source size is convolved with the beam, we determined the linear source size:
| (8) |
with the beamwidth of the 160 m band.
Using the linear source size, , we determined the H2 volume density:
| (9) | ||||
We summarize the physical properties of DR21 M in Table 9.
| Parameter | Value |
|---|---|
| Apparent source size : | |
| Linear source radius : | 0.128 pc |
| Dust temperature : | K |
| Average H2 column density : | cm-2 |
| Average H2 volume density : | cm-3 |
At the derived density, the dust and gas temperatures, and , respectively, are well coupled (i.e., equal to 36 K). If we assume that the CH3OH energy levels are in LTE at this temperature, we can derive the total CH3OH column density using Eqs. 5 and 6. to calculate a total methanol column density, (CH3OH), of cm-2 and a CH3OH abundance of relative to H2 averaged over the DR21 M molecular core, for which we have interpolated the value for the partition function, as 977 from the values tabulated on a CH3OH data web page181818https://cdms.astro.uni-koeln.de/cgi-bin/cdmsinfo?file=e032504.cat of the Cologne Database for Molecular Spectroscopy (CDMS; Müller et al. 2005).
While CH3OH abundances of this magnitude (or even higher) have been determined for compact hot ( K) molecular cores that often surround newly formed high-mass stars (see, e.g., Menten et al. 1988; Bonfand et al. 2017; Molet et al. 2019), appears to be a high value for the more extended, cooler, and more developed DR21 M molecular clump. We note that the much higher temperature (175 K) invoked from modeling the OH radio absorption lines characterizes a more limited hotter region that represents the dense PDR interface of the molecular clump with the compact HII region.
As discussed in Sect. 4.5, for certain ranges of density and temperature, the transition can be “overcooled” (i.e., show deeper “enhanced” absorption) than expected under LTE, even against the cosmic microwave background radiation: Pandian et al. (2008) observed this line in absorption toward the hot corinos191919Hot corinos are the equivalent of hot cores surrounding low-mass protostellar objects or low-mass young stellar objects. NGC 1333-IRAS 4A and 4B, which do not show radio continuum emission. Were this the case, the CH3OH abundance presented above would be an overestimate. To investigate this, we used the non-LTE radiative transfer program RADEX (van der Tak et al. 2007) to study the line’s excitation. For the gas densities and temperatures determined by our modeling, we find that the line is indeed predicted to show enhanced absorption, that is, its excitation temperature is lower than the temperature of the cosmic microwave background. This means that the methanol abundance derived above represents an upper limit to the true value. Meaningful determinations of CH3OH) for DR21 M require constraints provided by data from thermally excited methanol lines.
Appendix E Expected number of background sources
Following Anglada et al. (1998), we can estimate the number of expected background sources, , inside a field of diameter as
| (10) |
where is the detectable flux density threshold and the observing frequency. In our observations, GHz and mJy. For field sizes of , 0.5, and 0.017 arcmin, we expect , 0.008, and 8.6.