High resolution and sensitivity bi-directional x-ray phase contrast imaging using 2D Talbot array illuminators
Abstract
Two-dimensional Talbot array illuminators (TAIs) were designed, fabricated, and evaluated for high-resolution high-contrast x-ray phase imaging of soft tissue at 10-20 keV. The TAIs create intensity modulations with a high compression ratio on the micrometer scale at short propagation distances. Their performance was compared with various other wavefront markers in terms of period, visibility, flux efficiency and flexibility to be adapted for limited beam coherence and detector resolution. Differential x-ray phase contrast and dark-field imaging were demonstrated with a one-dimensional, linear phase stepping approach yielding two-dimensional phase sensitivity using Unified Modulated Pattern Analysis (UMPA) for phase retrieval. The method was employed for x-ray phase computed tomography reaching a resolution of 3 µm on an unstained murine artery. It opens new possibilities for three-dimensional, non-destructive, and quantitative imaging of soft matter such as virtual histology. The phase modulators can also be used for various other x-ray applications such as dynamic phase imaging, super-resolution structured illumination microscopy, or wavefront sensing.
1 Introduction
Various imaging techniques based on x-rays have opened unique insights into three-dimensional structures at the micro- and nanometer scale and even enabled the capture of time-resolved volumetric data due to recent innovations in x-ray sources, optics, detectors, high precision metrology, and advanced post-processing and reconstruction algorithms. Phase contrast techniques have become indispensable due to their capability to generate superior contrast in soft tissue compared to conventional attenuation-based mechanisms [1]. While propagation-based methods provide good edge visibility [2], analyzer-based [3], interferometric [4, 5], aperture-based [6, 7] and speckle-based methods [8, 9, 10] are more sensitive to phase gradients and can deliver quantitative information for the separation of phase and absorption interaction. The latter techniques rely on various diffractive and absorptive beam modulator optics creating a defined intensity pattern after propagation in space. This modulation is altered by absorption, refraction, and scattering by the investigated object in the beam path. Various techniques have been successfully implemented to retrieve those different interactions from a sample and a reference scan both in single-shot mode [11, 9, 12, 10] and from multiple exposures with stepped modulators [8, 13, 14, 15]. In speckle-based Imaging (SBI), a random modulation is introduced by a diffuser (e.g. sandpaper with a fine grain size), while other techniques generate periodic modulations with gratings or other diffractive or refractive arrays. In order to perform efficiently, the modulators have to generate a pattern with good contrast (visibility) and average feature sizes resolvable by the detector.
In general, a stable and high-resolution bi-directional phase retrieval requires every detector pixel to undergo a high contrast modulation in both directions during phase stepping. For random speckle patterns, this requires a large number of stepped frames at the cost of longer acquisition times, higher radiation dose, and complexity in data handling and image processing [15]. Using a regular beam modulator (e.g. a grating pattern or a refractive lens array) and applying an adapted sampling scheme can avoid these problems and reduce the number of frames required to reach a high resolution and sensitivity.
Currently, a remarkable effort is being undertaken to create such periodic diffractive optical elements (DOE) for a variety of x-ray applications. Reich et al. [16] created an array of stacked compound refractive lenses (CRL) with a period of . Dos Santos Rolo et al. [17] fabricated a Shack-Hartman array with micro-lenslets by 3D direct laser writing with a periodicity of . Kagias et al. [18] fabricated circular phase arrays for omnidirectional dark-field imaging with a unit cell period of . Mamyrbayev et al. [19] developed a 2D CRL array for sub-pixel resolution scanning transmission microscopy with a period of . As some of these recent examples show, the periods of such x-ray optics are still in the range of several tens of micrometers limiting the achievable performance in sensitivity and resolution. Different types of 2D gratings [12, 7, 20, 21, 22, 23, 24] have been used with significantly smaller periods. However, they did not achieve comparable visibilities and flux efficiencies as the aforementioned beam modulators, which create periodic sharp foci in the detection plane.
Considering multiple factors related to grating fabrication and instrumental limitations, we propose and demonstrate a 2D periodic phase-shifting grating for the x-ray regime, also known as Talbot array illuminator (TAI) from visible light literature [25, 26, 27]. Compared to previously described methods employing 2D phase gratings [12, 21, 22, 28] we have adapted a design that creates periodic foci with a higher compression ratio compared to e.g. checkerboard 2D modulators [12] or orthogonally stacked 1D linear gratings [28]. In contrast to absorptive 2D gratings or Hartmann masks previously demonstrated for x-rays [7, 29, 30], the proposed TAI uses the entire transmitting radiation to generate the desired modulation. Compared to state-of-the-art refractive micro-lens arrays [16, 17, 31], the fabricated phase arrays have a much larger field-of-view (FoV), are resistant to long and high radiation dose exposures and can be easily fabricated with up to one order of magnitude smaller periods (e.g. ). Unlike random phase modulators (diffusers) used in SBI, the TAI can be tailored for optimal performance at a certain source coherence, spectral range, propagation distance, and detector point spread function (PSF). All of these aspects become crucial when the method is translated from coherent sources at large synchrotron facilities to laboratory-based micro-focus sources with polychromatic spectra.
In the present research, we evaluate customary designed TAIs of different periods and compare their visibility performance with a sandpaper diffuser at different propagation distances. Further, a 1D stepping scheme yielding bi-directional sensitivity is employed and compared with the random modulator for different numbers of phase steps. High-resolution bi-directional phase and dark-field imaging are demonstrated and a computed tomography (CT) phase scan of a murine artery embedded in paraffin is acquired. The proposed TAIs and acquisition schemes facilitate current state-of-the-art x-ray phase tomography, providing a convenient pathway for non-destructive, quantitative high-resolution 3D virtual histology.
2 Design of Talbot Array Illuminators
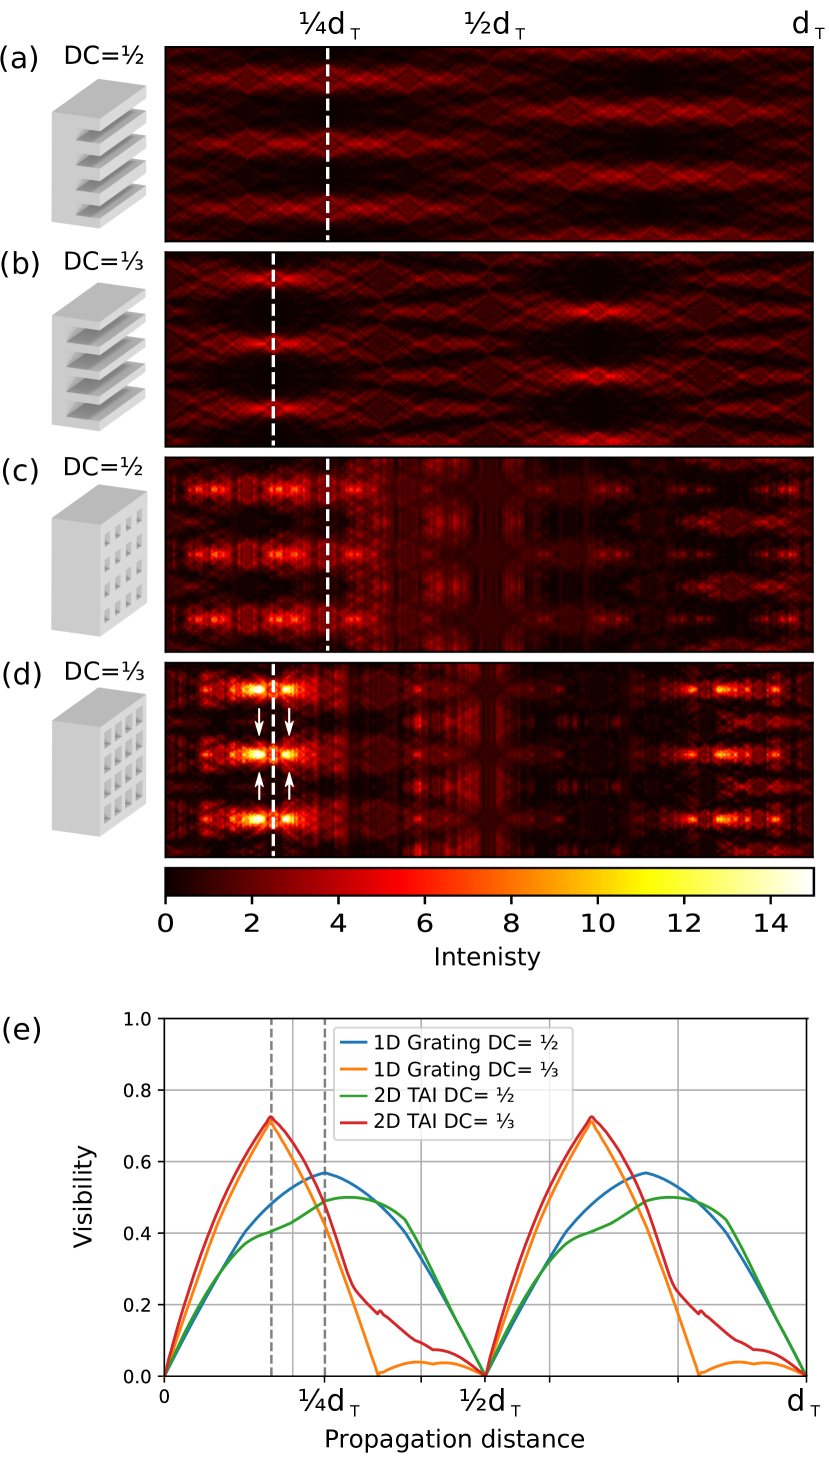
Current high-resolution x-ray detectors are thin scintillator screens focused with magnifying optics and coupled to CCD or CMOS pixel sensors, providing effective pixel sizes below and a spatial resolution in the range of . The task of creating the most efficient modulator consists of finding an optimal trade-off between the smallest possible period and the highest intensity contrast achievable with the PSF of the used detector. At the same time, the optics should attenuate the beam as little as possible which makes phase arrays fabricated from thin, x-ray transparent materials such as silicon the first choice. A broad variety of such periodic phase modulators has been studied [27, 26, 25] analytically to predict binary modulations at certain fractions of the Talbot distance , where is the period of the array and the wavelength of the radiation. The highest theoretically achievable binary modulation with binary (two height levels) 1D linear phase gratings has a compression ratio of 1:3 [25], i.e. the entire radiation is focused onto lines with a width of . A high compression ratio directly results in high visibility defined by:
| (1) |
where and denote the maximal and minimal intensity within one modulation period. The measured visibility will be reduced by the detector blur which can be modeled by a convolution of the propagated intensity distribution with the PSF of the detector. In order to compare the performance of different grating designs, we calculated the resulting intensity patterns using the Fresnel-Kirchhoff diffraction formula (see Supplement 1 for details). The so-called Talbot carpets plotted in Figure 1 (a-d) show how the spatial intensity evolves with the propagation distance. For binary gratings, it depends mainly on the duty cycle (ratio of the phase-shifting fraction of the period) and the phase shift of the grating profile. In most literature employing 2D phase gratings with x-rays (e.g. [12, 21, 28, 22]) symmetric duty cycles () were used which also result in symmetric intensity modulation at fractional Talbot distances. However, a much stronger contrast can be achieved with asymmetric DC configurations when a convenient phase shift is chosen. Figure 1 (a) and (b) show calculated Talbot carpets of 1D linear phase gratings illustrating this intensity focusing effect. While the grating with symmetric duty cycle (a) produces an intensity modulation with a compression ratio of 1:2 at , the grating with and (b) shows a stronger focusing with a compression ratio of 1:3 at an even shorter propagation distance (). There are also several other asymmetric grating parameter configurations that create the same effect at different propagation distances [25].
A wave propagation with two-dimensional arrays shows that this principle can be directly extended to a respective two-level 2D modulator creating a binary modulation with a compression ratio of 1:9. In Figure 1(c) and (d) the Talbot carpets for the 2D TAIs with the respective duty cycle designs are shown. As visible from the intensity (note that (a-d) have the same intensity color map), the 2D modulators result in an overall stronger focusing, and therefore, higher contrast is achieved compared to the 1D gratings. Further, the 2D TAI with (d) shows a significantly higher intensity than its symmetric counterpart (c). Besides that, even stronger modulations (depicted by arrows) before and after the binary modulation at are observable.
To quantify the visibility gain using the asymmetric gratings compared to the conventional ones, a plot of the visibility with propagation distance is provided in Figure 1(e). The visibility values have been calculated by equation 1 after convolving the intensity pattern at each propagation distance with a Gaussian 2D Kernel of (accounting for PSF). The plot shows that both 1D and 2D modulators perform similarly in terms of visibility, although the 2D TAIs reach a higher compression ratio. That is comprehensible, as 2D- focused spots are affected stronger by the PSF blur compared to 1D linear intensity distributions. However, the advantage of the asymmetric modulators, both in 1D and 2D cases, is visible. The asymmetric 2D TAI reaches about a 40% higher visibility than its symmetric counterpart at respective peak performance.
It is noteworthy that even stronger compression ratios can be achieved with binary phase arrays using . Although the created intensity pattern will not be binary, most of the intensity will be still focused on very narrow points [26]. More complicated phase modulators e.g. with more than two height levels and sub-periodic features [27] or other non-binary [32] (e.g. triangular, trapezoidal, or sinusoidal) DOE can also create stronger focusing than conventional binary phase gratings. However, they are more difficult to fabricate on the sub- period scale for x-rays than binary TAIs discussed in this work. Furthermore, there is no benefit (in terms of visibility) in focusing on areas much smaller than the detector PSF. We conclude that the discussed 2D TAI design with and is an efficient and easy to fabricate x-ray phase array, serving the purpose of high-resolution phase contrast and dark-field imaging.
3 Experimental
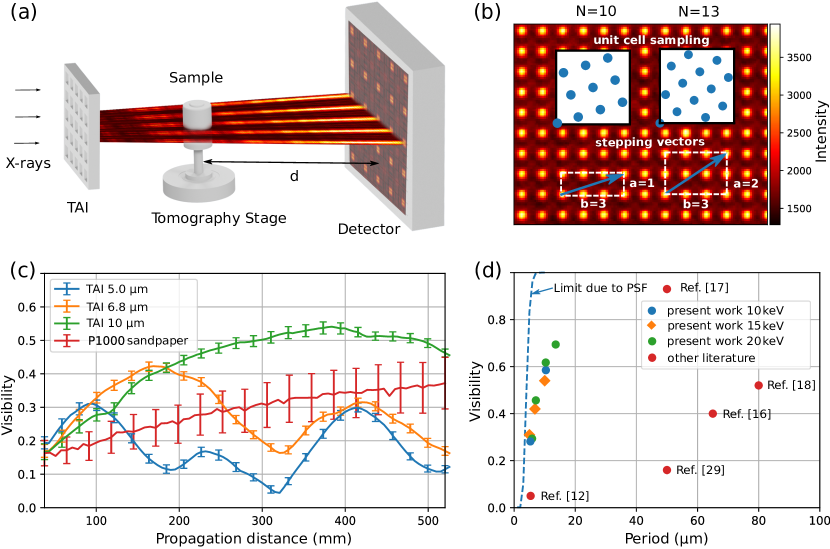
Multiple TAIs with periods of , , and with different heights adapted for energies of , and were fabricated and evaluated for their diffractive properties using coherent x-ray synchrotron radiation at the P05 imaging beamline[33, 34] operated by Helmholtz-Zentrum hereon at PETRA III at Deutsches Elektronen-Synchrotron (DESY), Hamburg, Germany. More details about the fabrication, setup parameters, and data processing are provided in Supplement 1. The general setup is shown in Figure 2(a), where incoming x-rays are modulated by the TAI, interact with the sample, and are then recorded by the detector. First, Talbot carpets (indicated by the colored layers in Figure 2(a)) were measured to confirm a higher compression ratio compared to conventional symmetric phase gratings and to find propagation distances with the best visibility for each TAI. One measured intensity modulation is shown in the background of Figure 2(b) for the TAI of period at . Some images from the Talbot carpet scans are provided in Supplement 1 and compared with theoretical simulations. Similar scans have also been performed at and with the respective TAIs and some key parameters are listed in Supplement 1.
For comparison, a speckle pattern generated by a sheet of P1000 sandpaper representing a random phase modulator was also measured analogously to the Talbot carpet scans. The achieved visibility and its standard deviation according to equation 1 is plotted with increasing propagation distance in Figure 2(c) for all scans at beam energy. To compare with recent literature demonstrating periodic x-ray DOEs discussed earlier, we plotted the peak performance of the different TAIs in 2(d). We only included research performed with single 2D gratings and modulators operated at synchrotron facilities for an appropriate comparison. The theoretical limit imposed by the PSF was calculated by convolving a periodic 2D square array of intensity points (resembling an ideally focusing modulator) with a Gaussian of estimating the blur of the used detector.
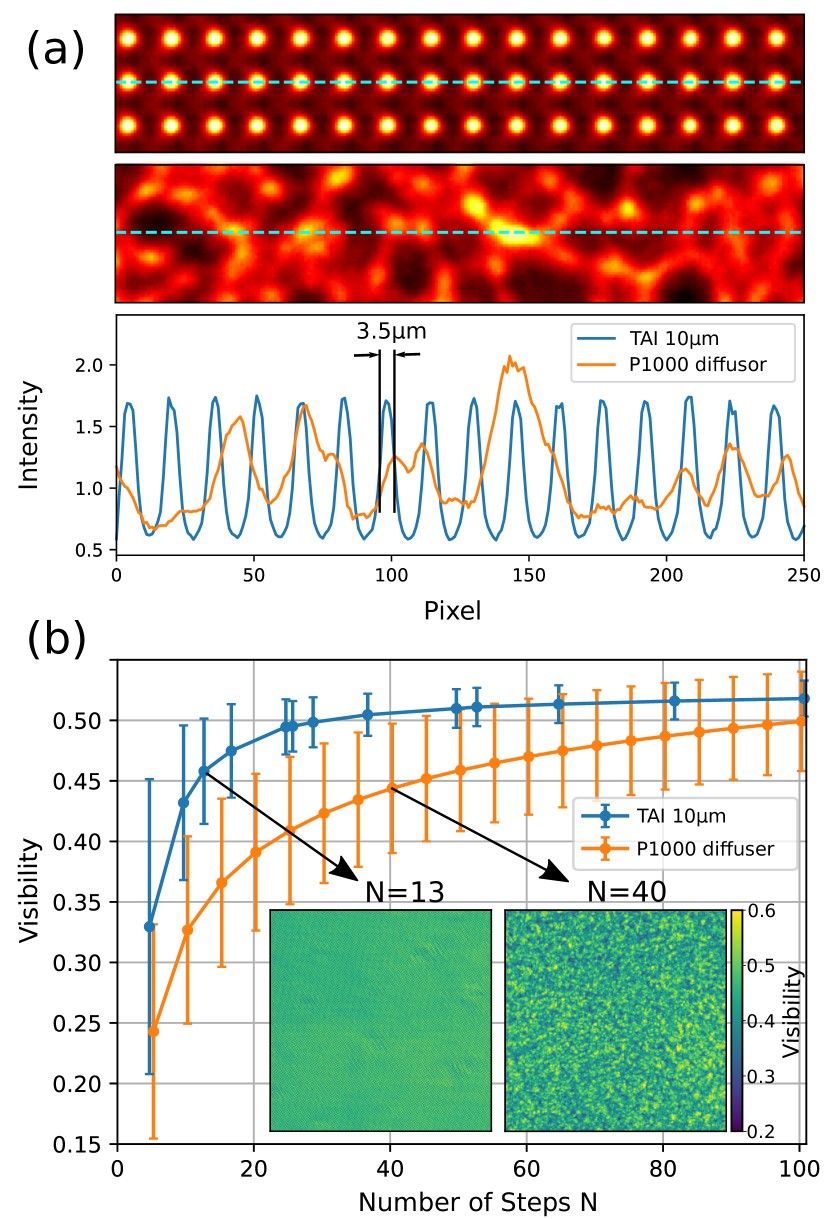
For a better spatial resolution, a 1D stepping acquisition of the TAI for bi-directional phase sensitivity was evaluated and compared to a stepping procedure with the P1000 diffuser. The scheme, similarly applied before with absorption grids [11], is illustrated in Figure 2(b). The stepping direction and range is chosen along a vector consisting of multiple unit cell vectors of the grating structure (e.g. and ) such that every unit cell is sampled uniformly by the periodic intensity maxima. This can be achieved by rotating the grating in an angle of to the stepping direction and performing steps. Such a homogeneous sampling can be achieved for different integers and when they are not coprime. It is noteworthy that homogeneous sampling does not necessarily have to be a quadratic lattice and can also be achieved with other rotation angles relative to the pixel matrix when the stepping range and step size can be precisely controlled. This approach, however, assumes that all foci sampling the unit cell have a very similar shape, which can be compromised by fabrication-related deficiencies. Figure 3(a) shows a comparison of the intensity pattern generated by the 2D TAI and the P1000 diffuser together with two line plots illustrating differences in the speckle densities and sizes. Stronger spots appear occasionally in the speckle pattern and would result in higher visibilities compared to the TAI when large pixel windows would be used for analysis according to 1. For a realistic comparison close to the mode of imaging operation, stepping sets with different numbers of steps were composed from measured data and the overall visibility and its standard deviation were evaluated in every pixel. In the case of the TAI, the 1D stepping scheme discussed above was used and for the P1000 diffuser, a spiral stepping with an inter-step distance larger than the average speckle size was used to emulate a random stepping without repeated or very similar steps. The mean of the visibility and its standard deviation depending on the number of steps are shown in Figure 3(b). Exemplary visibility maps for the TAI with and P1000 with steps are plotted for comparison.
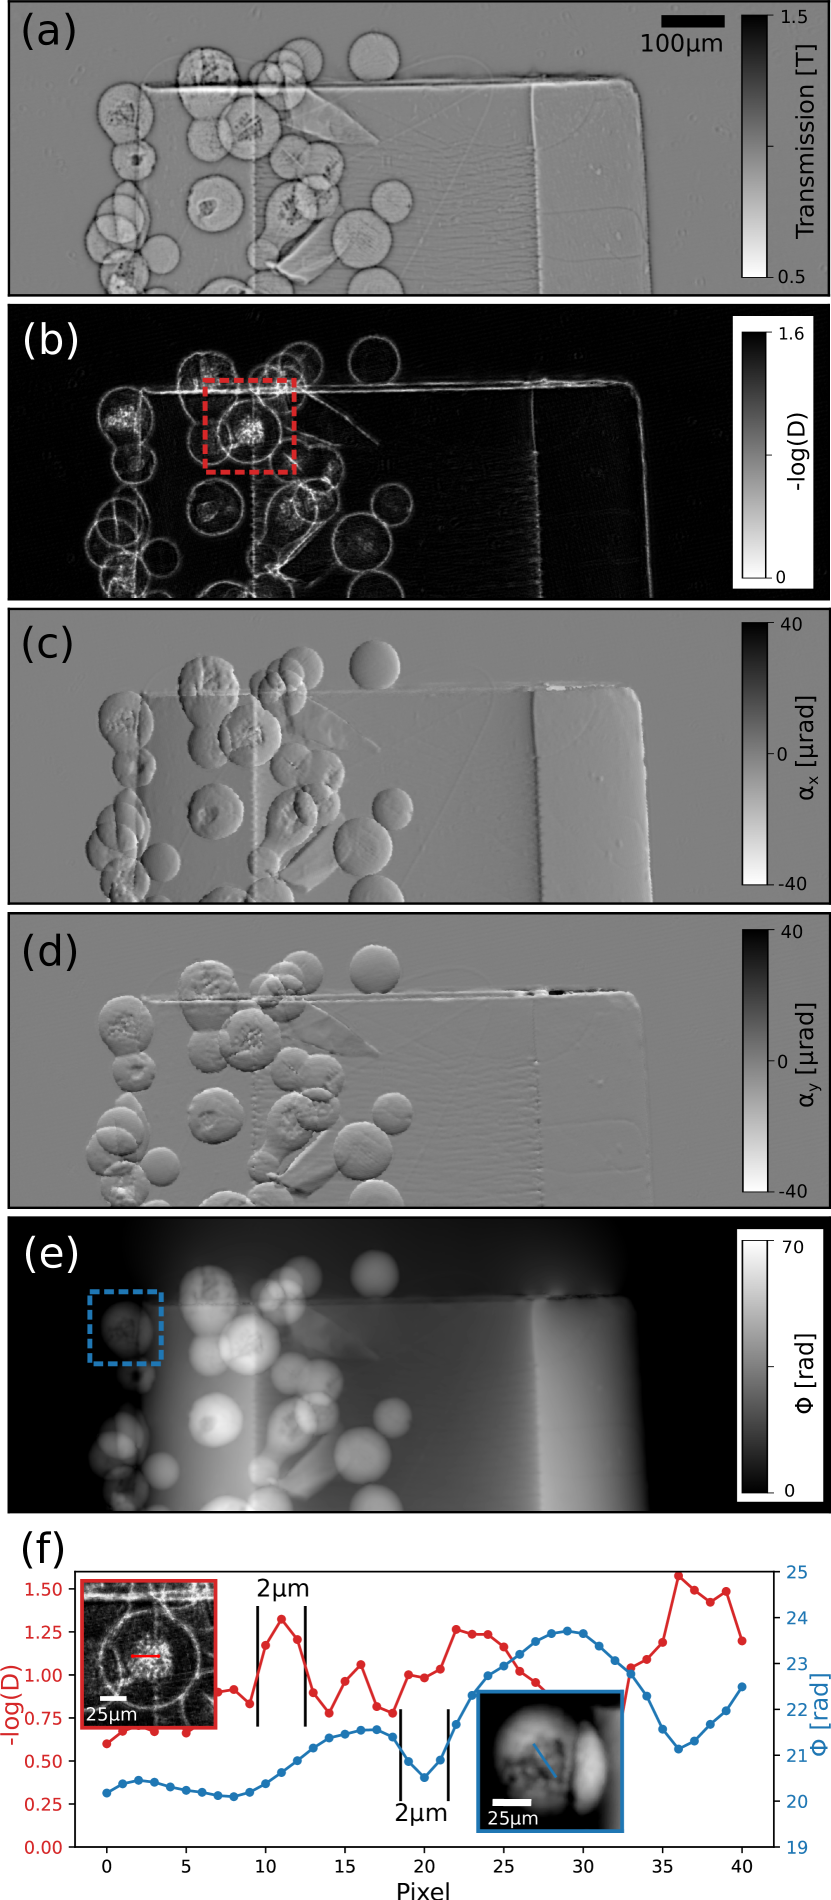
To demonstrate the imaging capabilities of the system, a sample consisting of silica particles with partially porous inner structures glued to a plastic micropipette tip was used. It was measured with the TAI placed from the detector at beam energy. The sample was at propagation distance to the detector and the TAI was stepped linearly according to the scheme discussed above. The acquired data was processed using Unified Modulated Pattern Analysis (UMPA) [14] which is a flexible and robust algorithm suitable for both SBI as well as phase retrieval with periodic modulation patterns. More details about the processing and phase integration are provided in Supplement 1. Figure 4(a-d) shows different image channels acquired with steps and processed with a window size of 5 pixels ( effective pixel size). Some line plots in Figure 4(f) show selected small features of the silica particle from the dark-field and the phase channel together with inlets which were acquired with steps and processed with a window size of 3 pixels.
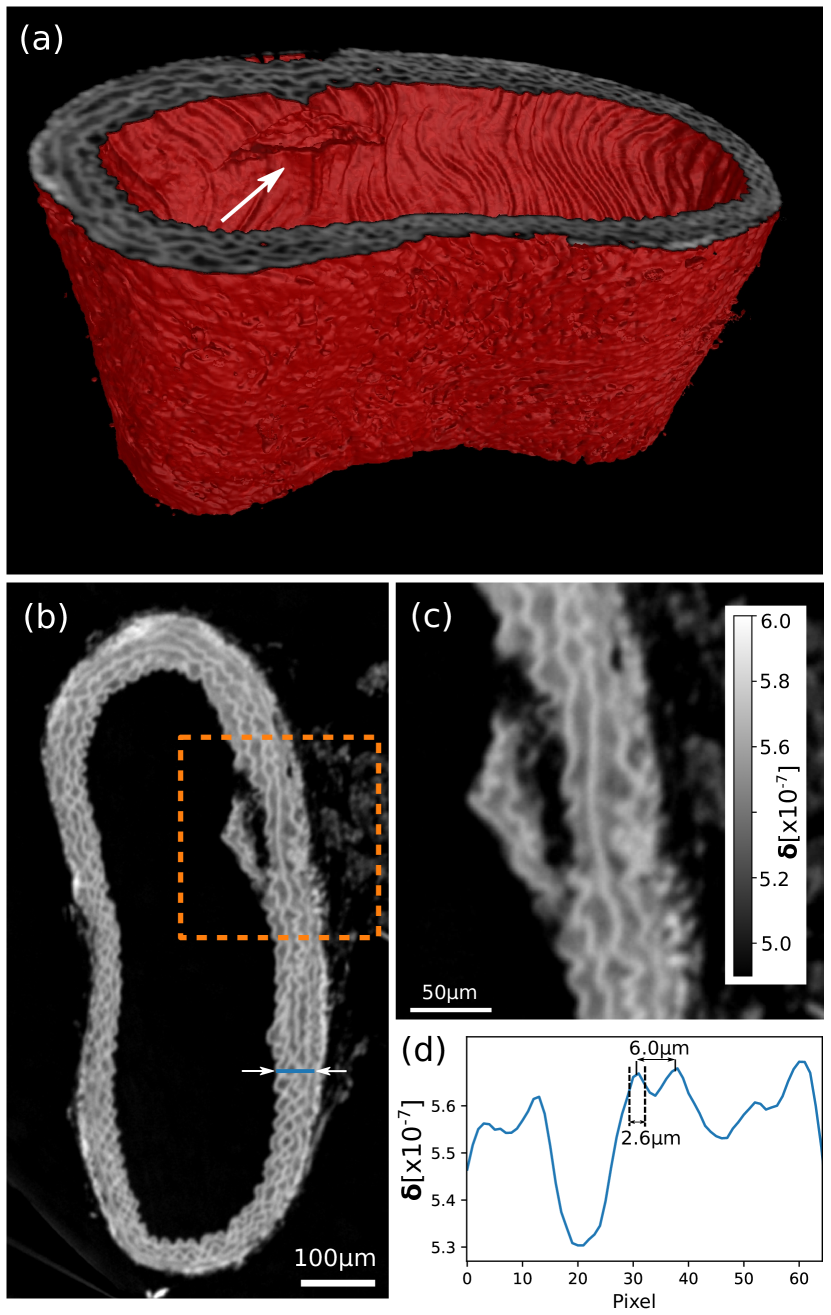
An entire CT scan of a paraffin-embedded mouse artery (brachiocephalic) taken from an ’old’ mouse (20 months) with atherosclerosis was performed at acquiring steps per projection and an effective pixel size of . The CT scan was performed with a different detector configuration than the previous scans since a larger FoV was required. The sample was placed at and 4001 projections were collected with intermediate flat fields. A specially adapted matching algorithm (described in detail in Supplement 1) was developed to find the most suitable flat field for every sample frame. The reconstruction was performed by filtered back-projection of the integrated phase images using a Ram-Lak filter. Figure 5(a) shows a 3D rendering of a section of the artery and an arrow is depicting a fissure in the vascular wall. The latter is shown in the respective slice (b) with a magnified view in (c). A line plot through the lamellar structure (see blue line in (b)) is plotted in (d) to estimate the achieved resolution. Further quantitative analysis related to the resolution is included in Supplement 1.
4 Results and Discussion
4.1 Visibility-Distance Analysis
As predicted by the simulation the evaluated TAIs create strongly modulated patterns near the fractional Talbot distances. In the case of the TAI, the first visibility peak appears in the vicinity of and the second around which corresponds to and . Note that the highest visibility does not have to be necessary on the exact position of the fractional Talbot distance, since strong focusing occurs even before and after as the simulations show. The configuration can be used for high-sensitivity measurements as it delivers comparably high visibility at a quadrupled propagation distance than the modulation at and has a significantly lower period than the TAI. The latter achieves higher visibility at which is to be expected due to the PSF blur. The highest visibility of the TAIs for is achieved by the TAI at which is close to the modulation. The speckle visibility of P1000 sandpaper increases constantly with propagation distance, however, it is still always below the TAI and suffers by a much higher standard deviation. The TAIs show pivotal advantages for creating high contrast modulations at small periods and shorter propagation distances. As Figure 2(d) shows, the evaluated modulators are much closer to the theoretical limit in terms of the period-to-visibility ratio compared to other recent examples. Compared to [16] the TAI achieves similar visibility at about smaller periods and enables therefore e.g. single-shot imaging at about one order of magnitude better resolution. Compared to e.g. [12] the configuration of the TAI gives a higher visibility which allows to shorten the measurement time and lower the dose significantly.
4.2 Comparison of TAI with P1000 Diffuser
A comparison of periodic phase modulators with diffusers is not straightforward as they do not have a distinct period and the reached visibility either depends on the analysis window size or the number of steps when a pixel-by-pixel approach is used. Furthermore, it depends on the beam energy, coherence, and propagation distance. Still, a realistic evaluation of the achieved visibility in a phase stepping process with increasing shown in Figure 3(b) emphasizes the benefits of the TAI. The visibility, as well as its standard deviation, saturate after for the TAI, while the P1000 diffuser requires much more steps to achieve comparable results and its standard deviation decreases only slowly with increasing . With an overall higher visibility with a lower standard deviation is achieved with the TAI than for the P1000 diffuser with steps. A detailed evaluation considering the intensity gradients of the modulation pattern, which are the key factor for a good phase sensitivity [35], is given in Supplement 1. Using the TAI instead of the P1000 diffuser an improvement by a factor of 6 in dose efficiency is estimated. It is attributed to strong intensity gradients, their high density, as well as their periodic nature, which allows a highly efficient sampling.
4.3 Projectional Imaging
As shown in Figure 4, almost artifact-free images with a high resolution can be acquired with a relatively low number of steps. In the transmission image (a) features close to edges or grainy regions are distorted by edge enhancement effects (halos around spherical shapes) due to a long propagation distance to the detector. The dark-field image (b) shows characteristic enhancement of edges but also porous structures inside the spheres are well recognizable. Some faint periodic artifacts are present in the dark-field image probably caused by insufficient sampling ( steps). They can be avoided by choosing a larger window size in UMPA processing, however, this will also reduce the resolution. Both differential-phase contrast images in x (c) and y (d) direction show artificially rough edges of the silicon spheres which are probably the result of incompatible phase sampling and window size. However, those artifacts are hardly recognizable in the integrated phase image (e). The sensitivity of the differential phase contrast images in both directions is similar (, ), confirming an overall good sampling in both directions. (f) Line plots provided in Figure 4(f) show that features of about full width at half maximum (FWHM) can be resolved in both the dark-field as well as the phase image. That is close to the theoretical limit of UMPA phase retrieval imposed by the window size [15] (in this case ) as well as the PSF of the detector.
4.4 Computed Tomography
The phase CT scan of the unstained mouse artery demonstrates the potential for high-resolution, quantitative, non-destructive 3D virtual histology. The vessel was extracted from an aged animal with a pathological condition (atherosclerosis) and the slice in 5(b) shows in detail that there is a measurable fissure of the elastin fibers, commonly seen in frail, old animals and in humans. The contrast between the background (paraffin) and the bright elastin fibers is about and the background noise level in the paraffin matrix is . Hence, a contrast-to-noise ratio (CNR) of between these soft matter components is achieved. A line plot of the reconstructed refractive index decrement values in (d) shows that two different lamellae distanced about from each other can still be well resolved and neighboring features with an FWHM of about are well distinguishable. Well defined edges quantifying the resolution at paraffin-tissue interfaces evaluated further in Supplement 1 also suggest a resolution of about achieved with phase steps per projection. A recent comparable work using state-of-the-art SBI achieved about resolution at phase steps at an energy of [36]. Thus, we are approaching the limit imposed by the detector PSF and come close to the resolution of propagation-based phase imaging. The latter is unprecedented in resolution among non-ptychographic full-field techniques, however, is less sensitive to small density differences since it is based on the Laplacian of the phase. Furthermore, the most commonly used reconstruction algorithm [37] requires various assumptions about the sample, resulting in limited applications and difficulties for quantification.
5 Conclusion
We designed and evaluated 2D TAIs with small periods for x-ray beam energy. They create periodic foci with higher compression ratios and visibilities than conventional 2D phase gratings and have many advantages over absorption gratings or apertures, refractive micro-lens arrays, or random phase modulators used in SBI. The short periods also allow a finer and more efficient phase sampling for higher resolution and sensitivity. In this work we addressed the drawbacks of grating-based imaging (GBI) compared to SBI which are e.g. listed in [38]. We avoided using absorptive elements and employed only one, thin phase modulator reducing the setup complexity. Furthermore, we reached bi-directional sensitivity with 1D linear phase stepping and achieved unprecedented resolution with a low number of phase steps. Similar to GBI, strong spatial modulations of (e.g. at edges, air bubbles) remain a problem, since they deteriorate the intensity pattern to a degree that it cannot be reasonably matched with the reference pattern. This could be addressed by tuning the sensitivity (sample-detector distance, beam energy, larger modulator period) or excluding the concerned pixels from the CT reconstruction using e.g. advanced iterative CT algorithms. Another possibility would be to apply ptychographic phase retrieval algorithms which have been shown beneficial for resolution with structured illumination [39]. Future developments will include further optimization of the CT acquisition schemes to reduce the measurement time, radiation dose, and setup stability issues. In particular, a fly-scan CT with continuous sample rotation and frame rate at every phase step may improve the current protocol. Although a 1D stepping was successfully employed, a 2D stepping will simplify alignment and provide more flexibility for alternative sampling schemes. A detailed quantitative analysis of the absolute values as well as comparison to propagation-based phase tomography is ongoing and will be addressed in future work.
The TAIs can be designed to operate efficiently in laboratory-based x-ray imaging systems with lower source coherence, shorter propagation distances, lower detector resolution, and higher x-ray energies. When SBI is performed with higher energies, strongly absorbing diffusers (e.g. steel wool [40]) are used or multiple layers of sandpaper have to be stacked (e.g. up to 20 layers for [13]) to achieve decent speckle visibility. Periodic modulators like the TAIs proposed in this work can be designed for significantly higher energies on thin substrates. Current anisotropic silicon etching technology achieves aspect ratios beyond 1:20 making modulators with period possible for and above on thick silicon substrates.
Beyond high-resolution or single-shot dynamic phase imaging, the discussed TAIs can be also used in wavefront sensing, x-ray optics characterization, adjustment and focusing of scintillator screens in 3 dimensions, or for recently demonstrated full-field structured illumination super-resolution x-ray microscopy [41, 19]. Using high power, laboratory-based x-ray sources with absorptive source gratings [5], the discussed TAIs may be also used in medical Talbot-Lau-based imaging systems to gain bi-directional sensitivity and increased visibility with shorter setups compared to conventional binary symmetric phase gratings.
Funding Information
Deutsche Forschungsgemeinschaft (DFG) Research Training Group GRK2274; European Research Council (ERC) grant agreement No 866026; British Heart Foundation (BHF) project PG/20/10010
Acknowledgments
Large parts of this research were carried out at PETRA III at DESY, a member of the Helmholtz Association (HGF). We acknowledge the support during the beam times by Jana Andrejewski, Fabio De Marco, Lev Ushakov, Elena Moralez, and Fabian Wilde. This research was supported in part through the Maxwell computational resources operated at DESY. We acknowledge the development and implementation of tailored detector systems for phase contrast imaging at the imaging beamlines P05 and P07 by members of the HZG tomography team. Pierre Thibault acknowledges funding from the European Research Council (ERC) under the European Union’s Horizon 2020 research and innovation program (grant agreement No 866026).
Disclosures
Disclosures. The authors declare no conflicts of interest.
Supplemental Documents
For further methodical details see Supplement 1 attached at the end of the document.
References
- [1] R. Fitzgerald, “Phase-Sensitive X-Ray Imaging,” \JournalTitlePhysics Today 53, 23–26 (2000).
- [2] T. E. Gureyev, S. C. Mayo, D. E. Myers, Y. Nesterets, D. M. Paganin, A. Pogany, A. W. Stevenson, and S. W. Wilkins, “Refracting Röntgen’s rays: Propagation-based x-ray phase contrast for biomedical imaging,” \JournalTitleJournal of Applied Physics 105, 102005 (2009).
- [3] T. J. Davis, D. Gao, T. E. Gureyev, A. W. Stevenson, and S. W. Wilkins, “Phase-contrast imaging of weakly absorbing materials using hard X-rays,” \JournalTitleNature 373, 595–598 (1995).
- [4] A. Momose, S. Kawamoto, I. Koyama, Y. Hamaishi, K. Takai, and Y. Suzuki, “Demonstration of X-Ray Talbot Interferometry,” \JournalTitleJapanese Journal of Applied Physics 42, L866–L868 (2003).
- [5] F. Pfeiffer, T. Weitkamp, O. Bunk, and C. David, “Phase retrieval and differential phase-contrast imaging with low-brilliance X-ray sources,” \JournalTitleNature Physics 2, 258–261 (2006).
- [6] A. Olivo and R. Speller, “A coded-aperture technique allowing x-ray phase contrast imaging with conventional sources,” \JournalTitleApplied Physics Letters 91, 074106 (2007).
- [7] K. S. Morgan, D. M. Paganin, and K. K. W. Siu, “Quantitative single-exposure x-ray phase contrast imaging using a single attenuation grid,” \JournalTitleOptics Express 19, 19781 (2011).
- [8] S. Bérujon, E. Ziegler, R. Cerbino, and L. Peverini, “Two-Dimensional X-Ray Beam Phase Sensing,” \JournalTitlePhysical Review Letters 108, 158102 (2012).
- [9] K. S. Morgan, D. M. Paganin, and K. K. W. Siu, “X-ray phase imaging with a paper analyzer,” \JournalTitleApplied Physics Letters 100, 124102 (2012).
- [10] I. Zanette, T. Zhou, A. Burvall, U. Lundström, D. H. Larsson, M. Zdora, P. Thibault, F. Pfeiffer, and H. M. Hertz, “Speckle-Based X-Ray Phase-Contrast and Dark-Field Imaging with a Laboratory Source,” \JournalTitlePhysical Review Letters 112, 253903 (2014).
- [11] H. H. Wen, E. E. Bennett, R. Kopace, A. F. Stein, and V. Pai, “Single-shot x-ray differential phase-contrast and diffraction imaging using two-dimensional transmission gratings,” \JournalTitleOptics Letters 35, 1932 (2010).
- [12] K. S. Morgan, P. Modregger, S. C. Irvine, S. Rutishauser, V. A. Guzenko, M. Stampanoni, and C. David, “A sensitive x-ray phase contrast technique for rapid imaging using a single phase grid analyzer,” \JournalTitleOptics Letters 38, 4605 (2013).
- [13] S. Berujon and E. Ziegler, “Near-field speckle-scanning-based x-ray tomography,” \JournalTitlePhysical Review A 95, 063822 (2017).
- [14] M.-C. Zdora, P. Thibault, T. Zhou, F. J. Koch, J. Romell, S. Sala, A. Last, C. Rau, and I. Zanette, “X-ray Phase-Contrast Imaging and Metrology through Unified Modulated Pattern Analysis,” \JournalTitlePhysical Review Letters 118, 203903 (2017).
- [15] M.-C. Zdora, “State of the Art of X-ray Speckle-Based Phase-Contrast and Dark-Field Imaging,” \JournalTitleJournal of Imaging 4, 60 (2018).
- [16] S. Reich, T. dos Santos Rolo, A. Letzel, T. Baumbach, and A. Plech, “Scalable, large area compound array refractive lens for hard X-rays,” \JournalTitleApplied Physics Letters 112, 151903 (2018).
- [17] T. dos Santos Rolo, S. Reich, D. Karpov, S. Gasilov, D. Kunka, E. Fohtung, T. Baumbach, and A. Plech, “A Shack-Hartmann Sensor for Single-Shot Multi-Contrast Imaging with Hard X-rays,” \JournalTitleApplied Sciences 8, 737 (2018).
- [18] M. Kagias, Z. Wang, M. E. Birkbak, E. Lauridsen, M. Abis, G. Lovric, K. Jefimovs, and M. Stampanoni, “Diffractive small angle X-ray scattering imaging for anisotropic structures,” \JournalTitleNature Communications 10, 5130 (2019).
- [19] T. Mamyrbayev, A. Opolka, A. Ershov, J. Gutekunst, P. Meyer, K. Ikematsu, A. Momose, and A. Last, “Development of an Array of Compound Refractive Lenses for Sub-Pixel Resolution, Large Field of View, and Time-Saving in Scanning Hard X-ray Microscopy,” \JournalTitleApplied Sciences 10, 4132 (2020).
- [20] M. Zakharova, V. Vlnieska, H. Fornasier, M. Börner, T. d. S. Rolo, J. Mohr, and D. Kunka, “Development and Characterization of Two-Dimensional Gratings for Single-Shot X-ray Phase-Contrast Imaging,” \JournalTitleApplied Sciences 8, 468 (2018).
- [21] G. Sato, T. Kondoh, H. Itoh, S. Handa, K. Yamaguchi, T. Nakamura, K. Nagai, C. Ouchi, T. Teshima, Y. Setomoto, and T. Den, “Two-dimensional gratings-based phase-contrast imaging using a conventional x-ray tube,” \JournalTitleOptics Letters 36, 3551 (2011).
- [22] H. Itoh, K. Nagai, G. Sato, K. Yamaguchi, T. Nakamura, T. Kondoh, C. Ouchi, T. Teshima, Y. Setomoto, and T. Den, “Two-dimensional grating-based X-ray phase-contrast imaging using Fourier transform phase retrieval,” \JournalTitleOptics Express 19, 3339 (2011).
- [23] S. Rutishauser, M. Bednarzik, I. Zanette, T. Weitkamp, M. Börner, J. Mohr, and C. David, “Fabrication of two-dimensional hard X-ray diffraction gratings,” \JournalTitleMicroelectronic Engineering 101, 12–16 (2013).
- [24] I. Zanette, T. Weitkamp, T. Donath, S. Rutishauser, and C. David, “Two-Dimensional X-Ray Grating Interferometer,” \JournalTitlePhysical Review Letters 105, 248102 (2010).
- [25] T. J. Suleski, “Generation of Lohmann images from binary-phase Talbot array illuminators,” \JournalTitleApplied Optics 36, 4686 (1997).
- [26] V. Arrizón and J. G. Ibarra, “Trading visibility and opening ratio in Talbot arrays,” \JournalTitleOptics Communications 112, 271–277 (1994).
- [27] P. Szwaykowski and V. Arrizon, “Talbot array illuminator with multilevel phase gratings,” \JournalTitleApplied Optics 32, 1109 (1993).
- [28] N. Morimoto, S. Fujino, Y. Ito, A. Yamazaki, I. Sano, T. Hosoi, H. Watanabe, and T. Shimura, “Design and demonstration of phase gratings for 2D single grating interferometer,” \JournalTitleOptics Express 23, 29399 (2015).
- [29] M. Zakharova, S. Reich, A. Mikhaylov, V. Vlnieska, T. d. S. Rolo, A. Plech, and D. Kunka, “Inverted Hartmann mask for single-shot phase-contrast x-ray imaging of dynamic processes,” \JournalTitleOptics Letters 44, 2306 (2019).
- [30] K. R. Rix, T. Dreier, T. Shen, and M. Bech, “Super-resolution x-ray phase-contrast and dark-field imaging with a single 2D grating and electromagnetic source stepping,” \JournalTitlePhysics in Medicine & Biology 64, 165009 (2019).
- [31] A. Mikhaylov, S. Reich, M. Zakharova, V. Vlnieska, R. Laptev, A. Plech, and D. Kunka, “Shack–Hartmann wavefront sensors based on 2D refractive lens arrays and super-resolution multi-contrast X-ray imaging,” \JournalTitleJournal of Synchrotron Radiation 27, 788–795 (2020).
- [32] A. Yaroshenko, M. Bech, G. Potdevin, A. Malecki, T. Biernath, J. Wolf, A. Tapfer, M. Schüttler, J. Meiser, D. Kunka, M. Amberger, J. Mohr, and F. Pfeiffer, “Non-binary phase gratings for x-ray imaging with a compact Talbot interferometer,” \JournalTitleOptics Express 22, 547 (2014).
- [33] I. Greving, F. Wilde, M. Ogurreck, J. Herzen, J. U. Hammel, A. Hipp, F. Friedrich, L. Lottermoser, T. Dose, H. Burmester, M. Müller, and F. Beckmann, “P05 imaging beamline at PETRA III: first results,” in Developments in X-Ray Tomography IX, vol. 9212 S. R. Stock, ed., International Society for Optics and Photonics (SPIE, 2014), pp. 166 – 173.
- [34] F. Wilde, M. Ogurreck, I. Greving, J. U. Hammel, F. Beckmann, A. Hipp, L. Lottermoser, I. Khokhriakov, P. Lytaev, T. Dose, H. Burmester, M. Müller, and A. Schreyer, “Micro-ct at the imaging beamline p05 at petra iii,” \JournalTitleAIP Conference Proceedings 1741, 030035 (2016).
- [35] T. Zhou, M.-C. Zdora, I. Zanette, J. Romell, H. M. Hertz, and A. Burvall, “Noise analysis of speckle-based x-ray phase-contrast imaging,” \JournalTitleOpt. Lett. 41, 5490–5493 (2016).
- [36] M.-C. Zdora, P. Thibault, W. Kuo, V. Fernandez, H. Deyhle, J. Vila-Comamala, M. P. Olbinado, A. Rack, P. M. Lackie, O. L. Katsamenis, M. J. Lawson, V. Kurtcuoglu, C. Rau, F. Pfeiffer, and I. Zanette, “X-ray phase tomography with near-field speckles for three-dimensional virtual histology,” \JournalTitleOptica 7, 1221 (2020).
- [37] D. Paganin, S. C. Mayo, T. E. Gureyev, P. R. Miller, and S. W. Wilkins, “Simultaneous phase and amplitude extraction from a single defocused image of a homogeneous object,” \JournalTitleJournal of Microscopy 206, 33–40 (2002).
- [38] Y. Kashyap, H. Wang, and K. Sawhney, “Experimental comparison between speckle and grating-based imaging technique using synchrotron radiation X-rays,” \JournalTitleOptics Express 24, 18664 (2016).
- [39] M. Stockmar, P. Cloetens, I. Zanette, B. Enders, M. Dierolf, F. Pfeiffer, and P. Thibault, “Near-field ptychography: phase retrieval for inline holography using a structured illumination,” \JournalTitleScientific Reports 3, 1927 (2013).
- [40] H. Wang, Y. Kashyap, B. Cai, and K. Sawhney, “High energy X-ray phase and dark-field imaging using a random absorption mask,” \JournalTitleScientific Reports 6, 30581 (2016).
- [41] B. Günther, L. Hehn, C. Jud, A. Hipp, M. Dierolf, and F. Pfeiffer, “Full-field structured-illumination super-resolution X-ray transmission microscopy,” \JournalTitleNature Communications 10, 2494 (2019).