Observation of photons above 300 TeV associated with a high-energy neutrino from the Cygnus region
Abstract
Galactic sites of acceleration of cosmic rays to energies of order eV and higher, dubbed PeVatrons, reveal themselves by recently discovered gamma radiation of energies above 100 TeV. However, joint gamma-ray and neutrino production, which marks unambiguously cosmic-ray interactions with ambient matter and radiation, was not observed until now. In November 2020, the IceCube neutrino observatory reported an TeV neutrino event from the direction of one of the most promising Galactic PeVatrons, the Cygnus Cocoon. Here we report on the observation of a 3.1-sigma (post trial) excess of atmospheric air showers from the same direction, observed by the Carpet-2 experiment and consistent with a few-months flare in photons above 300 TeV, in temporal coincidence with the neutrino event. The fluence of the gamma-ray flare is of the same order as that expected from the neutrino observation, assuming the standard mechanism of neutrino production. This is the first evidence for the joint production of high-energy neutrinos and gamma rays in a Galactic source.
1 Introduction
Recent observations of astrophysical gamma rays above 100 TeV established the existence of various Galactic sources, both point-like (Abeysekara et al., 2019a, b, 2020; Albert et al., 2020, 2021; Cao et al., 2021) and diffuse (Amenomori et al., 2021). These observations are often interpreted as indications to the existence of Galactic PeVatrons, that are sites of cosmic-ray acceleration up to PeV energies1111 PeV eV., in which the gamma rays are produced in interactions of energetic hadrons with ambient matter and radiation. Observations of neutrinos co-produced with these gamma rays would unambiguously point to their hadronic origin.
It is an intriguing question whether some of the high-energy (above TeV) astrophysical neutrinos (Aartsen et al. 2013a, b; for recent reviews, see e.g. Ahlers & Halzen 2018; Palladino et al. 2020) come from Galactic sources. While the largest available data set of the IceCube and ANTARES experiments does not demonstrate any correlation of neutrino arrival directions with the Galactic disk (Albert et al., 2018), various indications exist in favor of the Galactic origin of a part of the neutrino flux at energies below TeV. The most recent analysis of arrival directions of IceCube cascade events (Aartsen et al., 2019) reveals a weak Galactic-plane excess. Studies of track-like and cascade-like events registered in the IceCube detector under the assumption of the power-law shape of the primary neutrino spectrum yield (e.g., Abbasi et al., 2020) different values of the power-law index for these two samples of events. This discrepancy may be naturally explained if the primary spectrum is actually composed of two distinct components (Chen et al., 2015). A population of extragalactic sources which demonstrates significant correlation with astrophysical neutrinos (Plavin et al., 2021) may be responsible for the hard component, while the soft component may be due to the Galactic sources (Palladino & Vissani, 2016; Palladino et al., 2016). In the latter case, the extragalactic gamma-ray background (EGRB) component concomitant with IceCube neutrinos does not overshoot the EGRB measured with Fermi-LAT.
Cygnus Cocoon (Ackermann et al., 2011), an extended gamma-ray source presumably containing an OB star association embedded in a superbubble, is a candidate Galactic hadronic PeVatron. Star-forming regions are potential sites of cosmic-ray acceleration, gamma-ray and neutrino production (Bykov et al., 2020). In particular, it has been predicted that the flux of high-energy neutrinos from Cygnus Cocoon is close to the IceCube sensitivity (Yoast-Hull et al., 2017). This source was detected by HAWC up to, and possibly beyond 100 TeV (Abeysekara et al., 2020, 2021); its position is consistent with the highest-energy (up to 1.4 PeV) photon source detected by LHAASO (Cao et al., 2021). Gamma-ray sources in the Cygnus region contribute a lot to the Galactic-plane diffuse gamma radiation above 400 TeV, discovered by Amenomori et al. (2021).
On November 20, 2020, IceCube reported (Lagunas Gualda et al., 2020) a candidate track-like neutrino event with the estimated energy of 154 TeV. The arrival direction of the neutrino, though determined with a considerably low precision, coincided with the direction from Cygnus Cocoon. The event was reported through the standard BRONZE alert procedure (Blaufuss et al., 2019). These alerts are routinely followed up by numerous instruments, in particular (Dzhappuev et al., 2020c) by the Carpet–2 gamma-ray telescope at the Baksan Neutrino Observatory. This event, however, was exceptional in the sense that it coincided with a previously defined prospective Galactic source of high-energy neutrinos. This gives a chance to detect sub-PeV gamma rays co-produced with neutrinos, which cannot reach us from extragalactic sources because of pair production on cosmic microwave background radiation (Nikishov, 1962). Standard Carpet–2 alert analysis revealed two gamma-ray candidate events in one-month interval centered at the alert time (Dzhappuev et al., 2020a). Here, we present results of a more detailed study of a possible sub-PeV gamma-ray flare in the Cygnus Cocoon associated with the IceCube neutrino event.
2 The Carpet–2 detector and the dataset
Carpet–2 is an air-shower experiment co-located with the Baksan Neutrino Observatory (Neutrino village, North Caucasus). It includes a 200 m2 continuous central scintillator detector, Carpet; five outer detector stations with 9 m2 of scintillator in each of them; and a 175 m2 shielded detector with the threshold of 1 GeV for vertical muons. The primary-particle energy is determined from the shower size , reconstructed from the central Carpet; the arrival direction is obtained from timing of the outer stations; the muon detector is used to select candidate gamma-ray showers which are muon-poor. The installation, its operation and data processing are described by Dzhappuev et al. (2007); Szabelski et al. (2009); Dzhappuev et al. (2016); Troitsky et al. (2019); Dzhappuev et al. (2019a).
The angular resolution of Carpet–2 is determined by a combination of (i) fluctuations in the shower, (ii) fluctuations in electronics and (iii) earlier trigger of individual detector station due to coincident atmospheric muons. The point-spread function (PSF) has been determined experimentally (Alexeenko et al., 2003) by means of simultaneous observations of air showers by Carpet and by an atmospheric Cerenkov detector (CD). The pointing accuracy of the CD, 0.1∘, and its angular resolution, 0.6∘, have been measured from observations of bright stars. The PSF of Carpet is non-Gaussian; 86% of events are reconstructed within 4.7∘ of their true direction. Monte-Carlo simulations and experimental measurements of individual contributions (i), (ii), (iii) give results consistent with this estimate.
For the present study, we use Carpet–2 data recorded between April 7, 2018 and April 25, 2021, total 829 days of data collection. Standard quality cuts require that GeV air-shower energy is deposited in Carpet; four outer stations participate in the determination of the arrival direction; the reconstructed shower axis is at least 0.7 m within the Carpet boundary; the reconstructed zenith angle is . In total, 65703 events passed these cuts in this time period.
3 Simulations and data analysis
Monte-Carlo simulations we use include air-shower modelling and the detector-response simulation described by Dzhappuev et al. (2019b). Every simulated event is recorded in the same format and reconstructed by the same program as those used for the real data, including the quality-cut selection. These simulations are used to relate the reconstructed shower size to the primary gamma-ray energy , to estimate the detection and reconstruction efficiency and to develop criteria for separation between events induced by primary photons and by cosmic rays. Since the efficiency of the detection of gamma-ray events drops fastly below TeV (Troitsky et al., 2019), we include only 56969 events with reconstructed TeV in the data sample we use here. The effective area of the installation as the function of energy is presented by Dzhappuev et al. (2020c). Carpet–2 tests the same range of energies and fluxes for gamma rays as IceCube tests for neutrinos.
We also determine the notion of a “photon median candidate event” (Abraham et al., 2008) from simulations as follows. Assuming the primary spectrum, we simulate a large number of gamma-ray induced events and select those with reconstructed TeV. For each of those events, we calculate the ratio of the number of muons in the shielded detector, , to and select the value such that 50% of reconstructed gamma rays satisfy . In the search for gamma-ray flares of localized sources, when the isotropic and uniform in time cosmic-ray background is small, it makes sense to use also the directional and temporal coincidence as a distinctive criterion for primary photons: cosmic-ray particles are charged and, at the sub-PeV energies we study here, isotropized in their directions and smeared in arrival times by the Galactic magnetic field. In this work, we use the entire sample to search for the gamma-ray excess associated with the neutrino event, then repeat the same procedure for the events selected by the “photon median” cut and check that the results are consistent. In this way, we both increase the available statistics and make the study less sensitive to the assumption about the source gamma-ray spectrum.
Previous Monte-Carlo simulations for this (Alexeenko et al., 2003) and other Gorbunov et al. (2006) air-shower experiments indicated that counting of events within the (86–90)% PSF containment angle is optimal in terms of the signal-to-noise ratio for point-source searches. In what follows, we concentrate on the circular region in the sky of this (86% PSF) 4.7∘ angular radius, centered at the 4th Fermi-LAT source catalog 4FGL (Abdollahi et al., 2020) best-fit position of the source 4FGL J2028.64110e (catalog ), associated with the Cygnus Cocoon, and call this region the Cygnus-Cocoon Circle (CCC).
In the full 3-year Carpet–2 data sets, defined above, the number of events in CCC is consistent with that expected from random background, so the source is not detected significantly above 300 TeV. We obtain an upper limit on its integral gamma-ray flux as cm-2s-1 (95% CL). The situation is different when the time period around the neutrino event is considered.
To search for a flux enhancement around the neutrino event, we proceed as follows. Denote the total number of events observed from the CCC as . Since we have no prejudice about the possible flare time window, we consider the duration of the putative flare as a free parameter and vary between 1 and 60 days around the neutrino event, in steps of 1 day. For each of these 60 time windows, we determine the number of events from CCC in this period and calculate the binomial probability to observe this or larger number of events assuming constant mean rate of events per day. We then find the pre-trial p-value . To estimate the effect of multiple trials, we perform a Monte-Carlo simulation of mock sets of arrival times of events. For each mock set , we repeat the same procedure of varying the window width and finding the mock pre-trial p-value, . The fraction of mock sets with gives the post-trial probability which determines the significance of the observed effect, if any.
4 Results and discussion
There are events with arrival directions from CCC during 829 days of data collection, of which 5 are “photon median candidates”. Figure 1
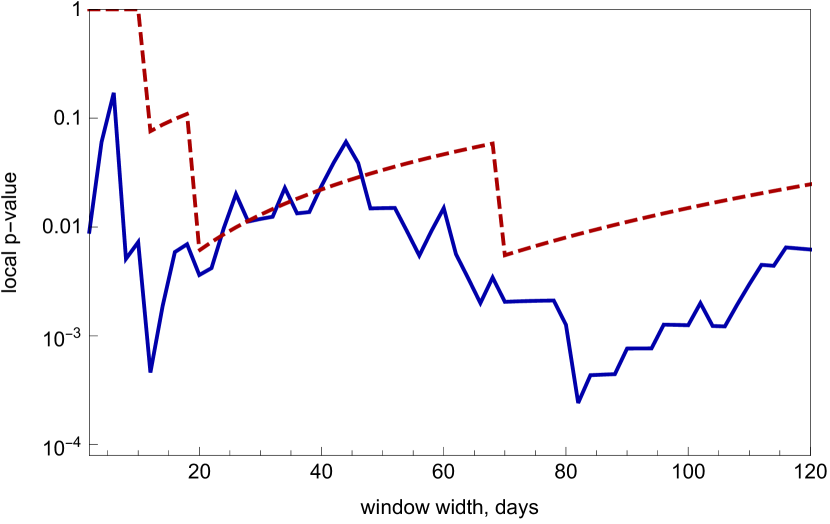
presents the probability for these two sets. For the full set, and is achieved for (we note however that is almost that low). Stated in Gaussian terms, this value of would correspond to the 3.67 (pre-trial) significance of the flare at the neutrino arrival time. However, the correction for window-width trials reduces the significance to (3.17 post-trial). The results for photon median candidate selection alone are ( pre-trial), optimal and ( post-trial). Figure 2
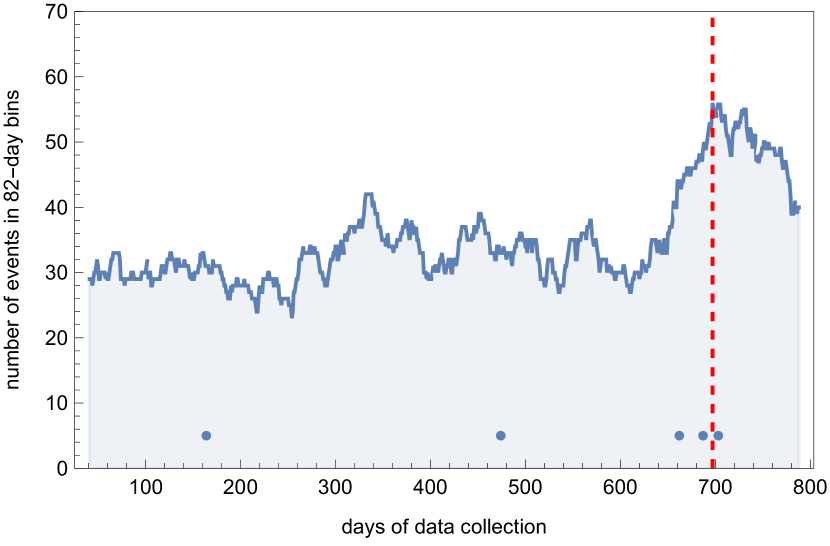
presents the number of events in a sliding window of the width days of data collection centered at a certain date, as a function of this date. One can clearly see the enhancement around the neutrino event, consistent between all events and photon median candidates.
While the strongest signal was found for a flare with the duration of 82 days of data collection (85 calendar days), this particular number may be altered by fluctuations. The number of excess events is obtained from the time window which is tuned to have the strongest signal, so it may also be biased. The time-window correction which eliminates the effect of the flare duration tuning is applied, and the photon-flare parameters are estimated by Monte-Carlo simulations, see Appendix A. We obtain the flare duration of days and the source flux during this flare of cm-2s-1. We also define the fluence as the flux time-integrated over the flare, GeV/cm2.
It is instructive to compare this fluence in TeV photons with an estimate of the fluence of the putative neutrino flare. IceCube did not find a statistically significant excess of low-energy neutrinos associated with the alert on a day scale (Pizutto & IceCube Collaboration, 2020), nor additional high-energy neutrino alerts from this direction were reported, so the rough estimate of the neutrino fluence is determined by the single alert event (Lagunas Gualda et al., 2020) and, given the IceCube effective area for the BRONZE alert selection (Blaufuss et al., 2019), is of order GeV/cm2 (Dzhappuev et al., 2020a)222This gives an order-of-magnitude estimate only because of the Eddington bias in the flux estimation of a single event, cf. Strotjohann et al. (2019), large uncertainties in the energy estimation of track events and the lack of information about neutrino events in the days around the alert.. Therefore, the orders of magnitude of the observed fluences are consistent with each other: in the standard pi-meson neutrino production mechanism, the energy in gamma rays is about twice the energy in neutrinos.
Small statistics and large background make it unfeasible to derive the observed gamma-ray spectrum above 300 TeV. However, we note that a comparison of the numbers of excess of events in the full data set and among the photon median candidates speaks in favor of a hard spectrum: the excess in the former is larger than twice the excess in the latter. For instance, for a very hard spectrum, only 1/3 of photons pass the median cut designed assuming spectrum we use. Such hard spectra do not look implausible in view of recent theoretical (Bykov et al., 2018) and observational (Dzhatdoev & Podlesnyi, 2021) results.
Additionally, we reconstructed the spectral energy distribution (SED ) of Cygnus Cocoon in the energy range from MeV to TeV averaged over the same -day period around the neutrino arrival using publicly available data of the Fermi Large Area Telescope (Fermi-LAT) (Atwood et al., 2009). The region of interest (ROI) in our analysis was a square centered at the 4FGL position of the Cygnus Cocoon. Making use of fermitools333https://github.com/fermi-lat/Fermitools-conda (version 2.0.8) and fermipy (version 1.0.1) (Wood et al., 2017) packages and the instrument response function P8R3_SOURCE_V3, we constructed a model of the observed gamma-ray emission from the ROI containing 4FGL sources, including our source of interest 4FGL J2028.64110e (catalog ); models of the isotropic gamma-ray background iso_P8R3_SOURCE_V3_v1 and the galactic diffuse emission gll_iem_v07. Normalizations of both diffuse backgrounds and the spectral shape of the galactic diffuse emission, along with all spectral parameters of the source of interest, were left free. The normalizations for other sources within from the ROI center were also left free, but their spectral shapes and all parameters of sources beyond the -circle were fixed to the catalog values. Other event selection parameters were set according to the standard recommendations of the Fermi-LAT collaboration for a galactic point source analysis444https://fermi.gsfc.nasa.gov/ssc/data/analysis/documentation/Cicerone/Cicerone_Data_Exploration/Data_preparation.html. Using GTAnalysis.sed fermipy method we obtained the SED of 4FGL J2028.64110e (catalog ) averaged over the -day flare period. We found an indication ( significance) of the spectrum hardening with respect to the spectrum of the Cygnus Cocoon presented in the 4FGL catalog. Figure 3
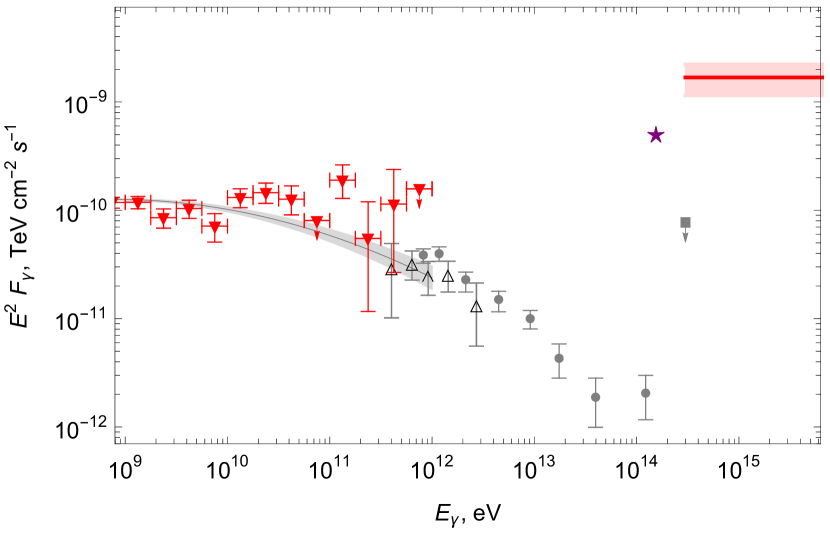
compares our observations with other high-energy data. Unfortunately, no simultaneous data on the month-scale flare related to the neutrino arrival have yet been published by other experiments.
The source entered the field of view of Carpet–2 16 minutes after the neutrino arrival. Like HAWC (Ayala et al., 2020), we do not find a significant flux enhancement within 24 hours from the neutrino (Dzhappuev et al., 2020b). However, we observed a very unusual cluster of events at the scale of minutes on the day of the neutrino alert; its significance and implications will be discussed elsewhere.
5 Conclusions
An excess of events was observed by Carpet–2 from the direction of the Cygnus region in temporal coincidence with the IceCube neutrino alert from the same direction. Statistical significance of the excess is 3.1 post-trial. The excess may be interpreted as a TeV photon flare with the duration of months around the neutrino event and the fluence of GeV/cm2. For the first time, rare sub-PeV neutrino and gamma rays from the direction of a prospective Galactic PeVatron were observed in directional and temporal coincidence. This observation supports previously proposed scenarios of the origin of a part of observed high-energy neutrinos in pi-meson decays in Galactic sources. Note that poor localization of the neutrino event, as well as modest angular resolution of Carpet-2, leave open the possibility of the association of these events with other interesting sources in CCC, including the gamma-ray loud microquasar Cyg X-3, gamma-ray binary PSR J20324027 etc.
This possible sub-PeV flare may be searched in the recorded data of other gamma-ray air-shower experiments, LHAASO (Cao, 2010), HAWC (Abeysekara et al., 2013), Tibet (Sako et al., 2009), GRAPES-3 (Hayashi et al., 2005) and TAIGA (Budnev et al., 2020), as well as of neutrino telescopes, IceCube (Aartsen et al., 2017) in the track mode and ANTARES (Ageron et al., 2011) and Baikal-GVD (Avrorin et al., 2011) in the cascade mode. Future monitoring of the source by these instruments, as well as by the upgraded Carpet–3 (Kudzhaev et al., 2019), is also encouraged.
Appendix A Estimation of the flare duration and fluence
Estimation of the number of signal events.
Assume that the flare flux corresponds to photons during the flare period and the photon spectrum is . Of them, on average, we expect the excess of photon median candidates and other events above the background rates of for photon median candidates and for the rest of events (determined from the off-flare period of observations). We thus expect to observe photon candidates and other events during the flare, but all these numbers fluctuate. To determine , we maximize the probability to observe the actual numbers of events, photon candidates and other events, simultaneously. We find ; this number is divided by the effective exposure to determine the flux. Note that the probability to observe and events in the respective data sets is for this , so the two observations are consistent at the 93% CL.
Correction of the biases caused by trials.
The flare window was chosen such that the excess is most significant. This procedure selects a positive fluctuation in the number of observed, signal plus background, events (the post-trial significance accounts for this). Thus this best duration of the flare and the corresponding excess flux are biased. To correct for this effect, we perform a Monte-Carlo simulation of the entire procedure, assuming the flare parameters determined above. For each simulated realization of the events, we find the strongest-signal flux and duration. We then compare these reconstructed fluxes and durations with those assumed in the simulation. The reconstructed flux and duration differ from the true values by factors of 0.86 and 1.08, respectively. These coefficients are accounted for in the values reported in the main text.
References
- Aartsen et al. (2013a) Aartsen, M. G., Abbasi, R., Abdou, Y., et al. 2013a, Phys. Rev. Lett., 111, 021103, doi: 10.1103/PhysRevLett.111.021103
- Aartsen et al. (2013b) Aartsen, M. G., et al. 2013b, Science, 342, 1242856, doi: 10.1126/science.1242856
- Aartsen et al. (2017) Aartsen, M. G., et al. 2017, JINST, 12, P03012, doi: 10.1088/1748-0221/12/03/P03012
- Aartsen et al. (2019) —. 2019, Astrophys. J., 886, 12, doi: 10.3847/1538-4357/ab4ae2
- Abbasi et al. (2020) Abbasi, R., et al. 2020. https://arxiv.org/abs/2011.03545
- Abdollahi et al. (2020) Abdollahi, S., Acero, F., Ackermann, M., et al. 2020, ApJS, 247, 33, doi: 10.3847/1538-4365/ab6bcb
- Abeysekara et al. (2013) Abeysekara, A. U., et al. 2013, Astropart. Phys., 50-52, 26, doi: 10.1016/j.astropartphys.2013.08.002
- Abeysekara et al. (2019a) Abeysekara, A. U., Albert, A., Alfaro, R., et al. 2019a, ApJ, 881, 134, doi: 10.3847/1538-4357/ab2f7d
- Abeysekara et al. (2019b) —. 2019b, ApJ, 881, 134, doi: 10.3847/1538-4357/ab2f7d
- Abeysekara et al. (2020) —. 2020, Phys. Rev. Lett., 124, 021102, doi: 10.1103/PhysRevLett.124.021102
- Abeysekara et al. (2021) —. 2021, Nature Astronomy, doi: 10.1038/s41550-021-01318-y
- Abraham et al. (2008) Abraham, J., et al. 2008, Astropart. Phys., 29, 243, doi: 10.1016/j.astropartphys.2008.01.003
- Ackermann et al. (2011) Ackermann, M., Ajello, M., Allafort, A., et al. 2011, Science, 334, 1103, doi: 10.1126/science.1210311
- Ageron et al. (2011) Ageron, M., Aguilar, J. A., Al Samarai, I., et al. 2011, NIM A, 656, 11, doi: 10.1016/j.nima.2011.06.103
- Ahlers & Halzen (2018) Ahlers, M., & Halzen, F. 2018, PPNP, 102, 73, doi: 10.1016/j.ppnp.2018.05.001
- Albert et al. (2018) Albert, A., et al. 2018, ApJ, 868, L20, doi: 10.3847/2041-8213/aaeecf
- Albert et al. (2020) Albert, A., Alfaro, R., Alvarez, C., et al. 2020, ApJ, 896, L29, doi: 10.3847/2041-8213/ab96cc
- Albert et al. (2021) Albert, A., et al. 2021, ApJ, 907, L30, doi: 10.3847/2041-8213/abd77b
- Alexeenko et al. (2003) Alexeenko, V. V., Bakatanov, V. N., Dzhappuev, D. D., et al. 2003, “Carpet” installation: estimate of the angular resolution with a Cherenkov radiation detector, Tech. Rep. 1109, INR RAS
- Amenomori et al. (2021) Amenomori, M., et al. 2021, Phys. Rev. Lett., 126, 141101, doi: 10.1103/PhysRevLett.126.141101
- Atwood et al. (2009) Atwood, W. B., Abdo, A. A., Ackermann, M., Althouse, W., & B. Anderson et al. 2009, ApJ, 697, 1071, doi: 10.1088/0004-637x/697/2/1071
- Avrorin et al. (2011) Avrorin, A., et al. 2011, NIM A, 639, 30, doi: 10.1016/j.nima.2010.09.137
- Ayala et al. (2020) Ayala, H., et al. 2020, GRB Coordinates Network, 28952, 1
- Bartoli et al. (2014) Bartoli, B., Bernardini, P., Bi, X. J., et al. 2014, ApJ, 790, 152, doi: 10.1088/0004-637X/790/2/152
- Blaufuss et al. (2019) Blaufuss, E., Kintscher, T., Lu, L., & Tung, C. F. 2019, in International Cosmic Ray Conference, Vol. 36, 36th International Cosmic Ray Conference (ICRC2019), 1021. https://arxiv.org/abs/1908.04884
- Budnev et al. (2020) Budnev, N., et al. 2020, JINST, 15, C09031, doi: 10.1088/1748-0221/15/09/C09031
- Bykov et al. (2018) Bykov, A. M., Ellison, D. C., Gladilin, P. E., & Osipov, S. M. 2018, Advances in Space Research, 62, 2764, doi: 10.1016/j.asr.2017.05.043
- Bykov et al. (2020) Bykov, A. M., Marcowith, A., Amato, E., et al. 2020, Space Sci. Rev., 216, 42, doi: 10.1007/s11214-020-00663-0
- Cao (2010) Cao, Z. 2010, Chin. Phys. C, 34, 249, doi: 10.1088/1674-1137/34/2/018
- Cao et al. (2021) Cao, Z., Aharonian, F. A., An, Q., et al. 2021, Nature, 594, 33, doi: 10.1038/s41586-021-03498-z
- Chen et al. (2015) Chen, C.-Y., Bhupal Dev, P. S., & Soni, A. 2015, Phys. Rev. D, 92, 073001, doi: 10.1103/PhysRevD.92.073001
- Dzhappuev et al. (2020a) Dzhappuev, D., Kudzhaev, A., Petkov, V., & Troitsky, S. 2020a, The Astronomer’s Telegram, 14255, 1
- Dzhappuev et al. (2020b) —. 2020b, The Astronomer’s Telegram, 14237, 1
- Dzhappuev et al. (2016) Dzhappuev, D. D., Petkov, V. B., Kudzhaev, A. U., et al. 2016, in Quark Phase Transition in Compact Objects and Multimessenger Astronomy: Neutrino Signals, Supernovae and Gamma-Ray Bursts, ed. V. V. Sokolov, V. V. Vlasyuk, & V. B. Petkov, 30–36. https://arxiv.org/abs/1511.09397
- Dzhappuev et al. (2007) Dzhappuev, D. D., Alekseenko, V. V., Volchenko, V. I., et al. 2007, Bulletin of the Russian Academy of Sciences, Physics, 71, 525, doi: 10.3103/S1062873807040260
- Dzhappuev et al. (2019a) Dzhappuev, D. D., Dzaparova, I. M., Gorbacheva, E. A., et al. 2019a, EPJ Web of Conf., 207, 03004, doi: 10.1051/epjconf/201920703004
- Dzhappuev et al. (2019b) —. 2019b, JETP Letters, 109, 226, doi: 10.1134/S0021364019040015
- Dzhappuev et al. (2020c) Dzhappuev, D. D., Afashokov, Y. Z., Dzaparova, I. M., et al. 2020c, JETP Letters, 112, 753, doi: 10.1134/S0021364020240029
- Dzhatdoev & Podlesnyi (2021) Dzhatdoev, T., & Podlesnyi, E. 2021, arXiv e-prints, arXiv:2101.10781. https://arxiv.org/abs/2101.10781
- Gorbunov et al. (2006) Gorbunov, D. S., Tinyakov, P. G., Tkachev, I. I., & Troitsky, S. V. 2006, JCAP, 01, 025, doi: 10.1088/1475-7516/2006/01/025
- Hayashi et al. (2005) Hayashi, Y., et al. 2005, NIM A, 545, 643, doi: 10.1016/j.nima.2005.02.020
- Kudzhaev et al. (2019) Kudzhaev, A. U., et al. 2019, J. Phys. Conf. Ser., 1390, 012129, doi: 10.1088/1742-6596/1390/1/012129
- Lagunas Gualda et al. (2020) Lagunas Gualda, C., et al. 2020, GRB Coordinates Network, 28927, 1
- Nikishov (1962) Nikishov, A. I. 1962, JETP, 14, 393
- Palladino et al. (2016) Palladino, A., Spurio, M., & Vissani, F. 2016, JCAP, 12, 045, doi: 10.1088/1475-7516/2016/12/045
- Palladino et al. (2020) Palladino, A., Spurio, M., & Vissani, F. 2020, Universe, 6, 30, doi: 10.3390/universe6020030
- Palladino & Vissani (2016) Palladino, A., & Vissani, F. 2016, Astrophys. J., 826, 185, doi: 10.3847/0004-637X/826/2/185
- Pizutto & IceCube Collaboration (2020) Pizutto, A., & IceCube Collaboration. 2020, GRB Coordinates Network, 28946, 1
- Plavin et al. (2021) Plavin, A. V., Kovalev, Y. Y., Kovalev, Y. A., & Troitsky, S. V. 2021, ApJ, 908, 157, doi: 10.3847/1538-4357/abceb8
- Sako et al. (2009) Sako, T. K., Kawata, K., Ohnishi, M., et al. 2009, Astropart. Phys., 32, 177, doi: 10.1016/j.astropartphys.2009.07.006
- Strotjohann et al. (2019) Strotjohann, N. L., Kowalski, M., & Franckowiak, A. 2019, Astron. Astrophys., 622, L9, doi: 10.1051/0004-6361/201834750
- Szabelski et al. (2009) Szabelski, J., et al. 2009, Nuclear Physics B Proceedings Supplements, 196, 371, doi: 10.1016/j.nuclphysbps.2009.09.069
- Troitsky et al. (2019) Troitsky, S., Dzhappuev, D., & Zhezher, Y. 2019, in International Cosmic Ray Conference, Vol. 36, 36th International Cosmic Ray Conference (ICRC2019), 808. https://arxiv.org/abs/1907.10893
- Wood et al. (2017) Wood, M., Caputo, R., Charles, E., et al. 2017, Fermipy: An open-source Python package for analysis of Fermi-LAT Data. https://arxiv.org/abs/1707.09551
- Yoast-Hull et al. (2017) Yoast-Hull, T. M., Gallagher, J. S., Halzen, F., Kheirandish, A., & Zweibel, E. G. 2017, Phys. Rev. D, 96, 043011, doi: 10.1103/PhysRevD.96.043011