FloorPlanCAD: A Large-Scale CAD Drawing Dataset for Panoptic Symbol Spotting
Abstract
Access to large and diverse computer-aided design (CAD) drawings is critical for developing symbol spotting algorithms. In this paper, we present FloorPlanCAD, a large-scale real-world CAD drawing dataset containing over 15,000 floor plans, ranging from residential to commercial buildings. CAD drawings in the dataset are all represented as vector graphics, which enable us to provide line-grained annotations of 35 object categories. Equipped by such annotations, we introduce the task of panoptic symbol spotting, which requires to spot not only instances of countable things, but also the semantic of uncountable stuff. Aiming to solve this task, we propose a novel method by combining Graph Convolutional Networks (GCNs) with Convolutional Neural Networks (CNNs), which captures both non-Euclidean and Euclidean features and can be trained end-to-end. The proposed CNN-GCN method achieved state-of-the-art (SOTA) performance on the task of semantic symbol spotting, and help us build a baseline network for the panoptic symbol spotting task. Our contributions are three-fold: 1) to the best of our knowledge, the presented CAD drawing dataset is the first of its kind; 2) the panoptic symbol spotting task considers the spotting of both thing instances and stuff semantic as one recognition problem; and 3) we presented a baseline solution to the panoptic symbol spotting task based on a novel CNN-GCN method, which achieved SOTA performance on semantic symbol spotting. We believe that these contributions will boost research in related areas. The dataset and code is publicly available at https://floorplancad.github.io/.

1 Introduction
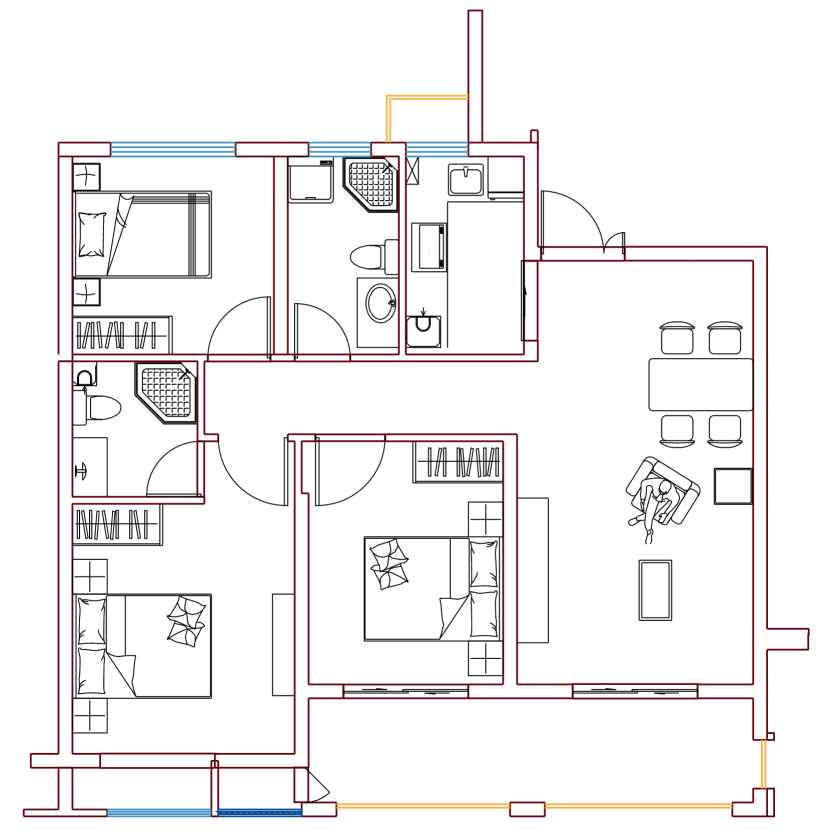
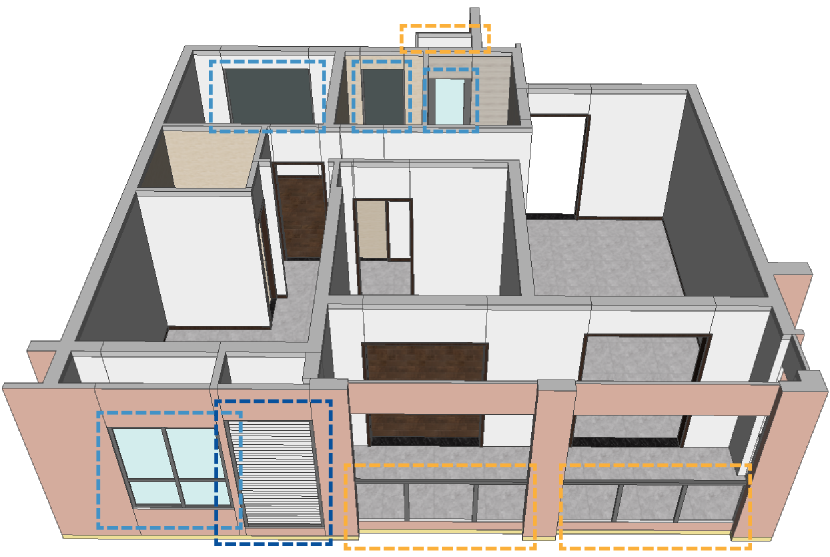
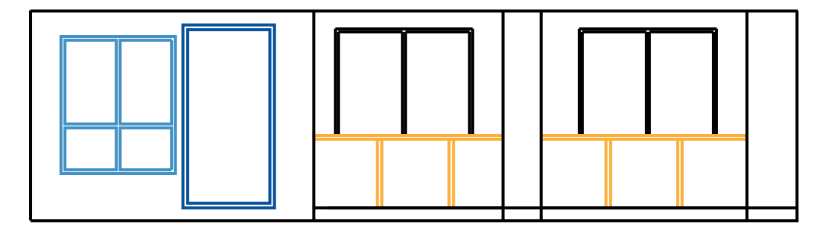
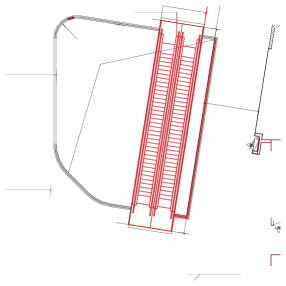
The perception of 2D computer-aided design (CAD) drawings plays a crucial role for creating 3D prototypes, also known as “digital twins”, see Figure 1, in architecture, engineering and construction (AEC) industries. A CAD drawing typically conveys accurate geometric and rich semantic information of a cross section of a 3D design. By integrating information from a group of CAD drawings, the according 3D model can be precisely reconstructed. For example, 3D buildings can be faithfully encoded by a bunch of 2D floor plans, which are detailed CAD drawings compose of line segments, arcs, curves, and texts, see Figure 1. Automatic perception of CAD drawings will lead to efficient 3D modeling approaches, saving vast amount of labor work. That is especially true for architectures, which usually contain massive components and might cost months for creating detailed 3D models.
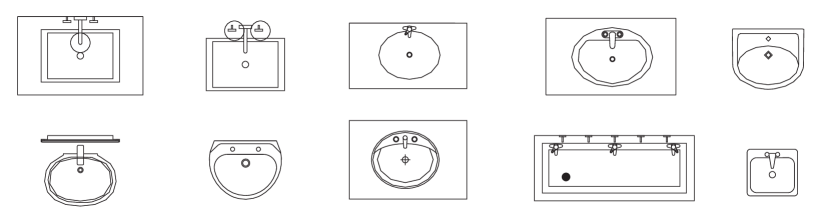
Symbol spotting refers to the recognition of graphic symbols embedded in the context of large digital drawings [31]. It is typically carried out as query-by-example approaches [28, 27, 35], where candidate regions that might contain the given query symbol are obtained. These approaches are impractical in real-world scenarios, because symbols representing the same object might vary fiercely, see Figure 2. To cope with the variability of symbols, a recent work [32] attempted learning-based approach on real-world floor plan drawings, but they treat CAD drawings as pixel images, losing the accuracy of vector graphics and leading to possibly inaccurate annotations and predictions.
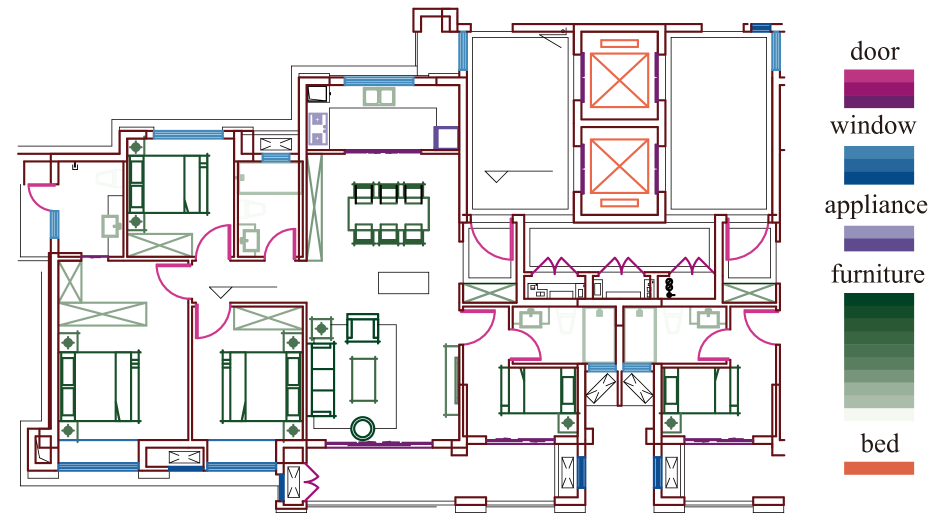
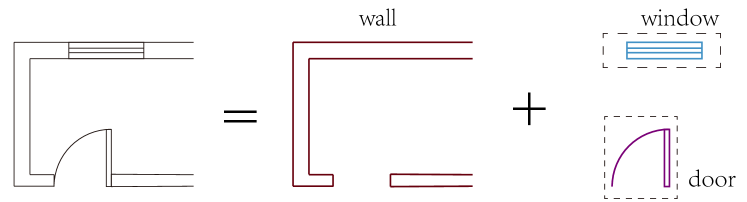
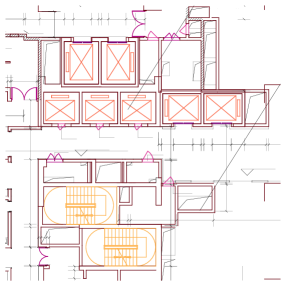
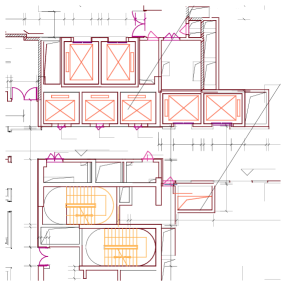
Traditional symbol spotting approaches focus on instance detection, therefore cannot deal with semantic of uncountable stuff. For example, these methods cannot detect the wall in CAD drawings, which is usually represented by a group of parallel lines with large span, see Figure 3. Following ideas in [19], we consider the instance spotting of countable things and the semantic detection of uncountable stuff as one visual recognition task, which is called panoptic symbol spotting.
In practice, CAD drawings play the role of universal language among practitioners in AEC industries, including designers, engineers, constructors, who share a common knowledge set. This observation inspires us to adopt learning methods for recognition tasks on CAD drawings, which demands comprehensive annotated data for training and testing networks.
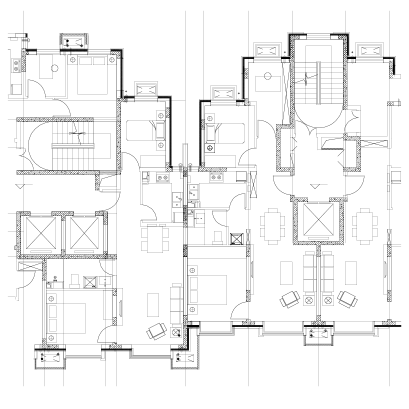
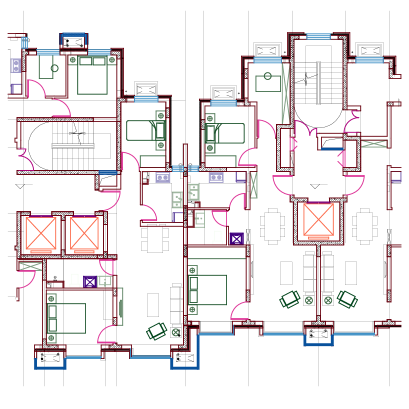
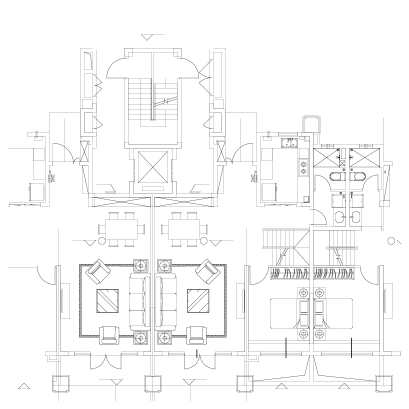
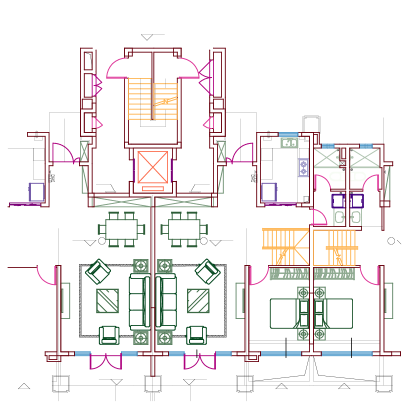
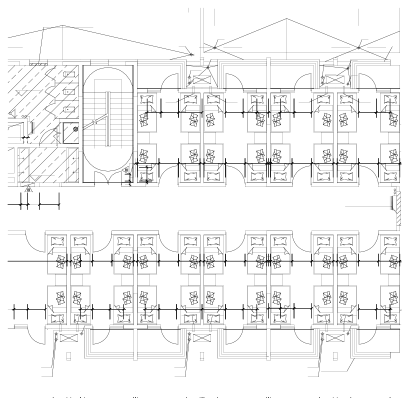
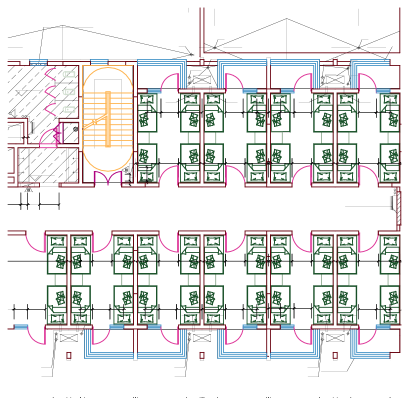
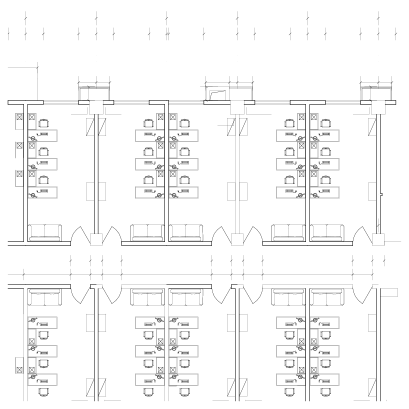
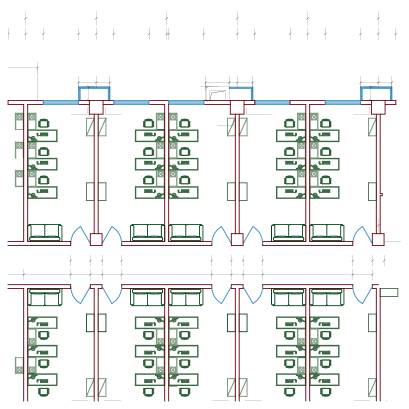
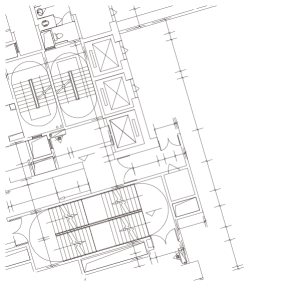
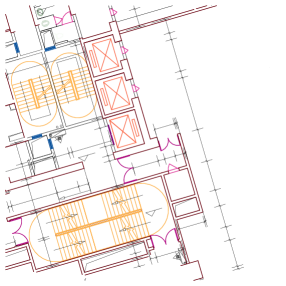
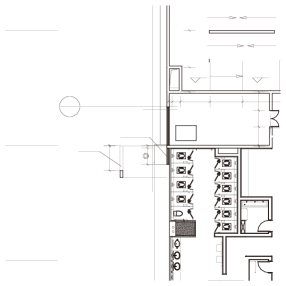
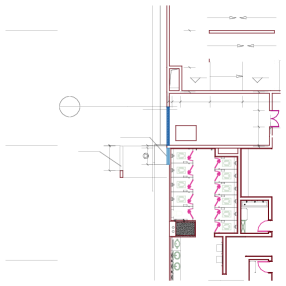
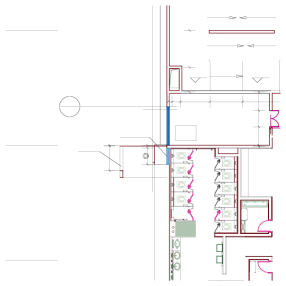
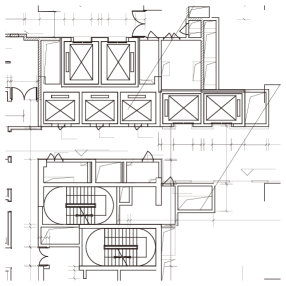
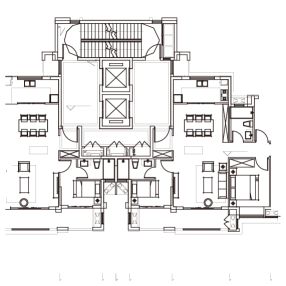
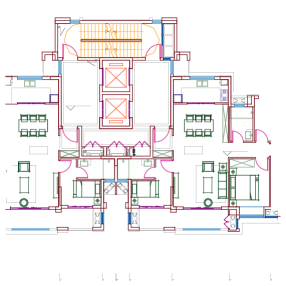
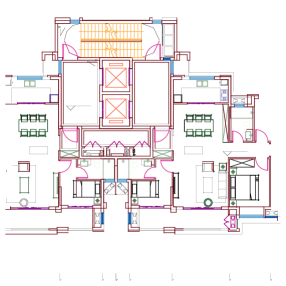
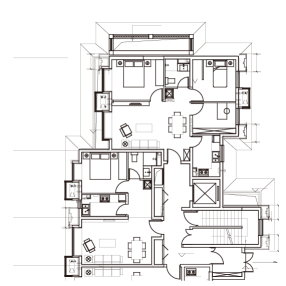
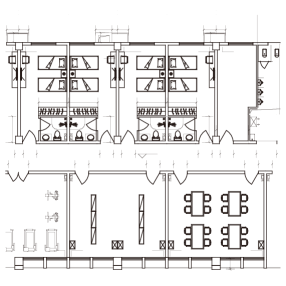
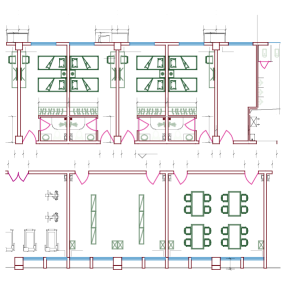
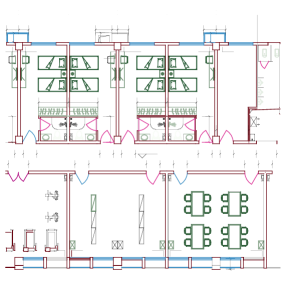
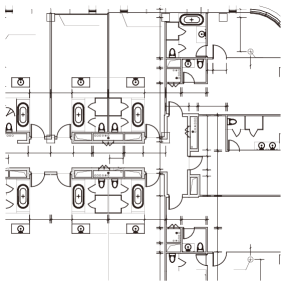
We build a large-scale dataset of over 15,000 floor plans in the form of vector graphics. These floor plans are collected from public repositories of real-world architecture projects across the industries. To help researchers processing those drawings, we parse the initial proprietary “.dwg” file to the open standard “.svg” format and crop each floor plan into regular smaller blocks. At the end, floor plan blocks in the dataset only contain geometric and structural information, as illustrated in Figure 3(a). We select 35 object categories of our interest, and provide line-grained annotations, see Figure 3(b).
The property of vector graphics enable us to apply graph convolutional networks (GCNs), which is computational efficient due to its sparsity, and is good at extracting non-Euclidean features via topology connections. For each floor plan, we build a graph, whose nodes are graphic entities, e.g. straight segment, arc, and edges are created according to their adjacency.
In our experiments, we found that Euclidean features captures by Convolutional Neural Networks (CNNs) can improve the performance. Therefore we propose a novel network combining GCNs and CNNs, which achieves state-of-the-art performance on the semantic symbol spotting task, and leads us to a baseline network for the panoptic symbol spotting task.
The goal of our research is to push the development of perception on the CAD drawing by providing large-scale annotated dataset and a baseline algorithm. Our main contributions are:
-
•
We present a large-scale real-world dataset of over 15,000 CAD drawings with line-grained annotations, covering various types of buildings, e.g. residential towers, schools, hospitals, shopping malls and office buildings. To the best of our knowledge, it is the first of its kind.
-
•
We introduce the task of panoptic symbol spotting, which is a generalization of the traditional symbol spotting problem, considering the instance spotting of countable things and the semantic labeling of uncountable stuff as one recognition task. A panoptic metric is provided for evaluating the prediction quality of various methods.
-
•
We propose a CNN-GCN method, which achieved state-of-the-art performance on the semantic symbol spotting task, and help us build a unified baseline network for the panoptic symbol spotting task.
2 Related Work
In this section we briefly summarize existing datasets and methods in related areas, including symbol spotting, sketch segmentation and panoptic segmentation.
Existing datasets
The impact of a proper dataset for pushing the development in an area has been widely recognized. For instance, ImageNet [36] for image recognition, Matterport3D [1] for RGB-D scene understanding and ShapeNet [2] for 3D shape perception. SESYD [8] is is a database of synthetical vectorized graphic documents with corresponding ground truth including floor plans. FPLAN-POLY [33] dataset contains floor plans converted from images using a raster-to-vector algorithm [15] implemented in the QGar [9] library.
Symbol spotting
Symbol spotting [31, 35, 38] refers to the retrieval of graphical symbols embedded in larger images or documents [32]. Symbol retrieval and recognition in technical documents remains a challenge in the document analysis community [28]. Traditionally, hand-crafted symbol descriptors is designed to describe the shape [28, 27, 35]. Then the query symbol and the document is matched with the sliding window or information retrieval techniques. Graph representation and matching [11, 10, 12] is also used but more sensitive to the noise and topology error. These methods work well on isolated symbols but fail significantly when symbols are embedded in documents. Recently, an image based deep learning method is proposed [32] and achieves the best result on existing public datasets [8, 33].
Semantic sketch segmentation
Semantic sketch segmentation aims to label pixels into semantic groups on freehand sketched line images [39, 16, 22, 46]. Sun et al. [39] segment the cluttered sketch into multiple parts first, and then detect semantically meaningful objects by leveraging a web-scale clipart database. Huang et al. [16] formulate the problem as a mixed integer programming problem, and present a data-driven solution. By treating the input as a 2D point set and encode the stroke structure information into graph, Yang et al. [46] predict the per-point labels with a Graph Convolutional Networks (GCNs).
Panoptic segmentation
In computer vision, countable things are referred to as instances, such as doors, windows, and tables [14, 23, 24]. Uncountable stuff that extends in amorphous regions of similar texture or material has no instance and only semantic, such as sky, road, and wall [4, 5, 37]. Kirillov et al. [19] take instance and semantic segmentation into one visual recognition task and coin the phrase panoptic segmentation. It tries to assign stuff pixels with semantic label and detect each object with a bounding box or segmentation mask at the same time [19, 18, 45]. BANet [6] introduces a bidirectional path between semantic and instance segmentation to improve the panoptic performance. The BGRNet [44] incorporates graph structure to mine the intra-modular and inter-modular relations.
3 Panoptic Symbol Spotting

Traditional symbol spotting techniques [35, 38] mostly study things – countable symbols such as windows, doors, tables [31]. Stuff – amorphous symbols of similar objects or material such as vegetation, wall, road – is barely discussed. Similar to the panoptic segmentation in [19], we propose and study a task named panoptic symbol spotting, which considers semantic detection of stuff as well as instance spotting of things.
Generalized symbol
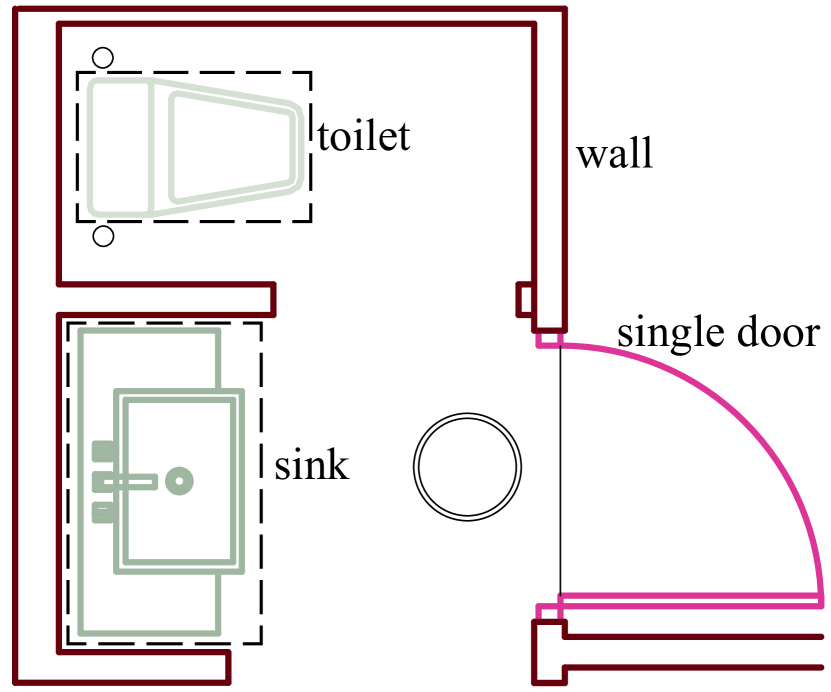
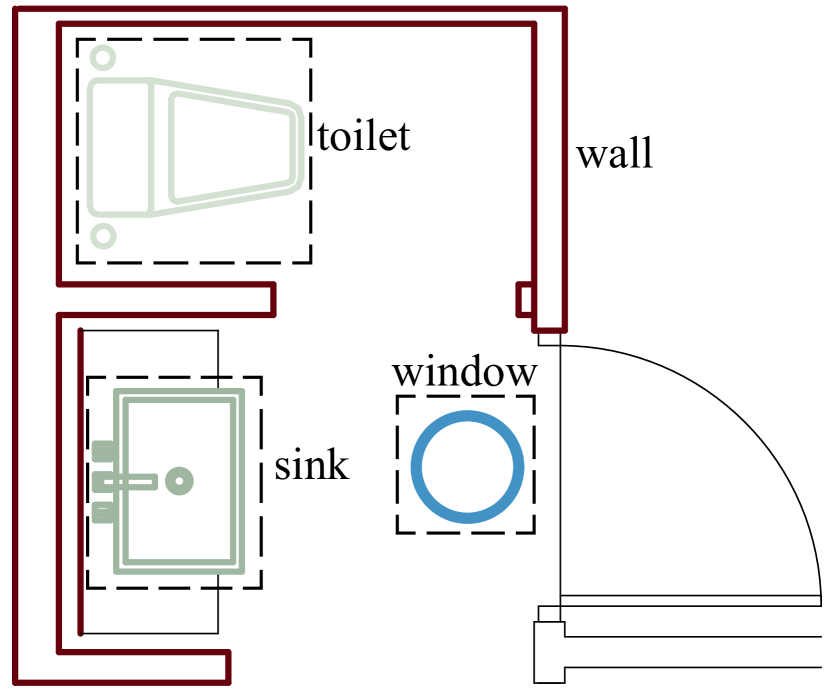
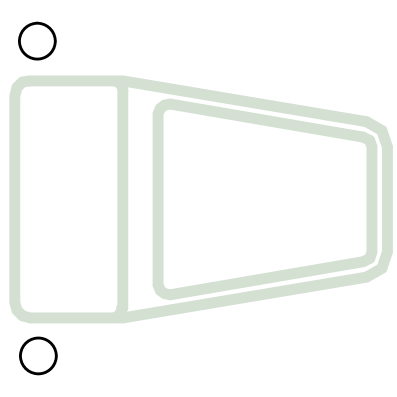
Symbols are graphical entities that hold a semantic meaning in a specific domain, such as logos, silhouettes and musical notes [34]. In the setting of CAD drawings, a generalized symbol is a set of graphical entities, representing either a thing instance, e.g. toilet, sink, door, or a particular stuff, e.g. wall, see Figure 4. We denote a graphical entity by a semantic label and an instance index , thus a symbol is defined as . For short, we demote a symbol as . Things of the same class share the same semantic label, while instance of things can be distinguished by their instance indices. Notably, we ignore the instance index of entities belonging to stuff. The selection of which classes are stuff or things is a design choice left to the creator of the dataset.
Task formation
Given a CAD drawing represented by a set of graphical entities , the panoptic symbol spotting task requires a map , where is a set of predetermined set of object classes, and is the number of possible instances. The semantic label set can be partitioned into stuff and things subsets, namely and . By ignoring the instance indices, the task is degraded to a semantic symbol spotting task . If we only focus on the thing classes , the panoptic symbol spotting is degraded to an instance symbol spotting task .
Panoptic metric
A predicted symbol is matched to a ground truth symbol if and , where the intersection over union (IoU) between two symbols are computed based on arc length ,
| (1) |
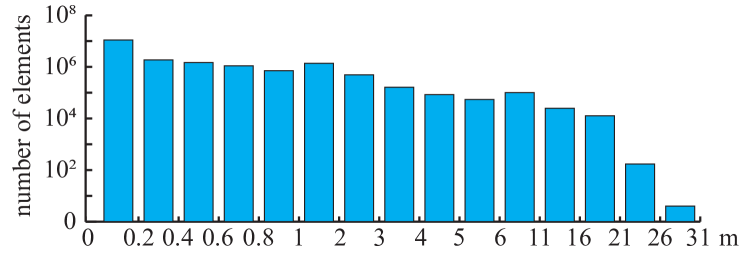
Here logarithm is adopted to degrade the influence of lines with very large span. Figure 5 shows the distribution of entity length, which spans from several millimeters to tens of meters. As proved in [19], this strategy produces a unique mapping: there can be at most one predicted symbol matched with each ground truth symbol. A predicted symbol is considered as true positive () if it can be matched to a ground truth symbol, otherwise false positives (). Missing ground truth symbols are marked as false negatives ().
The widely used score is used to measure the recognition quality:
| (2) |
By averaging the IoUs of matched symbols, the segmentation quality is measured by:
| (3) |
Similar to [19], our panoptic symbol spotting metric is defined as the multiplication of and :
| (4) |
Notably, this panoptic metric takes both thing and stuff symbols into account, proving a uniform quality measurement for evaluating panoptic symbol spotting methods.
| Dataset | source | scale | image | annotation | ||||
|---|---|---|---|---|---|---|---|---|
| #classes | #size | raster | vector | instance | semantic | vector | ||
| SESYD [8] | synthetic | 16 | 1000 | ✓ | ✓ | ✓ | ||
| FPLAN-POLY [33] | internet | 38 | 48 | ✓ | ✓ | |||
| BRIDGE [13] | internet | - | 13000 | ✓ | ||||
| FloorPlanCAD | industry | 35 | 15663 | ✓ | ✓ | ✓ | ✓ | ✓ |
4 The FloorPlanCAD dataset
We collect large-scale CAD drawings from public repositories of real-world architecture projects across the industries. Since the data is from different sources, it shows much more varieties in style and appearance of the objects. To the date of this revision, we have obtained over 100 projects including residential buildings, schools, hospitals, and large shopping malls with complicated structures.
4.1 Preproccess
In practice, architects tend to organize floors and related components of several buildings into one file, and a project usually has more than one file. Before getting started, we need to clip out every floor plan from the project files. The number of floor plans in a project is usually between 10 to 50, and now we have files of individual floor plans.
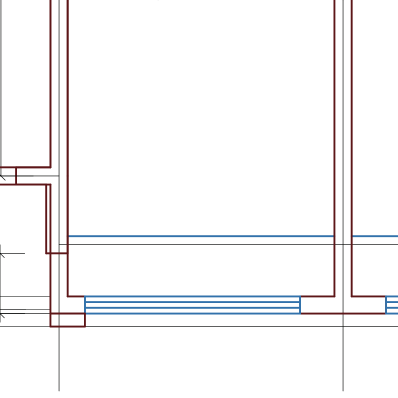
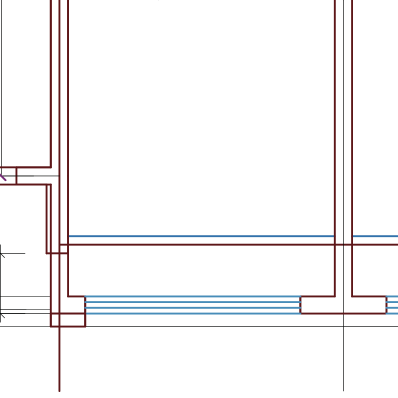
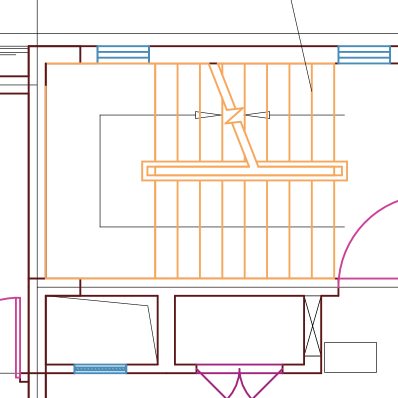
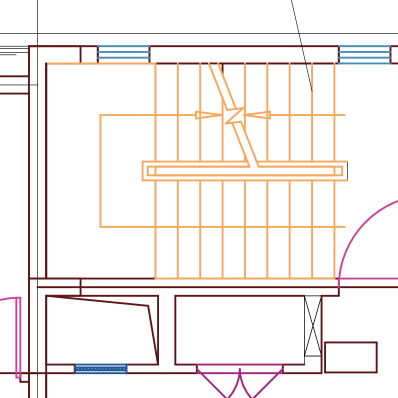
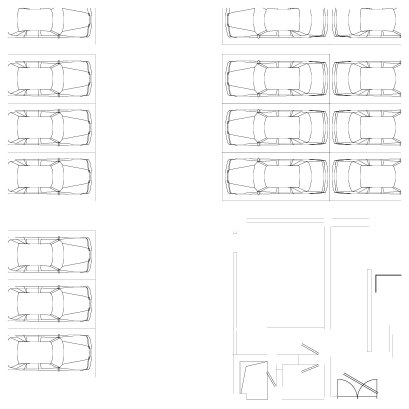
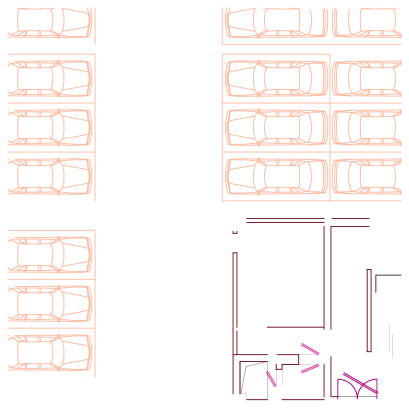
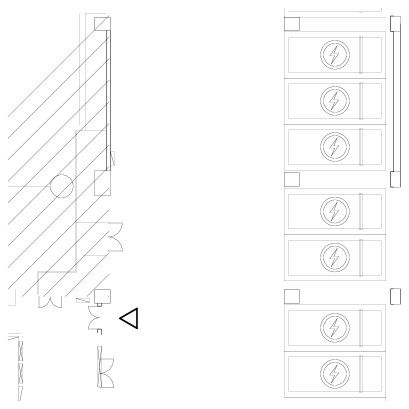
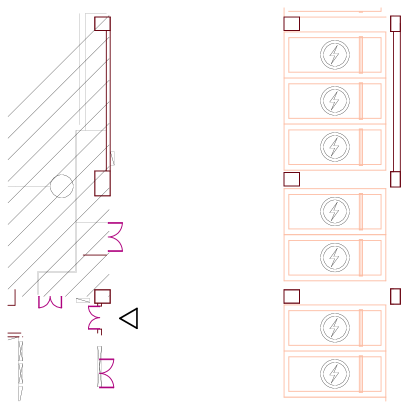
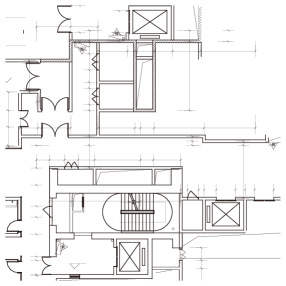
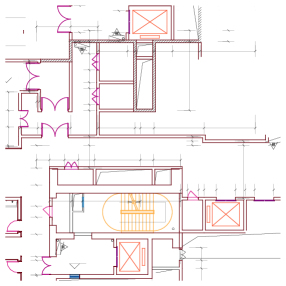
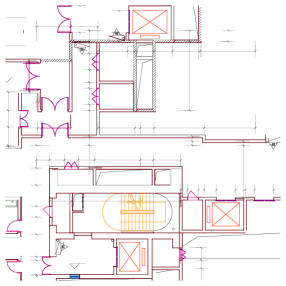
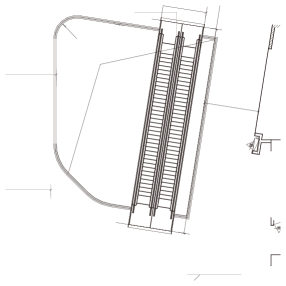
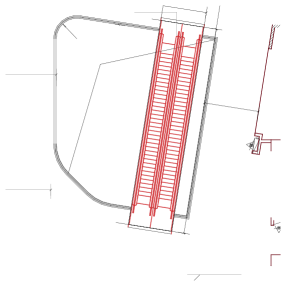
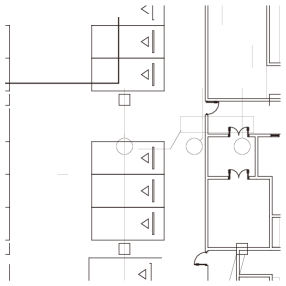
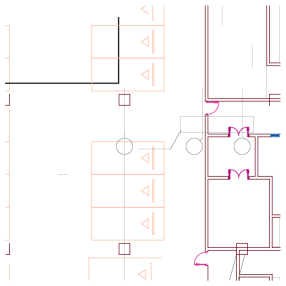
Generally, a floor plan drawing consists of dozens of layers distinguished by the functionality of the elements. The layer name does not necessarily explains its content, and the layer content might be quite messy because there is no restrictions on what should be grouped as a layer. The original multi-layer floor plan is firstly split into separate layers as shown in the Figure 6. The following annotation is performed on each layer that is much less cluttered, and boosts the annotation efficiency and effect significantly.
4.2 Annotation
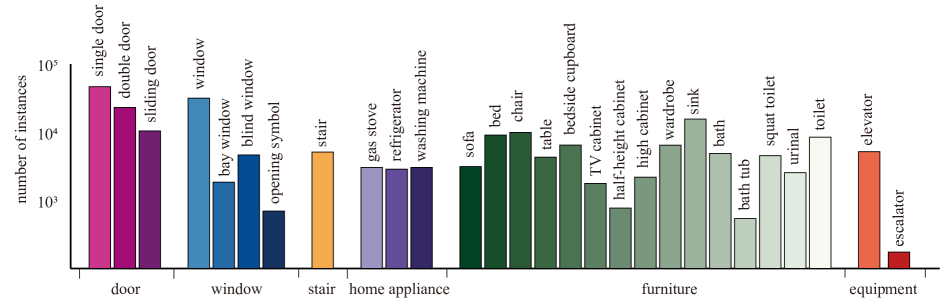
We choose 35 object classes of our interest including 30 thing classes in this revision. Some of them are listed in Figure 7, please visit our website for more details. Two stuff classes, wall and parking, are included because they are the very fundamental and dominant elements in floor plans. The wall serves as the basic structure for windows, doors, beams, etc. The wall and parking entities together accounts for about of the total entities (Table 6 in supplementary material), therefore is sufficient for studying the symbol spotting problem and solving the related task. We make parking as a semantic class, even though each parking slot can be treated as an instance. However they always appear side by side and span a huge area, it is reasonable to view them as an a whole parking space to reduce the burden in annotation.
11 specialists spend over 1,000 hours on creating line-grained annotations. To protect the privacy of the data owners, data obfuscation is conducted. First of all, fields that are classified as identifiable, personally or commercially sensitive are removed. Each floor plan is cut into squared blocks with dimension of and only of the blocks are kept in our dataset.
4.3 Properties
There are three key characteristics that make our dataset unique and valuable: large-scale, real-world, and vector graphics. It implies that studies on our dataset are more suitable to practical applications. Table 1 shows that we have much richer categories and larger amount of drawings comparing to SESYD [8] and FPLAN-POLY [33].
The annotated dataset is split into two sets: 60 projects are randomly chosen for training and the remaining for testing. Then our dataset consists of training and testing drawings with line-grained annotations. In the reported experiments, random CAD drawings are split from the training set for validation to mitigate over-fitting.
5 PanCADNet
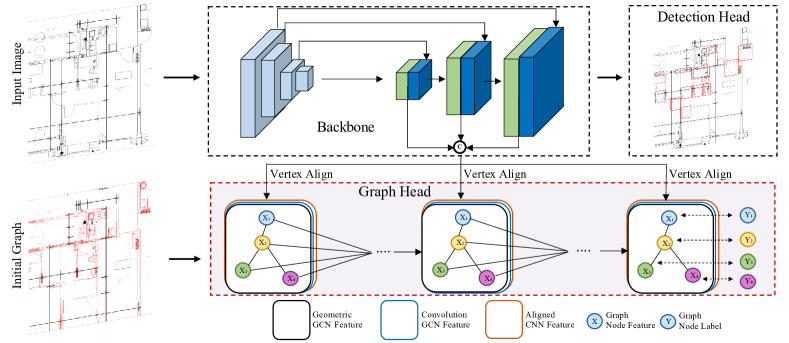
To tackle the panoptic symbol spotting problem, an end-to-end architecture named PanCADNet is proposed. It consists of a CNN backbone, a graph convolution head, and detection head, which are designed for semantic and instance symbol spotting respectively.
Graph construction
Given a CAD drawing, a graph is constructed, whose vertices are graphical entities . An edge is created for two vertices if their distance are close enough, namely :
| (5) |
where and represent the start and end points of the graphical entity respectively, regardless of its shape. For a pair of parallel lines, we slightly modify the distance as:
| (6) |
![[Uncaptioned image]](/html/2105.07147/assets/x19.png)
where is a scale factor for establishing parallelism connection for wall and windows. To keep the graph complexity low, at almost edges are allowed for every node by random dropping. In our dataset, we have . Figure on the right illustrates how a graph is constructed, where black dots represent nodes and red curves stands for edges.
Geometric features
Graphical entities in a symbol usually share properties such as scale, location, and types. We encode the length and the normalized center location of each vertex as its spatial features. In addition, the type (segment, circle or curve) of each vertex is encoded as a one-hot array , namely its type feature.
Textural features
CNN is capable of extracting multi-scale textural features from an image. To utilize the power of CNN, we follow Pixel2Mesh [43] to obtain the visual feature for each entity. Specifically, given the 2D coordinate of an entity , CNN features is fetched from the aligned position from feature pyramid networks [23]. Concatenating with the manually designed geometric features, the node features become .
Graph convolution
Applying the graph convolution network [17] on , the vertex aggregates information by propagating information from neighboring vertices,
| (7) |
where are neighbor vertices of graph vertex , and and are learnable parameters of the model. In our experiment, three graph convolution layers are used.
Detection head
Previous methods [13, 32] apply object detection models to retrieve instance indices of symbols. Similarly, we build a two-stage detectors head, namely Faster R-CNN, for instance symbol spotting. It takes the pyramid features from our backbone network as input and outputs a bounding box with category label and confidence for each detected symbol instance. The loss term in the detection head follows [30].
Loss function
As indicated in Figure 7, class imbalance in the training set is evident. As a result, we design a class weighted loss for GCN head. Here, we adopted weights for different classes by the number of entities in each class:
| (8) |
where , and are the ground truth and predicted labels of vertex , respectively. describes the probability of a prediction. By integrating loss terms of detection head and GCN head, we are able to train the whole system end-to-end,
| (9) |
where in our experiments.


6 Experiments
We first evaluate the proposed GCN head on semantic symbol spotting task with various image segmentation models to validate the effectiveness of the proposed module. Then, we test several detection-based methods and traditional symbol spotting methods on instance symbol spotting task. In the panoptic symbol spotting task, we apply the proposed model shown in Figure. 8 with tuned modules.
6.1 Semantic Symbol Spotting
We utilize the backbone and GCN head shown in Figure 8 as a network for semantic symbol spotting and validate the effectiveness of each component.
Datasets
In order to apply semantic segmentation models, annotation masks are generated by projecting graphical entities onto the background canvas with line width of 5 pixels during training.
Implementation
HRNetsV2 [42] is adopted to extract rich high resolution representations. We use Adam optimizer with and for the proposed GCN-based method. The training is done for 40k iterations with an initial learning rate of 0.0001, we scheduled the learning rate with cosine annealing [26]. To push the performance ahead, we adopt AM-Softmax [41] loss relacing the origin softmax loss. We train our method with 8 Nvidia GTX 2080Ti GPUs with 1 training samples on each GPU. All semantic segmentation models are trained for 40k iterations which corresponds to the 40k schedule in the mmsegmentation [7].
Benchmark Performance
In order to compare with traditional image segmentation method on our dataset, their label prediction on pixels are converted to label on entities by sampling and voting:
| (10) |
where indicates the sample point and is the predicted mask retrieved from the CNN output.
Quantitative results on semantic symbol segmentation task are shown in Table 3. We can see that our method with GCN module outperforms both HRNetsV2 [42] and DeepLabv3+ [5] significantly, with the improvement of on score and weighted score, whose weights are similarly defined as Equation 1. The qualitative results are shown in Figure 9. We can see that our method predicts noticeable better results, especially in class wall, where their lengths have statistical regularity and semantic segmentation methods may fail in the boundary areas.
6.2 Ablation Study on Semantic Symbol Spotting
| Spa. feat. | Type feat. | CNN feat. | Wei. loss | Am-softmax [41] | wF1. |
| ✓ | 0.199 | ||||
| ✓ | ✓ | 0.308 | |||
| ✓ | ✓ | ✓ | 0.755 | ||
| ✓ | ✓ | ✓ | ✓ | 0.759 | |
| ✓ | ✓ | ✓ | ✓ | ✓ | 0.798 |
Extensive ablation studies are performed to validate the effectiveness of our proposed method GCN network. As we can see in Table 2, GCN itself with simple geometric features is the worst and strong visual CNN features from the backbone boost the model accuracy significantly. With topology embedded in the graph convolutional layers, it connects image features and aggregates information from neighbour in a way that is almost impossible for the CNN-based methods. Moreover, weighted loss function and AM-softmax loss are both helpful to the proposed method.
6.3 Instance Symbol Spotting
In this section, thorough experiments are conducted to evaluate traditional and modern, supervised and unsupervised methods on the sub-task, namely instance symbol spotting defined at Task formation 3 of the proposed FloorPlanCAD dataset.
Dataset
We uniformly sample points on each element of the annotated CAD drawing and calculate the outside bounding box for each instance. We convert the instance information to COCO-styled version [25].
Implementation
All models are trained for 100 epochs except YOLOv3 for 273 epochs. ResNet-101 with FPN is used as backbone for Faster-RCNN and FCOS, DarkNet-53 is used for YOLOv3. Experiments are implemented based on the latest release of mmdetection [3]. Two typical traditional methods, SCIP [27] and Graph Matching [20], are implemented and evaluated on this task.
Benchmark Performance
Quantitative results on instance symbol detection task are shown in Table 4. We can see that Faster-RCNN and FCOS achieve comparable accuracy. Both traditional methods perform poorly on the proposed dataset since our data is from different vendors and do not have such standard templates to compare with.
| Categories | Door | Window | Stair | Appliance | Furniture | Equipment | Wall | Parking lot | F1 | Weighted F1 |
|---|---|---|---|---|---|---|---|---|---|---|
| HRNetsV2 W18 [42] | 0.821 | 0.620 | 0.845 | 0.597 | 0.726 | 0.880 | 0.620 | 0.610 | 0.656 | 0.683 |
| HRNetsV2 W48 [42] | 0.811 | 0.640 | 0.847 | 0.651 | 0.754 | 0.889 | 0.624 | 0.577 | 0.666 | 0.693 |
| DeepLabv3+ R50 [5] | 0.828 | 0.659 | 0.856 | 0.684 | 0.763 | 0.895 | 0.630 | 0.664 | 0.680 | 0.705 |
| DeepLabv3+ R101 [5] | 0.837 | 0.666 | 0.852 | 0.725 | 0.780 | 0.895 | 0.634 | 0.669 | 0.688 | 0.714 |
| Ours | 0.848 | 0.709 | 0.857 | 0.769 | 0.764 | 0.926 | 0.814 | 0.539 | 0.806 | 0.798 |
| Methods | backbone | AP50 | AP75 | mAP |
|---|---|---|---|---|
| Faster R-CNN [30] | R101 | 0.602 | 0.510 | 0.452 |
| FCOS [40] | R101 | 0.624 | 0.491 | 0.453 |
| YOLOv3 [29] | DarkNet53 | 0.639 | 0.452 | 0.413 |
| SCIP [27] | - | 0.231 | 0.151 | 0.135 |
| Graph Matching [21] | - | 0.137 | 0.118 | 0.102 |
6.4 Panoptic symbol spotting
With the optimized GCN head and detection head, then we propose the PanCADNet shown in Figure 8. To our knowledge, there is no other method conducting similar task on vector graphics.
Dataset
For the panoptic symbol spotting task, we merge the semantic symbol and instance symbol classes for the classification graph head. The box annotation for the detection head is the same to the previous section.
Implementation
We set the training scheme of PanCADNet similar to our semantic symbol spotting model except that we use ResNet-50 as backbone to balance the model efficiency and accuracy. By enforcing an overlap greater than 0.5 IoU, we are given a unique matching similar to [19].
Benchmark Performance
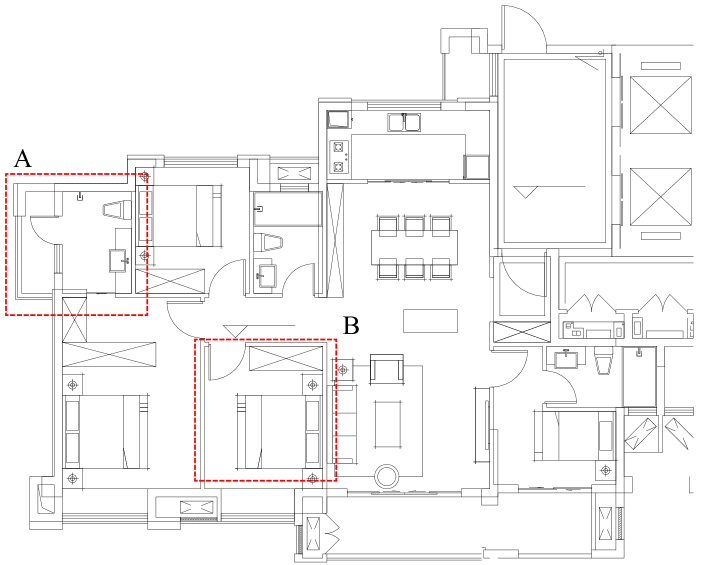
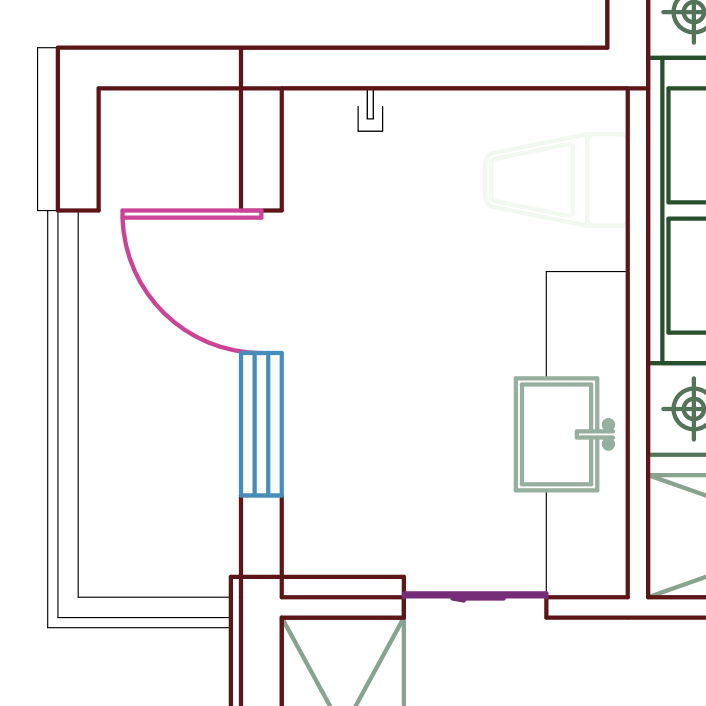
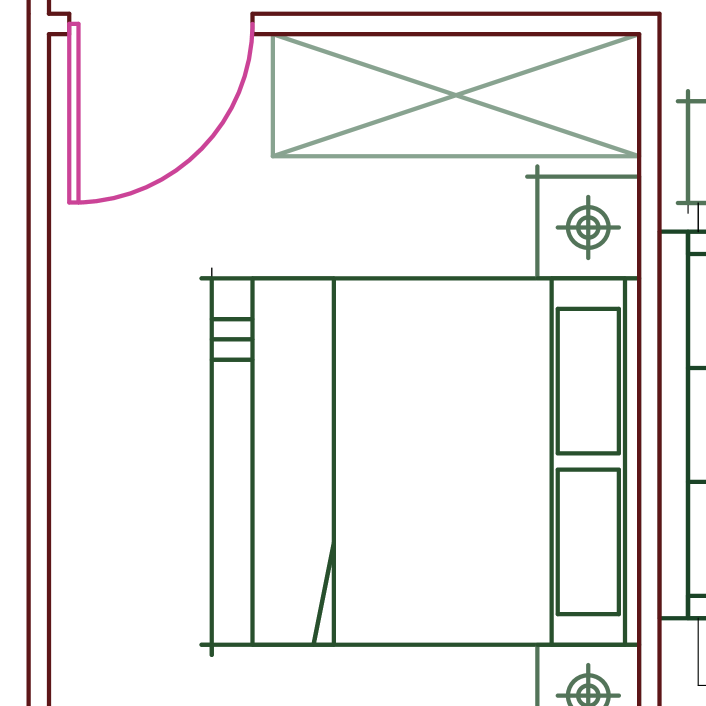
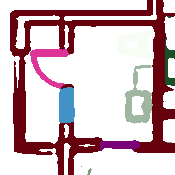
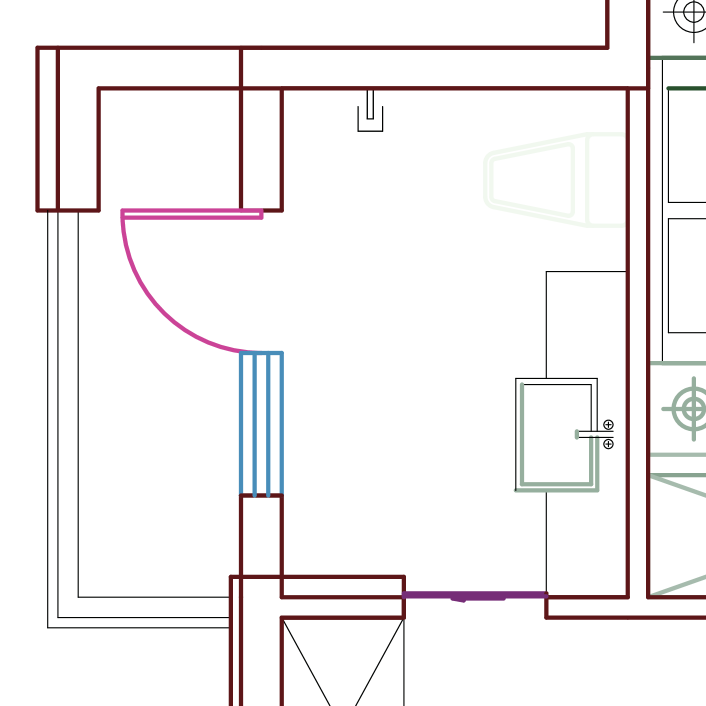
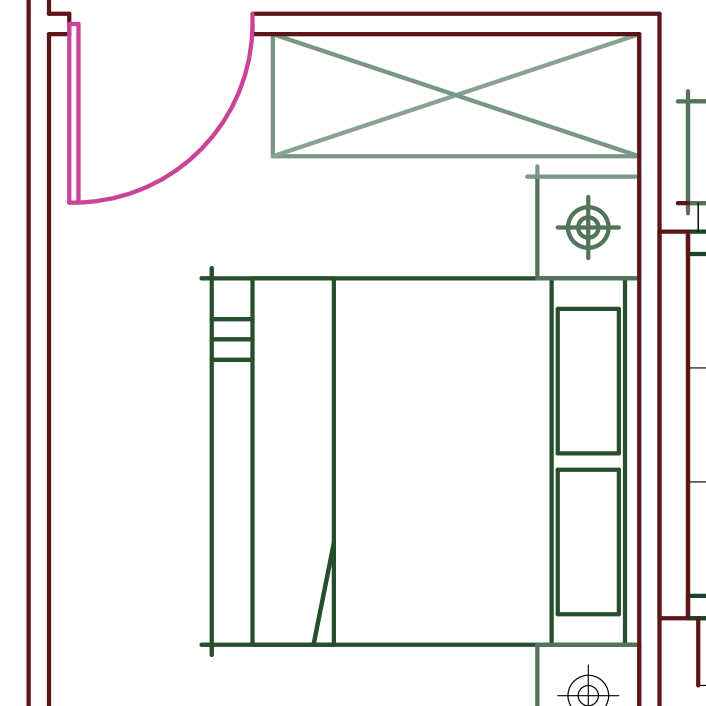
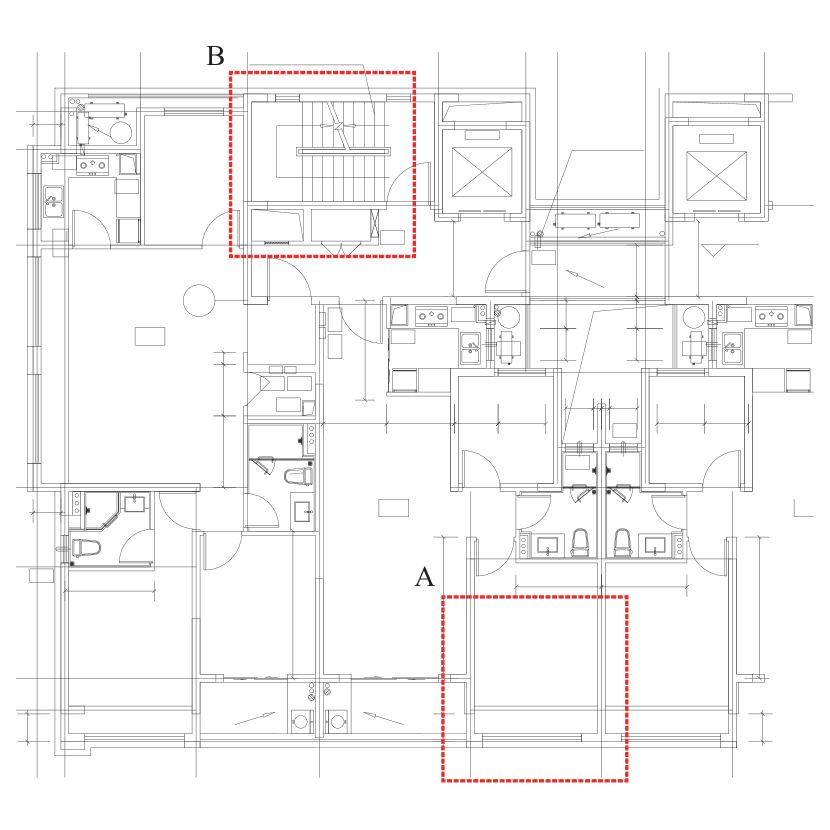
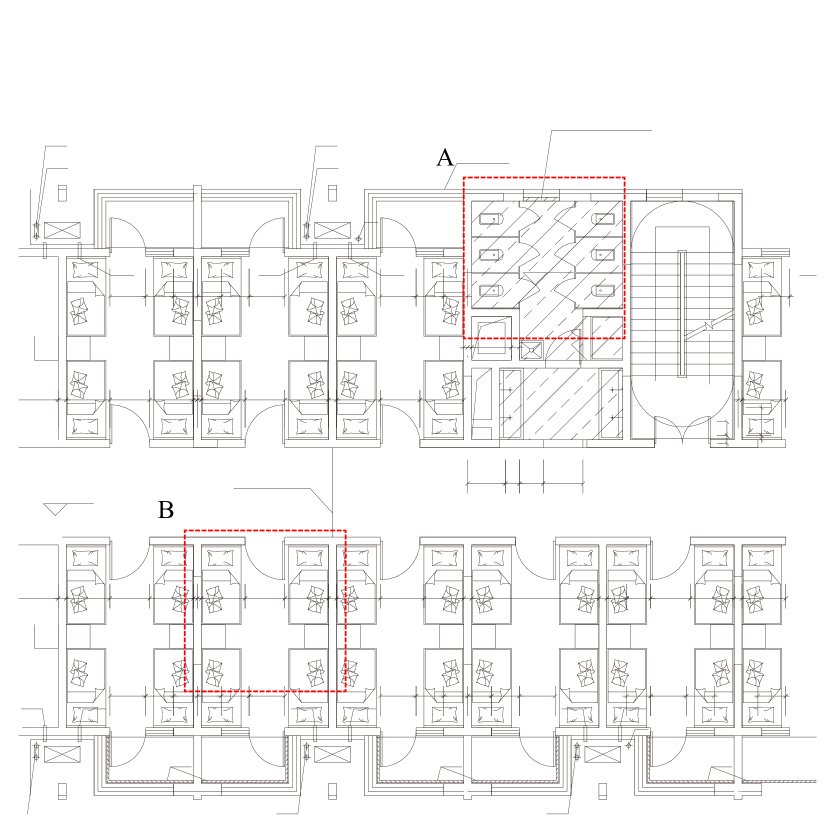
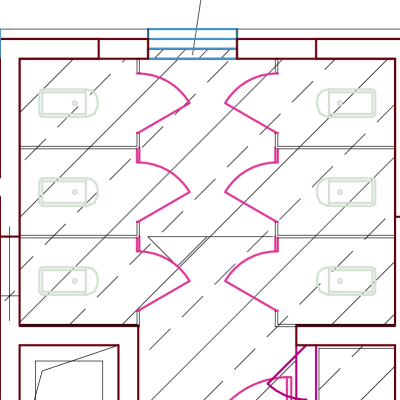
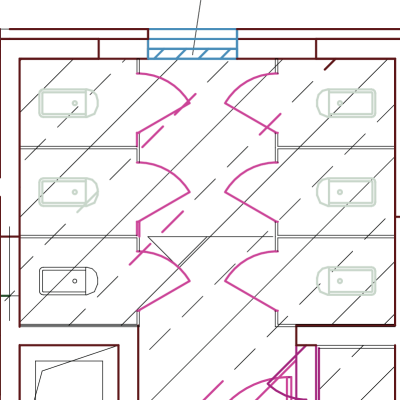
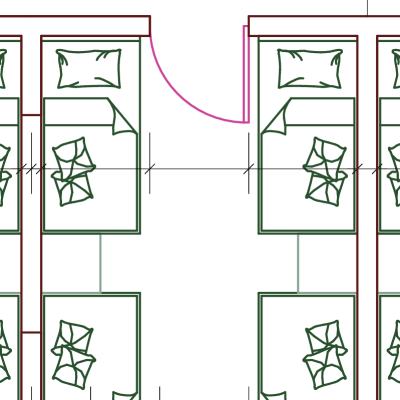
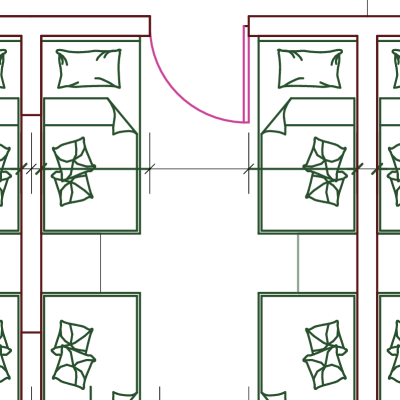
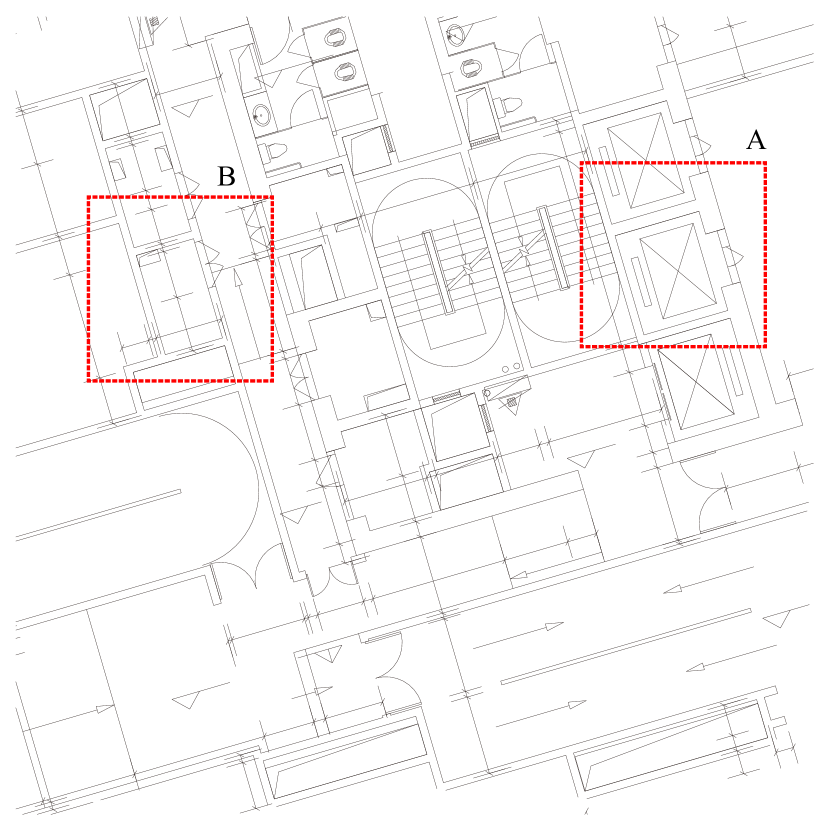
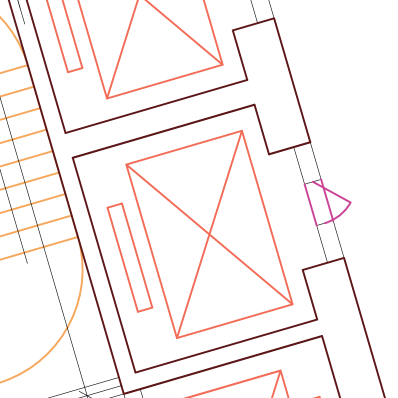
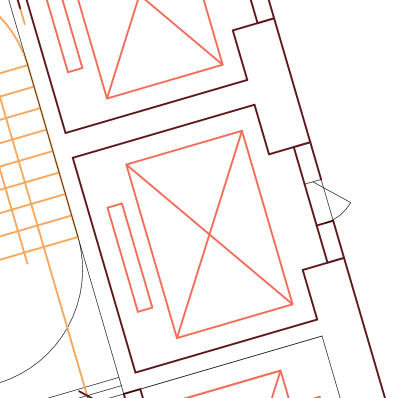
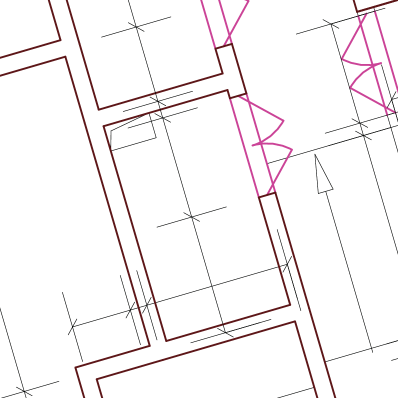
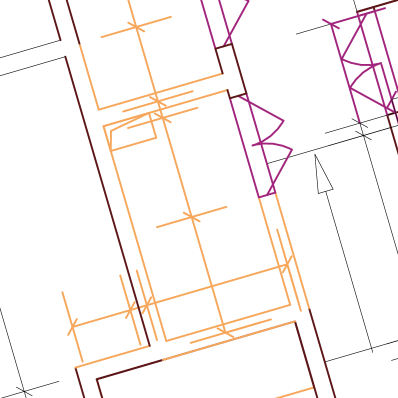
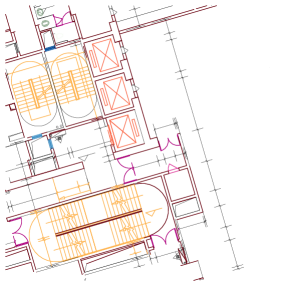
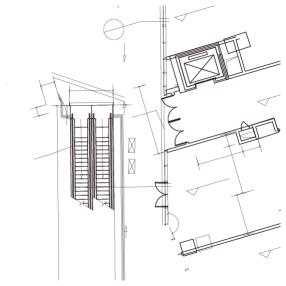
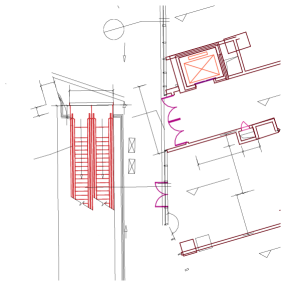
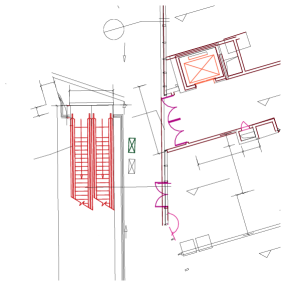
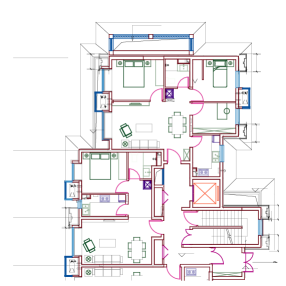
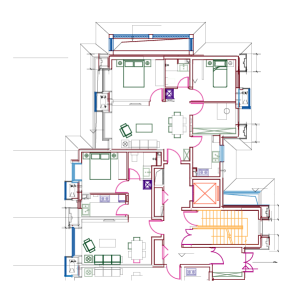
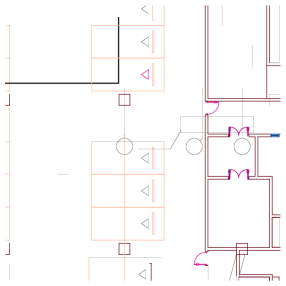
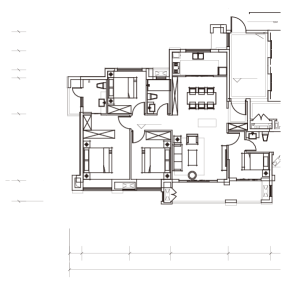
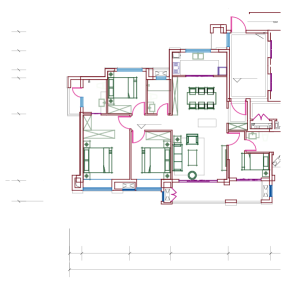
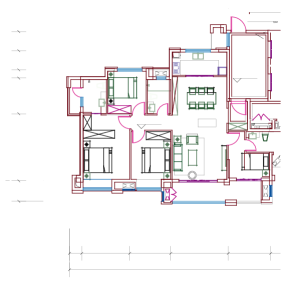
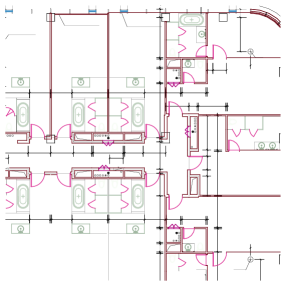
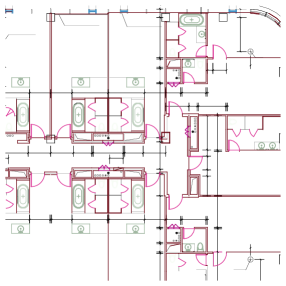
Table 5 lists the calculated panotic quality on the proposed panoptic symbol spotting task. Visualizations of several typical scenes of panoptic results are shown in Figure 10. Bay window in the first row area A is correctly detected, which has only one more parallel line segment further away compared to the ordinary window symbol. Several failure cases are visible in second row area A and thrid row area B. All graphics shown in the experiment are vector graphics, please feel free to zoom in and check.
| Dataset | Pan. Quality | Seg. Quality | Recog. Quality |
|---|---|---|---|
| FloorPlanCAD | 0.561 | 0.838 | 0.660 |
7 Conclusion
In this paper, we present a large-scale CAD drawing dataset of real-world floor plans with line-grained annotations. Based on the characteristics of the vector graphics, we introduce the panoptic symbol spotting problem with evaluation metric. By integrating CNN features into the GCN, we show the power of combining topological and geometric features. Our dataset and code with be public available and the next version dataset is under construction.
| Class | Property | Semantic Symbol Spotting | Instance Symbol Spotting | Panoptic Symbol Spotting | |||||
| Entity() | weighted F1 | mAP | PQ | SQ | RQ | ||||
| GCN-based | DeepLabv3+ [5] | Faster R-CNN [30] | FCOS [40] | YOLOv3 [29] | PanCADNet | ||||
| single door | 0.885 | 0.827 | 0.843 | 0.859 | 0.829 | 0.763 | 0.878 | 0.869 | |
| double door | 0.796 | 0.831 | 0.779 | 0.771 | 0.743 | 0.748 | 0.845 | 0.885 | |
| sliding door | 0.874 | 0.876 | 0.556 | 0.494 | 0.481 | 0.763 | 0.895 | 0.852 | |
| window | 0.691 | 0.603 | 0.518 | 0.465 | 0.379 | 0.459 | 0.795 | 0.577 | |
| bay window | 0.050 | 0.163 | 0.068 | 0.169 | 0.062 | 0.154 | 0.595 | 0.260 | |
| blind window | 0.833 | 0.856 | 0.614 | 0.520 | 0.322 | 0.706 | 0.869 | 0.813 | |
| opening symbol | 0.451 | 0.721 | 0.496 | 0.542 | 0.168 | 0.455 | 0.945 | 0.481 | |
| stairs | 0.857 | 0.853 | 0.464 | 0.487 | 0.370 | 0.608 | 0.784 | 0.775 | |
| gas stove | 0.789 | 0.847 | 0.503 | 0.715 | 0.601 | 0.743 | 0.957 | 0.776 | |
| refrigerator | 0.705 | 0.730 | 0.767 | 0.774 | 0.723 | 0.769 | 0.888 | 0.866 | |
| washing machine | 0.784 | 0.569 | 0.379 | 0.261 | 0.374 | 0.430 | 0.719 | 0.599 | |
| sofa | 0.606 | 0.674 | 0.160 | 0.133 | 0.435 | 0.252 | 0.928 | 0.272 | |
| bed | 0.893 | 0.908 | 0.713 | 0.738 | 0.664 | 0.805 | 0.909 | 0.886 | |
| chair | 0.524 | 0.543 | 0.112 | 0.087 | 0.132 | 0.481 | 0.802 | 0.600 | |
| table | 0.354 | 0.496 | 0.175 | 0.109 | 0.173 | 0.228 | 0.811 | 0.282 | |
| bedside cupboard | 0.509 | 0.770 | 0.231 | 0.363 | 0.310 | 0.600 | 0.825 | 0.727 | |
| TV cabinet | 0.581 | 0.611 | 0.231 | 0.187 | 0.247 | 0.426 | 0.800 | 0.533 | |
| half-height cabinet | 0.144 | 0.179 | 0.133 | 0.108 | 0.110 | 0.009 | 0.970 | 0.009 | |
| high cabinet | 0.325 | 0.426 | 0.271 | 0.188 | 0.296 | 0.287 | 0.820 | 0.351 | |
| wardrobe | 0.462 | 0.426 | 0.325 | 0.354 | 0.354 | 0.433 | 0.821 | 0.527 | |
| sink | 0.825 | 0.844 | 0.468 | 0.470 | 0.384 | 0.778 | 0.895 | 0.870 | |
| bath | 0.540 | 0.432 | 0.422 | 0.446 | 0.430 | 0.413 | 0.720 | 0.573 | |
| bath tub | 0.476 | 0.637 | 0.259 | 0.248 | 0.215 | 0.817 | 0.856 | 0.955 | |
| squat toilet | 0.842 | 0.904 | 0.836 | 0.821 | 0.599 | 0.901 | 0.989 | 0.911 | |
| urinal | 0.866 | 0.923 | 0.780 | 0.762 | 0.622 | 0.921 | 0.981 | 0.938 | |
| toilet | 0.875 | 0.864 | 0.666 | 0.599 | 0.664 | 0.831 | 0.906 | 0.917 | |
| elevator | 0.948 | 0.900 | 0.767 | 0.816 | 0.750 | 0.838 | 0.897 | 0.935 | |
| escalator | 0.744 | 0.864 | 0.115 | 0.190 | 0.129 | 0.439 | 0.718 | 0.612 | |
| parking | 0.529 | 0.667 | - | - | - | 0.251 | 0.661 | 0.380 | |
| wall | 0.814 | 0.634 | - | - | - | 0.451 | 0.661 | 0.682 | |
| total | 0.798 | 0.714 | 0.452 | 0.453 | 0.413 | 0.561 | 0.838 | 0.660 | |
8 Appendix Introduction
Due to space limitations in the paper, this supplemental material contains more descriptions about the dataset and more quantitative and qualitative results of the proposed methods.
9 Dataset
9.1 Entity Distribution among Classes
In Table 6, we provide statistics of graphical entities of 30 object classes, including 28 thing classes and 2 stuff classes. We can see that the wall class takes up a large portion of the whole dataset.
9.2 Visualizations on Train Set
10 Per-Class Evaluation
10.1 Semantic Symbol Spotting
The third column of Table 6 shows semantic symbol spotting results of DeepLabv3+ [5] and the proposed GCN-based method on all object classes. Here, we use weighted F1 score as the metric which use the entity length to weight the TP, FP and FN. We can see the GCN-based methods significantly outperforms DeepLabv3+ in wall class since wall class always mixes with thing classes.
10.2 Instance Symbol Spotting
We provide the class-wise mAP for Faster R-CNN [30], FCOS [40] and YOLOv3 [29] in the fourth column of Table 6. The results includes 28 thing classes. We can notice Faster R-CNN is comparable with FCOS and both outperform YOLOv3 which may caused by our dataset contains various scenes, 28 possible symbol classes and complex background.
10.3 Panoptic Symbol Spotting Results
In the fifth column of Table 6, we provide the detailed evaluation results of panoptic quality(PQ), segmentation quality(SQ) and recognition quality(RQ). Additional visualization results of PanCADNet on FloorPlanCAD dataset are shown in Figure 13, Figure 14 and Figure 15. The results for 2 stuff classes are obtained by GCN head while 28 thing classes are obtained by detection head [30].
11 Limitations and Future Works
The proposed PanCADNet benefits from the GCN head which takes the vectorized data as input, utilizing both the geometric feature and aligned CNN features, aggregating neighbour information by graph topology, resulting in a good results for the two key stuff classes (i.e. wall and parking). With the help of predicted bounding box using a detection head, we can distinguish each instance in thing classes easily.
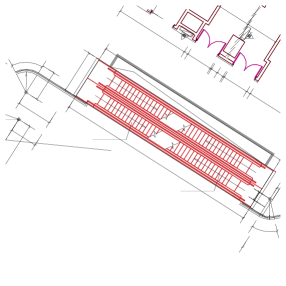
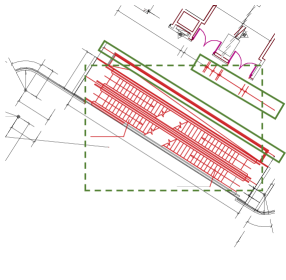
Although the proposed method can solve the panoptic symbol spotting problem, some limitations still exist: as is pointed out in Figure 16, some background elements may be mis-classified by the predicted box. The future works include generating instance proposals in vector space which can propose object instances in a more flexible way.
 |
 |
 |
 |
 |
 |
| Raw Input | GT |
 |
 |
 |
 |
 |
 |
| Raw Input | GT |
 |
 |
 |
 |
 |
 |
 |
 |
 |
 |
 |
 |
| Raw Input | GT | Panoptic Prediction |
 |
 |
 |
 |
 |
 |
 |
 |
 |
 |
 |
 |
| Raw Input | GT | Panoptic Prediction |
 |
 |
 |
 |
 |
 |
 |
 |
 |
 |
 |
 |
| Raw Input | GT | Panoptic Prediction |
 |
 |
 |
| Raw Input | GT | Panoptic Prediction |
References
- [1] Angel Chang, Angela Dai, Thomas Funkhouser, Maciej Halber, Matthias Niessner, Manolis Savva, Shuran Song, Andy Zeng, and Yinda Zhang. Matterport3d: Learning from rgb-d data in indoor environments. International Conference on 3D Vision (3DV), 2017.
- [2] Angel X. Chang, Thomas Funkhouser, Leonidas Guibas, Pat Hanrahan, Qixing Huang, Zimo Li, Silvio Savarese, Manolis Savva, Shuran Song, Hao Su, Jianxiong Xiao, Li Yi, and Fisher Yu. ShapeNet: An Information-Rich 3D Model Repository. Technical Report arXiv:1512.03012 [cs.GR], Stanford University — Princeton University — Toyota Technological Institute at Chicago, 2015.
- [3] Kai Chen, Jiaqi Wang, Jiangmiao Pang, Yuhang Cao, Yu Xiong, Xiaoxiao Li, Shuyang Sun, Wansen Feng, Ziwei Liu, Jiarui Xu, et al. Mmdetection: Open mmlab detection toolbox and benchmark. arXiv preprint arXiv:1906.07155, 2019.
- [4] Liang-Chieh Chen, George Papandreou, Florian Schroff, and Hartwig Adam. Rethinking atrous convolution for semantic image segmentation. arXiv preprint arXiv:1706.05587, 2017.
- [5] Liang-Chieh Chen, Yukun Zhu, George Papandreou, Florian Schroff, and Hartwig Adam. Encoder-decoder with atrous separable convolution for semantic image segmentation. In Proceedings of the European conference on computer vision (ECCV), pages 801–818, 2018.
- [6] Yifeng Chen, Guangchen Lin, Songyuan Li, Omar Bourahla, Yiming Wu, Fangfang Wang, Junyi Feng, Mingliang Xu, and Xi Li. Banet: Bidirectional aggregation network with occlusion handling for panoptic segmentation. In Proceedings of the IEEE/CVF Conference on Computer Vision and Pattern Recognition, pages 3793–3802, 2020.
- [7] MMSegmentation Contributors. MMSegmentation: Openmmlab semantic segmentation toolbox and benchmark. https://github.com/open-mmlab/mmsegmentation, 2020.
- [8] Mathieu Delalandre, Ernest Valveny, Tony Pridmore, and Dimosthenis Karatzas. Generation of synthetic documents for performance evaluation of symbol recognition & spotting systems. International Journal on Document Analysis and Recognition (IJDAR), 13(3):187–207, 2010.
- [9] Philippe Dosch, Gérald Masini, and Vitor Vasconcelos Araújo Silva. Qgar. https://raweb.inria.fr/rapportsactivite/RA2008/qgar/uid18.html, 2021. [Online; accessed 18-February-2021].
- [10] Anjan Dutta, Josep Lladós, Horst Bunke, and Umapada Pal. Near convex region adjacency graph and approximate neighborhood string matching for symbol spotting in graphical documents. In 2013 12th International Conference on Document Analysis and Recognition, pages 1078–1082. IEEE, 2013.
- [11] Anjan Dutta, Josep Lladós, and Umapada Pal. Symbol spotting in line drawings through graph paths hashing. In 2011 International Conference on Document Analysis and Recognition, pages 982–986. IEEE, 2011.
- [12] Anjan Dutta, Josep Lladós, and Umapada Pal. A symbol spotting approach in graphical documents by hashing serialized graphs. Pattern Recognition, 46(3):752–768, 2013.
- [13] Shreya Goyal, Vishesh Mistry, Chiranjoy Chattopadhyay, and Gaurav Bhatnagar. Bridge: Building plan repository for image description generation, and evaluation. In 2019 International Conference on Document Analysis and Recognition (ICDAR), pages 1071–1076. IEEE, 2019.
- [14] Kaiming He, Georgia Gkioxari, Piotr Dollár, and Ross Girshick. Mask r-cnn. In Proceedings of the IEEE international conference on computer vision, pages 2961–2969, 2017.
- [15] Xavier Hilaire and Karl Tombre. Robust and accurate vectorization of line drawings. IEEE Transactions on Pattern Analysis and Machine Intelligence, 28(6):890–904, 2006.
- [16] Zhe Huang, Hongbo Fu, and Rynson WH Lau. Data-driven segmentation and labeling of freehand sketches. ACM Transactions on Graphics (TOG), 33(6):1–10, 2014.
- [17] Thomas N Kipf and Max Welling. Semi-supervised classification with graph convolutional networks. arXiv preprint arXiv:1609.02907, 2016.
- [18] Alexander Kirillov, Ross Girshick, Kaiming He, and Piotr Dollár. Panoptic feature pyramid networks. In Proceedings of the IEEE/CVF Conference on Computer Vision and Pattern Recognition, pages 6399–6408, 2019.
- [19] Alexander Kirillov, Kaiming He, Ross Girshick, Carsten Rother, and Piotr Dollár. Panoptic segmentation. In Proceedings of the IEEE/CVF Conference on Computer Vision and Pattern Recognition, pages 9404–9413, 2019.
- [20] Pierre Le Bodic, Pierre Héroux, Sébastien Adam, and Yves Lecourtier. An integer linear program for substitution-tolerant subgraph isomorphism and its use for symbol spotting in technical drawings. Pattern Recognition, 45(12):4214–4224, 2012.
- [21] Pierre Le Bodic, Pierre Héroux, Sébastien Adam, and Yves Lecourtier. An integer linear program for substitution-tolerant subgraph isomorphism and its use for symbol spotting in technical drawings. Pattern Recognition, 45(12):4214–4224, 2012.
- [22] Lei Li, Hongbo Fu, and Chiew-Lan Tai. Fast sketch segmentation and labeling with deep learning. IEEE computer graphics and applications, 39(2):38–51, 2018.
- [23] Tsung-Yi Lin, Piotr Dollár, Ross Girshick, Kaiming He, Bharath Hariharan, and Serge Belongie. Feature pyramid networks for object detection. In Proceedings of the IEEE conference on computer vision and pattern recognition, pages 2117–2125, 2017.
- [24] Tsung-Yi Lin, Priya Goyal, Ross Girshick, Kaiming He, and Piotr Dollár. Focal loss for dense object detection. In Proceedings of the IEEE international conference on computer vision, pages 2980–2988, 2017.
- [25] Tsung-Yi Lin, Michael Maire, Serge Belongie, James Hays, Pietro Perona, Deva Ramanan, Piotr Dollár, and C Lawrence Zitnick. Microsoft coco: Common objects in context. In European conference on computer vision, pages 740–755. Springer, 2014.
- [26] Ilya Loshchilov and Frank Hutter. Sgdr: Stochastic gradient descent with warm restarts. arXiv preprint arXiv:1608.03983, 2016.
- [27] Thi-Oanh Nguyen, Salvatore Tabbone, and Alain Boucher. A symbol spotting approach based on the vector model and a visual vocabulary. In 2009 10th International Conference on Document Analysis and Recognition, pages 708–712. IEEE, 2009.
- [28] Thi Oanh Nguyen, Salvatore Tabbone, and O Ramos Terrades. Symbol descriptor based on shape context and vector model of information retrieval. In 2008 The Eighth IAPR International Workshop on Document Analysis Systems, pages 191–197. IEEE, 2008.
- [29] Joseph Redmon and Ali Farhadi. Yolov3: An incremental improvement. arXiv preprint arXiv:1804.02767, 2018.
- [30] Shaoqing Ren, Kaiming He, Ross Girshick, and Jian Sun. Faster r-cnn: towards real-time object detection with region proposal networks. IEEE transactions on pattern analysis and machine intelligence, 39(6):1137–1149, 2016.
- [31] Alireza Rezvanifar, Melissa Cote, and Alexandra Branzan Albu. Symbol spotting for architectural drawings: state-of-the-art and new industry-driven developments. IPSJ Transactions on Computer Vision and Applications, 11(1):2, 2019.
- [32] Alireza Rezvanifar, Melissa Cote, and Alexandra Branzan Albu. Symbol spotting on digital architectural floor plans using a deep learning-based framework. In Proceedings of the IEEE/CVF Conference on Computer Vision and Pattern Recognition Workshops, pages 568–569, 2020.
- [33] Marçal Rusiñol, Agnés Borràs, and Josep Lladós. Relational indexing of vectorial primitives for symbol spotting in line-drawing images. Pattern Recognition Letters, 31(3):188–201, 2010.
- [34] Marçal Rusiñol and Josep Lladós. Symbol Spotting in Digital Libraries, volume 1. Springer, 2010.
- [35] Marçal Rusiñol, Josep Lladós, and Gemma Sánchez. Symbol spotting in vectorized technical drawings through a lookup table of region strings. Pattern Analysis and Applications, 13(3):321–331, 2010.
- [36] Olga Russakovsky, Jia Deng, Hao Su, Jonathan Krause, Sanjeev Satheesh, Sean Ma, Zhiheng Huang, Andrej Karpathy, Aditya Khosla, Michael Bernstein, et al. Imagenet large scale visual recognition challenge. International journal of computer vision, 115(3):211–252, 2015.
- [37] Mark Sandler, Andrew Howard, Menglong Zhu, Andrey Zhmoginov, and Liang-Chieh Chen. Mobilenetv2: Inverted residuals and linear bottlenecks. In Proceedings of the IEEE conference on computer vision and pattern recognition, pages 4510–4520, 2018.
- [38] KC Santosh. Document image analysis: Current trends and challenges in graphics recognition. 2018.
- [39] Zhenbang Sun, Changhu Wang, Liqing Zhang, and Lei Zhang. Free hand-drawn sketch segmentation. In European Conference on Computer Vision, pages 626–639. Springer, 2012.
- [40] Zhi Tian, Chunhua Shen, Hao Chen, and Tong He. Fcos: Fully convolutional one-stage object detection. In Proceedings of the IEEE/CVF International Conference on Computer Vision, pages 9627–9636, 2019.
- [41] Feng Wang, Jian Cheng, Weiyang Liu, and Haijun Liu. Additive margin softmax for face verification. IEEE Signal Processing Letters, 25(7):926–930, 2018.
- [42] Jingdong Wang, Ke Sun, Tianheng Cheng, Borui Jiang, Chaorui Deng, Yang Zhao, Dong Liu, Yadong Mu, Mingkui Tan, Xinggang Wang, et al. Deep high-resolution representation learning for visual recognition. IEEE transactions on pattern analysis and machine intelligence, 2020.
- [43] Nanyang Wang, Yinda Zhang, Zhuwen Li, Yanwei Fu, Wei Liu, and Yu-Gang Jiang. Pixel2mesh: Generating 3d mesh models from single rgb images. In ECCV, 2018.
- [44] Yangxin Wu, Gengwei Zhang, Yiming Gao, Xiajun Deng, Ke Gong, Xiaodan Liang, and Liang Lin. Bidirectional graph reasoning network for panoptic segmentation. In Proceedings of the IEEE/CVF Conference on Computer Vision and Pattern Recognition, pages 9080–9089, 2020.
- [45] Yuwen Xiong, Renjie Liao, Hengshuang Zhao, Rui Hu, Min Bai, Ersin Yumer, and Raquel Urtasun. Upsnet: A unified panoptic segmentation network. In Proceedings of the IEEE/CVF Conference on Computer Vision and Pattern Recognition, pages 8818–8826, 2019.
- [46] Lumin Yang, Jiajie Zhuang, Hongbo Fu, Kun Zhou, and Youyi Zheng. Sketchgcn: Semantic sketch segmentation with graph convolutional networks. arXiv preprint arXiv:2003.00678, 2020.