Raman spectra of hydrocarbons under extreme conditions of pressure and temperature: a first-principles study
Abstract
Hydrocarbons are of great importance in carbon-bearing fluids in deep Earth and in ice giant planets at extreme pressure (P)-temperature (T) conditions. Raman spectroscopy is a powerful tool to study the chemical speciation of hydrocarbons; however, it is challenging to interpret Raman data at extreme conditions. Here, we performed ab initio molecular dynamics simulations coupled with the modern theory of polarization to calculate Raman spectra of methane, ethane, and propane up to 48 GPa and 2000 K. Our method includes anharmonic temperature effects. We studied the pressure and temperature effects on the Raman bands, and identified the characteristic Raman modes for the C-C and C-C-C bonds. Our result may help to interpret in-situ Raman data of hydrocarbons at extreme P-T conditions, with important implications for understanding the deep carbon cycle inside Earth and the compositions of ice giant planets.
I introduction
Methane (CH4) and other light hydrocarbons are important components of reduced carbon-hydrogen-oxygen (C-H-O) fluids inside deep Earth Manning et al. (2013); Sephton and Hazen (2013). Methane is also a major constituent of deep interiors of two ice giant planets in the solar system: Uranus and Neptune Hubbard (1981); Podolak et al. (1995). The abiotic hydrocarbons may participate in the formation of petroleum deposits; this controversial hypothesis can be dated back to the time of Dimitri Mendeleev Mendeleev (1877); Sephton and Hazen (2013). The properties of hydrocarbons under extreme pressure (P) and temperature (T) conditions play crucial roles in the deep carbon cycle in Earth Sephton and Hazen (2013), and in shaping the structure and dynamics of ice giant planets. Previously, it was assumed that hydrocarbons were simply mixed with other small volatile molecules, e.g., H2O, CO2, H2, in C-H-O fluids Zhang and Duan (2009), or with H2O and NH3 inside Uranus and Neptune Podolak et al. (1995). However, many recent theoretical and experimental studies show that methane and other hydrocarbons may further react at extreme P-T conditions (e.g., Ancilotto et al. (1997); Hirai et al. (2009); Kolesnikov et al. (2009); Gao et al. (2010); Spanu et al. (2011a); Lobanov et al. (2013)). Using ab initio molecular dynamics (AIMD) simulations, Ancilotto et al. found that at 100 GPa and 4000 K, methane dissociates into a mixture of methane, ethane (C2H6), and propane (C3H8) Ancilotto et al. (1997). Spanu et al. predicted that higher hydrocarbons become thermodynamically more favored than methane at above 4 GPa and 10002000 K Spanu et al. (2011b). Experiments with laser-heated diamond anvil cells reported that ethane, propane, and higher hydrocarbons may form out of methane at pressures higher than 2 GPa and temperatures above 1000 K Kolesnikov et al. (2009); Hirai et al. (2009).
Raman spectroscopy is the most widely used experimental tool to detect chemical speciation in C-H-O fluids at both high-P and high-T conditions Goncharov (2012). Raman spectra of vibrations provide fingerprints to identify molecules and ions in in-situ experiments Goncharov (2012); Vandenabeele (2013). However, it is very challenging to measure Raman spectra under extreme P-T conditions, because many high energy levels are excited at high temperatures and the signals from diamond anvils may interfere; for example, the peaks near 1332 cm-1 and 2400 cm-1 are attributed to the first- and the second-order scattering from diamond anvils, respectively Goncharov et al. (2005). Thus, theoretically studying the P-T dependence of Raman bands is of great importance to the interpretation of Raman spectra under extreme conditions Lobanov et al. (2013); Petrov (2018). In first-principles calculations, we usually calculate the change of electronic polarizability along a normal vibrational mode under the harmonic approximation to obtain the Raman spectra of hydrocarbons in the gas or solid phase (e.g., Lin et al. (2007, 2011); Ramya et al. (2012)), where the temperature is treated as 0 K; however, for C-H fluids at the supercritical state, the anharmonic and temperature effects can not be ignored Putrino and Parrinello (2002); Wan et al. (2013); Pan and Galli (2020).
Here, we performed AIMD simulations coupled with density functional perturbation theory to calculate the Raman spectra of methane, ethane, and propane at 13.448 GPa and 14452000 K. The electronic polarizability was calculated on the fly along with AIMD simulations. We studied how pressure and temperature affect Raman spectra, and assigned Raman bands at the molecular scale. We discussed possible characteristic Raman signals for the formation of higher hydrocarbons. Our work has important implications for studying chemical speciation of hydrocarbons at extreme P-T conditions found in deep Earth and ice giant planets.
II Methods
We carried out AIMD simulations using the Qbox package Gygi (2008); qbo (2008) with the Born–Oppenheimer approximation and a time step of 5 a.u. We used the Perdew–Burke–Ernzerhof (PBE) exchange-correlation functional Perdew et al. (1996) and the HSCV norm-conserving pseudopotentials Hamann et al. (1979); Vanderbilt (1985); pps . The kinetic energy cutoff of plane waves is 65 Ry, which was increased to 145 Ry to calculate pressure. We applied the Bussi-Donadio-Parrinello thermostat to control temperature Bussi et al. (2007). For methane, ethane, and propane, the simulation boxes with periodic boundary conditions contain 56, 32, and 23 molecules, respectively.
We performed on-the-fly calculations using density functional perturbation theory (DFPT) Baroni et al. (2001) implemented in the Qbox package along with AIMD simulations to calculate electronic polarizability, which were conducted every 25 MD steps after about 10 ps equilibration. Each MD trajectory is longer than 130 ps. We computed Raman spectra of supercritical fluids using the Fourier transfer of the autocorrelation functions of polarizabilities. The isotropic and anisotropic Raman spectra are calculated respectively by
| (1) | |||
| (2) |
where is the Planck constant, is the Raman frequency, is the Boltzmann constant, Tr stands for the trace of matrix. and denote the isotropic and anisotropic components of the polarizability tensor , and , respectively. In high-P and high-T experiments, we measured unpolarized Raman spectra, which are obtained from the linear combination of Eqs. (1) and (2):
| (3) |
We further smoothed Raman spectra using Gaussian broadening, whose full width at half maximum is 25 cm-1.
For the gas and solid phases, DFPT calculations were carried out using the Quantum Espresso packageGiannozzi et al. (2009). For methane, ethane, and propane in the gas phase, the mean absolute error of calculated Raman frequencies is 23 cm-1 compared with experimental values, indicating that our computational setups are reliable.
III Results and Discussion
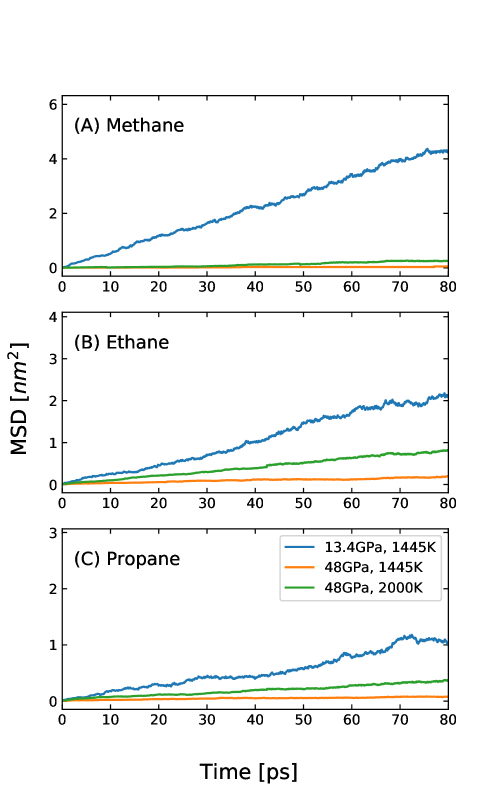
Fig. 1 shows the mean squared displacements of methane, ethane, and propane at 13.4 GPa, 1445 K; 48 GPa, 1445 K; and 48 GPa, 2000 K. All the alkanes are in the supercritical state, except methane at 48 GPa and 1445 K, which is an amorphous solid. It is interesting to see that methane freezes at 1445 K, whereas propane does not. At ambient pressure, the melting point of methane is 90.7 K, while propane melts at 85.5 K Thalladi and Boese (2000). In fact, the melting point of propane is unusually lower than other n-alkanes, which may be due to the low packing efficiency of propane molecules Thalladi and Boese (2000).
In our simulations, a few C-H bonds broke temporarily, but we did not see any new chemical bond form. Experimentally, Nellis et al. reported no chemical reactions in shock wave experiments up to 26 GPa and 3200 K Nellis et al. (2001), whereas Lobanov et al. found that heavier alkanes and unsaturated hydrocarbons may form in laser-heated diamond anvil cells above 1500 K Lobanov et al. (2013). Theoretically, Spanu et al. found that the mixtures of higher hydrocarbons and hydrogen become thermodynamically more stable than methane at above 4 GPa and 10002000 K using AIMD simulations and free energy calculations, but without metal catalysts or unsaturated diamond surfaces they did not see chemical reactions in that P-T range Spanu et al. (2011b). Thus, we conclude that activation barriers of alkanes may be too high, so we could not see chemical reactivity within limited simulation time.
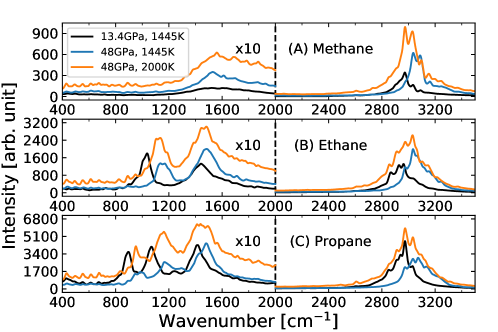
Fig. 2 shows the unpolarized Raman spectra of hydrocarbons, from which we know how Raman bands change with pressure and temperature. The C-H bond stretching region is between 2800 and 3200 cm-1. The stretching band downshifts with increasing temperature or decreasing pressure. For methane at 48 GPa and 14452000 K, the stretching band splits into two peaks, which was found as an indicator of orientational ordering of molecules in compressed methane crystals at least up to 30 GPa Bini et al. (1995); Bini and Pratesi (1997), suggesting that CH4 molecules may have some orientational correlation under such extreme P-T conditions.
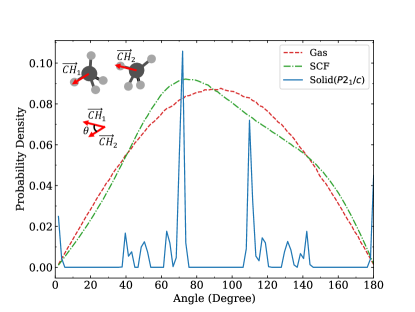
Fig. 3 shows the angle distribution of two C-H bonds respectively from two nearest methane molecules. For the crystalline methane (space group: Lin et al. (2011)), the angle distribution has two main peaks at 70.5∘ and 109.5∘, and the former peak is taller than the latter one. In gas phase, the angle is randomly distributed, so the probability density function is . At 48 GPa and 2000 K, the angle distribution becomes asymmetric, different from the function, indicating a certain angular correlation between neighboring molecules.
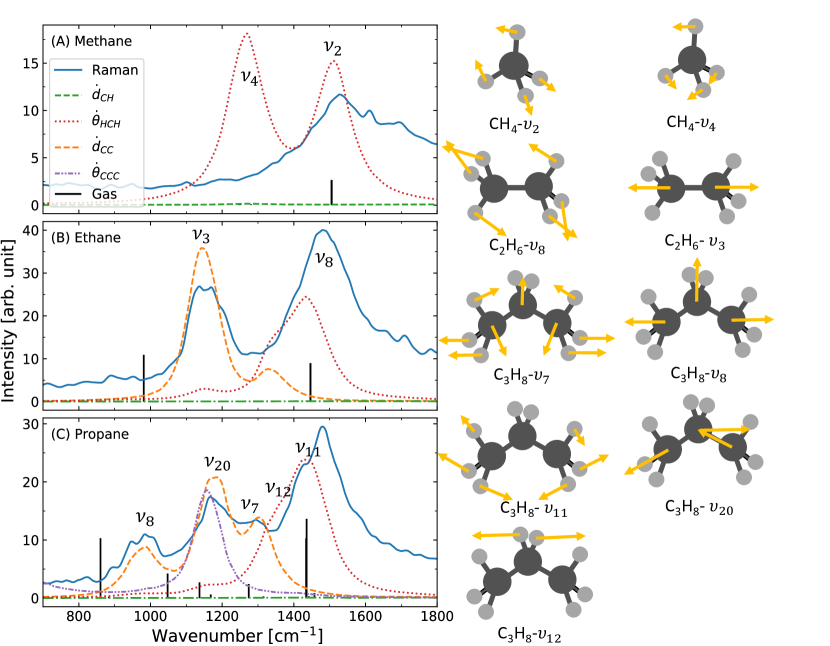
The C-H stretching bands of hydrocarbons largely overlap, whereas the Raman bands in the low frequency region between 600 and 2000 cm-1 show distinct peaks for methane, ethane, and propane, so the Raman modes in this region are often used to identify hydrocarbons in experiment Buldakov et al. (2013). Methane only shows one peak between 1400 and 1600 cm-1, which upshifts with increasing temperature. For an isolated methane molecule, the calculated Raman active mode in this range appears at 1505 cm-1, which corresponds to the degenerate deformation Shimanouchi et al. (1972). We also performed the Fourier transform of autocorrelation functions of C-H bonds and H-C-H angles, respectively:
| (4) | |||
| (5) |
where is the C-H bond length and is the H-C-H bond angle. As shown in Fig. 4(A), there is no C-H stretching mode between 1000 and 1800 cm-1. The H-C-H angle spectrum has two peaks: at 1269 cm-1 and at 1511 cm-1. We can not identify the mode in the calculated Raman spectrum in Fig. 4(A), because the Raman cross section of is about 28 times as much as that of for an isolated CH4 molecule.
Fig. 4 (B) shows the Raman spectra of ethane between 800 and 1800 cm-1. For an isolated ethane molecule, there are two notable Raman modes in our calculation: at 987 cm-1 and at 1455 cm-1, corresponding to the C-C stretching and CH3 degenerate deformation modes, respectively Shimanouchi et al. (1972). At 48 GPa and 1445 K, both of the peaks upshift. In addition to the C-H bond and H-C-H angle spectra, we also calculated the C-C bond spectrum:
| (6) |
where is the C-C bond length. It has a main peak at 1145 cm-1, which overlaps with the band, indicating that the mode is indeed the C-C stretching mode. The mode is found in the vicinity of the H-C-H angle spectrum, suggesting that the CH3 degenerate deforming is relevant to the variation of H-C-H angles. Comparing Fig. 4 (A) with (B), we found that the band of methane overlaps with the band of ethane, and the band of ethane is missing in the Raman spectra of methane, so this band can be used as a characteristic signal for the C-C bond formation under high P-T conditions. The mode upshifts with increasing pressure, and downshifts with increasing temperature. The pressure effect is more obvious than the temperature effect in the P-T range studied here, as shown in Fig. 2.
Fig. 4 (C) shows the Raman spectra of propane between 800 and 1800 cm-1. In our calculation, an isolated propane molecule has notable Raman modes as follows: C-C stretching mode at 860 cm-1, C-C stretching mode at 1048 cm-1, CH3 rocking mode at 1137 cm-1, CH2 twisting mode at 1274 cm-1, and CH3 degenerate deforming mode at 1435 cm-1 Shimanouchi et al. (1972). At 48 GPa and 1445 K, we can identify the and modes in the H-C-H angle spectrum. The C-C bond spectrum has three peaks: , , and . We also calculated the C-C-C angle () spectrum:
| (7) |
which has one peak overlapping with the mode, indicating that this CC stretching mode also considerably changes the C-C-C bond angle. The band does not show up in the spectra of methane and ethane, so it can be used to verify the formation of the C-C-C bonds.
We further divided Raman spectra into inter- and intramolecular contributions with the help of maximally localized Wannier functions Gygi et al. (2003), which provide local molecular orbitals to partition electron density into molecules Marzari et al. (2012). The effective molecular polarizability, , was obtained by:
| (8) |
where is the macroscopic electric field, is the elementary charge, is the electron polarization density of the molecule induced by the electric field, and the integral is over the whole simulation box ().
The autocorrelation functions in Eqs. (1) and (2) are respectively written as,
| (9) | ||||
| (10) |
where is the total number of hydrocarbon molecules. We applied the Fourier transform on the first and second terms of Eqs. (9)(10) to get the inter- and intramolecular Raman spectra, respectively.
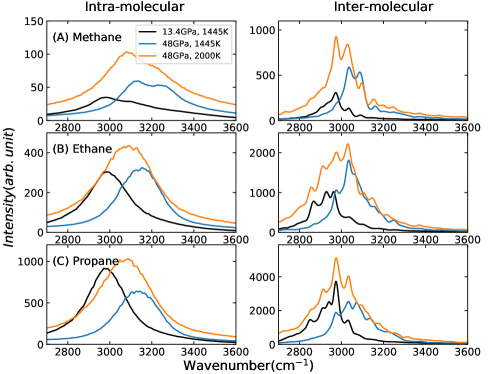
Fig. 5 shows the inter- and intramolecular Raman spectra in the high frequency region. The intensities of intermolecular contributions are much larger than the intramolecular ones, indicating strong molecular interactions under extreme P-T conditions. The intramolecular spectra have only one main peak, whereas there appears to be a few peaks in the intermolecular spectra, which may come from multiple intermolecular couplings between hydrocarbon molecules.
IV Conclusion
In summary, we calculated the unpolarized Raman spectra of methane, ethane and propane at 13.448 GPa and 14452000 K using ab initio molecular dynamics simulations coupled with density functional perturbation theory. Our method considers the Raman selection rule and anharmonic temperature effects. We monitored how pressure and temperature change the Raman bands, and understood the Raman bands at the molecular scale. Particularly, we identified the characteristic Raman bands for the formation of C-C and C-C-C bonds. We found that the C-H stretching bands of supercritical hydrocarbons in the high-frequency region split due to the intermolecular interactions. Our results may help to interpret in-situ Raman measurements of hydrocarbons at extreme P-T conditions, which are of great importance in understanding the deep carbon cycle inside Earth and the compositions of ice giant planets.
V acknowledgments
Acknowledgements.
D.P. acknowledges support from the Croucher Foundation through the Croucher Innovation Award, Hong Kong Research Grants Council (Projects ECS-26305017 and GRF-16307618), National Natural Science Foundation of China (Project 11774072 and Excellent Young Scientists Fund), and the Alfred P. Sloan Foundation through the Deep Carbon Observatory. Part of this work was carried out using computational resources from the National Supercomputer Center in Guangzhou, China.References
- Manning et al. (2013) Craig E Manning, Everett L Shock, and Dimitri A Sverjensky, “The chemistry of carbon in aqueous fluids at crustal and upper-mantle conditions: experimental and theoretical constraints,” Rev. Mineral. Geochem. 75, 109–148 (2013).
- Sephton and Hazen (2013) Mark A Sephton and Robert M Hazen, “On the origins of deep hydrocarbons,” Rev. Mineral. Geochem. 75, 449–465 (2013).
- Hubbard (1981) William B Hubbard, “Interiors of the giant planets,” Science 214, 145–149 (1981).
- Podolak et al. (1995) M Podolak, A Weizman, and M Marley, “Comparative models of uranus and neptune,” Planet. Space Sci. 43, 1517–1522 (1995).
- Mendeleev (1877) D. Mendeleev, “L’origine du pétrole,” Rev. Sci. 8, 409–416 (1877).
- Zhang and Duan (2009) C. Zhang and Z. Duan, “A model for C-O-H fluid in the Earth’s mantle,” Geochim. Cosmochim. Acta 73, 2089–2102 (2009).
- Ancilotto et al. (1997) F Ancilotto, Guido L Chiarotti, S Scandolo, and E Tosatti, “Dissociation of methane into hydrocarbons at extreme (planetary) pressure and temperature,” Science 275, 1288–1290 (1997).
- Hirai et al. (2009) Hisako Hirai, Keisuke Konagai, Taro Kawamura, Yoshitaka Yamamoto, and Takehiko Yagi, “Polymerization and diamond formation from melting methane and their implications in ice layer of giant planets,” Phys. Earth Planet. Inter. 174, 242–246 (2009).
- Kolesnikov et al. (2009) Anton Kolesnikov, Vladimir G Kutcherov, and Alexander F Goncharov, “Methane-derived hydrocarbons produced under upper-mantle conditions,” Nat. Geosci. 2, 566–570 (2009).
- Gao et al. (2010) Guoying Gao, Artem R Oganov, Yanming Ma, Hui Wang, Peifang Li, Yinwei Li, Toshiaki Iitaka, and Guangtian Zou, “Dissociation of methane under high pressure,” J. Chem. Phys. 133, 144508 (2010).
- Spanu et al. (2011a) Leonardo Spanu, D. Donadio, D. Hohl, Eric Schwegler, and Giulia Galli, “Stability of Hydrocarbons at Deep Earth Pressures and Temperatures,” Proc. Natl. Acad. Sci. U.S.A. 108, 6843–6846 (2011a).
- Lobanov et al. (2013) Sergey S Lobanov, Pei-Nan Chen, Xiao-Jia Chen, Chang-Sheng Zha, Konstantin D Litasov, Ho-Kwang Mao, and Alexander F Goncharov, “Carbon precipitation from heavy hydrocarbon fluid in deep planetary interiors,” Nat. Commun. 4, 1–8 (2013).
- Spanu et al. (2011b) Leonardo Spanu, Davide Donadio, Detlef Hohl, Eric Schwegler, and Giulia Galli, “Stability of hydrocarbons at deep earth pressures and temperatures,” Proc. Natl. Acad. Sci. U.S.A. 108, 6843–6846 (2011b).
- Goncharov (2012) Alexander F Goncharov, “Raman spectroscopy at high pressures,” Int. J. Spectrosc. 2012 (2012).
- Vandenabeele (2013) Peter Vandenabeele, “Practical raman spectroscopy: an introduction,” (Wiley Online Library, 2013) Chap. Theoretical Aspects, pp. 1–38.
- Goncharov et al. (2005) Alexander F Goncharov, Nir Goldman, Laurence E Fried, Jonathan C Crowhurst, I-Feng W Kuo, Christopher J Mundy, and Joseph M Zaug, “Dynamic ionization of water under extreme conditions,” Phys. Rev. Lett. 94, 125508 (2005).
- Petrov (2018) Dmitry V Petrov, “Raman spectrum of ethane in methane environment,” J. Raman Spectrosc. 49, 771–774 (2018).
- Lin et al. (2007) Fang Lin, Amadeu K Sum, and Robert J Bodnar, “Correlation of methane raman 1 band position with fluid density and interactions at the molecular level,” J. Raman Spectrosc. 38, 1510–1515 (2007).
- Lin et al. (2011) He Lin, Yan-ling Li, Z Zeng, Xiao-jia Chen, and HQ Lin, “Structural, electronic, and dynamical properties of methane under high pressure,” J. Chem. Phys. 134, 064515 (2011).
- Ramya et al. (2012) KR Ramya, GV Pavan Kumar, and Arun Venkatnathan, “Raman spectra of vibrational and librational modes in methane clathrate hydrates using density functional theory,” J. Chem. Phys. 136, 174305 (2012).
- Putrino and Parrinello (2002) Anna Putrino and Michele Parrinello, “Anharmonic raman spectra in high-pressure ice from ab initio simulations,” Phys. Rev. Lett. 88, 176401 (2002).
- Wan et al. (2013) Quan Wan, Leonardo Spanu, Giulia A Galli, and François Gygi, “Raman spectra of liquid water from ab initio molecular dynamics: vibrational signatures of charge fluctuations in the hydrogen bond network,” J. Chem. Theory Comput. 9, 4124–4130 (2013).
- Pan and Galli (2020) Ding Pan and Giulia Galli, “A first principles method to determine speciation of carbonates in supercritical water,” Nat. Commun. 11, 1–6 (2020).
- Gygi (2008) Francois Gygi, “Architecture of qbox: A scalable first-principles molecular dynamics code,” IBM J. Res. & Dev. 52, 137–144 (2008).
- qbo (2008) (2008), http://qboxcode.org/.
- Perdew et al. (1996) John P Perdew, Kieron Burke, and Matthias Ernzerhof, “Generalized gradient approximation made simple,” Phys. Rev. Lett. 77, 3865 (1996).
- Hamann et al. (1979) DR Hamann, M Schlüter, and C Chiang, “Norm-conserving pseudopotentials,” Phys. Rev. Lett. 43, 1494 (1979).
- Vanderbilt (1985) David Vanderbilt, “Optimally smooth norm-conserving pseudopotentials,” Phys. Rev. B 32, 8412 (1985).
- (29) Pseudopotential table, http://fpmd.ucdavis.edu/potentials/.
- Bussi et al. (2007) Giovanni Bussi, Davide Donadio, and Michele Parrinello, “Canonical sampling through velocity rescaling,” J. Chem. Phys. 126, 014101 (2007).
- Baroni et al. (2001) Stefano Baroni, Stefano De Gironcoli, Andrea Dal Corso, and Paolo Giannozzi, “Phonons and related crystal properties from density-functional perturbation theory,” Rev. Mod. Phys. 73, 515 (2001).
- Giannozzi et al. (2009) Paolo Giannozzi, Stefano Baroni, Nicola Bonini, Matteo Calandra, Roberto Car, Carlo Cavazzoni, Davide Ceresoli, Guido L Chiarotti, Matteo Cococcioni, Ismaila Dabo, et al., “Quantum espresso: a modular and open-source software project for quantum simulations of materials,” J. Phys.: Condens. Matter 21, 395502 (2009).
- Thalladi and Boese (2000) Venkat R Thalladi and Roland Boese, “Why is the melting point of propane the lowest among n-alkanes?” New J. Chem. 24, 579–581 (2000).
- Nellis et al. (2001) WJ Nellis, DC Hamilton, and AC Mitchell, “Electrical conductivities of methane, benzene, and polybutene shock compressed to 60 GPa (600 kbar),” J. Chem. Phys. 115, 1015–1019 (2001).
- Bini et al. (1995) Roberto Bini, Lorenzo Ulivi, Hans J Jodl, and Pier R Salvi, “High pressure crystal phases of solid CH4 probed by Fourier transform infrared spectroscopy,” J. Chem. Phys. 103, 1353–1360 (1995).
- Bini and Pratesi (1997) Roberto Bini and Gabriele Pratesi, “High-pressure infrared study of solid methane: phase diagram up to 30 GPa,” Phys. Rev. B 55, 14800 (1997).
- Buldakov et al. (2013) MA Buldakov, BV Korolev, II Matrosov, DV Petrov, and AA Tikhomirov, “Raman gas analyzer for determining the composition of natural gas,” J. Appl. Spectrosc. 80, 124–128 (2013).
- Shimanouchi et al. (1972) Takehiko Shimanouchi et al., Tables of molecular vibrational frequencies consolidated volume I (US Department of Commerce, National Bureau of Standards, 1972).
- Gygi et al. (2003) François Gygi, Jean-Luc Fattebert, and Eric Schwegler, “Computation of maximally localized wannier functions using a simultaneous diagonalization algorithm,” Comput. Phys. Commun. 155, 1–6 (2003).
- Marzari et al. (2012) Nicola Marzari, Arash A Mostofi, Jonathan R Yates, Ivo Souza, and David Vanderbilt, “Maximally localized wannier functions: Theory and applications,” Rev. Mod. Phys. 84, 1419 (2012).