11email: rossella.ragusa@inaf.it 22institutetext: University of Naples ”Federico II”,via Cinthia 21,Naples 80126, Italy 33institutetext: School of Physics, University of New South Wales, NSW 2052, Australia 44institutetext: INAF-Astronomical Abruzzo Observatory, Via Maggini, 64100, Teramo, Italy 55institutetext: Centre for Astrophysics and Supercomputing, Swinburne University of Technology, Hawthorn, Victoria 3122, Australia 66institutetext: Instituto de Astrofísica, Facultad de Física, Pontificia Universidad Católica de Chile, Av. Vicuña Mackenna 4860, 7820436 Macul, Santiago, Chile 77institutetext: INAF Astronomical Observatory of Padova, Via dell’Osservatorio 8 , I-36012, Asiago (VI), Italy
VEGAS: A VST Early-type GAlaxy Survey.
Abstract
Aims.
Methods.
Results.
Abstract
Context. In this paper we present ultra-deep images of the compact group of galaxies HCG 86 as part of the VEGAS survey.
Aims. Our main goals are to estimate the amount of intra-group light (IGL), to study the light and color distributions in order to address the main formation process of the IGL component in groups of galaxies.
Methods. We derived the azimuthally averaged surface brightness profiles in the , and bands with and average colors and color profiles for all group members. By fitting the light distribution, we have extrapolated the contribution of the stellar halos plus the diffuse light from the brightest component of each galaxy. The results are compared with theoretical predictions.
Results. The long integration time and wide area covered make our data deeper than previous literature studies of the IGL in compact groups of galaxies and allow us to produce an extended ( kpc) map of the IGL, down to a surface brightness level of mag/arcsec2 in the band. The IGL in HCG 86 is mainly in diffuse form and has average colors of mag and mag. The fraction of IGL in HCG 86 is % of the total luminosity of the group, and this is consistent with estimates available for other compact groups and loose groups of galaxies of similar virial masses. A weak trend is present between the amount of IGL and the early-type to late-type galaxy ratio.
Conclusions. By comparing the IGL fraction and colors with those predicted by simulations, the amount of IGL in HCG 86 would be the result of the disruption of satellites at an epoch of . At this redshift, observed colors are consistent with the scenario where the main contribution to the mass of the IGL comes from the intermediate/massive galaxies ( M⊙).
Key Words.:
Galaxies: evolution - Galaxies: photometry - Galaxies: group: general - Galaxies: interactions- intergalactic medium - Galaxies: group: individual: HCG 861 Introduction
In the -Cold Dark Matter scenario, clusters of galaxies are expected to grow over time by accreting smaller groups (e.g. De Lucia et al., 2006). The intra-cluster light (ICL) is the end product of the material stripped from the galaxy outskirts and/or the disruption of dwarf galaxies during the infall of galaxies in the potential well of the brightest cluster galaxy (e.g. Rudick et al., 2010; Cui et al., 2014; Contini et al., 2014; Montes & Trujillo, 2014; Jiménez-Teja et al., 2018; Pillepich et al., 2018; DeMaio et al., 2018; Henden et al., 2020; Contini et al., 2019; DeMaio et al., 2020). The ICL is therefore a diffuse and very faint component ( mag/arcsec2) that grows over time during the infall process (Mihos, 2015).
In this framework, extended and rich structures of clusters of galaxies form by the assembly of smaller elements of groups of galaxies, which have typical virial masses in the range (e.g. Bower & Balogh, 2004). Galaxies spend most of their evolutionary life in groups (Miles et al., 2004; Robotham et al., 2011) and the intra-group light (IGL), which builds during the galaxy interactions and merging in these environments, is the precursor of the ICL in clusters of galaxies (e.g. Cañas et al., 2020). The ICL, as well as the IGL, are therefore key parameters to map the mass assembly history in all dense environments. Given the low-surface brightness levels involved, this is one of the most challenging tasks in the era of deep imaging and spectroscopic surveys. A great improvement has been possible in the last two decades thanks to the effort to study the low-surface brightness (LSB) structures in groups and clusters of galaxies, out to the intra-cluster regions (e.g. Slater et al., 2009; Ferrarese et al., 2012; van Dokkum et al., 2014; Watkins et al., 2014; Duc et al., 2015; Mihos, 2015; Fliri & Trujillo, 2016; Muñoz et al., 2015; Merritt et al., 2016; Mihos et al., 2017a; Watkins et al., 2016; Trujillo & Fliri, 2016; Mihos et al., 2017b; DeMaio et al., 2018; Huang et al., 2018b, a; Montes & Trujillo, 2019; Zhang et al., 2019; DeMaio et al., 2020; Montes et al., 2021; Martinez-Delgado et al., 2021). The VST Early-type GAlaxy Survey (VEGAS111Visit the website http://www.na.astro.it/vegas/VEGAS/Welcome.html) has played a pivotal role in this field. By combining the large field of view of OmegaCAM@VST and long integration time, VEGAS data allow us to map the surface brightness of galaxies down to mag/arcsec2 and out to about 10 effective radii (), to estimate the ICL/IGL and therefore to relate galaxy structure to the environment (see Iodice et al., 2017; Spavone et al., 2018; Cattapan et al., 2019; Iodice et al., 2019, 2020; Spavone et al., 2020; Raj et al., 2020, and references therein).
In this paper we present new deep images of the Hickson Compact Group HCG 86, as part of the VEGAS sample. Hickson compact groups (HCGs) host from four to ten very close galaxies (Hickson, 1982), with low velocity dispersion ( km/s) and angular size (i.e. angular diameter of the circle containing the group) in a range of arcmin. The compact configuration makes HCGs among the best sites to study the IGL, since the frequent galactic interactions and intense stripping are very efficient mechanisms in the build-up of the diffuse light component. The most recent studies of IGL in HCGs estimated an IGL fraction ranging from 0% up to 46%, compared to the total light of the group and a maximal extension of 80 kpc from the group center (Da Rocha & Mendes de Oliveira, 2005; Da Rocha et al., 2008). HCG 79 is the most compact group in the Hickson catalogue (Hickson et al., 1992) and Da Rocha & Mendes de Oliveira (2005) find a very large amount of IGL in this group, about 46% of the total group light. The IGL component presents an irregular shape and there are signs of strong past interactions between group members, which induced bars, tidal tails and dust lanes. They conclude that this group is in a very advanced stage of evolution, close to collapse into a single structure. In contrast no IGL component was detected in HCG 88, formed by four late-type galaxies (Da Rocha & Mendes de Oliveira, 2005). In the group 90% of the neutral HI gas is still associated with the galaxy disks (Verdes-Montenegro et al., 2001), suggesting that it is in an early phase of its evolution. According to the IGL fraction and galaxy morphologies, the other HCGs analyzed in previous works seem to be at intermediate stages of their evolution (Da Rocha & Mendes de Oliveira, 2005; Da Rocha et al., 2008). HCG 95 presents a spherical IGL component that corresponds to about 10% of the total light of the group, and to about one third of the total light of HCG 95A, the brightest group galaxy (BGG). Since there are clear signs of interactions between HCG 95A and HCG 95C, the IGL probably formed by the stripping of material from the interacting galaxies (Da Rocha & Mendes de Oliveira, 2005). In HCG 15, HCG 51 and HCG 35 the IGL fraction is very similar, at 19%, 26% and 15% of the total light of the group. These components have irregular morphologies, suggesting that these HCGs are far from being relaxed and virialized structures (Da Rocha et al., 2008). Recently, Poliakov et al. (2021) studied the IGL in a large sample of HCGs. Authors found that the average surface brightness for IGL is in a range of mag/arcsec2 for all groups in the sample, and the fraction in five groups ranges from to . They concluded that the mean surface brightness of the IGL depends on the total luminosity of the group and becomes brighter in the groups with a larger fraction of early-type galaxies.
The Hickson compact group HCG 86 is a quartet of early-type galaxies (ETGs), with a virial mass of (Coziol et al., 2004), located at a distance of 81.73 Mpc (Hickson et al., 1992). The mass-to-light ratio of the group in the K-band is 50, and the average velocity dispersion of the group members is 368 km/s (see Tab. 2 Díaz-Giménez et al., 2012). According to Proctor et al. (2004), the two brightest members of the group, HCG 86A and HCG 86B, are 12.8 Gyr and 9 Gyr old, respectively, based on ages and metallicities of unresolved (integrated light) stellar populations, measured from Lick system analysis. Ribeiro et al. (1998) analyzed the structural and dynamical properties of HCG 86 in a region of around the group. They found that HCG 86 has the most members and is the most complex group of their catalogue, since it consists of two different kinematic structures, centred on the BGG HCG 86A and on HCG 86B. Based on their analysis, the authors proposed two possible scenarios for group formation: it could be a bimodal structure in a merging process, or it is a single group, not relaxed yet, where HCG 86B is an extension of HCG 86A in the velocity space. In the latter case, considering the numerous dwarf galaxy members (, Ribeiro et al., 1998), HCG 86 turns to have the most members and be the complex group in the HCGs catalogue. On a larger scale, HCG 86 seems to be part of a loose cluster of galaxies, which is not dynamically relaxed. The particular configuration of HCG 86 can give key insights into the formation of IGL. The new multi-band images presented in this work represent the deepest data available to study the IGL in the HCG environment. This pilot work shows what can be achieved in low surface brightness (LSB) analysis for groups of galaxies.
This work is organized as follows. In Sec. 2 we present the observations and the data reduction. In Sec. 3 we describe in detail the method used for the data analysis (i.e. the surface photometry). In Sec. 4.1 we present the results on the intra-group light in HCG 86 and in Sec. 5 we compare our results with the previous ones presented in the literature, both on the observational and theoretical side. In Sec. 6 we summarise the results obtained in this study and draw conclusions.
We have adopted a distance for HCG 86 of 81.73 Mpc. To estimate all the distances of this work we used the heliocentric radial velocity (see Tab. 6), given by NED (NASA IPAC Extragalactic Database), and = 73 km s-1 Mpc-1 (Riess et al., 2018). Therefore, 1 arcsec corresponds to 0.4 kpc. The magnitudes through out the paper are provided in the AB system, and are corrected for Galactic extinction using the extinction coefficients provided by Schlafly & Finkbeiner (2011).
| ID | R.A | Decl. | v | N | b/a | H0tcr | / | |||||||
| (1) | (2) | (3) | (4) | (5) | (6) | (7) | (8) | (9) | (10) | (11) | (12) | (13) | (14) | (15) |
| [J2000] | [J2000] | [km/s] | [mag arcsec-2] | [arcmin] | [kpc h-1] | [km/s] | [h /] | [] | [kpc] | |||||
| HCG 86 | 19:51:59 | - 30:49:31 | 5891 | 4 | 9.47 | 20.22 | 3.90 | 46.60 | 0.80 | 368 | 0.011 | 50 | 8.51 x | 410 |
2 Deep images of HGC 86: observations and data reduction
The data presented in this work are from the VEGAS survey. VEGAS is a multi-band u, g, r and i imaging survey carried out with the European Southern Observatory (ESO) Very Large Telescope Survey Telescope (VST). The VST is a 2.6 m wide field optical telescope (Schipani et al., 2012) equipped with OmegaCAM, a camera with a resolution of arcsec pixel-1. The data we present in this work were acquired in visitor mode (run ID: IDs:103.A-0181A), during dark time in photometric conditions, with an average seeing of FWHM arcsec in the band, FWHM arcsec in the band and FWHM arcsec in the band. The -band image is the deepest one, with an exposure time of 5 hours. The total integration time in the and bands are 3.25 hours and 2.05 hours, respectively. Observations were acquired adopting the standard diagonal dithering strategy. As described in Capaccioli et al. (2015) and Spavone et al. (2017), for the targets observed with this strategy, the background subtraction is performed by fitting a surface, typically a 2D polynomial, to the pixel values of the mosaic that are unaffected by celestial sources or defects.
All the data were processed using the dedicated AstroWISE pipeline developed to reduce OmegaCam observations (McFarland et al., 2013; Venhola et al., 2018). The various steps of the AstroWise data reduction were extensively described in Venhola et al. (2017, 2018).
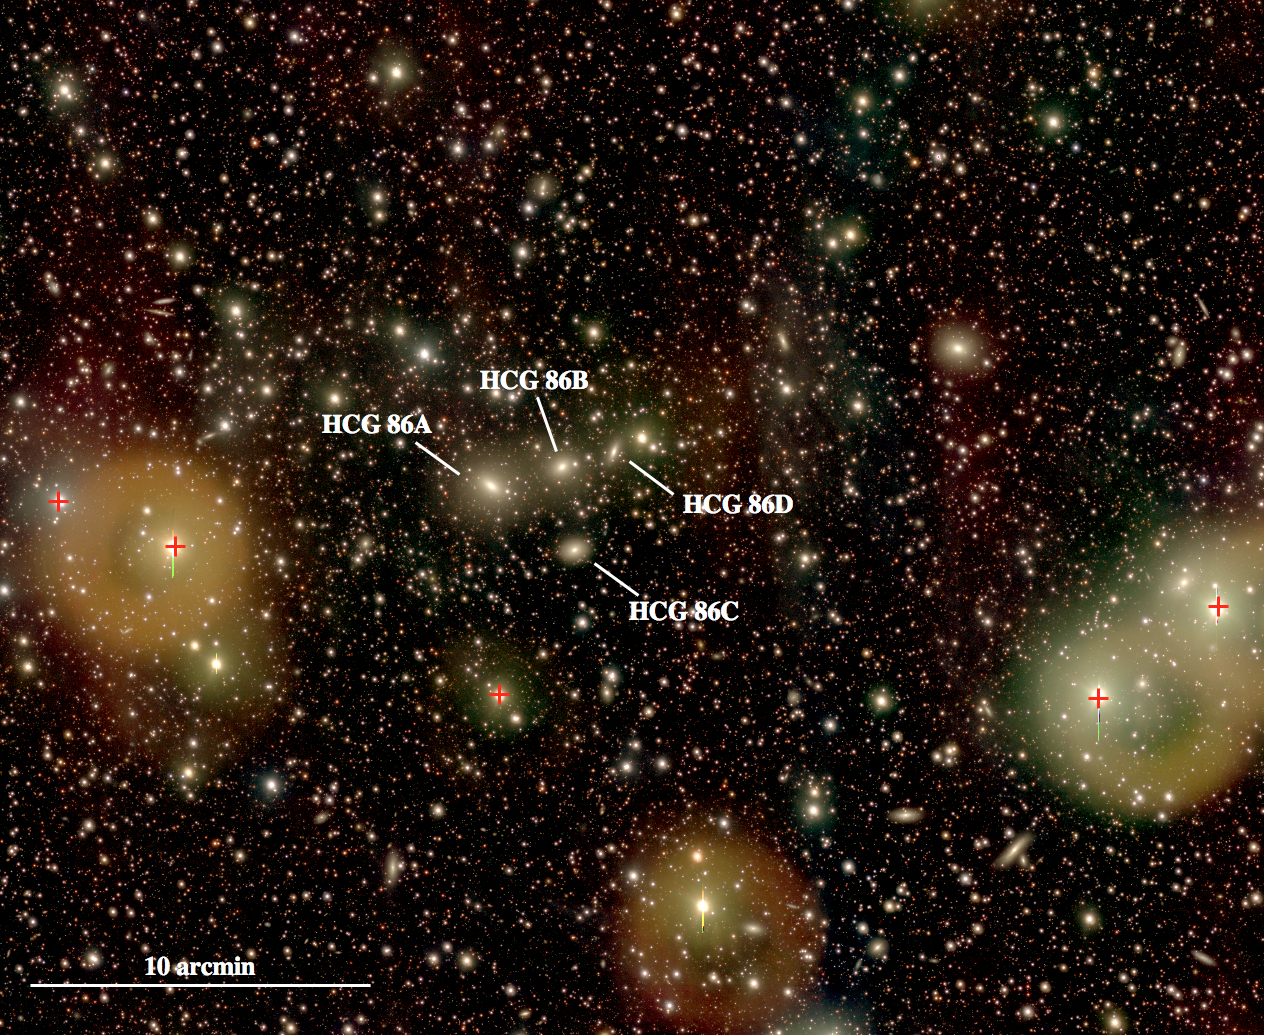
In Fig. 1 we show the resulting sky-subtracted color composite VST image obtained for HCG 86. The surface brightness depths at over the average seeing area of FWHM=1.26 arcsec, are mag/arcsec2, mag/arcsec2 and mag/arcsec2 in the , and band respectively.
3 Data Analysis: surface photometry
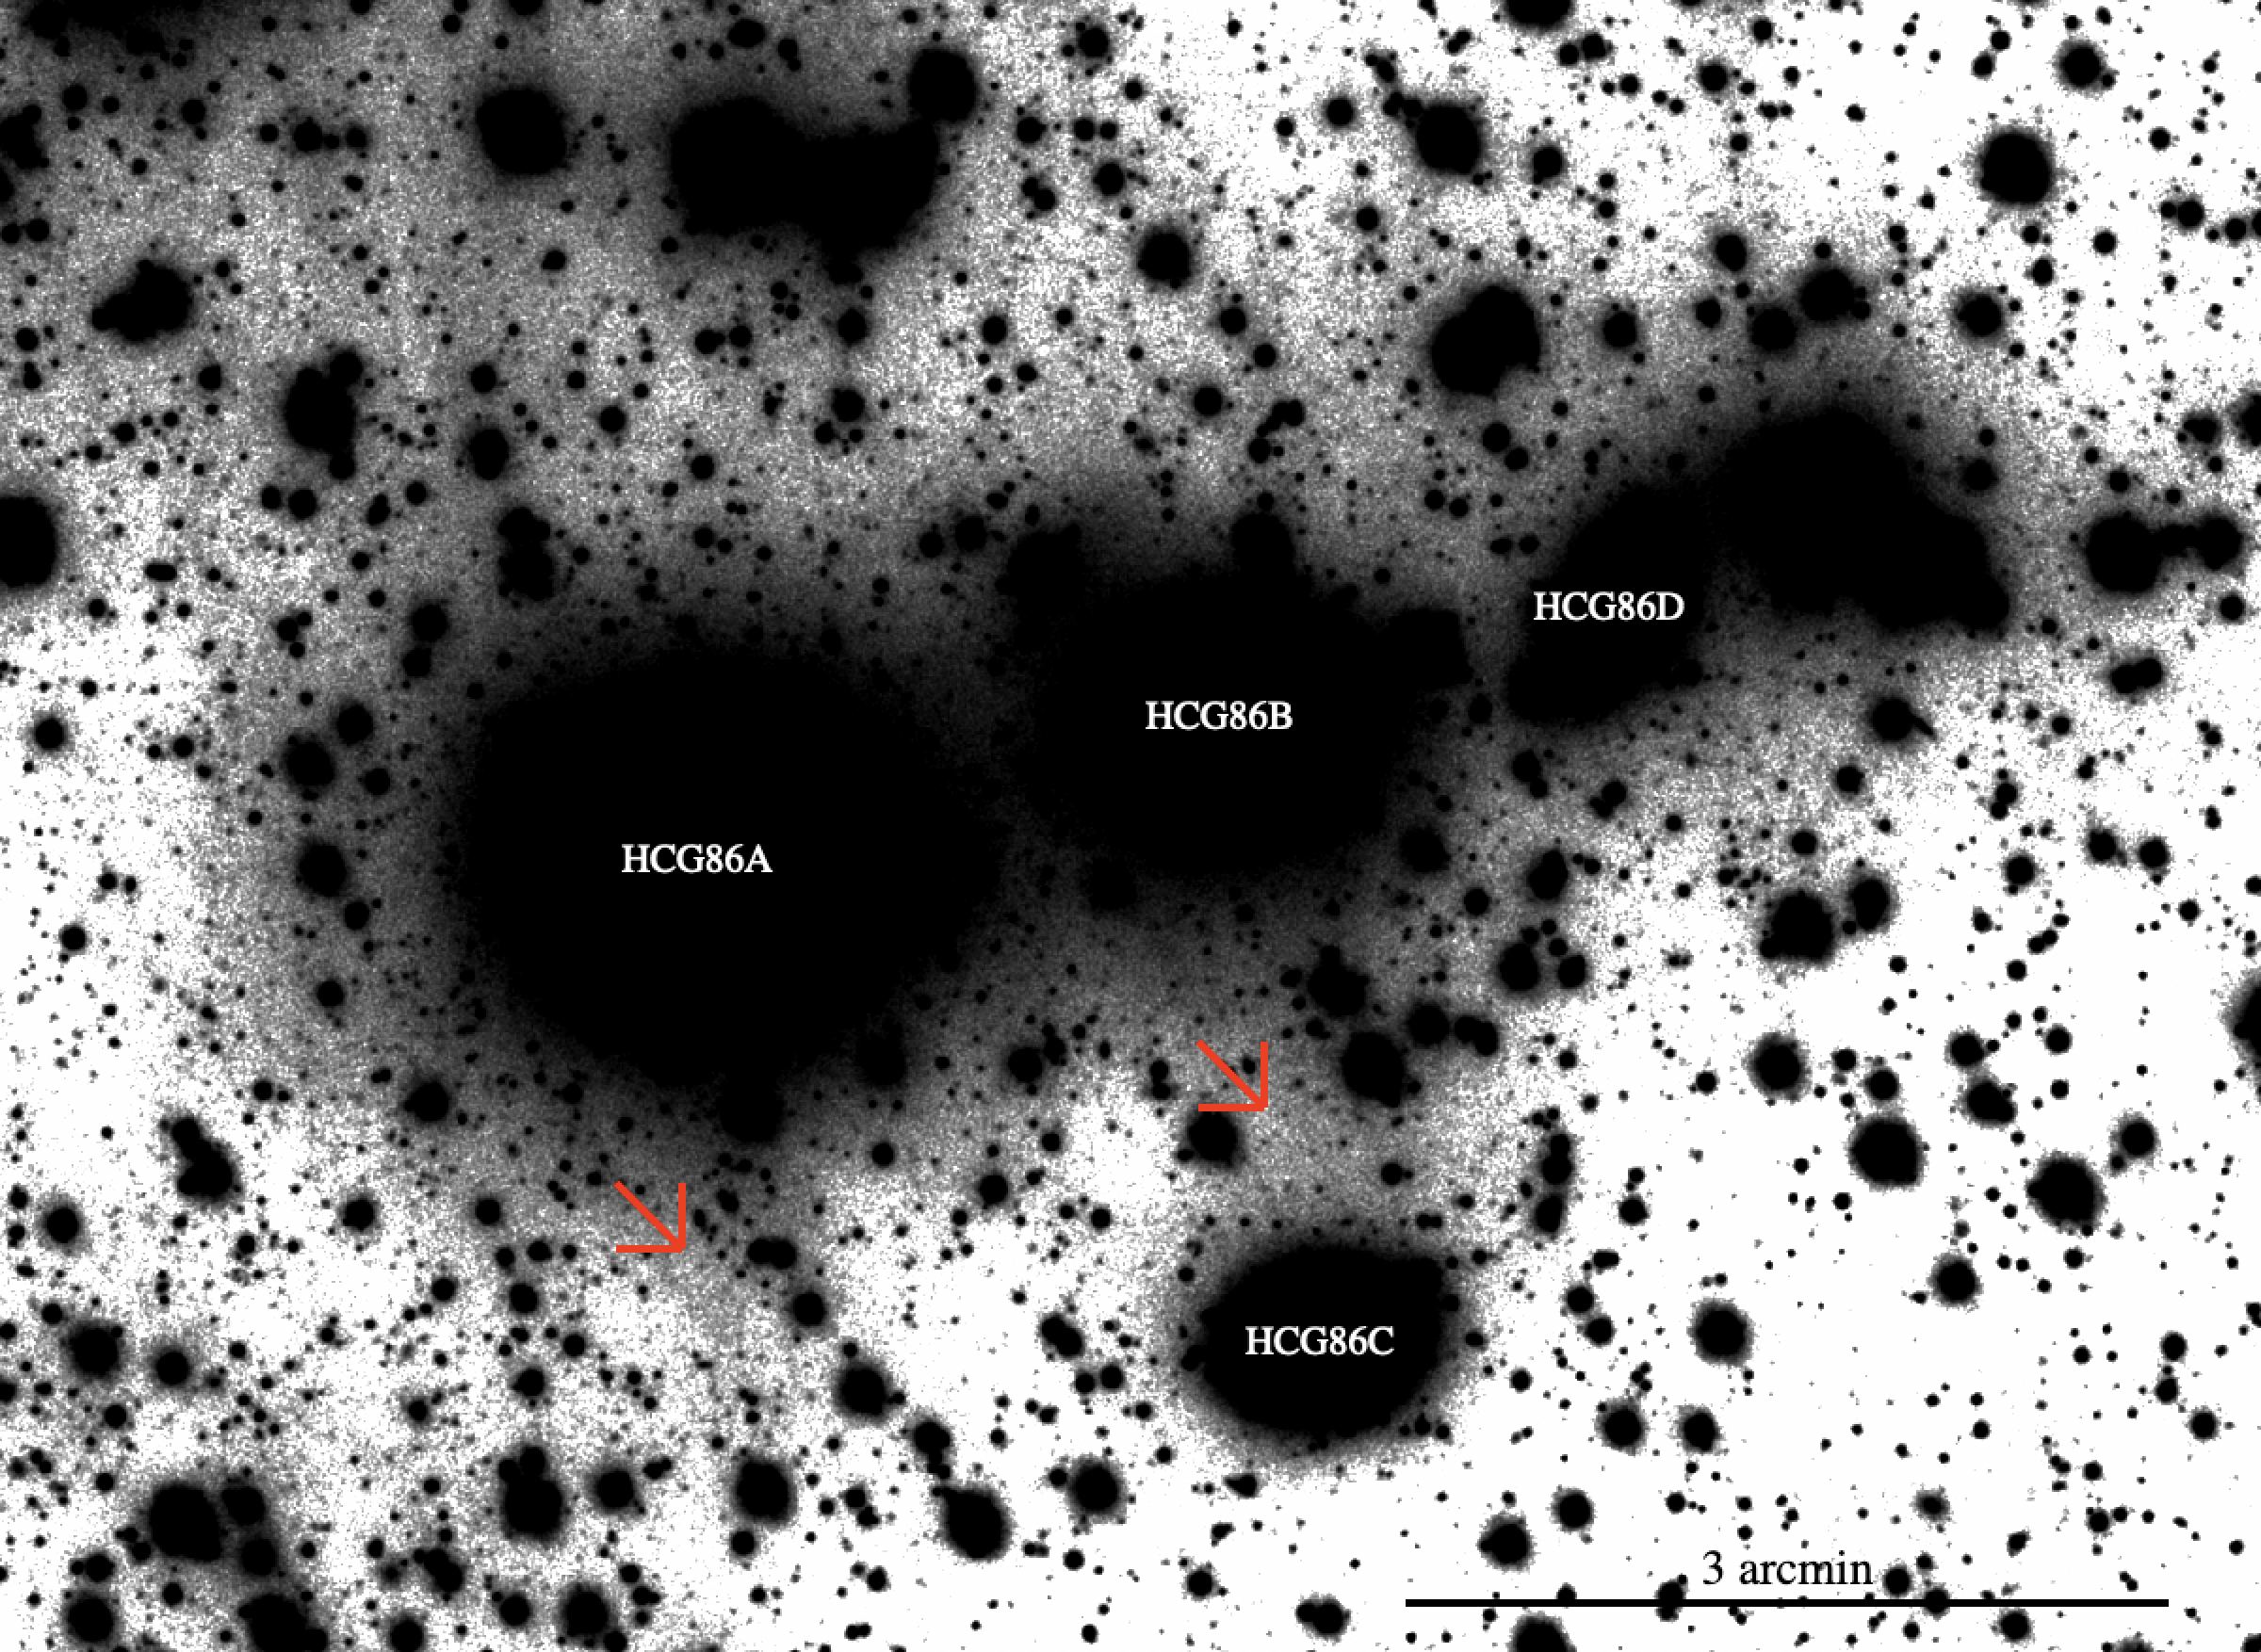
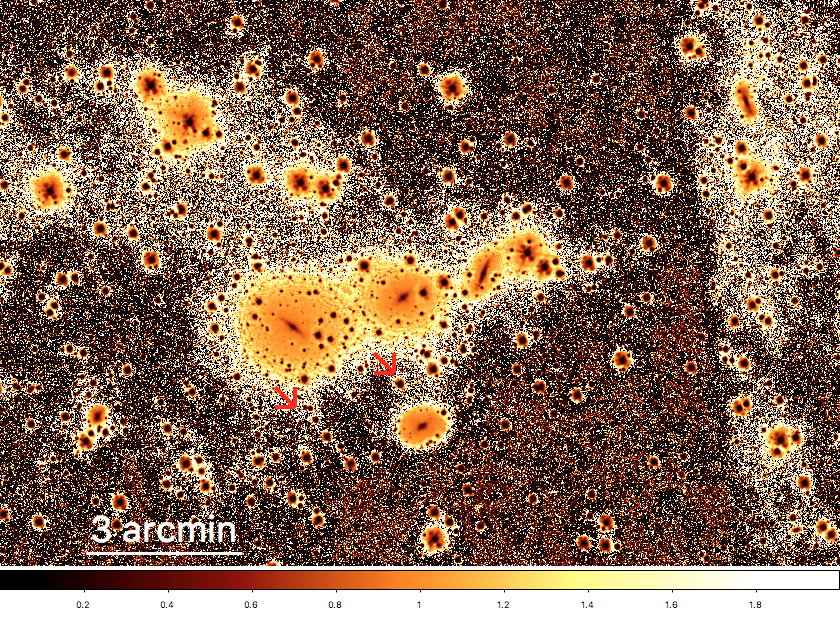
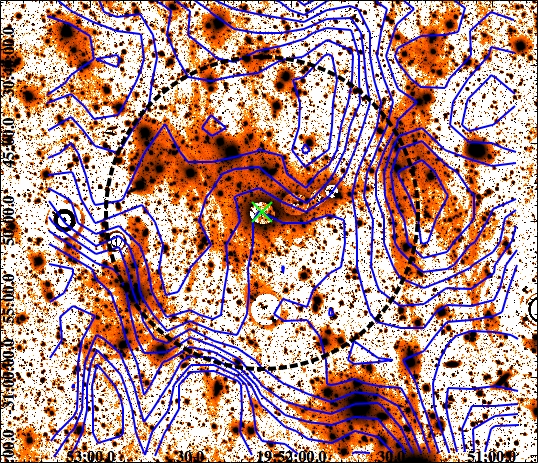
Fig. 2 shows an enlarged region of the deep VST image in the band centred on the HCG 86 group. The deeper VST data shows a large amount of diffuse light, mainly located in the galaxies’ envelopes. The diffuse light is at least two times more extended than the brightest central regions of the group members. In addition, in the Southern part of the group, we detect a faint stellar bridge ( mag/arcsec2) connecting HCG 86C with the group center of about 1.2 arcmin long and 1 arcmin wide, and two faint streams ( arcmin long) protruding from the SE regions of HCG 86A (these are marked with red arrows in Fig. 2). There is also an extended region of diffuse light in the North of the group located about 4 arcmin from the group centre, but this could be due to light emitted from Galactic cirrus, which contaminates the area (see details in Sec. 4.2). Similar features stand out from the unsharp-masked -band image, shown in Fig. 3. This have been obtained using the FMEDIAN task in IRAF, with smoothing boxes of pixels, and taking the ratio of the -band image to its FMEDIAN smoothed version. The image shows the extended envelope of diffuse light associated with the group, which is symmetrically distributed around the galaxies, and the cirrus emission on the West and North-East sides. The bridge connecting the group with HCG 86C and the South-East filamentary structure are also well defined in shape. The small smoothing box allow us to reveal the internal structure of the group members: HCG 86A has a disk in the central region, a bar-like feature appears to be present in both HCG 86B and HCG 86C, and the disk in HCG 86D appears warped in the outskirts.
The main goal of this work is to estimate the diffuse light in the intra-group region. To this aim, two main steps are needed in the data analysis: i) the contamination from all sources (foreground stars, background galaxies and cirrus emission) that contribute to the light must be carefully taken into account; ii) the light distribution from the bright group members must be modelled and subtracted from the total budget of the emitted light associated with the group (i.e. galaxy light plus IGL). In the following sections we describe the tools and methods adopted in each step. They have all been successfully applied to the previous VST images and optimised to detect and study the LSB features, including the ICL, in several already published papers (see Iodice et al., 2017; Spavone et al., 2018; Cattapan et al., 2019; Iodice et al., 2019, 2020; Spavone et al., 2020; Raj et al., 2020).
3.1 Galactic Cirrus emission in region of HCG 86
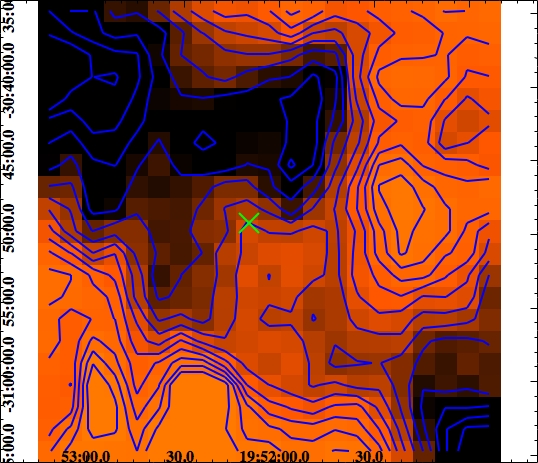
The Galactic cirrus emission is a non-negligible source of contamination in LSB imaging. In the optical, the Galactic cirrus emission is due to the starlight belonging to the Milky Way, diffused by dust in the local interstellar medium, and then re-emitted in the infrared. Therefore, images in the infrared can be used to evaluate the importance of this contamination. In deep optical imaging, such emission creates pseudo-structures that resemble LSB features, like tidal tails or stellar streams (Cortese et al., 2010; Mihos, 2019; Duc et al., 2015). In Fig. 2 many filamentary structures typical of cirrus are clearly visible. The most prominent is in the West, extending North-South for about arcmin. From the NASA/IPAC Infrared Science Archive we derived the 100 map in the region of the HCG 86 group, shown in Fig. 4. The 100 map confirms that light from cirrus dominates in the filamentary structure in the West and also in the South-East of the group. Lower emissions are observed North/North-East and to the South-West of the group.
The lower spatial resolution of the IRAS map does not allow us to resolve all of the features visible in the VST optical images.
The contribution of the cirrus emission to the diffuse light in HCG 86 will be discussed in detail in Sec. 4.2. At this step of the analysis, we derive the intensity contours of the Galactic cirrus emission from the 100 map (see left panel of Fig. 4) to build an accurate mask333The mask has been created by using the IRAF task MSKREGIONS. of all the regions contaminated by the cirrus emission. This is used in the fitting of the light distribution of stars (Sec. 3.2) and galaxies (Sec. 3.3) in order to exclude this contribution from the analysis.
3.2 Removal of the scattered light from the bright stars
In order to remove the contamination of the scattered light from the brightest stars in the field, we performed a 2-dimensional (2D) fit of the light distribution by adopting a circularly symmetric model for each of them. This is based on the isophote fit using the IRAF task ELLIPSE (fixing the centre, position angle and ellipticity), mapping the light almost out to the edge of the frame, i.e. 33 arcmin. This fit was carried out after having carefully masked the core of the group, all background and foreground sources, and all the regions affected by the Galactic cirrus emission (see Sec. 3.1). In order to preserve the light associated with the group, including the faint emission from the IGL, we adopted a circular mask centred on the brightest group member HCG 86A with a radius of 13.5 arcmin. This value corresponds to 0.8 the virial radius of the group (see Tab. 2).
We derived a 2D model of each star using the IRAF task BMODEL, and this was then subtracted from the image. Six stars are modelled in the field444The modelled stars are the following: TYC 7439709-1 R.A.=19:52:07 and DEC=-30:55:35.68 with mag, HD 187783 R.A.=19:52:52 DEC=-30:51:18 with mag, CD 3117130 R.A.=19:53:08 DEC=-30:49:57 with mag, HD 187368 R.A.=19:50:45 DEC=-30:55:43.6 with mag, HD 187309 R.A.=19:50:29 DEC=-30:53:03 with mag, R.A.=19:51:48.2 and DEC=-30:48:07.8., two on the East side, two on the West side and one more on the South side of HCG 86C (marked in Fig. 1), all brighter than mag. The star next to HCG 86D was also modelled and subtracted to prevent its scattered light from affecting the light profile of the galaxy. Since the 2D model we performed for the brightest stars is symmetric, it cannot account for the bright ghosts that are present around them. They are due to the asymmetry of the point-spread functions, which depends on their position in the camera. However, they do not contribute to the scattered light at larger distance from each stars, which is the contribution that we aim at estimating for the purpose of this work. Therefore, once the symmetric model is subtracted from the parent image, the residuals around each star and the ghosts are masked.
3.3 Estimate of the limiting radius and isophote fitting
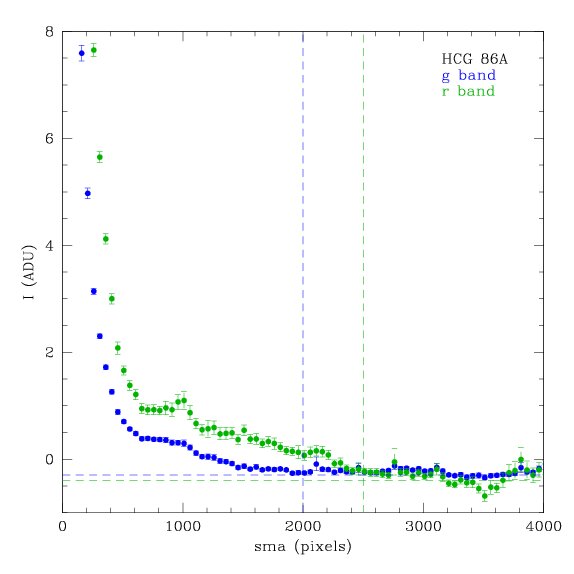
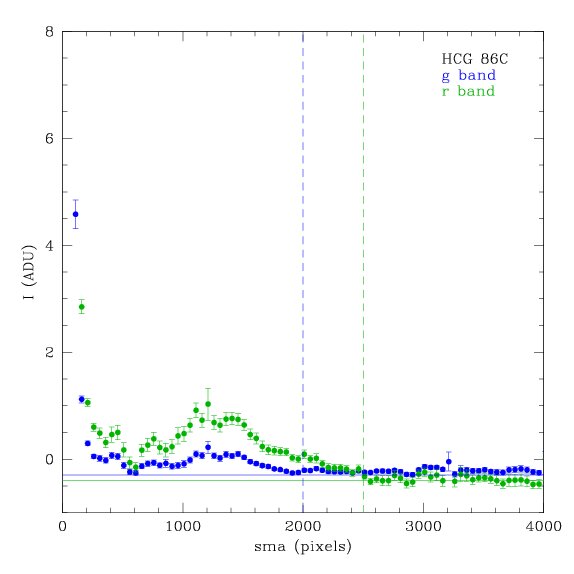
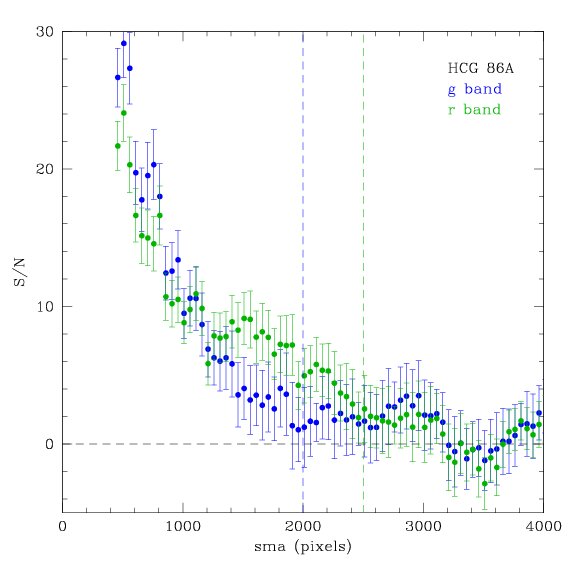
To derive the azimuthally averaged surface brightness profiles for the brightest group members, in all bands, we used the method from Pohlen & Trujillo (2006), which has also been used for the analysis of VST data by Iodice et al. (2016) and in all subsequent papers based on VEGAS data. This is based on two steps: 1) estimate of the limiting radius Rlim, and 2) fit of the isophotes out to Rlim for each galaxy of the group.
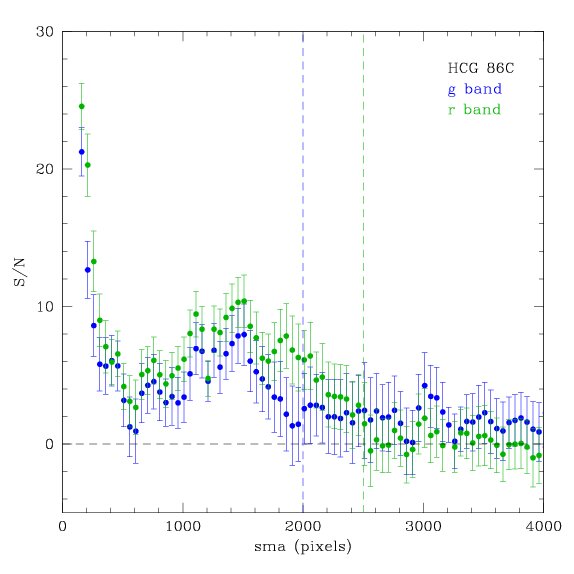
The limiting radius Rlim sets the limit of the data, where the galaxy’s light blends into the background fluctuations and the signal-to-noise ratio (S/N) is about one. Since the images are sky-subtracted, the background fluctuations are the deviations with respect to the average sky value. To estimate Rlim and the background fluctuations (which also provide an estimate of the accuracy of the sky-subtraction and flat-fielding) we have performed the fit of the isophotes, of the brightest group members HCG 86A and of HCG 86C (which maps a different region of the image) out to the edge of the star-removed image, in each band. According to Pohlen & Trujillo (2006), this is done over elliptical annuli (i.e. fixing the ellipticity and position angle), by using the IRAF task ELLIPSE with a median sampling and k-sigma clipping algorithm for cleaning deviant sample points at each annulus. The extensive experience acquired with previous works, shows that this approach (i.e. combining the median sampling and sigma clipping rejection algorithm) improves the isophotal fitting. Since all the other bright group members (HCG 86B and HCG 86D) are close in space to HCG 86A, we can reasonably assume the same value of Rlim derived for HCG 86A. At this step, we made two new masks. One is needed to exclude from the fit all sources outside the group region (including previous identified background and foreground sources, plus the cirrus emission and residuals around the bright stars, that were subtracted from the image, see Sec. 3.1 and Sec. 3.2) and all the other group members except HCG 86A. For each galaxy, the masking process is very accurate in order to take into account the symmetry of the object and the region overlapping with HCG 86A. The second mask is adapted to exclude also the group center, and allow us to perform the fit centered on HCG 86C.
In Fig. 5 we show the fitted isophote intensity as a function of the semi-major axis (sma) centered on HCG 86A (HCG 86B and HCG 86D share the same envelope as HCG 86A) and HCG 86C. Both fits provide consistent values for Rlim, with R arcmin in the band and R arcmin in the band. Since the -band images are shallower, the limiting radius is smaller, R arcmin, for both regions. The S/N is shown in the lower panels of Fig. 5. At from the galaxy center S/N in both and bands, and the residual background fluctuations are ADU, ADU and ADU in the , and bands, respectively. These values have been taken into account to compute the corresponding surface brightness magnitude limits and error estimate555The total uncertainty on the surface brightness magnitudes takes into account the uncertainties on the photometric calibration ( mag) and the RMS in the background fluctuations. They have been calculated with the following formula: , where , with N is the number of pixels used in the fit, is the rms on the sky background and is the error on the photometric calibration (Capaccioli et al., 2015; Seigar et al., 2007)..
Once the Rlim has been derived, we performed the fitting of the isophotes for all the galaxies of the group out to Rlim, where all the shape parameters (i.e. ellipticity and P.A.) are left free. Since the ELLIPSE task does not allow us to account for the light distribution of all galaxies in a single run, we proceeded iteratively by fitting one galaxy at a time, adjusting the mask accordingly. This is described in detail in the next section.
| Galaxy | Morph. | R.A | Decl. | He-rad. | g-r | r-i | ||||
|---|---|---|---|---|---|---|---|---|---|---|
| Type | [J2000] | [J2000] | vel.[km/s] | [mag] | [mag] | [arcsec] | [kpc] | [mag] | [mag] | |
| (1) | (2) | (3) | (4) | (5) | (6) | (7) | (8) | (9) | (10) | (11) |
| E2 | 19:52:08.76 | -30:49:32.70 | 6013 | 12.57 0.06 | 13.33 0.01 | 130 | 52 | 1.08 0.02 | 0.79 0.02 | |
| E2 | 19:51:59.06 | -30:48:58.40 | 5863 | 13.3 0.2 | 13.80 0.01 | 287.7 | 115 | 0.98 0.02 | 0.77 0.02 | |
| SB0 | 19:51:57.46 | -30:51:25.01 | 5317 | 14.60 0.02 | 14.88 0.01 | 7.67 | 3 | 1.12 0.03 | 0.84 0.03 | |
| S0 | 19:51:51.94 | -30:48:30.4 | 5923 | 14.1 0.1 | 14.64 0.02 | 25.62 | 10.25 | 1.00 0.04 | 0.71 0.03 |
.
3.4 Fit of the galaxy light distribution
In order to estimate the total amount of the IGL, the contribution to the light of the brightest inner regions of the galaxies in the group must be modelled and subtracted. As mentioned in the previous section, this is an iterative process made of the following steps. For each of the four brightest group members, starting with HCG 86A, and in each band, we have i) performed the isophote fit (see Sec. 3.3) to derive the azimuthally-averaged surface brightness profile, out to Rlim; ii) fitted the 1-dimensional (1D) profiles adopting multi-component empirical laws to estimate the transition radius between the brightest central region of the galaxy and the faintest outskirts; iii) derived the 2D model of the inner component at , using the IRAF task BMODEL, and subtracted it from the entire image. On this residual image we perform the isophote fit of each group member in turn. A new mask is made at each step of the fitting analysis, where all contributions from background/foreground objects, cirrus emissions, residuals from subtracted stars are included. In addition, at each step, the residuals of the subtracted 2D model of the brightest regions of each galaxy is also masked and excluded from the fit.
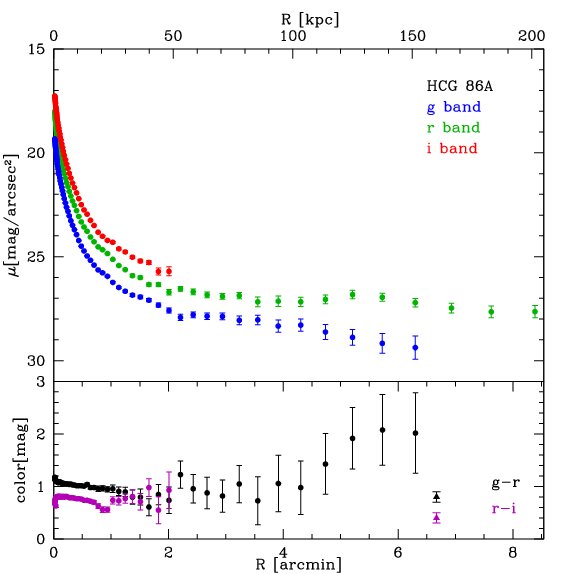
The first fit was performed on the brightest group member, HCG 86A, since it dominates the light distribution. The resulting azimuthally average surface brightness and color profiles for HCG 86A are shown in Fig. 6, where R corresponds to the semi-major axis (sma) in arcmin. We map the surface brightness profiles down to mag/arcsec2, mag/arcsec2 and mag/arcsec2 in the , and band, respectively.
To proceed with the isophote fit for all the other group members, it is necessary to model and subtract the light distribution of each galaxy in the group. To this aim, we need to derive the transition radius Rtr between the brightest parts and the faint outskirts. This is derived by performing the 1D decomposition of the galaxies’ azimuthally-averaged surface brightness profiles. We adopted the fitting procedure introduced by Spavone et al. (2017), also used in other VEGAS papers (see e.g. Spavone et al., 2018, 2020; Cattapan et al., 2019; Iodice et al., 2016, 2020). This is motivated by several observational and theoretical works, which suggested that the stellar envelope in the galaxies’ outskirts can be reproduced by adding an additional component to the Sérsic law, which fits well the inner and brightest regions of the galaxy (Seigar et al., 2007; Donzelli et al., 2011; Arnaboldi et al., 2012; Iodice et al., 2016; Spavone et al., 2017, 2020). As addressed in these studies, based on the photometry alone, the contribution of the diffuse light cannot be separated from the stellar envelope (e.g. Gonzalez et al., 2007; Seigar et al., 2007). However an estimate of the total contribution from the faint outskirts (i.e. stellar envelope plus diffuse light) can be disentangled from the bounded and bright emission in galaxies by fitting the total integrated light with analytic models. This is particularly enhanced in compact groups (as HCG 86) where galaxies are so close in projection that their stellar envelopes merge with each other, fully engulfing the intra-group diffuse light.
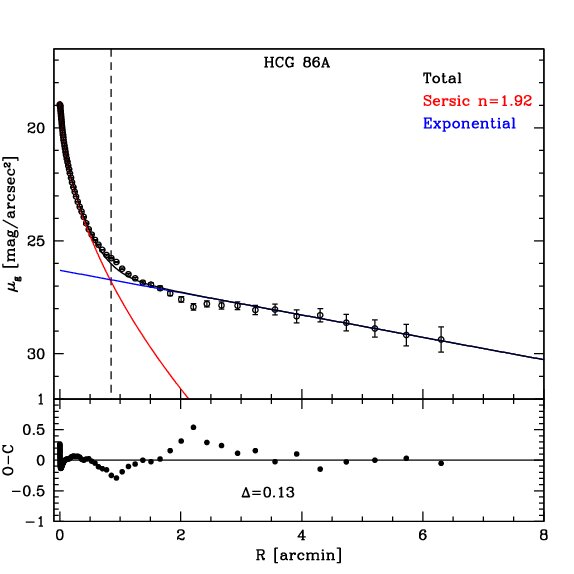
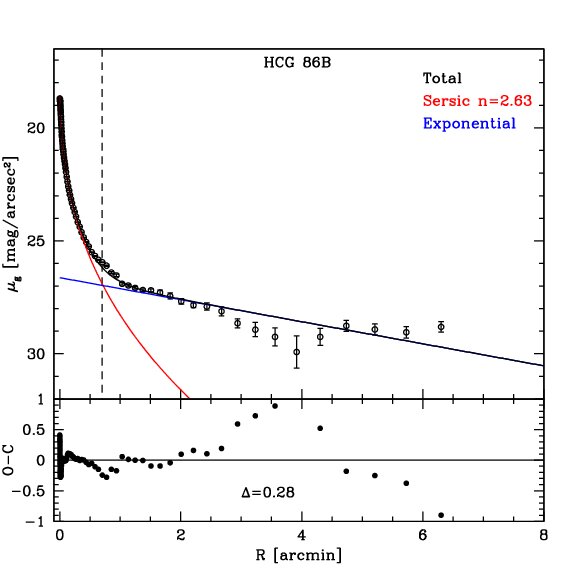
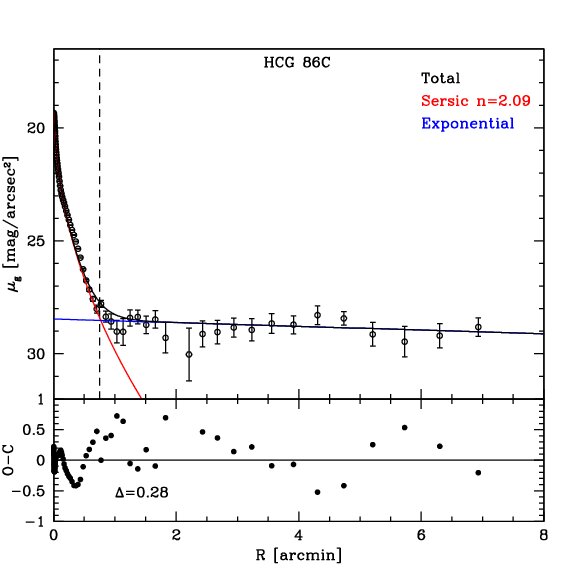
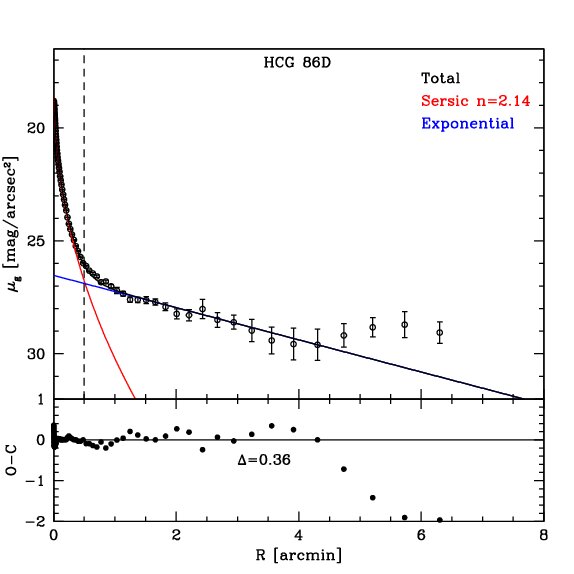
In all HCG 86 group members, we used a Sérsic law to model the main body of the galaxies and an exponential law to reproduce the diffuse component (stellar halo plus the IGL). The results of the fit are provided in Appendix A. The best-fitting parameters are reported in Tab. 3, including .
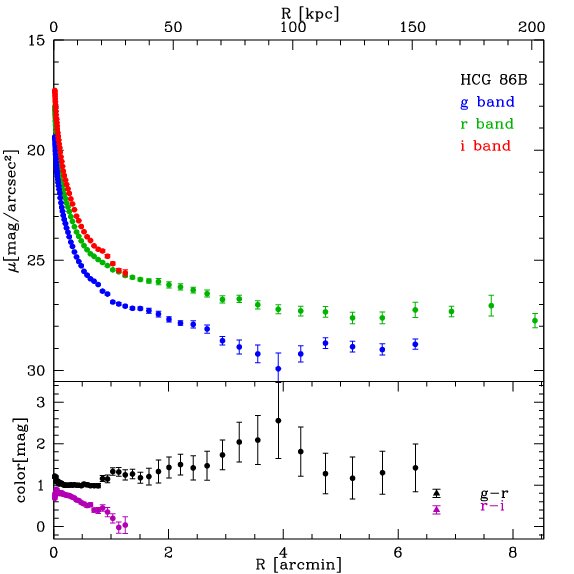
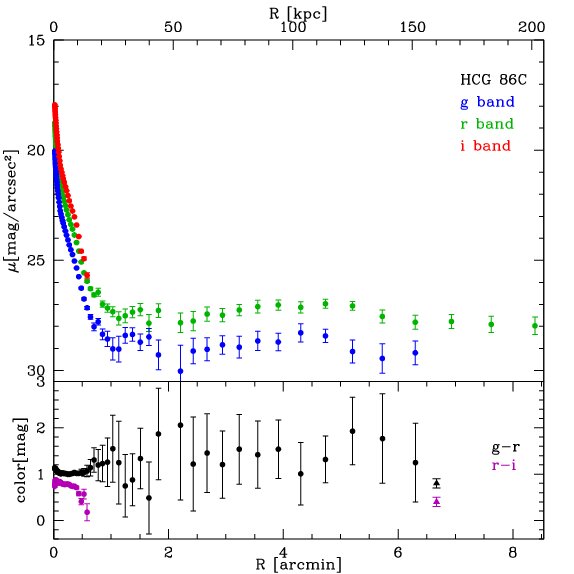
The 1D fit of HCG 86A shows an extended exponential component in the outskirts, at arcsec ( kpc), with a central surface brightness of mag/arcsec2 and a scale length arcsec ( kpc) in the band. Based on the 1D-fitting results, the 2D model for HCG 86A has been made for the brightest regions of the galaxy, i.e. for =51 arcsec, and then subtracted from the image in each band. Using the residual image, the other two galaxies in the core of the group, HCG 86B and HCG 86D, have been modelled in turn, i.e. the azimuthally-averaged surface brightness profiles are obtained from the isophotal analysis and then fitted. As expected, since they are all physically close in projection and completely embedded in a diffuse stellar halo, the surface brightness profiles all show the extended outer exponential component (see Fig. 6). Based on the 1D fit, we have modelled and subtracted only the brightest regions of each galaxy (i.e out to their ) and, consistently, the remaining outer component has a scale length of the same order of magnitude and comparable (see Tab. 3). As a final step, on the resulting image where all the three galaxies in the core of the group have been modelled and subtracted, we have performed the analysis of HCG 86C, the S0 galaxy located to the SE of the group centre (see Fig. 1). The surface brightness profiles for this object also show an extended envelope in and bands, as detected for the three galaxies in the core of the group (see Fig. 6).
The resulting final residual image where all the 2D models of the brightest regions of group members have been subtracted, is shown in the right panel of Fig. 4. This image is then used to estimate the total amount of IGL in the group, assumed to be the contribution of the stellar envelope plus the diffuse light in the intra-group medium.
| Object | |||||||||
|---|---|---|---|---|---|---|---|---|---|
| [mag/arcsec2] | [arcsec] | [kpc] | [mag/arcsec2] | [arcsec] | [kpc] | [arcsec] | [kpc] | ||
| (1) | (2) | (3) | (4) | (5) | (6) | (7) | (8) | (9) | (10) |
| HCG 86A | 22.20.1 | 112 | 4.40.8 | 1.920.06 | 26.300.01 | 1321 | 52.80.4 | 51 | 20.4 |
| HCG 86B | 22.660.08 | 9.10.2 | 3.640.08 | 2.60.2 | 26.60.3 | 13351 | 5320 | 42 | 16.8 |
| HCG 86C | 22.80.2 | 7.50.7 | 3.00.3 | 2.10.2 | 28.50.3 | 80024 | 32010 | 45 | 18 |
| HCG 86D | 22.110.04 | 6.20.2 | 2.480.08 | 2.10.4 | 26.50.2 | 917 | 363 | 30 | 12 |
4 Results
For all the galaxies in the group, the isophote fits give the azimuthally-averaged surface brightness and color profiles as output, shown in Fig. 6. Because the and images are deeper than the -band, the color profiles are more extended in radius (out to arcmin) than the (out to arcmin). For the galaxies in HCG 86 a gradient toward redder colors ( mag) is observed in all the profiles at arcmin. As discussed in detail later in Sec. 4.2, the region where HCG 86 group resides is contaminated by the Galactic cirrus emission. Therefore, we suspect that the observed reddening is due to this contamination, which is stronger in the band with respect to the band (Román et al., 2020). This change in slope in the color profile was observed by Watkins et al. (2016) for the spiral galaxy M64, where the color profiles of the galaxies get redder with radius, and is addressed by cirrus contamination. This effect does not occur in the color since the cirrus in these bands has a comparable emission (for details see also Fig.2 of Román et al., 2020), even though the color profile of the BGG (see top panel in Fig. 6) becomes shallower at arcmin. As described in detail in the following section, this corresponds to the transition radius of the HCG 86A, beyond which the IGL component begins to be present. A similar trend in the color profile was also found in several works (e.g. Zibetti et al., 2005; Coccato et al., 2008; Greene et al., 2015). In particular, for the Abell Cluster 85, Montes et al. (2021) suggested that the reddening in color profile, at larger radii, could be an observational evidence of ICL as accreted stars on the BCG.
Finally, from the azimuthally-averaged surface brightness profile we have derived the total magnitude for each group member and, therefore, the integrated and colors. These are reported in Tab. 6. The total luminosity of the four brightest group members, which includes the brightest central parts, the stellar envelope and IGL, is and , in the and bands respectively.
4.1 The intra-group light in HCG 86
The residual image, obtained by subtracting the models of the brightest stars and galaxies of the group (see Sec. 3.2 and Sec. 3.3), derived in the band, is shown in Fig. 4. This image reveals the distribution of the diffuse intra-group light in HCG 86. The HCG 86 group is fully embedded in an extended envelope of diffuse light, indistinguishable from the stellar halos of the brightest galaxies, elongated in the West-East direction, like the distribution of the members of the group. Several faint filamentary structures, also noted in the original image in Fig. 2, are present in the Southern regions of HCG 86A, where the contamination from the cirrus’s light is at a minimum (see Sec. 4.2). From this image we have derived the azimuthally-averaged surface brightness profiles of the IGL, in both and bands, by fitting the light distribution in circular isophotes, fixing the centre in HCG 86A. These are shown in Fig. 7. We adopted the same mask used for the surface photometry of the galaxies, where all bright sources (foreground stars and background galaxies) and the regions contaminated by cirrus emission (right North of the group and the filament to the West, see Fig. 4) are excluded from the fit. The and IGL surface brightness profiles extend out to the limiting radius estimated from the isophote fit for each band (see Sec. 3), i.e. out to 6.67 arcmin ( 160 kpc) and down to mag/arcsec2 in band from the centre of HCG 86A, and out to 8.33 arcmin ( 200 kpc) and down to mag/arcsec2 in band from the centre of HCG 86A. We map the color profile of the IGL out to 160 kpc. This is the most extended estimate of the IGL derived in a group of galaxies. Previous observations find that the IGL in HCGs spans a range in radii from 30 to 80 kpc from the center of the group (Da Rocha & Mendes de Oliveira, 2005; Da Rocha et al., 2008). Recent measurements by Poliakov et al. (2021) map the IGL out to kpc.
In the inner regions ( kpc) the IGL profiles have an exponential decrease which resembles the contribution of the stellar envelopes. At larger radii, it is shallower and this might be the ”pure” contribution of the diffuse and not-bound light in the group. These components cannot be separated using photometry alone, and deep spectroscopic observations are needed. Therefore, as has been the custom for previous photometric studies of IGL and ICL using multi-component fits, (Seigar et al., 2007; Gonzalez et al., 2007; Zibetti et al., 2005), we refer to the IGL as the contribution from the stellar envelope (see Sec. 3.4) plus the diffuse light in the outskirts. The IGL surface brightness profile for the HCG 86 group is compared with the average ICL profile derived by Zibetti et al. (2005) for galaxy clusters (at z0.25; see Fig. 7). In the region where the intra-cluster light dominates (at R kpc), both distributions have a comparable surface brightness ( mag/arcsec2) in the band. At smaller radii, the IGL surface brightness profile is mainly dominated by the light distribution of the stellar envelopes around the group members ( 26.5-28.5 mag/arcsec2 in the band). In the bottom panel of Fig. 7 we show the azimuthally- averaged color profile for the IGL in HCG 86. It is constant at mag for kpc. At larger radii, the colors tend to be redder, as also observed in the color profiles derived for each galaxy of the group (see Fig. 6). As discussed in Sec. 4.2, this could be due to contamination from cirrus. An average mag for the IGL in HCG 86A is comparable with the average value derived by Zibetti et al. (2005) for 600 stacked galaxy clusters (scaled at the redshift of HCG 86, see Fig. 7). Moreover, such a value is consistent with the colors derived in other groups and galaxy clusters, where mag in the Abell Cluster 2744 at z=0.3 (Montes & Trujillo, 2014), mag in the Fornax Cluster (Iodice et al., 2017; Raj et al., 2020) and also consistent with mag found in the Abell Cluster 85 (Montes et al., 2021).
Since we consider that the IGL profile could be contaminated by cirrus emission at kpc, we have derived two different estimates of the total integrated flux for the IGL in HCG 86, in the and bands. In a circular area centred on the BGG (HCG 86A), a conservative value is derived within kpc, where the surface brightness and colors are comparable with previous studies, and a second value has been obtained by including the whole IGL profile out to 160 kpc. The extinction-corrected888The IGL magnitudes and color were corrected for Galactic extinction using the extinction coefficients provided by Schlafly & Finkbeiner (2011). magnitude of the IGL within 120 kpc is = mag in the band, with an average color of mag. Within this radius, i) the total luminosity of the IGL is and in and bands respectively, and ii) the fractions of IGL with respect to total luminosity of the group (given in Sec. 3) are and in the and bands, respectively. Since the total luminosity of the BGG HCG 86A is in the band and in the band, the IGL fraction with respect to the BGG is and in the and band, respectively.
At kpc, the extinction-corrected magnitude of the IGL is = mag in the band, with an average color of mag. The total luminosity of the IGL is and in and bands respectively. The fractions of IGL with respect to the total luminosity of the group (given in Sec. 3) are and in the and bands, respectively. The two estimates of the IGL fraction provided above are consistent within the uncertainties and are within the estimated contamination of the cirrus (see Sec. 4.2). The fractions of IGL, at kpc, with respect to the luminosity of the BGG are and in the and bands, respectively. By photometric dissection with double Sérsic decomposition, Kluge et al. (2021) found a ICL/BCG fraction in a range of 31 ¡ ICL/BCG ¡ 73 , which is consistent with our results. The BGG/(BGG+IGL) fraction in HCG 86 is equal to 60, in agreement with the simulations performed by Contini & Gu (2021) for a halo with M⊙.
The average colors derived for the IGL in HCG 86 are also comparable with values published by Da Rocha & Mendes de Oliveira (2005) and Da Rocha et al. (2008), for their detailed analysis of the IGL in compact groups. They found that the B-R colors for the IGL range from mag, which corresponds to mag, adopting the color transformation from Kostov & Bonev (2018).
4.2 Cirrus contamination
As reported in the Sec. 3.1, the field around HCG 86 is affected by the contamination of Galactic cirrus. In order to provide an accurate estimate of the IGL, we need to quantify the amount of contamination from cirrus. From the map we have estimated the minimum and maximum values of the flux along the filament to the West, which is assumed to be pure cirrus emission. These values range from 9.25 to 9.78 MJy/sr. According to the location of HGC 86 in the map, the group resides in a region where the cirrus emission is about , so very close to the minimum (see Fig. 4). Therefore, we expect that the contribution of the cirrus’ light to the IGL is low.
Unfortunately, when dealing with Galactic cirrus, a direct decontamination of optical images is not possible (Mihos, 2019). As suggested by Román et al. (2020), a multi-wavelength approach can help to discriminate between Galactic cirrus emission and real LSB features. To achieve this, we have used the cirrus contour levels from the IR map to define the regions on the optical images where cirrus contributes. In these regions, we have derived the and integrated colors of the cirrus. Since the estimated in the and bands are arcmin and arcmin, respectively (see Sec. 3.3), it is reasonable to assume that the emission from the western filament, which is further from the center of the group ( arcmin), comes from cirrus. In this region, from the optical VST , and images, we have derived the and colors in several circular areas along the filament and they are shown in Fig. 8, by masking the contribution of all foreground stars and background objects. In this color-color plot, we have also included the colors of the inner brightest parts of the group members, derived inside the transition radius (see Sec. 3.3), and the average colors of the IGL estimated at larger radii, i.e. , where this component starts to dominate with respect to the bright central regions of the galaxies. In agreement with Román et al. (2020), we found that the optical colors of the cirrus are distinct from those of extra-galactic sources, i.e. the group members: cirrus is on average bluer ( mag) than the galaxies ( mag, estimated up to their transition radius). Even considering the larger uncertainties in the color estimate, due to the low signal-to-noise in the -band images, the IGL is also distinct from the cirrus in the color-color plane, ( mag and mag).
Since in the color-color plot the IGL colors are different from those typical of cirrus, this confirms that the region where the group and its IGL envelope are located are not largely contaminated by cirrus, therefore, we are confident that the IGL estimate is robust.
Using the empirical relation by Román et al. (2020), where = ((0.56 0.06) log(flux100μm)) + (0.21 0.05), we quantify the amount of contamination from cirrus, to be taken into account in the IGL uncertainties. From the VST -band image, along the cirrus filament we have derived the average flux in the same circular regions used to estimate the colors of the cirrus (showed in Fig. 8). Assuming that in the region where the group resides the colors of the cirrus are on average comparable with those in the filament (reported above), using the relation from Román et al. (2020), we derived the flux in the band corresponding to the 100- flux in the region where the group centre is located (see left panel of Fig. 4). This quantity, which is about , is considered the total amount of the flux from cirrus that can contaminates the IGL flux. Taking into account the flux of the cirrus emission in the region of the group, obtained with the procedure explained so far, the contamination of this source to the total flux of the IGL (see Sec. 4.1) is about 10%, in both the and bands.
.
5 Discussion
In this section we focus on the comparison of the IGL fraction and colors in HCG 86 with i) other observation estimates for the diffuse light in groups and clusters of galaxies, and ii) theoretical predictions, in order to constrain the formation process for this component.
5.1 How does the IGL amount in HCG 86 compare with other observational estimates for diffuse light?
In Fig. 9 we compare the IGL fraction as a function of the virial mass for HCG 86, with the estimates obtained from VST images, based on the same methods and analysis, for loose groups of galaxies (from Spavone et al., 2018; Iodice et al., 2020), for the Fornax cluster (Spavone et al., 2020) and for the FornaxA subgroup (Raj et al., 2020). In addition, in this plot we have also included the available IGL estimates for other compact groups of galaxies (from Da Rocha & Mendes de Oliveira, 2005; Da Rocha et al., 2008; Pildis et al., 1995; Poliakov et al., 2021) and the ICL in Coma and Virgo clusters of galaxies (Mihos et al., 2017b; Jiménez-Teja et al., 2019). Although these estimates are all obtained with the same approach, it must be taken into account that some of them come from different photometric bands. On average, the IGL fraction found in compact groups of galaxies ranges between 15%-46%, therefore the 16-19% value obtained for HCG 86 is fully consistent with the existing estimates. Using different approaches and tracers, other estimates for the IGL amount available in the literature are provided by Aguerri et al. (2006), who find a fraction of IGL equal to 4.7 for HCG 44, using Intra Group planetary nebulae (IGPNe). Fig. 9 also shows that groups and clusters of galaxies with similar virial mass ( M⊙) show different total amounts of diffuse light, ranging from low fractions of 10%-20% (as observed in the triplet NGC 1533, HCG 86, HCG 35 and in the Virgo cluster) to high fractions (in NGC 5018 loose group of galaxies, HCG 90, HCG 79, HCG 94 and the Coma cluster). In the literature data, HCG 79 is the compact group with the highest IGL fraction of 46%. Other literature estimates for the fractions of ICL range from 10% to 40% going from groups to clusters (e.g. Feldmeier et al., 2004; Zibetti et al., 2005; McGee & Balogh, 2010; Toledo et al., 2011).
5.2 Diffuse light versus virial mass
As already noted by Iodice et al. (2020), the large scatter observed in Fig. 9 might indicate that there is no significant relationship between the diffuse light content and the virial mass of the environment, since large ICL fractions ( 30-45%) are observed in groups with M⊙ and in massive clusters of galaxies like Fornax (with M⊙) and Coma (with M⊙). To date, there is no general agreement in the literature regarding the relationship between and ICL fraction (see review by Montes, 2019). On the observational side, Sampaio-Santos et al. (2021) found that the surface brightness of the diffuse light, in a sample of 528 clusters at 0.2 ¡ z ¡ 0.35, shows an increasing dependence on cluster total mass at larger radius. On the other hands, Zibetti et al. (2005) find a constant fraction of ICL as a function of the halo mass, consistent with our results from Fig. 9. On the theoretical side, several works have also found that the relationship between ICL and virial mass is flat and the fraction of diffuse intra-cluster light ranges between 20% and 40% (Sommer-Larsen, 2006; Monaco et al., 2006; Henriques & Thomas, 2010; Rudick et al., 2011; Contini et al., 2014). These results would suggest that the driving factor for the IGL formation would not be related to the virial mass of the group or cluster environment (Cañas et al., 2020).
In contrast, Purcell et al. (2007) found a slight increase in the ICL fraction with the mass of the halo, from 20 to from halos with M⊙ to those of M⊙. Also Lin & Mohr (2004) and Murante et al. (2007) find that the ICL fraction increases weakly with cluster mass in their simulations. Given such a large scatter in the observations, any definitive conclusion cannot be addressed at this point.
5.3 Diffuse light versus ETGs-to-LTGs ratio
Da Rocha et al. (2008) suggested that a high fraction of IGL is expected for groups dominated by early-type galaxies (ETGs), like compact groups. In the left panel of the Fig. 9 we have color-coded the IGL fraction in groups and clusters based on their ETG to late-type galaxy (LTG) ratio. In right panel we show the fraction of the diffuse light with respect to the total luminosity of the cluster or group as a function of the ETGs-to-LTGs ratio. In this figure we have included recent values published by Poliakov et al. (2021) for five HGCs. Compared to HCGs of similar IGL fraction (HCG 35, HCG 95, HCG 15 and HCG 37), the ETG-to-LTG ratio in HCG 86 is quite large (see right panel of Fig. 9). This is four, since it is made up of only elliptical and S0 galaxies. HCG 17 has an IGL fraction () and ETG-to-LTG ratio similar to those deroved for HCG 86. The NGC 5018 group has an ETG-to-LTG ratio similar to the NGC 1533 group, but the amount of IGL in the former structure is double with respect to the latter. The same is observed for IC 1459, Fornax A, HCG 95 and HCG 15, all with comparable ETG-to-LTG ratios but different IGL amount (2% in IC 1459 and 16% in Fornax A). Even though the large scatter, a weak trend between the amount of intra-cluster light and the ETG-to-LTG ratio seems to be present. More estimates for the IGL are needed to draw any definitive conclusion about this correlation.
5.4 What could be the origin of IGL in HCG 86?
As suggested by simulations (e.g. Contini et al., 2014, 2019), the gravitational interactions between galaxies play an important role in the formation mechanism of the diffuse light in groups and clusters of galaxies. As stated in Sec. 1, these are predicted to be more efficient in groups of galaxies where the velocity dispersion of group members is low ( 350 km s-1). In these simulations, from 5 to 25% of the diffuse light builds from the infalling galaxies in the potential well of the BCG/BGG during the mass assembly history. Most simulations predict that the bulk of the ICL is produced by the most massive satellite galaxies, M∗ 1010-11 M⊙ at lower redshifts, whereas the contribution to the build-up of the diffuse light from the stripping of lower-mass galaxies (M∗ 109 M⊙) is more efficient at higher () redshifts (Purcell et al., 2007; Contini et al., 2014; Martel et al., 2012; Contini et al., 2019).
The color of each point is coded according to its ETGs-to-LTGs ratio. The black line corresponds to the best fit for the linear correlation and it seems to suggest that any evident trend exists between the amount of ICL and Mvir. Right panel: Luminosity of the ICL component normalised to the total cluster or group luminosity as a function of the ETGs-to-LTGs ratio. The IGL for all HCGs available in literature are marked as blue points. Other estimates for groups and clusters of galaxies are indicated with the black points. The value found in this work for HCG 86 is marked with magenta star-like point. The coral solid line corresponds to the best fit for the linear correlation and the dashed coral lines mark the 2 significance range of the correlation. The values for HCG 74, HCG 8, HCG 37, and HCG 17 (the latter overlaps to HCG 86) are from Poliakov et al. (2021).
By comparing the IGL fraction and colors with simulations from Contini et al. (2014, 2019), we address a possible origin for the IGL in HCG 86. It is worth noting that HCG 86 has , which is close to the lower limit of their simulations. Since Contini et al. (2014, 2019) predict the fractions of mass in the ICL, we have derived the mass-to-light ratios (M/L) corresponding to the and integrated colors derived for the IGL component and for the BGG (see Tab. 6). In order to reproduce the ratio we gave for the light component, the integrated and colors for the BGG are obtained by considering the bright regions plus the faint outskirts. Taking into account the error estimates on the colors, using the stellar population synthesis models based on the EMILES library (Vazdekis et al., 2010), we have derived the M/L in the following ranges: mag, mag, mag and mag. Therefore, we have obtained that and , with average values of and . Since the integrated colors of the other group members are comparable with that for the BGG (see Tab. 6 and Fig. 8), it is reasonable to assume the same M/L ratio for all of them. As such, the , which is consistent with the estimates we based on the luminosity ratio of (16% 3%).
According to Contini et al. (2014), a fraction of IGL of about 20%, comparable to that estimated in HCG 86, is consistent with a formation redshift within , which corresponds to a look back time of Gyr for formation of the group halo. These models predict that, at this epoch and with this IGL fraction, disruption of satellite galaxies is the main channel to form the diffuse light. Tidal forces would give a higher fraction of IGL. This scenario is consistent with the absence of any prominent bright tidal features or disturbed morphology in the core of HCG 86 and observing the IGL mainly in a diffuse form (see Fig. 2). The faint and diffuse bridge connecting HCG 86C to the rest of the group is the only evident tidal feature in the group, which would reconcile with the late assembly scenario proposed by Díaz-Giménez et al. (2021), where HCG 86C might be the last member joining the group.
However, accretion events might have also contributed to the IGL in HCG 86, but remnants (as tidal tails) of this process could have already dissolved, since their lifetime is about 1 Gyr (Rudick et al., 2009; Mancillas et al., 2019). As a comparison, the HCG 90 and NGC 5018 groups, which are highly interacting systems showing disturbed morphologies in the galaxies’ outskirts and the presence of tidal stellar tails, have larger fractions of IGL ().
From EMILES library, the IGL colors mag and mag are consistent with an age ranging from 7.8 to 11 Gyr (assuming a value for the metallicity (log(Z/Zsun)) in a range of , as predicted by Contini et al. (2019) for the IGL at z=0). This interval would be even smaller towards lower ages considering that the IGL color is an upper limit (see Fig. 8 and Sec. 3). Such an estimate is consistent with those based on the theoretical predictions discussed above.
Recent works have proved that ICL colors are a useful parameter to constrain the main formation process that contributed to the build up of this component (Contini et al., 2019; Morishita et al., 2017; Montes & Trujillo, 2018; Montes et al., 2021). The range of values for the IGL colors of mag in HCG 86 is also consistent with the range of colors predicted for the ICL by Contini et al. (2019), where mag at z=0. According to Contini et al. (2019), in this redshift range, the colors of the intra-cluster diffuse light are comparable with those of intermediate/massive galaxies ( M⊙), which therefore are the main contribution to the mass of the ICL and IGL. Since HCG 86 is dominated by ETGs, this would suggest that this group is quite evolved in the mass assembly framework. Therefore, the existence of massive satellites that are merging into the gravitational potential of the group members would be consistent with the evolutionary phase of the whole system.
6 Conclusions
In this paper we presented deep images for the compact group of galaxies HCG 86 as part of the VEGAS survey. The long integration time and wide area make our data deeper than previous literature studies of the IGL in compact groups of galaxies and allow us to detect IGL out to ( kpc) and down to a surface brightness level of mag/arcsec2 in the band.
The main results are:
-
•
The IGL in HCG 86 is mainly in diffuse form, since we do not detect any bright or extended tidal tails or stellar streams in the intra-group space. The average IGL colors are in the range mag and mag. The color must be considered as an upper limit since the -band image is shallower ( mag/arcsec2) than the other bands, therefore we are not able to map the entire region of the IGL as in the and bands.
-
•
The fraction of IGL in HCG 86 is about % of the total luminosity of the group in the band, and this is consistent with the same estimates available for other compact groups and loose groups of galaxies of similar virial masses (see left panel in Fig. 9).
-
•
By comparing the amount of ICL with the cluster/group (see left panel in Fig. 9) no strong correlation seems to be present. On the other hand, according with previous studies, the ICL fraction seems to be weakly related to ETGs-to-LTGs ratio, where larger amount of intra-cluster light is found in more evolved structures, dominated by ETGs (see right panel in Fig. 9).
-
•
We have estimated that the IGL fractions suffers from 10 of cirrus contamination. As shown in Fig. 8 the IGL is well separated from the cirrus area of the color-color diagram, suggesting that the estimate of the IGL colors is robust.
-
•
According to the theoretical models of Contini et al. (2014), the amount of IGL in HCG 86 would be the result of the accretion from intermediate/massive satellites at an epoch of ( Gyr). Such an age estimate is consistent with that derived to account for the average IGL mag and mag colors, using stellar population synthesis models.
-
•
The IGL color is consistent with the range of colors predicted for the ICL by Contini et al. (2019), where mag at z=0. In this redshift range, the colors are consistent with the scenario where the main contribution to the mass of the ICL comes from the intermediate/massive galaxies ( M⊙).
This work is a pilot project within the VEGAS survey aimed at studying the low-density and less massive environments of galaxy groups, which are still relatively unexplored in the low-surface brightness regime. In particular, with the upcoming VEGAS data, we plan to fill the gap at low virial masses in the IGL-Mvir plane (see Fig. 9) where, to date, we still lack both deep observations and theoretical predictions. New observations and analysis will provide a comprehensive database of observables that can be directly compared with simulations on hierarchical mass assembly.
Acknowledgements.
We thank the anonymous referee for their helpful comments on the paper. RR, MS and EI acknowledge financial support from the VST project (P.I. P. Schipani). EI acknowledges financial support from the European Union Horizon 2020 research and innovation programme under the Marie Skodowska-Curie grant agreement n. 721463 to the SUNDIAL ITN network. GD acknowledges support from CONICYT project Basal AFB-170002.References
- Adami et al. (2005) Adami, C., Biviano, A., Durret, F., & Mazure, A. 2005, A&A, 443, 17
- Aguerri et al. (2006) Aguerri, J. A. L., Castro-Rodríguez, N., Napolitano, N., Arnaboldi, M., & Gerhard, O. 2006, A&A, 457, 771
- Arnaboldi et al. (2012) Arnaboldi, M., Ventimiglia, G., Iodice, E., Gerhard, O., & Coccato, L. 2012, A&A, 545, A37
- Bernstein et al. (1995) Bernstein, G. M., Nichol, R. C., Tyson, J. A., Ulmer, M. P., & Wittman, D. 1995, AJ, 110, 1507
- Bower & Balogh (2004) Bower, R. G. & Balogh, M. L. 2004, in Clusters of Galaxies: Probes of Cosmological Structure and Galaxy Evolution, ed. J. S. Mulchaey, A. Dressler, & A. Oemler, 325
- Brough et al. (2017) Brough, S., van de Sande, J., Owers, M. S., et al. 2017, ApJ, 844, 59
- Cañas et al. (2020) Cañas, R., Lagos, C. d. P., Elahi, P. J., et al. 2020, MNRAS, 494, 4314
- Capaccioli et al. (2015) Capaccioli, M., Spavone, M., Grado, A., et al. 2015, A&A, 581, A10
- Cattapan et al. (2019) Cattapan, A., Spavone, M., Iodice, E., et al. 2019, ApJ, 874, 130
- Coccato et al. (2008) Coccato, L., Swaters, R. A., Rubin, V. C., D’Odorico, S., & McGaugh, S. S. 2008, A&A, 490, 589
- Contini et al. (2014) Contini, E., De Lucia, G., Villalobos, Á., & Borgani, S. 2014, MNRAS, 437, 3787
- Contini & Gu (2021) Contini, E. & Gu, Q. 2021, arXiv e-prints, arXiv:2104.05913
- Contini et al. (2019) Contini, E., Yi, S. K., & Kang, X. 2019, ApJ, 871, 24
- Cortese et al. (2010) Cortese, L., Bendo, G. J., Isaak, K. G., Davies, J. I., & Kent, B. R. 2010, MNRAS, 403, L26
- Coziol et al. (2004) Coziol, R., Brinks, E., & Bravo-Alfaro, H. 2004, AJ, 128, 68
- Cui et al. (2014) Cui, W., Murante, G., Monaco, P., et al. 2014, MNRAS, 437, 816
- Da Rocha & Mendes de Oliveira (2005) Da Rocha, C. & Mendes de Oliveira, C. 2005, MNRAS, 364, 1069
- Da Rocha et al. (2008) Da Rocha, C., Ziegler, B. L., & Mendes de Oliveira, C. 2008, MNRAS, 388, 1433
- de Carvalho et al. (1997) de Carvalho, R. R., Ribeiro, A. L. B., Capelato, H. V., & Zepf, S. E. 1997, ApJS, 110, 1
- De Lucia et al. (2006) De Lucia, G., Springel, V., White, S. D. M., Croton, D., & Kauffmann, G. 2006, MNRAS, 366, 499
- DeMaio et al. (2020) DeMaio, T., Gonzalez, A. H., Zabludoff, A., et al. 2020, MNRAS, 491, 3751
- DeMaio et al. (2018) DeMaio, T., Gonzalez, A. H., Zabludoff, A., et al. 2018, MNRAS, 474, 3009
- Díaz-Giménez et al. (2012) Díaz-Giménez, E., Mamon, G. A., Pacheco, M., Mendes de Oliveira, C., & Alonso, M. V. 2012, MNRAS, 426, 296
- Díaz-Giménez et al. (2021) Díaz-Giménez, E., Zandivarez, A., & Mamon, G. A. 2021, MNRAS, 503, 394
- Donzelli et al. (2011) Donzelli, C. J., Muriel, H., & Madrid, J. P. 2011, ApJS, 195, 15
- Duc et al. (2015) Duc, P.-A., Cuillandre, J.-C., Karabal, E., et al. 2015, MNRAS, 446, 120
- Feldmeier et al. (2004) Feldmeier, J., Mihos, C., Morrison, H., & Harding, P. 2004, in American Astronomical Society Meeting Abstracts, Vol. 205, American Astronomical Society Meeting Abstracts, 146.01
- Ferrarese et al. (2012) Ferrarese, L., Côté, P., Cuillandre, J.-C., et al. 2012, ApJS, 200, 4
- Fliri & Trujillo (2016) Fliri, J. & Trujillo, I. 2016, MNRAS, 456, 1359
- Gonzalez et al. (2007) Gonzalez, A. H., Zaritsky, D., & Zabludoff, A. I. 2007, ApJ, 666, 147
- Greene et al. (2015) Greene, J. E., Janish, R., Ma, C.-P., et al. 2015, ApJ, 807, 11
- Henden et al. (2020) Henden, N. A., Puchwein, E., & Sijacki, D. 2020, MNRAS, 498, 2114
- Henriques & Thomas (2010) Henriques, B. M. B. & Thomas, P. A. 2010, MNRAS, 403, 768
- Hickson (1982) Hickson, P. 1982, ApJ, 255, 382
- Hickson et al. (1992) Hickson, P., Mendes de Oliveira, C., Huchra, J. P., & Palumbo, G. G. 1992, ApJ, 399, 353
- Huang et al. (2018a) Huang, S., Leauthaud, A., Greene, J., et al. 2018a, MNRAS, 480, 521
- Huang et al. (2018b) Huang, S., Leauthaud, A., Greene, J. E., et al. 2018b, MNRAS, 475, 3348
- Iodice et al. (2016) Iodice, E., Capaccioli, M., Grado, A., et al. 2016, ApJ, 820, 42
- Iodice et al. (2017) Iodice, E., Spavone, M., Cantiello, M., et al. 2017, ApJ, 851, 75
- Iodice et al. (2019) Iodice, E., Spavone, M., Capaccioli, M., et al. 2019, A&A, 623, A1
- Iodice et al. (2020) Iodice, E., Spavone, M., Cattapan, A., et al. 2020, A&A, 635, A3
- Jiménez-Teja et al. (2018) Jiménez-Teja, Y., Dupke, R., Benítez, N., et al. 2018, ApJ, 857, 79
- Jiménez-Teja et al. (2019) Jiménez-Teja, Y., Dupke, R. A., Lopes de Oliveira, R., et al. 2019, A&A, 622, A183
- Jorgensen et al. (1995) Jorgensen, I., Franx, M., & Kjaergaard, P. 1995, MNRAS, 276, 1341
- Kluge et al. (2021) Kluge, M., Bender, R., Riffeser, A., et al. 2021, ApJS, 252, 27
- Kostov & Bonev (2018) Kostov, A. & Bonev, T. 2018, Bulgarian Astronomical Journal, 28, 3
- Lin & Mohr (2004) Lin, Y.-T. & Mohr, J. J. 2004, ApJ, 617, 879
- Mancillas et al. (2019) Mancillas, B., Duc, P.-A., Combes, F., et al. 2019, A&A, 632, A122
- Martel et al. (2012) Martel, H., Barai, P., & Brito, W. 2012, ApJ, 757, 48
- Martinez-Delgado et al. (2021) Martinez-Delgado, D., Cooper, A. P., Roman, J., et al. 2021, arXiv e-prints, arXiv:2104.06071
- McFarland et al. (2013) McFarland, J. P., Verdoes-Kleijn, G., Sikkema, G., et al. 2013, Experimental Astronomy, 35, 45
- McGee & Balogh (2010) McGee, S. L. & Balogh, M. L. 2010, MNRAS, 405, 2069
- Melnick et al. (1977) Melnick, J., White, S. D. M., & Hoessel, J. 1977, MNRAS, 180, 207
- Merritt et al. (2016) Merritt, A., van Dokkum, P., Abraham, R., & Zhang, J. 2016, ApJ, 830, 62
- Mihos (2015) Mihos, C. 2015, IAU General Assembly, 22, 2247903
- Mihos (2019) Mihos, J. C. 2019, arXiv e-prints, arXiv:1909.09456
- Mihos et al. (2017a) Mihos, J. C., Harding, P., Feldmeier, J. J., et al. 2017a, ApJ, 834, 16
- Mihos et al. (2017b) Mihos, J. C., Harding, P., Feldmeier, J. J., et al. 2017b, ApJ, 834, 16
- Miles et al. (2004) Miles, T. A., Raychaudhury, S., Forbes, D. A., et al. 2004, MNRAS, 355, 785
- Monaco et al. (2006) Monaco, P., Murante, G., Borgani, S., & Fontanot, F. 2006, ApJ, 652, L89
- Montes (2019) Montes, M. 2019, arXiv e-prints, arXiv:1912.01616
- Montes et al. (2021) Montes, M., Brough, S., Owers, M. S., & Santucci, G. 2021, arXiv e-prints, arXiv:2101.08290
- Montes & Trujillo (2014) Montes, M. & Trujillo, I. 2014, ApJ, 794, 137
- Montes & Trujillo (2018) Montes, M. & Trujillo, I. 2018, MNRAS, 474, 917
- Montes & Trujillo (2019) Montes, M. & Trujillo, I. 2019, MNRAS, 482, 2838
- Morishita et al. (2017) Morishita, T., Abramson, L. E., Treu, T., et al. 2017, ApJ, 846, 139
- Muñoz et al. (2015) Muñoz, R. P., Eigenthaler, P., Puzia, T. H., et al. 2015, ApJ, 813, L15
- Murante et al. (2007) Murante, G., Giovalli, M., Gerhard, O., et al. 2007, MNRAS, 377, 2
- Pildis et al. (1995) Pildis, R. A., Bregman, J. N., & Schombert, J. M. 1995, AJ, 110, 1498
- Pillepich et al. (2018) Pillepich, A., Nelson, D., Hernquist, L., et al. 2018, MNRAS, 475, 648
- Pohlen & Trujillo (2006) Pohlen, M. & Trujillo, I. 2006, A&A, 454, 759
- Poliakov et al. (2021) Poliakov, D., Mosenkov, A. V., Brosch, N., Koriski, S., & Rich, R. M. 2021, MNRAS, 503, 6059
- Proctor et al. (2004) Proctor, R. N., Forbes, D. A., Hau, G. K. T., et al. 2004, MNRAS, 349, 1381
- Purcell et al. (2007) Purcell, C. W., Bullock, J. S., & Zentner, A. R. 2007, ApJ, 666, 20
- Raj et al. (2020) Raj, M. A., Iodice, E., Napolitano, N. R., et al. 2020, A&A, 640, A137
- Ribeiro et al. (1998) Ribeiro, A. L. B., de Carvalho, R. R., Capelato, H. V., & Zepf, S. E. 1998, ApJ, 497, 72
- Riess et al. (2018) Riess, A. G., Casertano, S., Yuan, W., et al. 2018, ApJ, 855, 136
- Robotham et al. (2011) Robotham, A. S. G., Norberg, P., Driver, S. P., et al. 2011, MNRAS, 416, 2640
- Román et al. (2020) Román, J., Trujillo, I., & Montes, M. 2020, A&A, 644, A42
- Rudick et al. (2009) Rudick, C. S., Mihos, J. C., Frey, L. H., & McBride, C. K. 2009, ApJ, 699, 1518
- Rudick et al. (2010) Rudick, C. S., Mihos, J. C., Harding, P., et al. 2010, ApJ, 720, 569
- Rudick et al. (2011) Rudick, C. S., Mihos, J. C., & McBride, C. K. 2011, ApJ, 732, 48
- Sampaio-Santos et al. (2021) Sampaio-Santos, H., Zhang, Y., Ogando, R. L. C., et al. 2021, MNRAS, 501, 1300
- Schipani et al. (2012) Schipani, P., Noethe, L., Arcidiacono, C., et al. 2012, Journal of the Optical Society of America A, 29, 1359
- Schlafly & Finkbeiner (2011) Schlafly, E. F. & Finkbeiner, D. P. 2011, ApJ, 737, 103
- Seigar et al. (2007) Seigar, M. S., Graham, A. W., & Jerjen, H. 2007, MNRAS, 378, 1575
- Selim & Iqbal (2008) Selim, I. & Iqbal, N. 2008, Turkish Journal of Physics, 32, 133
- Slater et al. (2009) Slater, C. T., Harding, P., & Mihos, J. C. 2009, PASP, 121, 1267
- Sommer-Larsen (2006) Sommer-Larsen, J. 2006, MNRAS, 369, 958
- Spavone et al. (2017) Spavone, M., Capaccioli, M., Napolitano, N. R., et al. 2017, A&A, 603, A38
- Spavone et al. (2018) Spavone, M., Iodice, E., Capaccioli, M., et al. 2018, ApJ, 864, 149
- Spavone et al. (2020) Spavone, M., Iodice, E., van de Ven, G., et al. 2020, A&A, 639, A14
- Thuan & Kormendy (1977) Thuan, T. X. & Kormendy, J. 1977, PASP, 89, 466
- Toledo et al. (2011) Toledo, I., Melnick, J., Selman, F., et al. 2011, MNRAS, 414, 602
- Trujillo & Fliri (2016) Trujillo, I. & Fliri, J. 2016, ApJ, 823, 123
- van Dokkum et al. (2014) van Dokkum, P. G., Abraham, R., & Merritt, A. 2014, ApJ, 782, L24
- Vazdekis et al. (2010) Vazdekis, A., Sánchez-Blázquez, P., Falcón-Barroso, J., et al. 2010, MNRAS, 404, 1639
- Venhola et al. (2018) Venhola, A., Peletier, R., Laurikainen, E., et al. 2018, A&A, 620, A165
- Venhola et al. (2017) Venhola, A., Peletier, R., Laurikainen, E., et al. 2017, A&A, 608, A142
- Verdes-Montenegro et al. (2001) Verdes-Montenegro, L., Yun, M. S., Williams, B. A., et al. 2001, A&A, 377, 812
- Watkins et al. (2016) Watkins, A. E., Mihos, J. C., & Harding, P. 2016, ApJ, 826, 59
- Watkins et al. (2014) Watkins, A. E., Mihos, J. C., Harding, P., & Feldmeier, J. J. 2014, ApJ, 791, 38
- Zhang et al. (2019) Zhang, Y., Yanny, B., Palmese, A., et al. 2019, ApJ, 874, 165
- Zibetti et al. (2005) Zibetti, S., White, S. D. M., Schneider, D. P., & Brinkmann, J. 2005, MNRAS, 358, 949
Appendix A Results of multi-component fits
In this section we show the 1D multi-component fit performed on the azimuthally averaged surface brightness profiles in the band, for all the four group members. See in Fig. 10.