Plot and Rework: Modeling Storylines for Visual Storytelling
Abstract
Writing a coherent and engaging story is not easy. Creative writers use their knowledge and worldview to put disjointed elements together to form a coherent storyline, and work and rework iteratively toward perfection. Automated visual storytelling (VIST) models, however, make poor use of external knowledge and iterative generation when attempting to create stories. This paper introduces PR-VIST, a framework that represents the input image sequence as a story graph in which it finds the best path to form a storyline. PR-VIST then takes this path and learns to generate the final story via a re-evaluating training process. This framework produces stories that are superior in terms of diversity, coherence, and humanness, per both automatic and human evaluations. An ablation study shows that both plotting and reworking contribute to the model’s superiority.
1 Introduction
Writing a story is a complicated task. Human writers use their knowledge to tie all the disjointed elements, such as people, items, actions, or locations, together to form a coherent storyline. Writers also re-evaluate their work constantly during the writing process, and sometimes even alter their writing goals in the middle of a draft. Flower and Hayes (1981) characterize a solo writer’s cognitive process as a series of components in which the writer’s own knowledge is described as the long-term memory, and the planning, translating, and reviewing steps can occur in a recursive, interconnected manner. These creative steps are essential to human writing. However, automated visual storytelling (VIST) models that compose stories given five images Huang et al. (2016) do not make extensive use of human knowledge to tie the elements together, nor do they use human insight to evaluate the outputs and guide the generation process.
As for linking elements, most works generate visual stories in an end-to-end fashion Huang et al. (2016); Kim et al. (2018), treating the task as a straightforward extension of image captioning. Recent works have begun to use relations between entities to improve visual storytelling, but often narrow in a particular subset of relations, such as relations between elements within the same image Yang et al. (2019), relations between two adjacent images Hsu et al. (2020), or relations between scenes Wang et al. (2020). The full potential of rich real-world knowledge and intra-image relations have yet to be fully utilized. As for re-evaluation, recent work uses reward systems Wang et al. (2018b); Hu et al. (2019) or estimated topic coherence Wang et al. (2019) to automatically assess the output story and guide the generation process. However, these approaches are often optimized towards predefined aspects such as image relevancy or topic coherence, which do not necessarily lead to engaging stories from a human perspective. In the cognitive process of human writing, the writer’s judgment is critical, and visual storytelling models could benefit by considering human ratings.
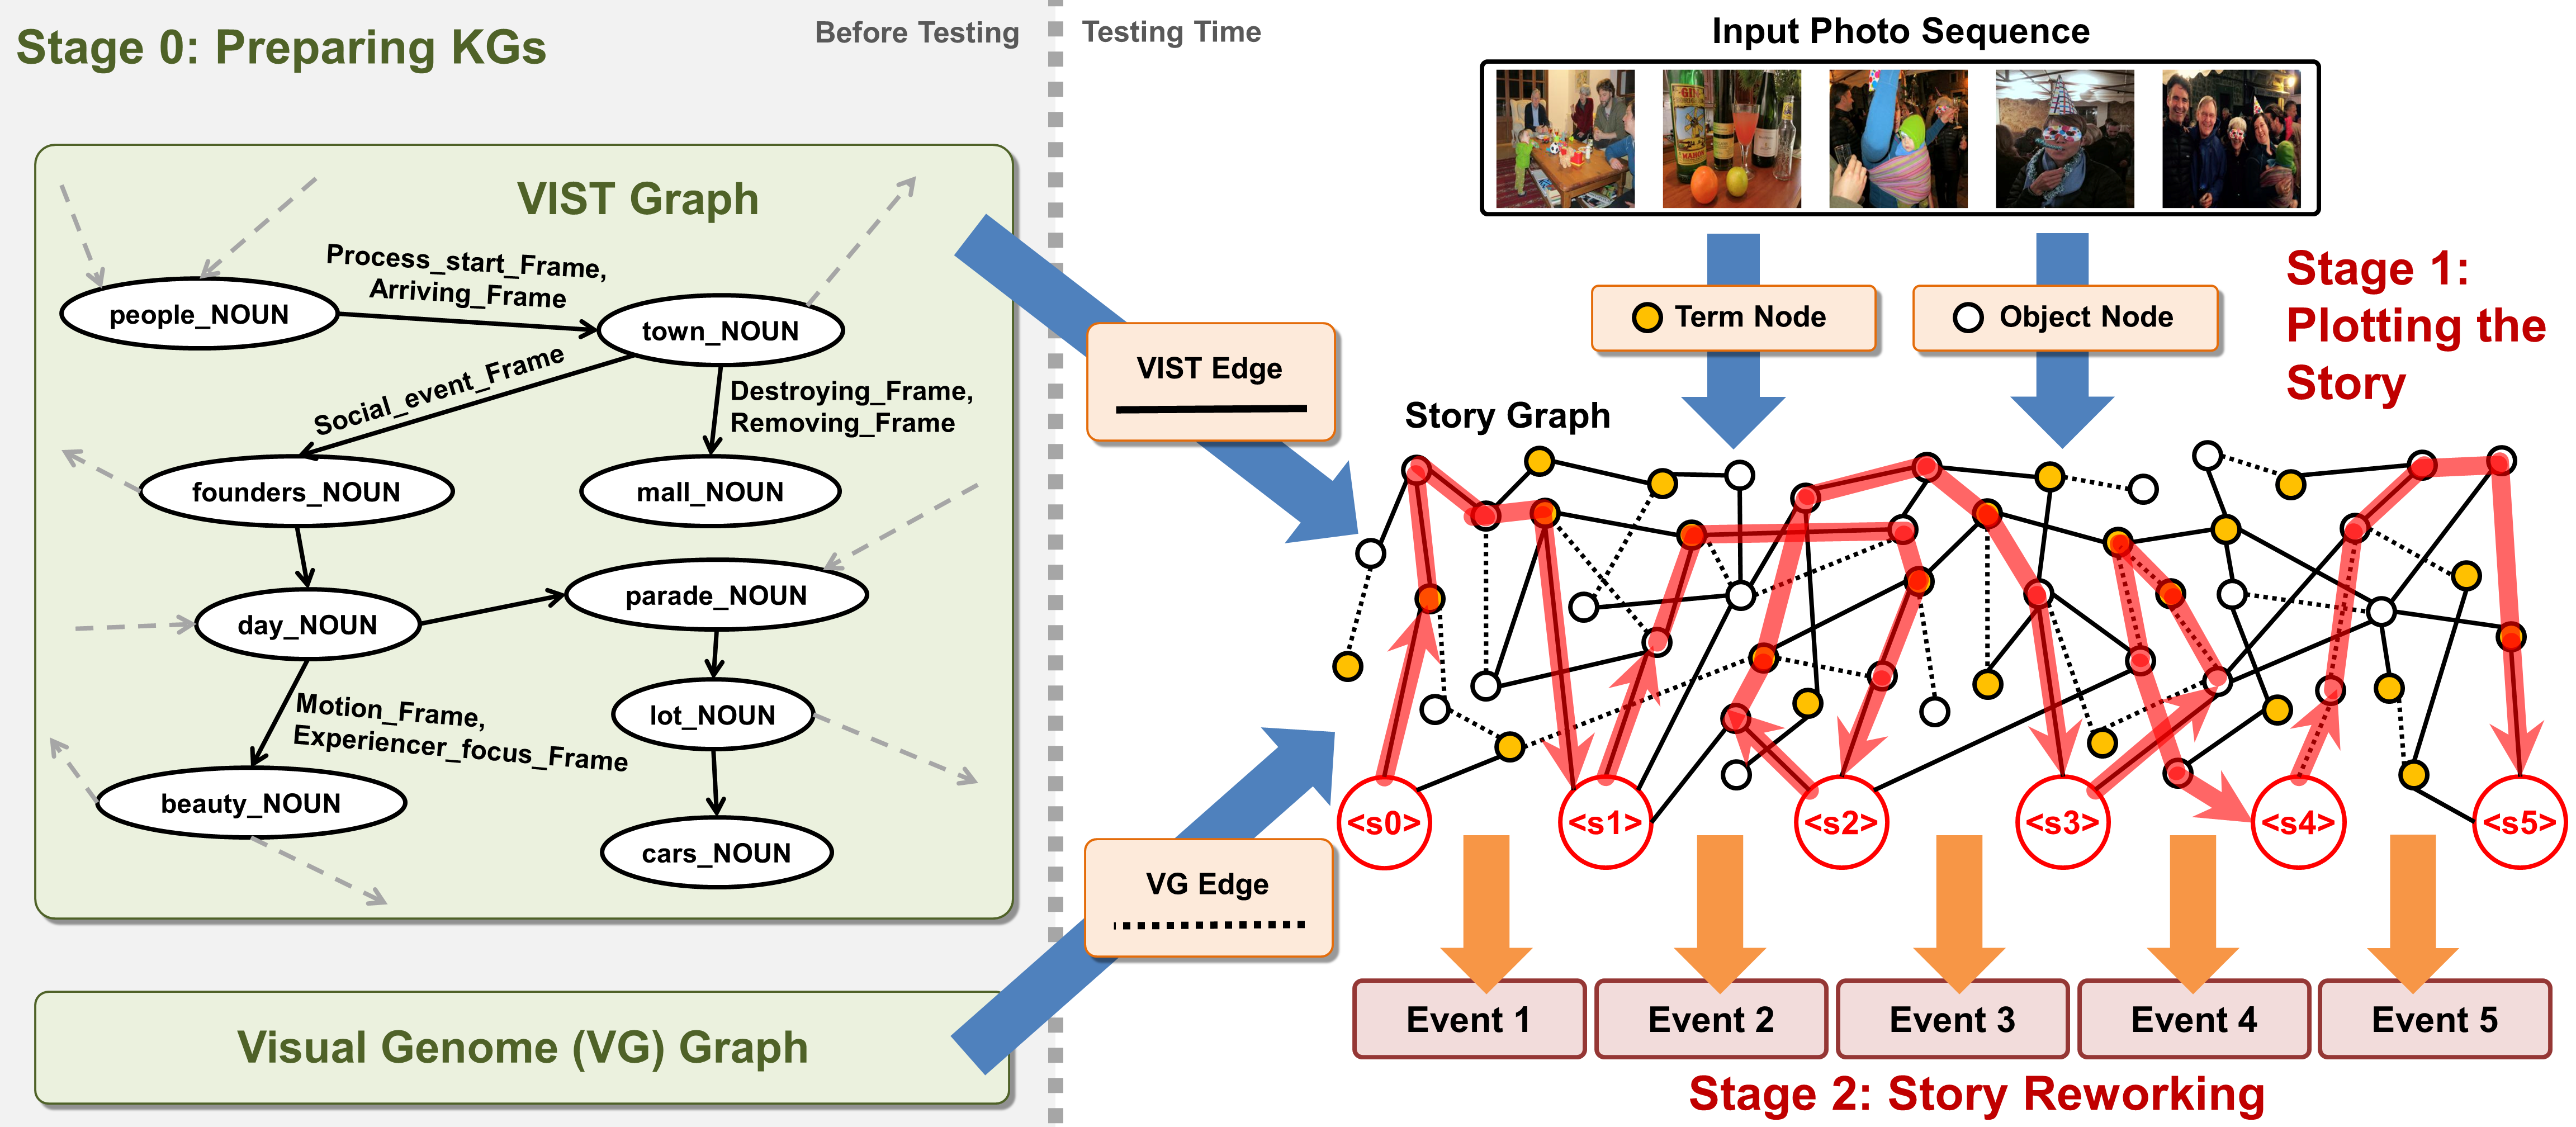
This paper introduces PR-VIST, a novel visual storytelling framework that constructs a graph and captures the relations between all the elements in the input image sequence, finds the optimal path in the graph that forms the best storyline, and uses this path to generate the story. An overview of PR-VIST is shown in Figure 1.
-
•
Stage 1 (Story Plotting): PR-VIST first constructs a story graph for the image sequence by extracting various elements (i.e., term nodes, object nodes) from all the images and linking these elements using external knowledge (i.e., VIST graph, VG graph). PR-VIST then finds the best path in the story graph as the storyline and passes it to Stage 2.
-
•
Stage 2 (Story Reworking): PR-VIST uses a story generator and a story evaluator to realize the reworking process: the generator takes the storyline produced in Stage 1 as the input to generate the story and backpropagates with an evaluator-augmented loss function. The evaluator, a discriminator model trained on human rating score data to classify good and bad stories, outputs a story quality score and modifies the loss. After a few optimization epochs, the generator eventually learns to generate stories that reflect human preferences.
In Stage 0 (Preparation), a set of knowledge graphs that encode relations between elements are prepared for use in Stage 1. In this work, we prepare two knowledge graphs: a VIST graph and a visual genome (VG) graph. We construct the VIST graph based on the VIST dataset, representing in-domain knowledge; the VG graph is an existing resource Krishna et al. (2017), representing generic knowledge. Note that as the PR-VIST framework is generic, it can use any knowledge graphs as needed.
Automatic and human evaluations show that PR-VIST produces visual stories that are more diverse, coherent, and human-like. We also conduct an ablation study to show that both story plotting (Stage 1) and reworking (Stage 2) contribute positively to the model’s superiority. We believe this work also shows the potential of drawing inspiration from human cognitive processes and behavior to improve text generation technology.
2 Related Work
Visual Storytelling
Researchers have been trying to advance the visual storytelling task since it was introduced by Huang et al. (2016). Some work modifies end-to-end recurrent models for better story generation Hsu et al. (2018); Gonzalez-Rico and Fuentes-Pineda (2018); Kim et al. (2018); Huang et al. (2019); Jung et al. (2020), and some use adversarial training to generate more diverse stories (Chen et al., 2017; Wang et al., 2018a, b; Hu et al., 2019). These methods produce legitimate stories and easier to implement because they relies only on one dataset. However, the generated stories can sometimes be monotonous and repetitive.
Leveraging External Resources for VIST
Another set of work leverages external resources and knowledge to enrich the generated visual stories. For example, Yang et al. (2019) apply ConceptNet (Liu and Singh, 2004) and self-attention for create commonsense-augmented image features; Wang et al. (2020) use graph convolution networks on scene graphs Johnson et al. (2018) to associate objects across images; and KG-Story Hsu et al. (2020) is a three-stage VIST framework that uses Visual Genome Krishna et al. (2017) to produce knowledge-enriched visual stories.
Editing or Optimizing Visual Stories
A few prior work tries to post-edit visual stories or optimize the story content toward specific goals. VIST-Edit is an automatic post-editing model that learns from an pre- and post-edited parallel corpus to edit machine-generated visual stories Hsu et al. (2019). While VIST-Edit is useful, it requires parallel training data, which is often unavailable. Hu et al. (2019) use a reward function to optimize the generated stories toward three aspects; Li et al. (2019) customize the emotions of visual stories. These methods use automatic metrics to optimize visual stories toward specific goals; our work, on the other hand, leverages the human evaluation data to guide the generation process.
Story Plotting in Story Generation
Research in automatic story generation has demonstrated the effectiveness of story plotting Yao et al. (2018); Fan et al. (2019), which typically involves organizing the “ingredients” into a well-organized sequence of events. Nevertheless, none of the studies applied story plotting for visual stories.
3 Stage 0: Preparation
To prepare for story plotting, we collect information from the images and knowledge from the knowledge graphs.
3.1 Story Element Extraction
To extract information from the images, two extraction methods are used to extract image-oriented and story-oriented story elements: objects and terms, respectively representing image and story intuition.
Objects
These can be detected by current object detection models, for which we use a pre-trained object detection model—Faster-RCNN Ren et al. (2015). To ensure the detected objects’ reliability, only those objects with the top five confidence scores are used in each image.
Terms
These are story-like nouns such as events, time, and locations, which current object detection models are unable to extract. Therefore, we further use a Transformer-GRU Hsu et al. (2020) to predict story-like terms. For each image and story pair, we use image objects as the input and the nouns in the corresponding human-written story as the ground truth. The Transformer-GRU learns to convert objects to nouns commonly used in stories.
3.2 Knowledge Graph Preparation
To collect interactive relations between nouns, we prepare Visual Genome graph and VIST graph . These graphs contain interlinked real-world objects and terms, displaying visual and storytelling interaction. Table 1 summarizes the statistic of each graph.
Visual Genome Graph
describes pairwise relationships between objects in an image, describing visual interactions. No prepositional relations are included; only verb relations are preserved. All relations are converted into semantic verb frames using Open-SESAME Swayamdipta et al. (2017), in which the semantic frames were pre-defined in FrameNet Baker et al. (1998).
VIST Graph
we propose to collect the storytelling interactions. We develop this novel story knowledge graph by converting references in the VIST training and validation datasets Huang et al. (2016) to graphical data.
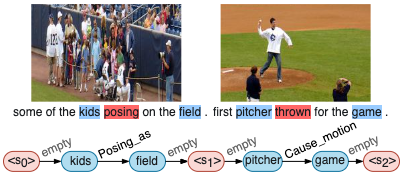
Following the reading direction, in each reference, we extract nouns and semantic verb frames using SpaCy111SpaCy: https://spacy.io/ and Open-SESAME to obtain noun–verb–noun (NVN) tuples. Using nouns and semantic verb frames as nodes and edges, these are collectively assembled into a golden storyline. For example, for “first pitcher thrown for the game” in Figure 2, we extract pitcher, game, and Cause_motion, which is a semantic verb frame for thrown, as a NVN tuple. Additionally, we include a noun token si as the transition point to the next sentence or termination point of a story, and a verb frame token empty_frame to interlink two nouns when a semantic frame is absent. To conclude, all of the golden storylines are assembled into .
| Nodes | Relations | Links | |
|---|---|---|---|
| 3,323 | 564 | 22.31 | |
| 2,048 | 531 | 11.75 | |
| 4,158 | 880 | 22.78 |
4 Stage 1: Story Plotting
4.1 Storyline Predictor
In Stage 1, PR-VIST uses a storyline predictor to find what it deems the best path in the story graph as the storyline and then pass this to Stage 2. For the storyline predictor, we use UHop Chen et al. (2019), a non-exhaustive relation extraction framework. A single hop is defined as searching from one entity to another entity by a single relation. UHop performs multiple single-hop classifications consecutively in the graph to find the path representing the storyline, that is, a path that consists of a sequence of nouns and verb frames.
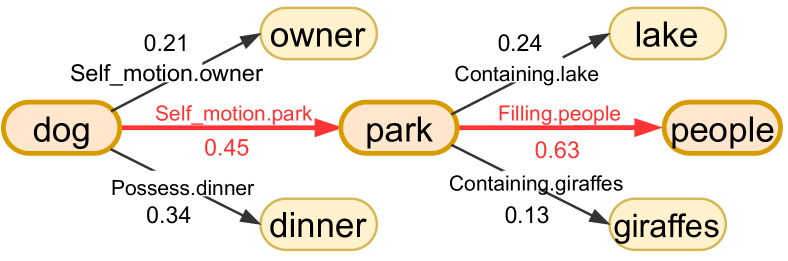
Single-hop classification can described as Equation 1 and Figure 3. In step , at the current head entity , the model is given a list of candidate relations and tail entities . Each is in [verb.] or [verb.noun] format, containing information for both the verb frame and the tail noun entity. The scoring model is given objects and predicted relations as input. The model predicts a score for each and selects the highest verb-noun pair from :
| (1) |
Training
UHop learns to find a path for the storyline from the golden storyline. The training procedure starts with an initial noun token entity s0 in the golden storyline for single-hop classification, where s0. It learns to select the correct relation from a list of candidate relations in and . Then, it calculates the error to the noun and verb frame in the golden storyline for backpropagation. In the next hop, the framework proceeds to the next noun in the golden storyline and repeats the single-hop classification.
Testing
In PR-VIST’s testing step, for each story, five images are transformed into a story graph . As demonstrated in Figure 1, we first extract the object and term story elements for each story, and then link these together using the verb frames in and as edges. This yields a well-defined graph presenting a comprehensive view of five images for each story—. Next, a trained UHop finds a storyline in , where all entities are only the objects and terms from the given five images. The framework starts with s0 to perform single-hop classification, where s0. Unlike training, it only selects from listed in . In the next hop, the previous predicted entities are used as the start entity: . It then continues to hop from entity to entity until it reaches the next token s1. The path from si-1 to si is called an event . The path search from si to the next token si+1 continues until the search is terminated by the termination decision described in UHop. Eventually, the model finds a storyline of arbitrary length , that is, a storyline that contains any number of events: .
4.2 Implementation Details
HR-BiLSTM Yu et al. (2018) is adopted as the scoring model , in which objects are converted to word embeddings via GloVe Pennington et al. (2014) as . All relation embeddings are decomposed into graphical embedding and textual embedding . transforms a verb frame and a tail entity’s image position into a one-hot vector, denoting the graphical and image positional information. is composed of the verb frame and tail entity word embedding. Then, and are concatenated into a unified representation . We formulate the representation of relation as
| (2) |
where returns the one-hot representation, returns the word embeddings via GloVE, and [;] denotes concatenation.
A verb frame and tail entity are combined into due to relational ambiguity issues among candidate relations. Using Figure 3 as an example, given a head entity dog, candidates self_motion.park and self_motion.owner represent different semantic meanings when tail entities park and owner are included. However, excluding tail entities results in identical relation candidates self_motion and thus ambiguity between two different candidates.
5 Stage 2: Story Reworking
In story reworking, the framework consists of two components: the story generator and the story evaluator. The story generator generates a story according to the storyline, and the story evaluator—a discriminator trained on the MTurk human ranking data to classify good and bad stories—outputs a story quality score and modifies the loss functions.
5.1 Story Generator
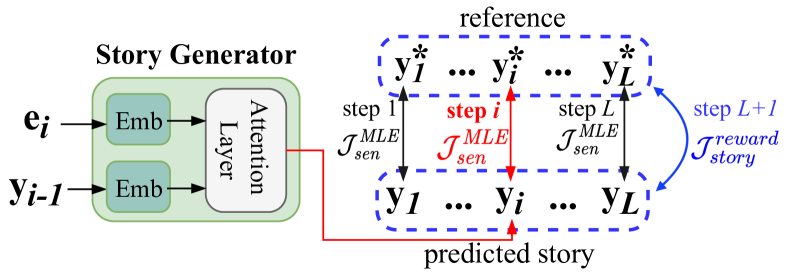
A storyline consists of a set of events that are input to the story generator, which is based on the Transformer Vaswani et al. (2017). Unlike most VIST models, the story generator is dynamic: the number of output sentences depends on the number of events. To manage a diverse number of events, the Transformer is designed as a sentence generator that iteratively generates one sentence per event until it generates sentences. For each step , event and the previous predicted sentence are used to predict the next sentence . After steps, the story generator outputs a story .
5.2 Story Evaluator
Most VIST works use human evaluations to examine their work’s quality via crowdsourcing, comparing their generated stories with the baseline stories. In this paper, we use the first- and last-place stories in the MTurk human ranking data as positive and negative samples. The story evaluator, a discriminator trained on the MTurk human ranking data, learns to distinguish positive and negative samples. It outputs a score for each story, and the scores are converted into rewards, as shown below:
| (3) |
| (4) |
where is a GRU language model Cho et al. (2014), indicates story is a positive sample, and indicates is a negative sample. Language model returns a score from 0 to 1 to reflect story quality. The story evaluator returns a reward, an inverse of with coefficient . The reward later manipulates the loss, optimizing toward human preference. Note that the story evaluator is pre-trained.
5.3 Optimization with Story Evaluator
For optimization, the story generator uses sentence-level and story-level loss functions. Given reference and predicted story , in the maximum likelihood estimation (MLE) optimization process, in each step from 1 to , the model predicts a sentence to calculate the loss between and and then backpropagates, as shown in Figure 4. After predicting sentences, in story-level optimization, the model predicts to calculate the negative log-likelihood to the reference and then backpropagates. The sentence-level and story-level optimization by MLE on dataset are formulated as
| (5) |
| (6) |
where and denote the -th event and the sentence respectively, represents the updated sentence after sentence-level optimization, and represents the story generation model parameters, which are updated using Adam Kingma and Ba (2015).
After training for 30 epochs 222The generation model converges at around 20 epochs in our experiment, and we give it extra 10 epochs for precautions., the story evaluater begins to manipulate the story-level loss. Inspired by reinforcement learning Williams (1992), which utilizes rewards to guide the training process, we use the story evaluator 333The pre-trained ’s weights are frozen to stabilize the training. to encourage the generation model to focus on stories preferred by humans. The reward directly multiplies the story-level loss as
| (7) |
6 Experimental Results
6.1 Data Setups
We used four datasets in this paper: the VIST dataset, Visual Genome, ROCStories, and MTurk human ranking data. The VIST dataset and Visual Genome are used to construct the knowledge graphs, and ROCStories Mostafazadeh et al. (2016) is a large quantity of pure textual stories used for pre-training the story generator. The VIST dataset is also used in story plotting to train the storyline predictor and in story reworking to fine-tune the story generator. Notably, we also collected MTurk human ranking data to train the story evaluator. We used the ranking results from KG-Story444Data obtained from the authors of KG-Story. Hsu et al. (2020). This data contains two experiments, each of which ontains 500 distinct photo sequences. A photo sequence contains a set of machine-generated stories ranked by 5 MTurk workers. Thus we have 5000 rankings from MTurk workers. Specifically, MTurk workers were asked to rank AREL Wang et al. (2018a), KG-Story, two KG-Story ablation models, and reference stories, using three different model settings in each experiment. We selected the rank-1 and rank-5 stories as positive and negative samples.
6.2 Baselines
We used several competitive baseline models. AREL Wang et al. (2018a) and GLAC Kim et al. (2018) are end-to-end models with reinforcement learning and global-location attention mechanisms that achieved top ranks in the VIST Challenge Mitchell et al. (2018). KG-Story Hsu et al. (2020), the current state-of-the-art framework, utilizes a knowledge graph to enrich story contents and generates stories using Transformer.
6.3 Evaluation Methods
Per the literature Wang et al. (2018a), human evaluation is the most reliable way to evaluate the quality of visual stories; automatic metrics often do not align faithfully to human judgment Hsu et al. (2019). Therefore, in this paper, we prioritize human evaluation over automatic evaluations.
Human Evaluation: Ranking Stories and Filling a Questionnaire
We recruited crowd workers from Amazon Mechanical Turk (MTurk) to assess the quality of the generated stories. For each experiment, we randomly selected 250 stories, each of which was evaluated by five different workers in the US. The experiment includes a comparison study with three baseline models and three ablation studies, and each annotator was compensated $0.10 for each experiment. Workers were asked to rank the stories (e.g., ours and those of the baseline/ablation models) based on their overall quality.
In addition, the user interface also provides a questionnaire to collect in-depth feedback from MTurk workers. The questions include “What do you like about the best stories” and “What do you dislike about the worst stories” for workers to select aspects that affect overall story quality. These aspects are provided by Huang et al. (2016): they include focus, coherence, shareability, humanness, grounding, and detail. We calculated the average rank and the majority rank among five workers for each story, as well as total votes for each model’s best and worst aspects.
Non-Classic Automatic Evaluation: BLEURT, voc-d, and MLTD
Many VIST studies have shown that classic automatic evaluation scores like BLEU and METEOR correlate poorly with human judgment Hsu et al. (2020); Hu et al. (2019); Wang et al. (2020); Li et al. (2020); Yang et al. (2019); Hsu et al. (2019); Wang et al. (2018a); Modi and Parde (2019). These n-gram matching metrics fail to account for the semantic similarity to the reference stories and lexical richness in the generated stories.
Therefore, we adopted BLEURT Sellam et al. (2020), a state-of-the-art BERT-based evaluation metric, to further correlate generated stories and reference stories based on their semantic meaning. We also adopted lexical diversity metrics voc-d and MLTD McCarthy and Jarvis (2010) to quantify story lexical richness. Several works have shown that lexical diversity is positive correlated to story quality Liu et al. (2019); Dai et al. (2017).
6.4 Results
In our experiments, the stories generated by PR-VIST have an average of 5.96 sentences. 57.3% of these stories contain at least one event (sentence) that uses story elements extracted from two (or more) images, showing PR-VIST’s ability to utilize intra-image entities.
Human Evaluation
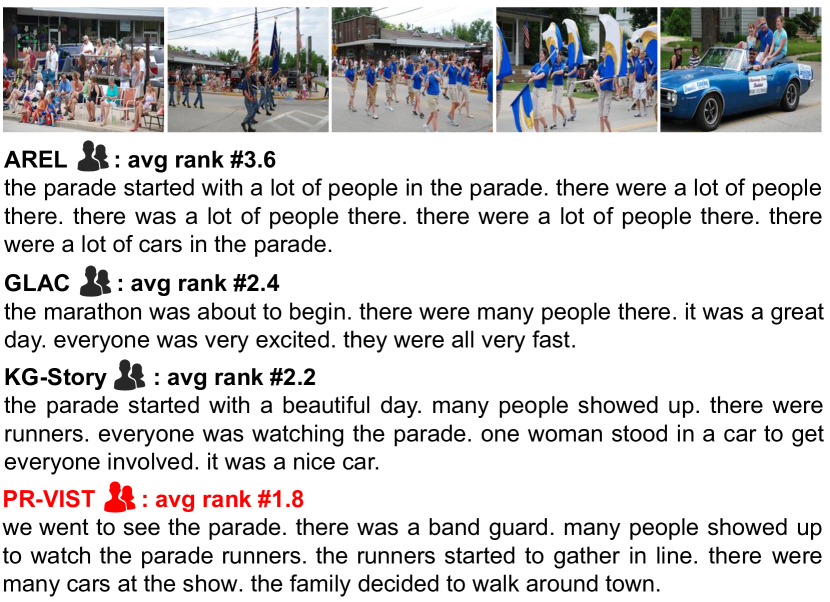
We asked MTurk workers to rank four stories: those of PR-VIST, the three baseline models, and the state-of-the-art KG-story. Table 2 shows the results. PR-VIST outperforms other models in average ranking: it outranks AREL by 0.24 and KG-Story by 0.16. As for the percentage of 1st-rank stories, PR-VIST produces 12.0% more than AREL and 7.5% more than KG-Story. Figure 5 shows a representative example. Compared with end-to-end models (i.e., AREL and GLAC), graph-based methods (i.e., KG-Story and PR-VIST) generate more diverse stories. Compared with KG-Story, whose sentences are relatively simple and plain, generating sentences such as “Many people showed up”, our model reuses entities such as “parade” in the first sentence and associates relations with other entities, e.g., “people” and “runners”, to compose “many people showed up to watch the parade runners”.
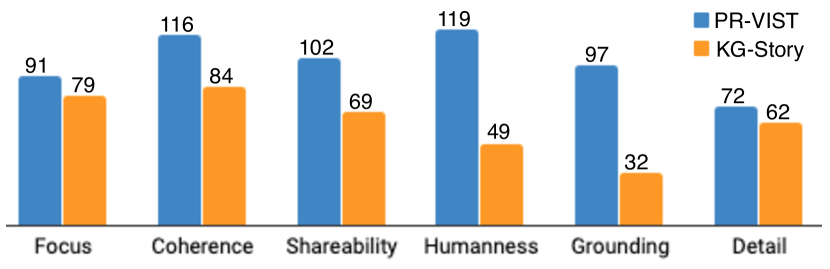
Moreover, Figure 6 shows the questionnaire (see Section 6.3) result for the best-ranked stories. For PR-VIST and KG-Story’s best-ranked stories, the PR-VIST story count is significantly higher in all aspects; specifically, coherence, shareability, and humanness are higher than other categories.
| Method | 1st | 2nd | 3rd | 4th | Avg | Major |
|---|---|---|---|---|---|---|
| AREL | 20.6% (258) | 26.8% | 27.2% | 25.4% | 2.57 | 2.56 |
| GLAC | 21.7% (271) | 24.2% | 25.5% | 28.6% | 2.61 | 2.73 |
| KG-Story | 25.1% (314) | 25.2% | 25.7% | 24.0% | 2.49 | 2.53 |
| PR-VIST | 32.6% (407) | 23.7% | 21.7% | 22.0% | 2.33 | 2.28 |
Automatic Evaluations
Table 3 shows that the proposed method outperforms all the baselines in BLEURT,voc-d, and MLTD. Although n-gram-based automatic metrics are known to correlate poorly with human judgment in VIST (see Section 6.3), it is still noteworthy that PR-VIST results in significantly lower BLEU-4 scores. This might be cause by the fact that PR-VIST uses knowledge to enrich the story content and increase lexical diversity, but could lower the performance in n-gram matching.
| Method | BLEU-4 | METEOR | BLEURT | MLTD | voc-d |
|---|---|---|---|---|---|
| AREL | 14.4 | 35.4 | 0.52 | 22.45 | 0.53 |
| GLAC | 10.7 | 33.7 | 0.71 | 32.87 | 0.67 |
| KG-Story | 9.93 | 32.2 | 0.72 | 40.52 | 0.71 |
| PR-VIST | 7.65 | 31.6 | 1.37 | 45.79 | 0.73 |
7 Ablation Study
Three factors contribute to PR-VIST’s superior performance: story elements, knowledge graphs, and plot reworking. To evaluate the effectiveness of each factor in our framework, we conducted three ablation studies using human evaluations. The evaluation results are shown in Table 4. All three experiments use the same qualitative analysis, and each experiment ranks PR-VIST and two settings with certain components removed.
Story Elements
PR-VIST is compared to two models, each of which uses only objects or terms for the storyline predictor to plot storylines.
Knowledge Graphs
PR-VIST is compared to two models, each of which uses only or for the storyline predictor to plot storylines.
Plot and Rework
PR-VIST is compared to two models: one without reworking and one without plotting or reworking. Without-reworking means the discriminator is removed, that is, the story generator uses Equation 6 for all epochs. Without-plotting-reworking means that the storyline predictor is additionally removed, so no frames are included; terms are used directly as the story generator’s input.
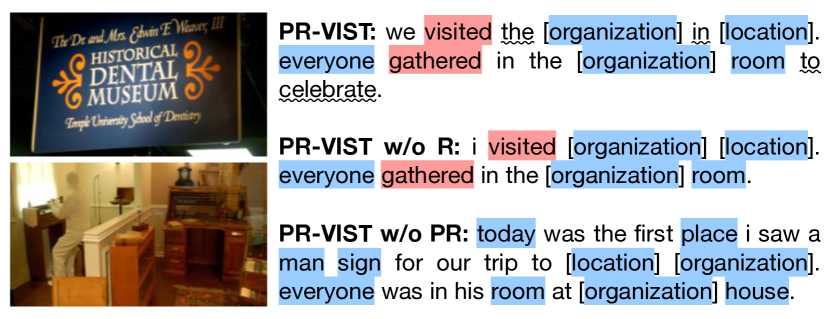
Table 4 shows that PR-VIST outperforms all the ablation models. Furthermore, the first and second experiments show that MTurkers prefer story-like storylines to image-like storylines. That is, terms and are better than objects and . For the third experiment, we note a steady improvement from without-plotting-reworking to PR-VIST, showing the effectiveness of the proposed method. An example is shown in Figure 7. The model cannot manage the abundant story elements without the guidance of story plotting. Comparing PR-VIST with PR-VIST w/o R, we see that reworking revises and enlivens (e.g., “[organization] in [location]”) the stories.
| objects | terms | Plot | Rework | Avg | Major | |||
|---|---|---|---|---|---|---|---|---|
| ✓ | ✓ | ✓ | ✓ | ✓ | ✓ | 1.89 | 1.87 | |
| 1 | ✓ | ✓ | ✓ | ✓ | ✓ | 1.98 | 2.00 | |
| ✓ | ✓ | ✓ | ✓ | ✓ | 2.12 | 2.13 | ||
| ✓ | ✓ | ✓ | ✓ | ✓ | ✓ | 1.97 | 1.94 | |
| 2 | ✓ | ✓ | ✓ | ✓ | ✓ | 1.98 | 1.99 | |
| ✓ | ✓ | ✓ | ✓ | ✓ | 2.00 | 2.06 | ||
| ✓ | ✓ | ✓ | ✓ | ✓ | ✓ | 1.95 | 1.93 | |
| 3 | ✓ | ✓ | ✓ | ✓ | ✓ | 2.00 | 2.02 | |
| ✓ | ✓ | ✓ | ✓ | 2.03 | 2.08 |
8 Discussion
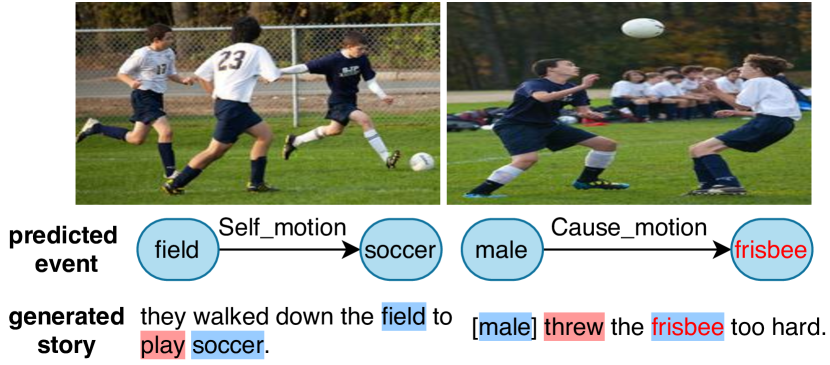
To understand areas for improvement, in the human ranking evaluation, we asked crowd workers to select the aspect (out of six) they disliked about the worst story (see Section 6.3.) Of the negative votes, 24.6% were for “grounding.” Namely, lower-ranked stories are often not visually grounded. We examined the outputs and found that Faster-RCNN in Stage 1 sometimes predicts objects that are inaccurate but semantically related to the context. Figure 8 shows a typical example, where the soccer ball is identified as a frisbee, which is incorrect but still fits the “sports” theme. When the storyline predictor is unable to distinguish such mistaken objects from appropriate objects, grounding errors occur. A better object detector would mitigate this problem, or we could jointly optimize plotting and generation, for instance by including reworking within storyline plotting.
9 Conclusion
We propose a novel story plotting and reworking framework to mimic the human story-writing process. To the best of our knowledge, no study has integrated knowledge graph and story plotting to utilize visual elements in VIST. Also novel is our approximation of human-preferred stories by reusing and aggregating story generation using the results of human-annotated story ranking evaluations, e.g., human evaluation results from MTurk. We also propose a novel questionnaire embedded in the comparative study to collect detailed, meaningful human-annotated data from MTurk. Experiments attest PR-VIST’s strong performance in diversity, coherence, and humanness.
10 Ethical Considerations
Although our research aims to produce short stories that are vivid, engaging, and innocent, we are aware of the possibilities of utilizing a similar approach to generate inappropriate text (e.g., violent, racial, or gender-insensitive stories). The proposed visual storytelling technology enables people to generate stories rapidly based on photo sequences at scale, which could also be used with malicious intent, for example, to concoct fake stories using real images. Finally, as the proposed methods use external knowledge graphs, they reflect the issues, risks, and biases of such information sources. Mitigating these potential risks will require continued research.
11 Acknowledgements
This research is supported by Ministry of Science and Technology, Taiwan under the project contract 108-2221-E-001-012-MY3 and 108-2923-E-001-001-MY2 and the Seed Grant from the College of Information Sciences and Technology (IST), Pennsylvania State University. We also thank the crowd workers for participating in this project.
References
- Baker et al. (1998) Collin F Baker, Charles J Fillmore, and John B Lowe. 1998. The Berkeley FrameNet Project. In Proceedings of the 17th International Conference on Computational Linguistics-Volume 1, pages 86–90. Association for Computational Linguistics.
- Chen et al. (2017) Zhiqian Chen, Xuchao Zhang, Arnold P Boedihardjo, Jing Dai, and Chang-Tien Lu. 2017. Multimodal storytelling via generative adversarial imitation learning. arXiv preprint arXiv:1712.01455.
- Chen et al. (2019) Zi-Yuan Chen, Chih-Hung Chang, Yi-Pei Chen, Jijnasa Nayak, and Lun-Wei Ku. 2019. UHop: An unrestricted-hop relation extraction framework for knowledge-based question answering.
- Cho et al. (2014) Kyunghyun Cho, Bart Van Merriënboer, Caglar Gulcehre, Dzmitry Bahdanau, Fethi Bougares, Holger Schwenk, and Yoshua Bengio. 2014. Learning phrase representations using RNN encoder-decoder for statistical machine translation. arXiv preprint arXiv:1406.1078.
- Dai et al. (2017) Bo Dai, Sanja Fidler, Raquel Urtasun, and Dahua Lin. 2017. Towards diverse and natural image descriptions via a conditional GAN. In Proceedings of the IEEE International Conference on Computer Vision, pages 2970–2979.
- Fan et al. (2019) Angela Fan, M. Lewis, and Yann Dauphin. 2019. Strategies for structuring story generation. In ACL.
- Flower and Hayes (1981) Linda Flower and John R Hayes. 1981. A cognitive process theory of writing. College Composition and Communication, 32(4):365–387.
- Gonzalez-Rico and Fuentes-Pineda (2018) Diana Gonzalez-Rico and Gibran Fuentes-Pineda. 2018. Contextualize, show and tell: A neural visual storyteller. arXiv preprint arXiv:1806.00738.
- Hsu et al. (2018) Chao-Chun Hsu, Szu-Min Chen, Ming-Hsun Hsieh, and Lun-Wei Ku. 2018. Using inter-sentence diverse beam search to reduce redundancy in visual storytelling. arXiv preprint arXiv:1805.11867.
- Hsu et al. (2020) Chao-Chun Hsu, Zi-Yuan Chen, Chi-Yang Hsu, Chih-Chia Li, Tzu-Yuan Lin, Ting-Hao (Kenneth) Huang, and Lun-Wei Ku. 2020. Knowledge-enriched visual storytelling. In Proceedings of Thirty-Fourth AAAI Conference on Artificial Intelligence.
- Hsu et al. (2019) Ting-Yao Hsu, Huang Chieh-Yang, Yen-Chia Hsu, and Ting-Hao Kenneth Huang. 2019. Visual story post-editing. In ACL.
- Hu et al. (2019) Junjie Hu, Yu Cheng, Zhe Gan, Jingjing Liu, Jianfeng Gao, and Graham Neubig. 2019. What makes a good story? designing composite rewards for visual storytelling.
- Huang et al. (2019) Qiuyuan Huang, Zhe Gan, Asli Celikyilmaz, Dapeng Wu, Jianfeng Wang, and Xiaodong He. 2019. Hierarchically structured reinforcement learning for topically coherent visual story generation. In Proceedings of the AAAI Conference on Artificial Intelligence, volume 33, pages 8465–8472.
- Huang et al. (2016) Ting-Hao Kenneth Huang, Francis Ferraro, Nasrin Mostafazadeh, Ishan Misra, Aishwarya Agrawal, Jacob Devlin, Ross Girshick, Xiaodong He, Pushmeet Kohli, Dhruv Batra, et al. 2016. Visual storytelling. In Proceedings of the 2016 Conference of the North American Chapter of the Association for Computational Linguistics: Human Language Technologies, pages 1233–1239.
- Johnson et al. (2018) J. Johnson, Agrim Gupta, and Li Fei-Fei. 2018. Image generation from scene graphs. 2018 IEEE/CVF Conference on Computer Vision and Pattern Recognition, pages 1219–1228.
- Jung et al. (2020) Yunjae Jung, Dahun Kim, Sanghyun Woo, Kyungsu Kim, Sungjin Kim, and In So Kweon. 2020. Hide-and-tell: Learning to bridge photo streams for visual storytelling. ArXiv, abs/2002.00774.
- Kim et al. (2018) Taehyeong Kim, Min-Oh Heo, Seonil Son, Kyoung-Wha Park, and Byoung-Tak Zhang. 2018. GLAC Net: GLocal Attention Cascading Networks for multi-image cued story generation. arXiv preprint arXiv:1805.10973.
- Kingma and Ba (2015) Diederik P. Kingma and Jimmy Ba. 2015. Adam: A method for stochastic optimization. CoRR, abs/1412.6980.
- Krishna et al. (2017) Ranjay Krishna, Yuke Zhu, Oliver Groth, Justin Johnson, Kenji Hata, Joshua Kravitz, Stephanie Chen, Yannis Kalantidis, Li-Jia Li, David A. Shamma, and et al. 2017. Visual Genome: Connecting language and vision using crowdsourced dense image annotations. International Journal of Computer Vision, 123(1):32–73.
- Li et al. (2020) Jiacheng Li, Siliang Tang, Juncheng Li, Jun Xiao, Fei Wu, Shiliang Pu, and Yueting Zhuang. 2020. Topic adaptation and prototype encoding for few-shot visual storytelling. Proceedings of the 28th ACM International Conference on Multimedia.
- Li et al. (2019) Nanxing Li, Bei Liu, Zhizhong Han, Yu-Shen Liu, and Jianlong Fu. 2019. Emotion reinforced visual storytelling. In Proceedings of the 2019 on International Conference on Multimedia Retrieval, ICMR ’19, page 297–305, New York, NY, USA. Association for Computing Machinery.
- Liu and Singh (2004) Hugo Liu and Push Singh. 2004. ConceptNet—a practical commonsense reasoning tool-kit. BT Technology Journal, 22(4):211–226.
- Liu et al. (2019) Lixin Liu, Jiajun Tang, Xiaojun Wan, and Zongming Guo. 2019. Generating diverse and descriptive image captions using visual paraphrases. In Proceedings of the IEEE/CVF International Conference on Computer Vision (ICCV).
- McCarthy and Jarvis (2010) McCarthy and S. Jarvis. 2010. MTLD, vocd-D, and HD-D: A validation study of sophisticated approaches to lexical diversity assessment. Behavior Research Methods, page 381–392.
- Mitchell et al. (2018) Margaret Mitchell, Ting-Hao Huang, Francis Ferraro, and Ishan Misra. 2018. Proceedings of the first workshop on storytelling. In Proceedings of the First Workshop on Storytelling.
- Modi and Parde (2019) Yatri Modi and Natalie Parde. 2019. The steep road to happily ever after: An analysis of current visual storytelling models. In Proceedings of the Second Workshop on Shortcomings in Vision and Language, pages 47–57, Minneapolis, Minnesota. Association for Computational Linguistics.
- Mostafazadeh et al. (2016) N. Mostafazadeh, Nathanael Chambers, Xiaodong He, Devi Parikh, Dhruv Batra, Lucy Vanderwende, P. Kohli, and James F. Allen. 2016. A corpus and cloze evaluation for deeper understanding of commonsense stories. In NAACL.
- Pennington et al. (2014) Jeffrey Pennington, Richard Socher, and Christopher D. Manning. 2014. GloVe: Global vectors for word representation. In Empirical Methods in Natural Language Processing (EMNLP), pages 1532–1543.
- Ren et al. (2015) Shaoqing Ren, Kaiming He, Ross Girshick, and Jian Sun. 2015. Faster R-CNN: Towards real-time object detection with region proposal networks. In Advances in Neural Information Processing Systems, pages 91–99.
- Sellam et al. (2020) Thibault Sellam, Dipanjan Das, and Ankur P. Parikh. 2020. BLEURT: Learning robust metrics for text generation.
- Swayamdipta et al. (2017) Swabha Swayamdipta, Sam Thomson, Chris Dyer, and Noah A. Smith. 2017. Frame-Semantic Parsing with Softmax-Margin Segmental RNNs and a Syntactic Scaffold. arXiv preprint arXiv:1706.09528.
- Vaswani et al. (2017) Ashish Vaswani, Noam Shazeer, Niki Parmar, Jakob Uszkoreit, Llion Jones, Aidan N Gomez, Łukasz Kaiser, and Illia Polosukhin. 2017. Attention is all you need. In Advances in Neural Information Processing Systems, pages 5998–6008.
- Wang et al. (2018a) Jing Wang, Jianlong Fu, Jinhui Tang, Zechao Li, and Tao Mei. 2018a. Show, reward and tell: Automatic generation of narrative paragraph from photo stream by adversarial training. In Thirty-Second AAAI Conference on Artificial Intelligence.
- Wang et al. (2019) Ruize Wang, Zhongyu Wei, Piji Li, Haijun Shan, Ji Zhang, Qi Zhang, and Xuanjing Huang. 2019. Keep it consistent: Topic-aware storytelling from an image stream via iterative multi-agent communication.
- Wang et al. (2020) Ruize Wang, Zhongyu Wei, Piji Li, Qi Zhang, and Xuanjing Huang. 2020. Storytelling from an image stream using scene graphs. In AAAI 2020.
- Wang et al. (2018b) Xin Wang, Wenhu Chen, Yuan-Fang Wang, and William Yang Wang. 2018b. No metrics are perfect: Adversarial reward learning for visual storytelling. CoRR, abs/1804.09160.
- Williams (1992) Ronald J. Williams. 1992. Simple statistical gradient-following algorithms for connectionist reinforcement learning. Mach. Learn., 8(3–4):229–256.
- Yang et al. (2019) Pengcheng Yang, Fuli Luo, Peng Chen, Lei Li, Zhiyi Yin, Xiaodong He, and Xu Sun. 2019. Knowledgeable Storyteller: A commonsense-driven generative model for visual storytelling. In Proceedings of the Twenty-Eighth International Joint Conference on Artificial Intelligence, IJCAI-19, pages 5356–5362. International Joint Conferences on Artificial Intelligence Organization.
- Yao et al. (2018) Lili Yao, Nanyun Peng, Ralph M. Weischedel, Kevin Knight, Dongyan Zhao, and Rui Yan. 2018. Plan-and-write: Towards better automatic storytelling. CoRR, abs/1811.05701.
- Yu et al. (2018) Yang Yu, Kazi Saidul Hasan, Mo Yu, Wei Zhang, and Zhiguo Wang. 2018. Knowledge base relation detection via multi-view matching. New Trends in Databases and Information Systems, page 286–294.