Betweenness centrality of teams in social networks
Abstract
Betweenness centrality (BC) was proposed as an indicator of the extent of an individual’s influence in a social network. It is measured by counting how many times a vertex (i.e., an individual) appears on all the shortest paths between pairs of vertices. A question naturally arises as to how the influence of a team or group in a social network can be measured. Here, we propose a method of measuring this influence on a bipartite graph comprising vertices (individuals) and hyperedges (teams). When the hyperedge size varies, the number of shortest paths between two vertices in a hypergraph can be larger than that in a binary graph. Thus, the power-law behavior of the team BC distribution breaks down in scale-free hypergraphs. However, when the weight of each hyperedge, for example, the performance per team member, is counted, the team BC distribution is found to exhibit power-law behavior. We find that a team with a widely connected member is highly influential.
A graph consisting of pairwise interactions was useful for understanding emerging phenomena such as the formation of a giant community, and quantifying an individual’s influence by betweenness centrality (BC). However, the BC is not useful to measure the influence of a team that is composed of more than two people. Here, we extend mesurement method of the BC in a graph to a hypergraph with higher-order interactions, which is not straightforward. We find that the team BC distribution in a scale-free binary hypergraph does not exhibit power-law behavior because the number of the shortest paths between every pair of nodes increases significantly. We find that a weight of hyperedge, the performance per team member is appropriate to obtain the power-law behavior of the team BC distribution. Interestingly, it reveals that the team with high performance per team member does not have large team BC value, but the team with a leader with large degree has large team BC. Thus, our result supports the statement that connectivity is more crucial than performance for success.
Complex systems comprising many elements and their interactions can be represented by graphs for simplicity. A graph is composed of vertices and edges, which represent elements and pairwise interactions among the elements, respectively [1, 2, 3, 4]. A hypergraph is a generalization of a graph in which interacting elements are not limited to pairs of vertices; that is, more than two elements can interact, for instance, coauthors of a paper, players on a sports team, or proteins in a protein complex in biological networks. These interacting teams are represented by hyperedges in hypergraph representation [5, 6, 7, 9, 8, 11, 10, 12, 13, 14, 15, 16, 17, 18, 19, 20].
Betweenness centrality (BC) was proposed as a measure of the influence of a vertex (individual) in a social network. This quantity is measured by counting the number of times a vertex appears on all the shortest paths between pairs of vertices in a graph. The vertex BC (-BC) of vertex [] is obtained as , where is the number of shortest paths between vertices and , and represents the number of shortest paths passing through vertex [21, 22]. BC has been used to describe diverse phenomena such as the load of each router on the Internet [23, 24, 25, 26, 27, 28, 29, 30, 31, 32]. Interestingly, the BC of each vertex has a power-law distribution in scale-free (SF) networks, and the exponent differs from that of the degree distribution [33, 34]. The edge BC (-BC) of edge is defined similarly to -BC as the fraction of shortest paths passing through edge among all the shortest paths between pairs of vertices [35, 36].
Here, we are interested in the BC of a group or team composed of more than two people, for instance, the influence of a research group comprising coauthors of a paper in a coauthorship network or the importance of the role a protein complex plays in signal transduction in a protein interaction network [37]. However, it is not obvious whether -BC or -BC is useful for this purpose. For instance, when three researchers form a team, a 3-clique represents the linkage of the group; however, this clique may be interpreted as the representation of three groups composed of pairs of vertices. Thus, it is challenging to introduce an appropriate quantity that measures the influence of a higher-order interacting object such as a group or team. Here, we propose the use of the hyperedge BC (-BC) in hypergraphs for this purpose.
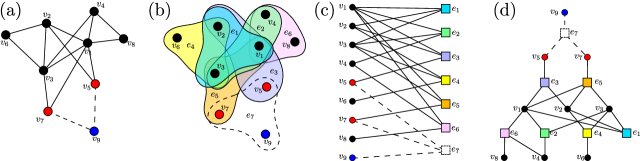
To obtain the -BC in a hypergraph, we use a bipartite graph. For instance, in Fig. 1, two adjacent vertices are connected by one or more hyperedges with higher-order interactions. Then, the path between any two vertices on the hypergraph is defined as an alternating sequence of vertices and adjacent hyperedges between the two vertices. The paths with the smallest hopping steps between vertex and hyperedge sets are the shortest. The -BC is defined similarly to the -BC along the shortest paths in a graph.
We performed the computation using the algorithm introduced by Brandes [38]. Briefly, a shortest-path tree is constructed by choosing a vertex and then stacking the BC values while returning. Repeating this process for all the starting points yields the entire BC. Fig. 1 illustrates the entire process of measuring the -BCs in the bipartite graph. Note that hyperedges are regarded as vertices in the bipartite representation.
We first consider one graph and one hypergraph as minimum models and obtain the distributions of -BC, -BC and -BC. The two minimal model networks are as follows:
-
(i)
The model is the graph composed of vertices and edges [39] proposed by Barabási and Albert(the BA model). The BA model evolves as follows. (a) The system initially contains isolated vertices. (b) At each time step, a vertex is added to the system and is connected to existing vertices selected according to the so-called preferential attachment rule, that is, a vertex with degree is selected with probability . This process is repeated times, and an SF graph with vertices is constructed. The degree distribution of an SF graph follows the power law . For the BA graph, the exponent is obtained.
-
(ii)
BA hypergraph: step (a) is the same as that for the BA model. In step (b), the number of target vertices is taken from the Poisson distribution with given mean values . A new vertex and the selected target vertices are regarded as the elements of a hyperedge. The preferential attachment rule is modified such that each vertex among the vertices is selected with a probability proportional to the hypergraph degree , that is, the number of hyperedges vertex belongs to, which is given as .
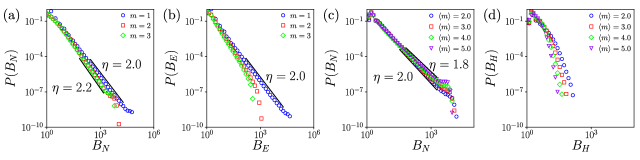
For this graph and hypergraph, we investigate the -, -, and -BC distributions for different or values. Fig. 2(a) and 2(b) show the results for the BA graph, and Fig. 2(c) and 2(d) shows those for the BA hypergraph. The -BC distributions for the graph and the hypergraph are shown in 2(a) and 2(c), respectively. The corresponding - and -BC distributions are shown in Fig. 2(b) and 2(d), respectively.
We first consider the -BC distribution. (i) For the BA graph, it exhibits power-law behavior as with exponents for and for and . When , the graph is a tree, and the exponent was analytically obtained as [33]. However, when , the graph has loops, and the analytic solution for this case has not been reported.
The BA hypergraph is designed to model a coauthorship hypergraph consisting of authors and papers. An author (paper) is regarded as a vertex (hyperedge). The number of authors of a paper, which corresponds to the size of a hyperedge, follows a Poisson distribution with mean degree . Here, we control the mean degree of the hypergraph. The -BC distributions for different values exhibit power-law behavior with an exponent of for , which gradually decreases with increasing (Fig. 2(c)). Overall, the -BC distributions of the graph and hypergraph exhibit power-law behavior.
Next, we consider the distributions of -BC and -BC in Fig. 2(b) and 2(d), respectively. For the BA tree graph with in 2(b), the -BC distribution is very similar to the -BC distribution. For , the -BC distribution exhibits power-law behavior for small ; however, it shows exponential decay for large . For the BA hypergraph with different values, the -BC distributions decay more rapidly as the mean hyperedge size is increased. The reason is as follows. As is increased, the total number of shortest paths between pairs of vertices shows a faster than linear increase with respect to . Thus, hyperedges may be more likely to appear on the shortest paths. More shortest paths can be generated between two given vertices in hypergraphs. Consequently, the hyperedge has a somewhat smaller -BC value, because -BC is the inverse of the total number of shortest paths between two given vertices. This behavior is more apparent when is large.
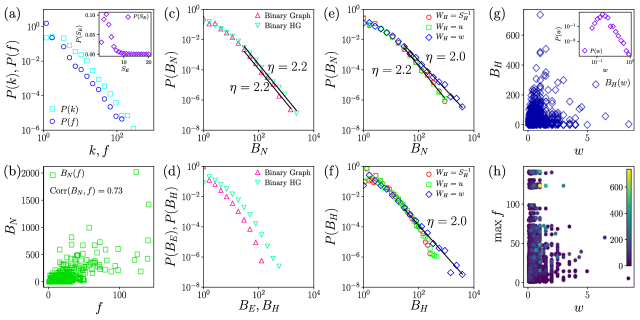
We used a coauthorship dataset [40] consisting of authors and papers in the field of network science published from June 1998 to the end of 2017 that cite two pioneering papers, those on the Watts–Strogatz model of small-world networks and the Barabási–Albert model of SF networks, and highly cited early review papers [41, 39, 1, 2, 3, 42]. The dataset contains 32,016 distinct authors and 21,653 papers [43, 44]. For convenience, we consider the BC distribution on the giant hypergraph. In the graph representation, authors are connected if they have written at least one paper together. Here, we constructed a coauthorship hypergraph by regarding papers as hyperedges. Fig. 3(a) shows the structural properties (the graph degree and hypergraph degree distributions) of the giant cluster in the coauthorship network in the graph and hypergraph representations. These degree distributions exhibit power-law behavior with and , respectively. The inset of Fig. 3(a) shows the distribution of the hyperedge size, i.e., the number of coauthors of each paper. It seems to fit the Poisson distribution with a mean value .
The BC distributions of the coauthorship graph and hypergraph are investigated by measuring the -BC, -BC, and -BC distributions. The -BC distributions of the coauthorship graph and hypergraph seem to exhibit power-law behavior in the tail region with exponent , as shown in Fig. 3(c). Note that the vertices with large hyperedge degrees have large -BC values, as shown in Fig. 3(b). The reason is probably that the vertices with large graph degrees have large -BC values. The -BC and -BC distributions follow heavy-tailed distributions overall, as shown in Fig. 3(d).
We note that each hyperedge in the coauthorship hypergraph represents the team of coauthors who wrote each paper. The empirical dataset shows how many papers each research group has published. Using this information, we construct a weighted coauthorship hypergraph in which each hyperedge is assigned two types of weights. One is the number of papers published by a team, which is expressed as , where is a research group index. We regard this weight as representing the performance of team . The other weight is the number of papers divided by the number of coauthors, which is denoted as . This weight is interpreted as the performance per group member.
We first consider how to identify the shortest paths between a pair of vertices and then how to measure the BC of each vertex and hyperedge. Let us consider the weight . We introduce the cost of each hyperedge as and then find the shortest path(s) between two vertices and along which the total cost is minimum, where the index runs through all hyperedges along a shortest path between nodes and . If there is one shortest path, the BC of each hyperedge along the shortest path is set to for the pair of vertices . However, if the number of shortest paths is larger than one, say , a BC of is assigned to each hyperedge on the shortest paths , where . This process is repeated for every pair of vertices in the coauthorship hypergraph. The BC values of each vertex and hyperedge are then the sum of all those BCs; the -BC and -BC distributions are indicated in Fig. 3(b) and 3(d) by inverted triangles (). We also obtain the -BC and -BC for the weight in a similar way. The data () in Fig. 3(e) and 3(f) show the -BC and -BC distributions, respectively. Both of these BC distributions exhibit power-law behavior with exponent . The exponent value of may imply (but not guarantee) that there is usually one shortest path between two vertices. The weight enables us to select the most significant shortest path from among the multiple shortest paths generated in the hyperedge representation. We remark that although the -BC distribution of the coauthorship network in binary hypergraph representation in Fig. 3(d) does not exhibit power-law behavior, the distribution in the weighted hypergraph representation, particularly that with weight , does clearly show power-law behavior (Fig. 3(f)). The greatest heterogeneity among the four paths is achieved by the -weighted hypergraph.
We check whether the tail of the -BC distribution based on the -weight measure is contributed by the hyperedges with large values and find that their values are not very large, as shown in Fig. 3(g). Counterintuitively, the tail of the -BC distribution is contributed by the hyperedges containing the nodes with large hypergraph degree (i.e., large -BC values) in the bipartite representation, as shown in Fig. 3(h). These nodes may represent the team leaders of each hyperedge.
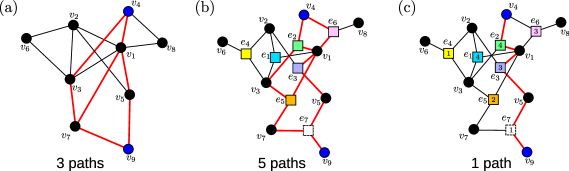
In summary, we investigated the BC distributions of SF hypergraphs in various forms. Unlike the -BCs in an SF graph, the -BCs are meaningful because they represent the degrees of influence of teams or groups in social networks. By mapping a hypergraph to a bipartite network, we measured the BC distributions of vertices and hyperedges simultaneously. Counterintuitively, the -BC distribution in an SF hypergraph does not exhibit power-law behavior. The reason is that the number of shortest paths between a given pair of vertices in a hypergraph becomes more than that in the graph, as shown in Fig. 4(a) and 4(b), which reduces the contribution of each hyperedge to communication between a given pair of vertices. Therefore, it was challenging to design a BC measure that generates a heterogeneous -BC distribution. To overcome this difficulty, we proposed a weighted hypergraph in which each hyperedge (team) is assigned a weight that is proportional to the activity per group member. Assuming that information spreads between two vertices along the paths that minimize the total cost, which is given as the sum of the inverse of the -weights of each hyperedge along the path, we found that the number of shortest paths decreases to one, as shown in Fig. 4(c). Thus, the -BC distribution exhibits power-law decay with exponent . This BC measure is useful for quantifying team influence in a coauthorship hypergraph. As Barabási stated in his book [45], “Performance drives success, but when performance cannot be measured, networks drive success.” Our results support the importance of networking in the transfer of information even for high-performing teams. We expect that the methodology developed using the coauthorship hypergraph will be useful in other hypergraphs.
Acknowledgements.
This research was supported by the NRF of Republic of Korea, Grant No. NRF-2014R1A3A2069005 (BK).Data availability
All data used in this work are available from the authors upon reasonable request.
References
- Albert and Barabási [2002] R. Albert and A.-L. Barabási, Statistical mechanics of complex networks, Reviews of Modern Physics 74, 47 (2002).
- Dorogovtsev and Mendes [2002] S. N. Dorogovtsev and J. F. F. Mendes, Evolution of networks, Advances in Physics 51, 1079 (2002).
- Newman [2003] M. E. J. Newman, The structure and function of complex networks, SIAM Review 45, 167 (2003).
- Lee et al. [2018] D. Lee, B. Kahng, Y. S. Cho, K. I. Goh, and D. S. Lee, Recent advances of percolation theory in complex networks, Journal of the Korean Physical Society 73, 152 (2018).
- Berge [1984] C. Berge, Hypergraphs: combinatorics of finite sets, Vol. 45 (Elsevier, 1984).
- Voloshin [2009] V. I. Voloshin, Introduction to graph and hypergraph theory (Nova Science Publ., 2009).
- Bollé et al. [2006] D. Bollé, R. Heylen, and N. S. Skantzos, Thermodynamics of spin systems on small-world hypergraphs, Physical Review E 74, 056111 (2006).
- Vazquez [2008] A. Vazquez, Population stratification using a statistical model on hypergraphs, Physical Review E 77, 066106 (2008).
- Bollé and Heylen [2008] D. Bollé and R. Heylen, Small-world hypergraphs on a bond-disordered bethe lattice, Physical Review E 77, 046104 (2008).
- Ghoshal et al. [2009] G. Ghoshal, V. Zlatić, G. Caldarelli, and M. E. J. Newman, Random hypergraphs and their applications, Physical Review E 79, 066118 (2009).
- Klamt et al. [2009] S. Klamt, U.-U. Haus, and F. Theis, Hypergraphs and cellular networks, PLOS Computational Biology 5, 1 (2009).
- Zlatić et al. [2009] V. Zlatić, G. Ghoshal, and G. Caldarelli, Hypergraph topological quantities for tagged social networks, Physical Review E 80, 036118 (2009).
- Bu et al. [2010] J. Bu, S. Tan, C. Chen, C. Wang, H. Wu, L. Zhang, and X. He, Music recommendation by unified hypergraph: Combining social media information and music content, in Proceedings of the 18th ACM International Conference on Multimedia, MM ’10 (Association for Computing Machinery, New York, NY, USA, 2010) p. 391–400.
- Taramasco et al. [2010] C. Taramasco, J.-P. Cointet, and C. Roth, Academic team formation as evolving hypergraphs, Scientometrics 85, 721 (2010).
- Liu et al. [2018] Y. Liu, J. Yuan, B. Duan, and D. Li, Quantum walks on regular uniform hypergraphs, Scientific Reports 8, 9548 (2018).
- Jhun et al. [2019] B. Jhun, M. Jo, and B. Kahng, Simplicial SIS model in scale-free uniform hypergraph, Journal of Statistical Mechanics: Theory and Experiment 2019, 123207 (2019).
- Carletti et al. [2020] T. Carletti, F. Battiston, G. Cencetti, and D. Fanelli, Random walks on hypergraphs, Physical Review E 101, 022308 (2020).
- de Arruda et al. [2020] G. F. de Arruda, G. Petri, and Y. Moreno, Social contagion models on hypergraphs, Physical Review Research 2, 023032 (2020).
- Alvarez-Rodriguez et al. [2021] U. Alvarez-Rodriguez, F. Battiston, G. F. de Arruda, Y. Moreno, M. Perc, and V. Latora, Evolutionary dynamics of higher-order interactions in social networks, Nature Human Behaviour, 1 (2021).
- Ferraz de Arruda et al. [2021] G. Ferraz de Arruda, M. Tizzani, and Y. Moreno, Phase transitions and stability of dynamical processes on hypergraphs, Communications Physics 4, 24 (2021).
- Freeman [1977] L. C. Freeman, A set of measures of centrality based on betweenness, Sociometry, 35 (1977).
- Freeman [1978] L. C. Freeman, Centrality in social networks conceptual clarification, Social networks 1, 215 (1978).
- Erramilli et al. [1996] A. Erramilli, O. Narayan, and W. Willinger, Experimental queueing analysis with long-range dependent packet traffic, IEEE/ACM Transactions on networking 4, 209 (1996).
- Goh et al. [2001] K.-I. Goh, B. Kahng, and D. Kim, Universal behavior of load distribution in scale-free networks, Physical Review Letter 87, 278701 (2001).
- Tadić and Rodgers [2002] B. Tadić and G. Rodgers, Packet transport on scale-free networks, Advances in Complex Systems 5, 445 (2002).
- Tadić and Thurner [2004] B. Tadić and S. Thurner, Information super-diffusion on structured networks, Physica A: Statistical Mechanics and its Applications 332, 566 (2004).
- Tadić et al. [2004] B. Tadić, S. Thurner, and G. J. Rodgers, Traffic on complex networks: Towards understanding global statistical properties from microscopic density fluctuations, Physical Review E 69, 036102 (2004).
- Tadić and Thurner [2005] B. Tadić and S. Thurner, Search and topology aspects in transport on scale-free networks, Physica A: Statistical Mechanics and its Applications 346, 183 (2005).
- Dodds et al. [2003] P. S. Dodds, D. J. Watts, and C. F. Sabel, Information exchange and the robustness of organizational networks, Proceedings of the National Academy of Sciences 100, 12516 (2003).
- Kirkley et al. [2018] A. Kirkley, H. Barbosa, M. Barthelemy, and G. Ghoshal, From the betweenness centrality in street networks to structural invariants in random planar graphs, Nature Communications 9, 2501 (2018).
- Estrada and Ross [2018] E. Estrada and G. J. Ross, Centralities in simplicial complexes. applications to protein interaction networks, Journal of theoretical biology 438, 46 (2018).
- Zaoli et al. [2021] S. Zaoli, P. Mazzarisi, and F. Lillo, Betweenness centrality for temporal multiplexes, Scientific Reports 11, 4919 (2021).
- Goh et al. [2002] K.-I. Goh, E. Oh, H. Jeong, B. Kahng, and D. Kim, Classification of scale-free networks, Proceedings of the National Academy of Sciences 99, 12583 (2002).
- Goh et al. [2005] K.-I. Goh, J. Noh, B. Kahng, and D. Kim, Load distribution in weighted complex networks, Physical Review E 72, 017102 (2005).
- Girvan and Newman [2002] M. Girvan and M. E. J. Newman, Community structure in social and biological networks, Proceedings of the National Academy of Sciences 99, 7821 (2002).
- Grady et al. [2012] D. Grady, C. Thiemann, and D. Brockmann, Robust classification of salient links in complex networks, Nature Communications 3, 864 (2012).
- Pawson and Nash [2000] T. Pawson and P. Nash, Protein-protein interactions define specificity in signal transduction, Genes & Development 14, 1027 (2000).
- Brandes [2001] U. Brandes, A faster algorithm for betweenness centrality, Journal of mathematical sociology 25, 163 (2001).
- Barabási and Albert [1999] A.-L. Barabási and R. Albert, Emergence of scaling in random networks, Science 286, 509 (1999).
- Lee et al. [2021] Y. Lee, J. Lee, S. Oh, D. Lee, and B. Kahng, Homological percolation transitions in growing simplicial complexes, Chaos: An Interdisciplinary Journal of Nonlinear Science 31, 041102 (2021).
- Watts and Strogatz [1998] D. J. Watts and S. H. Strogatz, Collective dynamics of ‘small-world’ networks, Nature 393, 440 (1998).
- Boccaletti et al. [2006] S. Boccaletti, V. Latora, Y. Moreno, M. Chavez, and D.-U. Hwang, Complex networks: Structure and dynamics, Physics Reports 424, 175 (2006).
- Newman [2001] M. E. J. Newman, The structure of scientific collaboration networks, Proceedings of the National Academy of Sciences 98, 404 (2001).
- Patania et al. [2017] A. Patania, G. Petri, and F. Vaccarino, The shape of collaborations, EPJ Data Science 6, 18 (2017).
- Barabási [2018] A.-L. Barabási, The Formula: The science behind why people succeed or fail (Macmillan, 2018).