A study of an energy-dependent anisotropy of cosmic rays beyond the GZK cut-off with deep neural networks
Abstract
In this letter, we present an update of a method for analysing arrival directions of ultra-high-energy cosmic rays (UHECRs) above the Greisen–Zatsepin–Kuz’min cut-off with a deep convolutional neural network developed originally in Kalashev, Pshirkov, Zotov (2020). Namely, we introduce energy as another variable employed in the analysis. This allows us to take into account the intrinsic uncertainties in energy of primary cosmic rays present in any experiment, which were not taken into account in the previous study, without any loss of quality of the classifier. We present the architecture of the new neural network, results of its application to mock maps of UHECR arrival directions and outline possible directions of a further improvement of the method.
1 Introduction
Origin of the cosmic rays of the highest energies ( EeV, ultra-high-energy cosmic rays, UHECRs) remains one of the biggest mysteries of the high-energy astrophysics. Interaction with the photon backround limits the distance of CR propagation to 100 Mpc at these energies. It is natural to expect that CR sources trace to a certain degree the non-uniform local matter distribution, and thus the distribution of UHECR arrival directions should be anisotropic. An investigation of this anisotropy and its properties is one of the main avenues in the UHECR research as it could strongly constrain the characteristics of their sources.
In this paper, we continue our studies of methods for probing a large-scale anisotropy arising from a presence of a nearby source, which we began in [1, 2] (Papers 1 and 2 in what follows). As a representative of a broader class of models we used a particular model for cosmic rays by Kachelrieß, Kalashev, Ostapchenko and Semikoz (KKOS in what follows) [3]. The model assumes that UHECRs are accelerated by (a subclass of) active galactic nuclei (AGN) with the energy spectra of nuclei following a power-law with a rigidity-dependent cut-off after the acceleration phase. The model successfully reproduces the energy spectrum of cosmic rays with energies beyond eV registered with the Pierre Auger Observatory and the spectrum of high-energy neutrinos registered by IceCube, as well as data on the depth of maximum of air showers and RMS(). One of the consequences of the model is the existence of a nearby (within Mpc) AGN acting as a source of UHECRs. Presence of such an accelerator would inevitably lead to deviations from isotropy at some level.
In Paper 1, we investigated imprints that this deviation would leave on the angular power spectrum (APS) of the UHECR flux depending on the contribution from the strongest individual source. We assumed that the source of UHECRs is one of five close AGNs (Cen A, M82, M87, Fornax A, NGC 253), which are the most probable candidates in our scenario. We demonstrated that an observation of events with energies EeV would be necessary to reject the hypothesis of isotropy with a high level of statistical significance if the fraction of events from any of these sources is 10–15% of the total flux.
In our next paper, we decided to develop another approach to an analysis of anisotropy because the APS calculation mostly destroys information about the characteristic shape and size of a region with events coming from a source, thus somehow decreasing sensitivity to a sought signal. In Paper 2, we exploited full information about arrival directions of UHECRs by using methods of machine learning, namely, a convolutional neural network (CNN) classifier. As arrival directions were distributed across the celestial sphere, the CNNs were trained on a HEALPix grid [4]. This approach considerably increased sensitivity, as now the number of events needed for establishing a large-scale anisotropy produced by UHECRs arriving from a nearby source was times smaller than in the case of the traditional APS analysis. For a fixed sample size, the CNN strongly decreased the fraction of CRs arriving from the source necessary for a robust detection of an anisotropy. It is important to mention that the KKOS model provides a heavy mass composition of UHECRs at energies above 57 EeV thus resulting in much more fuzzy patterns of arrival directions if compared with the case of a light (mostly proton and helium) composition. In this sense, our results were conservative since having more compact patterns will allow obtaining less restrictive demands on the minimal number of from-source events needed to reject the isotropy hypothesis.
However, we only used information about arrival directions of UHECRs while there is another observable, energy. Besides this, we did not take into account the intrinsic uncertainties in the energy of primary cosmic rays arriving to Earth, which made samples used for training and testing the CNNs more accurate than in any experiment. Less energetic particles would be deflected by larger angles generally, populating the periphery of the region filled with CRs arriving from a particular nearby source. It is natural to expect that taking this uncertainty into account would diminish our results making them less relevant for experimental data. This motivated us to to make the next step in the development of a deep-learning-based approach to anisotropy studies of UHECRs by incorporating information about energies and taking into account the above mentioned uncertainty. The preliminary results of this study are presented in the letter.
2 Method
Our analysis employs mock maps of UHECR arrival directions that we generate using the KKOS scenario as the starting point. We considered five nearby active galactic nuclei Centaurus A, M82, NGC 253, M87 and Fornax A as possible sources of UHECRs. In our scenario, all of them share the same injection spectrum and composition. However, these properties evolve during propagation of nuclei from the source to the Milky Way, and we take this into account by using the TransportCR code [5], considering only UHECRs of the energies above 56 EeV. This allowed us to neglect deflections in extragalactic magnetic fields [6] and to assume that UHECRs arrive to the Milky Way within from the source position. Propagation from the Galactic boundary to the Earth was simulated using the CRPropa 3 code [7]. The calculations were performed on the HEALPix grid with . This allowed us to map accurately arrival directions of UHECRs of different rigidities at the Galactic boundary to arrival directions observed at Earth using the method of backpropagation.
A mock map with events was generated as follows. One takes the propagated spectrum at the Galactic boundary calculated with TransportCR for a source located at a given distance from the Galaxy and samples it times, each time extracting some nuclei with an energy and charge . An observed arrival direction of a cosmic ray is found then for each pair (or, equivalently, for each rigidity) using the mapping obtained with CRPropa by backpropagation. The remaining events are generated following the isotropic distribution. The whole process is repeated many times in order to generate a sufficiently large number of maps for each source.
In Paper 1, we analysed these mock maps by calculating the angular power spectrum of CR arrival directions following a method suggested by the IceCube and the Pierre Auger Observatory collaborations [8, 9]. The APS was calculated using maps of the relative intensity of the CR flux obtained from these mock maps. After that, we calculated an estimator that quantified difference between our APS and an APS of the isotropic flux. It was assumed as the null hypothesis that arrival directions of a mixed sample of UHECRs obey an isotropic distribution. We adopted the value of the error of the second kind (the probability not to reject the null hypothesis when it is false) and searched for a minimal fraction of from-source events in the total flux such that the error of the first kind (the probability to reject the true null hypothesis) .
Eventually, the problem of source identification could be reformulated as as pattern recognition task. Nowadays, tasks of this kind are often solved using Convolutional Neural Networks (CNNs), a widely used subclass of feed-forward neural networks [10]. We applied this approach for anisotropy analysis in our Paper 2. CNNs use local feature maps at different scales to extract valuable information and perform a classification task. In the simplest case, it answers a question whether a map belongs to an “isotropic” or “with source” class. CNNs are routinely implemented for many programming languages and platforms, but mostly for flat images only. In cosmic ray physics, one needs to study an “image” on a sphere, so these implementations could not be used straightforwardly. Some implementations of spherical CNNs were proposed recently [11, 12, 13]. We employed the publicly available code developed by Krachmalnicoff and Tomasi [13] with minor additions. This code implements the convolution and pooling (down-sampling) operations on the HEALPix grid data with the help of Keras deep learning library [14]. The convolution operation on the HEALPix grid is parameterized by 9 adjustable weights per feature map. The CNN developed in Paper 2 takes 1 feature map in the HEALPix grid with as an input.111 corresponds to the sphere divided into 12,288 cells with the angular size of , which is of the order of the angular resolution of UHECR experiments.
In the present work, we developed a natural extension of the above approach by increasing the number of feature maps analyzed by the convolutional neural network. We split the energy range of interest to bins of size in scale and calculate expected event density maps for each energy bin before sampling individual events. The from-source event density map calculation procedure is slightly different from the one used in Paper II. As before we take the propagated spectrum calculated with TransportCR for a source located at a given distance from the Galaxy and sample it times, each time extracting some nuclei with an energy and charge . An observed arrival direction of a cosmic ray is then found for each pair using the previously calculated mapping obtained with CRPropa code by backpropagation. Due to the uncertainty in energy determination, each sampled pair contributes to several neighbour energy bins with a weight given by the normal distribution integral taken with the limits defined by the bin boundaries:
where is proportional to the relative energy determination uncertainty:
Maps generated this way are used then to sample from-source events, characterized by HEALPix angular coordinates and energy bin. The remaining events are generated following the isotropic distribution assuming the same model energy spectrum, with the sampling procedure accounting for the energy determination error in the same way. The event sampling process is repeated multiple times as it was done before in order to generate a sufficiently large number of maps for each source. Note that although we impose the lower cut EeV on the observed event energies as in Paper 2, this time we self-consistently account for the influence of the lower energy part of the model on the analysis because of the non-vanishing energy determination uncertainty. This is one of the major advantages of the new approach. We assume the value of % for the energy determination uncertainty , which follows an estimate for the POEMMA mission [15].
The classifier neural network architecture has been modified to take as an input a collection of maps instead of single map. We also had to repeat the model meta-parameter optimization procedure. As before, we tried to adjust the HEALPix grid size along with number of filters and convolutions. Besides this, we found it useful to add two extra dense layers after the sequence of convolutions. The log energy bin size was also one of the free parameters being optimized. Among the three values probed, , and , the smallest one was found to be optimal, which results in 15 energy bins in the range EeV. The classifier neural network architecture which we found optimal is shown in figure 1.
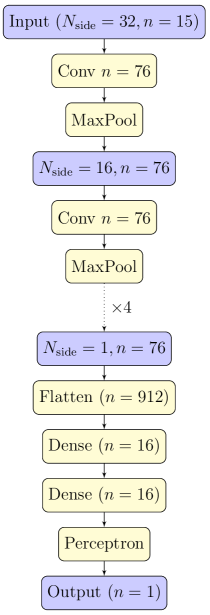
The CNN developed in this work takes 15 feature maps in the HEALPix grid with as an input. 76 feature maps are built at the first step using the convolution operation with free parameters and max-pooling the image to . The sequence of convolutions and max-pooling operations is repeated until reaching with the persistent number of feature maps, which means that each intermediate convolution operation has trainable weights. The rectified linear activation function (ReLU) is used for all intermediate layers. Finally, 76 feature maps with are flattened and processed by a multilayer-layer perceptron with two inner layers of size 16 followed by single neuron output with sigmoid activation.
To avoid overfitting, we used an early-stop technique. Namely, we trained our model for at most 100 epochs with 10,000 map samples per epoch and interrupted training in case accuracy on validation data was not improving for 10 epochs. Each batch of training set was generated randomly which helped to prevent ovefitting. For this reason we did not use any other regularization techniques, such as dropout and the L2 regularization. The validation set consisted of 10,000 samples generated using different random seed. The weights were optimized using the Adadelta adaptive learning rate method [16]. Finally we evaluated our model on the test set consisting of 50,000 map samples. The output of the classifier, a number between 0 and 1 was used as the test statistic.
The minimal fractions of from-source UHECRs needed to reject the null hypothesis of an isotropic flux with the same demands on and as above, are presented in table 1. Results obtained in Paper 2 are included for comparison. It is clearly seen that opposite to the expectations, the results obtained for the binned classifier are essentially the same as for the CNN developed earlier despite of the more fuzzy patterns of arrival directions of UHECRs coming from a particular source.
| Source | Method | 50 | 100 | 200 | 300 | 400 | 500 |
| NGC 253 | BCNN | 12 | 8 | 5 | 4 | 3.25 | 3.2 |
| CNN | 12 | 7 | 4.5 | 3.67 | 3 | 2.6 | |
| Cen A | BCNN | 16 | 10 | 7 | 5.67 | 4.75 | 4.2 |
| CNN | 16 | 11 | 7 | 5.67 | 5 | 4.4 | |
| M 82 | BCNN | 20 | 14 | 8.5 | 6.67 | 5 | 4.4 |
| CNN | 20 | 12 | 7 | 6 | 4.75 | 4.2 | |
| M 87 | BCNN | 22 | 15 | 11.5 | 7 | 6.25 | 5.4 |
| CNN | 22 | 14 | 9 | 8 | 6.25 | 5.2 | |
| Fornax A | BCNN | 16 | 10 | 6 | 5 | 4.5 | 3.8 |
| CNN | 16 | 9 | 6 | 5 | 4.5 | 3.8 |
3 Conclusions
We demonstrated in Paper 2 how one can strongly improve the efficiency of an analysis of arrival directions of UHECRs by introducing a deep convolutional neural network trained on a HEALPix grid. The basic idea was to train a classifier which discriminates samples generated assuming null (isotropy) and alternative (anisotropy) hypotheses and to use the classifier output as a test statistic. An application of models that involve pattern recognition such as the suggested CNN gave a qualitative enhancement in terms of sensitivity to deviations from an isotropic distribution of arrival directions. It was shown in particular that the method allows decreasing the minimal number of events necessary to reject the null hypothesis by times. This reduces technical demands and the required total exposure of an UHECR experiment drastically.
However, the model considered was a simplified one since it did not take into account uncertainties in the energy of detected UHECRs, which influence the spectrum and thus the shape of patterns formed by nuclei arriving from a source. As a result, our estimates could be too optimistic. We addressed the problem in the present work by introducing a binned classifier by modifying the neural network developed in Paper 2. It was demonstrated that even under conditions of a 20% uncertainty in the energy resolution (which is higher than in contemporary ground experiments), the quality of the new classifier did not decrease. More than this, an introduction of energy as a new observable opens a way for an improvement of the efficacy of discriminating samples generated assuming isotropy and anisotropy hypotheses. This will be studied in more details elsewhere.
The source code and supplemental materials for this work, including trained classifier models, can be downloaded from the project web page [17].
Acknowledgments
The research has made use of the NASA/IPAC Extragalactic Database (NED), which is operated by the Jet Propulsion Laboratory, California Institute of Technology, under contract with the National Aeronautics and Space Administration, and of the SIMBAD database, operated at CDS, Strasbourg, France [18]. Some of the results in this paper were obtained using the HEALPix package [4]. The development of the classification method and the architecture of the corresponding deep convolutional neural network is supported by the Russian Science Foundation grant 17-72-20291. The authors acknowledge support of the Interdisciplinary Scientific and Educational School of Lomonosov Moscow State University “Fundamental and Applied Space Research.”
References
- [1] O. Kalashev, M. Pshirkov and M. Zotov, Prospects of detecting a large-scale anisotropy of ultra-high-energy cosmic rays from a nearby source with the K-EUSO orbital telescope, Journal of Cosmology and Astroparticle Physics 2019 (2019) 034.
- [2] O. Kalashev, M. Pshirkov and M. Zotov, Identifying nearby sources of ultra-high-energy cosmic rays with deep learning, JCAP 11 (2020) 005 [1912.00625].
- [3] M. Kachelrieß, O. Kalashev, S. Ostapchenko and D. V. Semikoz, Minimal model for extragalactic cosmic rays and neutrinos, Phys. Rev. D96 (2017) 083006 [1704.06893].
- [4] K. M. Górski, E. Hivon, A. J. Banday, B. D. Wandelt, F. K. Hansen, M. Reinecke et al., HEALPix: A framework for high-resolution discretization and fast analysis of data distributed on the sphere, Astrophys. J. 622 (2005) 759 [astro-ph/0409513].
- [5] O. E. Kalashev and E. Kido, Simulations of ultra high energy cosmic rays propagation, J. Exp. Theor. Phys. 120 (2015) 790 [1406.0735].
- [6] M. S. Pshirkov, P. G. Tinyakov and F. R. Urban, New limits on extragalactic magnetic fields from rotation measures, Phys. Rev. Lett. 116 (2016) 191302 [1504.06546].
- [7] R. Alves Batista, A. Dundovic, M. Erdmann, K.-H. Kampert, D. Kuempel, G. Müller et al., CRPropa 3—a public astrophysical simulation framework for propagating extraterrestrial ultra-high energy particles, Journal of Cosmology and Astroparticle Physics 1605 (2016) 038 [1603.07142].
- [8] J. Hülss and C. Wiebusch, Search for signatures of extra-terrestrial neutrinos with a multipole analysis of the AMANDA-II sky-map, in Proceedings, 30th International Cosmic Ray Conference (ICRC 2007): Merida, Mexico, July 3–11 2007, 2007, 0711.0353.
- [9] Pierre Auger collaboration, Multi-resolution anisotropy studies of ultrahigh-energy cosmic rays detected at the Pierre Auger Observatory, Journal of Cosmology and Astroparticle Physics 1706 (2017) 026 [1611.06812].
- [10] Y. LeCun, B. Boser, J. S. Denker, D. Henderson, R. E. Howard, W. Hubbard et al., Backpropagation applied to handwritten zip code recognition, Neural Computation 1 (1989) 541.
- [11] T. S. Cohen, M. Geiger, J. Koehler and M. Welling, Spherical CNNs, in International Conference on Learning Representations, p. 542, 2018, 1801.10130.
- [12] N. Perraudin, M. Defferrard, T. Kacprzak and R. Sgier, DeepSphere: Efficient spherical convolutional neural network with HEALPix sampling for cosmological applications, Astron. Comput. 27 (2019) 130 [1810.12186].
- [13] N. Krachmalnicoff and M. Tomasi, Convolutional neural networks on the HEALPix sphere: a pixel-based algorithm and its application to CMB data analysis, Astron. Astrophys. 628 (2019) A129 [1902.04083].
- [14] F. Chollet et al., “Keras.” https://keras.io, 2015.
- [15] A. V. Olinto et al., The POEMMA (Probe of Extreme Multi-Messenger Astrophysics) Observatory, 2012.07945.
- [16] M. D. Zeiler, ADADELTA: an adaptive learning rate method, CoRR (2012) [1212.5701].
- [17] O. Kalashev, M. Pshirkov and M. Zotov, “Supplemental materials and source code for this work.” https://github.com/okolo/ml_cr_aniso, 2020.
- [18] M. Wenger, F. Ochsenbein, D. Egret, P. Dubois, F. Bonnarel, S. Borde et al., The SIMBAD astronomical database. The CDS reference database for astronomical objects, Astronomy and Astrophysics Supplement 143 (2000) 9 [astro-ph/0002110].