The essential role of magnetic frustration in the phase diagrams of doped cobaltites
Abstract
Doped perovskite cobaltites (e.g., La1-xSrxCoO3) have been extensively studied for their spin-state physics, electronic inhomogeneity, and insulator-metal transitions. Ferromagnetically-interacting spin-state polarons emerge at low in the phase diagram of these compounds, eventually yielding long-range ferromagnetism. The onset of long-range ferromagnetism () is substantially delayed relative to polaron percolation (), however, generating a troubling inconsistency. Here, Monte-Carlo simulations of a disordered classical spin model are used to establish that previously ignored magnetic frustration is responsible for this effect, enabling faithful reproduction of the magnetic phase diagram.
Introduction and experimental situation.– The insulator-metal transition (IMT) is an important, widely observed phenomenon in condensed matter physics that continues to be intensively studied [1]. While there are various mechanisms by which IMTs occur, in quantum materials, percolation of conductive regions in an insulating matrix, driven by temperature, doping, pressure, etc., is widespread [1, 2, 3, 4, 5]. The microscopic factors inducing such electronic inhomogeneity (across nano- to meso-scales) include structural disorder, multiple competing interactions, and coupled degrees of freedom, resulting in a formidable problem [1, 6, 7].
Doped perovskite cobaltites, with La1-xSrxCoO3 (LSCO) as the archetype, have proven to be paradigmatic for investigation of such percolative IMTs [8, 9, 10, 11, 12]. Experimental studies of LSCO single crystals culminate in the electronic/magnetic phase diagram in Fig. 1, which we have constructed from both published and new data (see Supplemental Material, Sec. S.I 111The Supplemental Material contains details on the construction of the phase diagram in Fig. 1 (Sec. S.I), on the doping evolution of the low temperature specific heat (Sec. S.II)., and on the results of the F Binder cumulant in the theoretical model (Sec. S.III).). At [undoped LaCoO3 (LCO)], the Co3+ () ions adopt an diamagnetic insulating ground state, but with a spin gap of only meV due to comparable crystal field and Hund’s exchange energies, leading to the famous thermally-excited spin-state transition (SST) [9, 10, 11, 12, 14, 15, 16, 17, 18]. Defined as the mid-point of the resulting rise in susceptibility, the SST occurs at K (Fig. 1). It is essentially complete by approximately K, above which antiferromagnetic (AF) Co3+-Co3+ superexchange interactions occur, resulting in the negative Curie-Weiss temperature () [19, 20, 21] shown in Fig. 1.
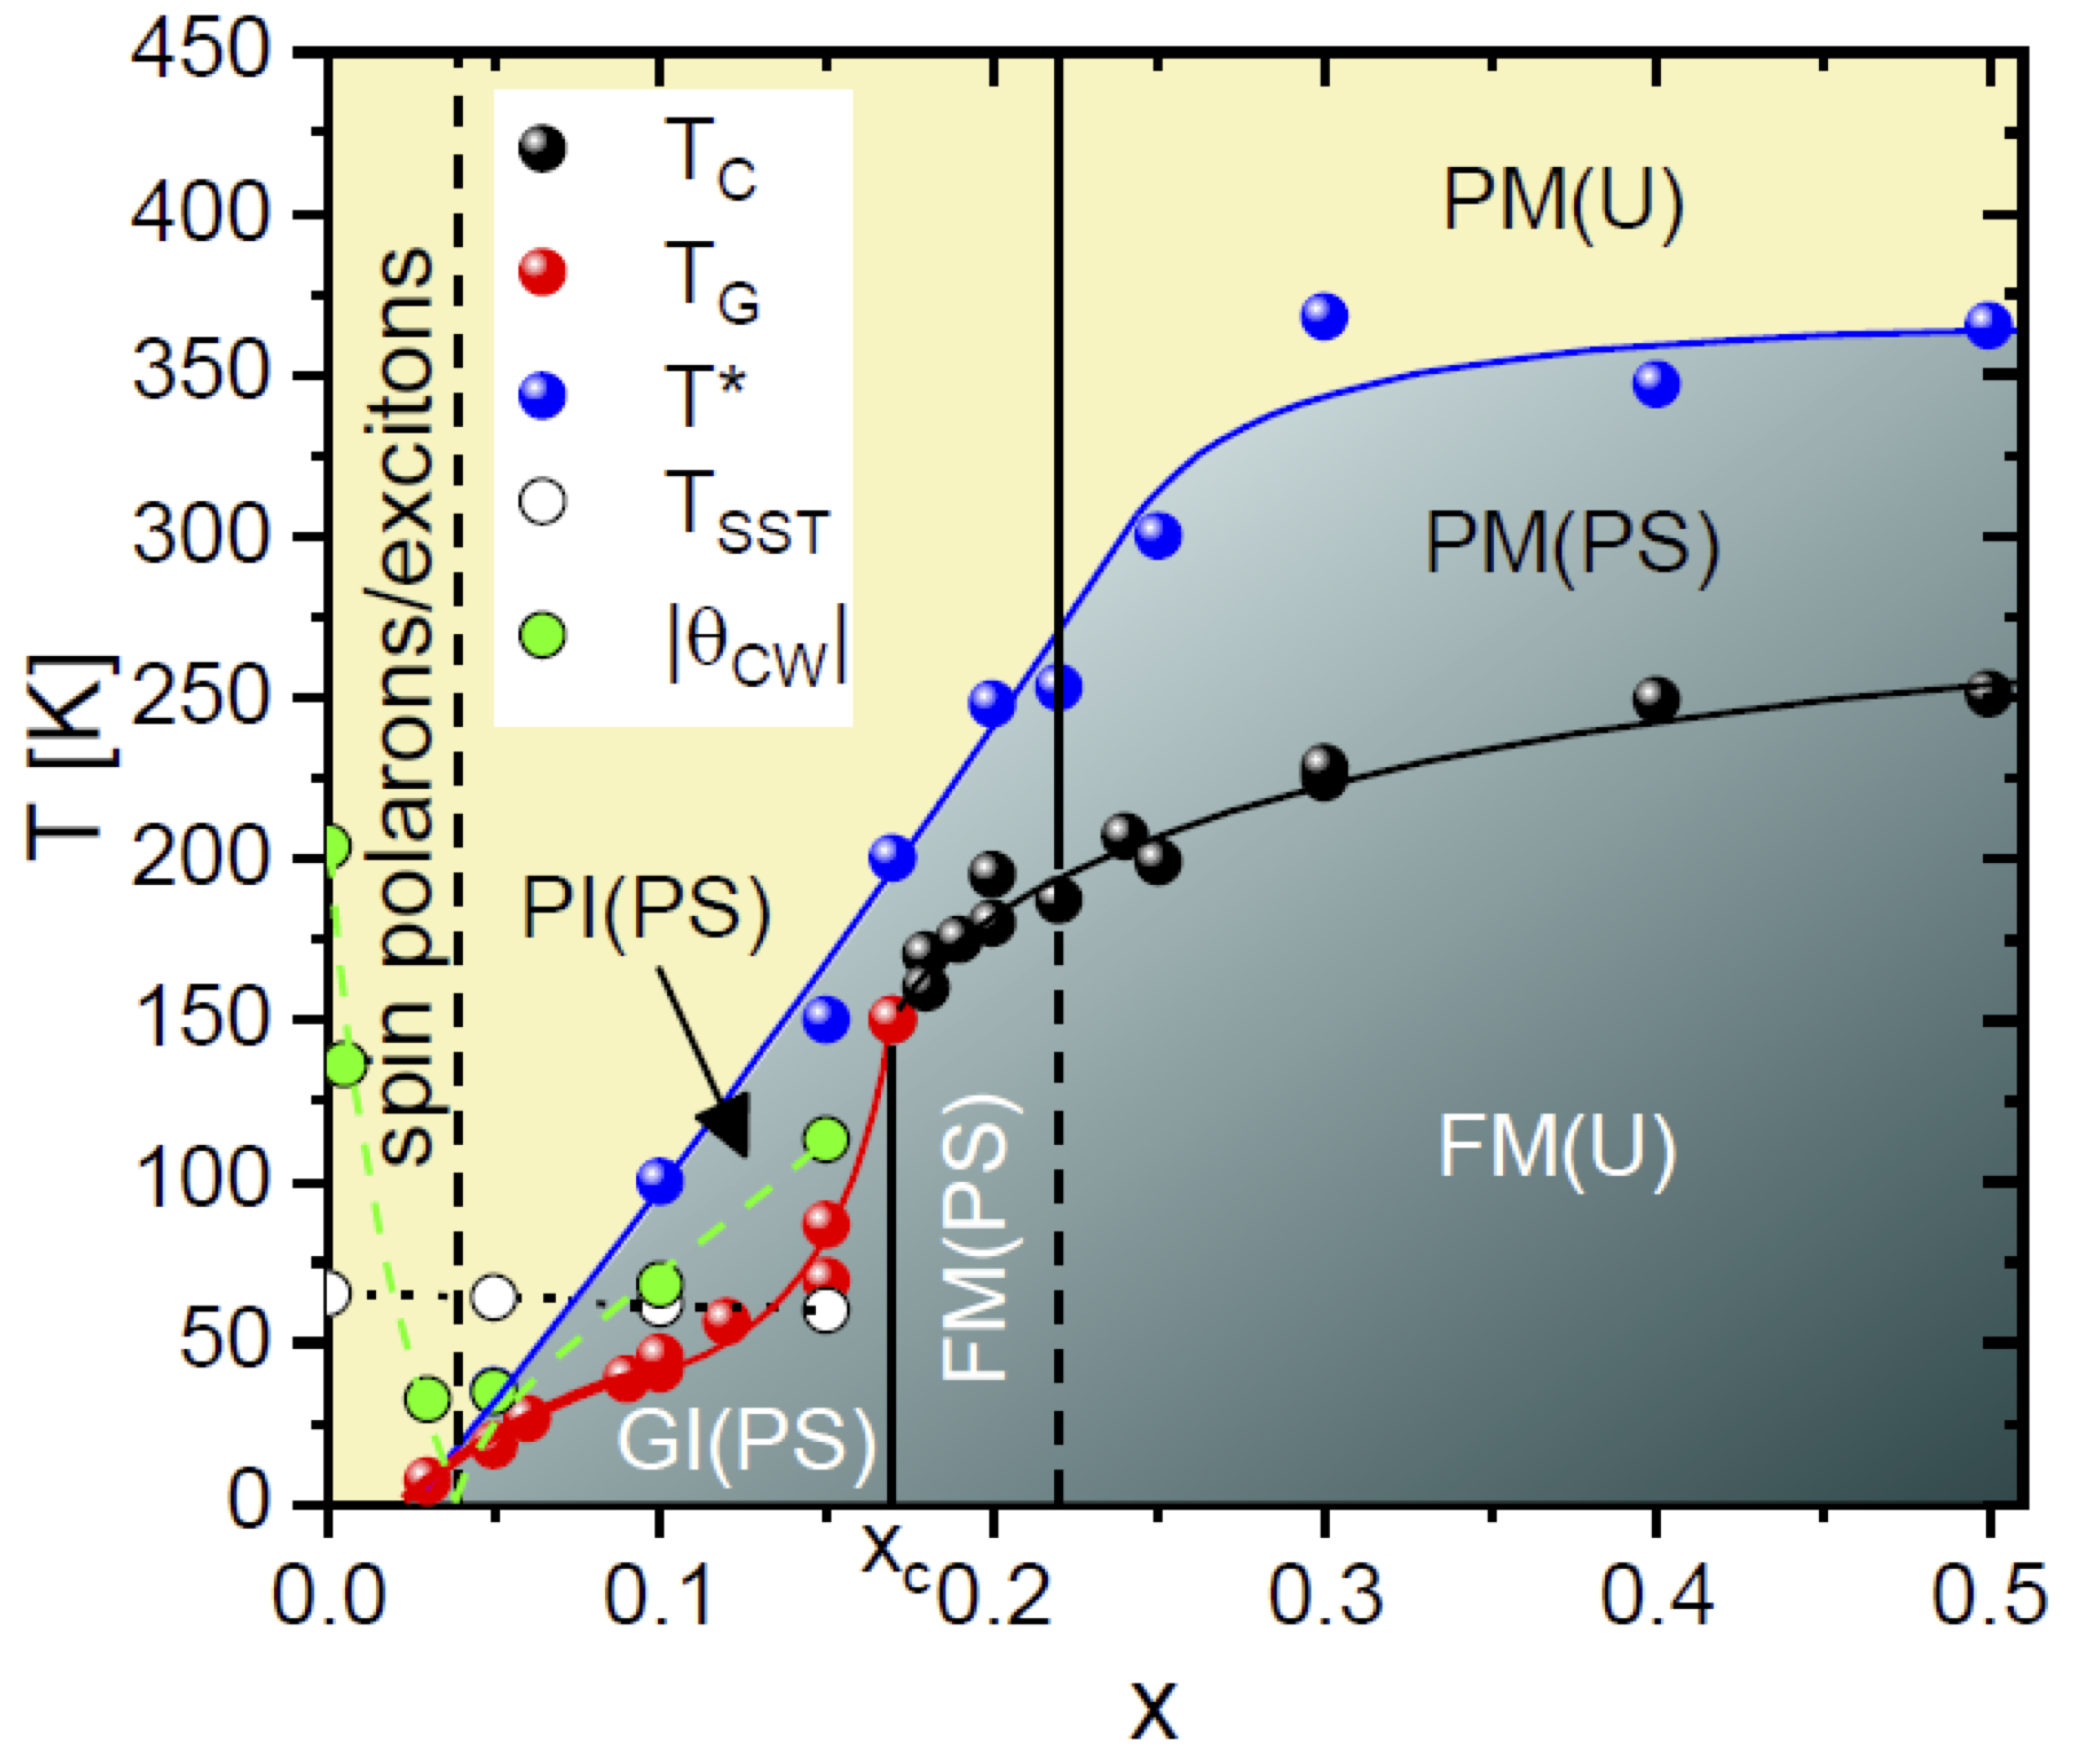
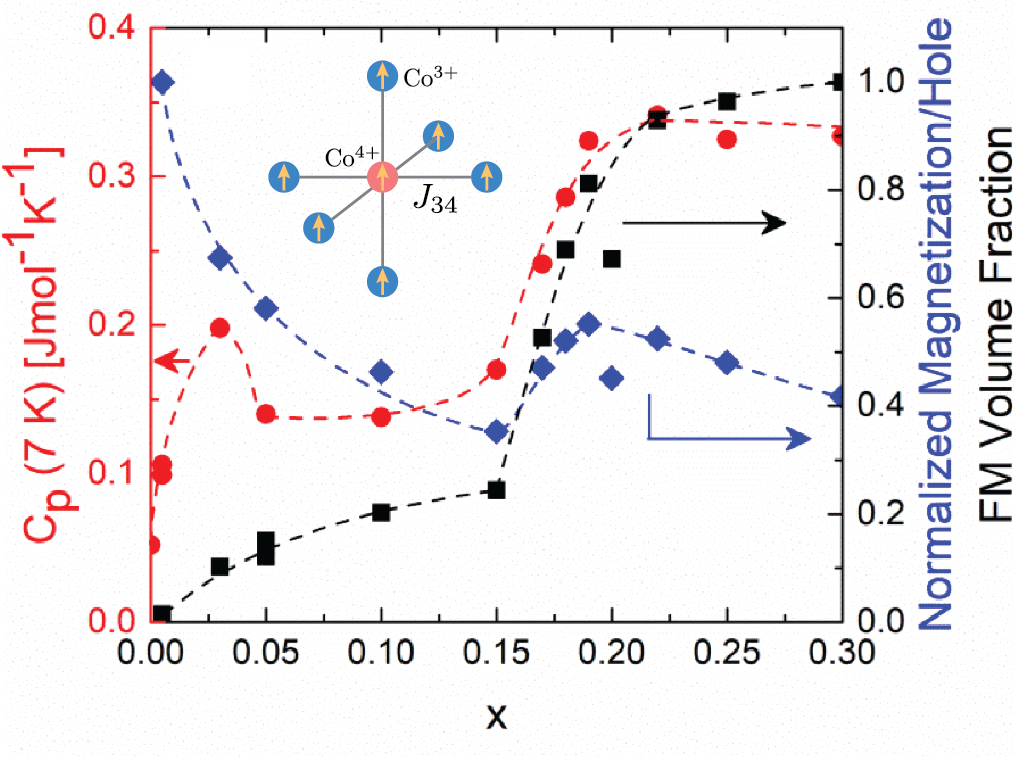
Fascinating behavior emerges upon dilute hole doping (e.g., ), where giant magnetic moments () occur due to seven-site, octahedrally-shaped spin-state polarons (Fig. 2, inset) [27, 28, 21, 29]. In essence, doped Co4+ ions stabilize finite spin states on neighboring Co3+ ions, forming a spin-state polaron with ferromagnetic (F) intra-polaron interactions. As noted previously, and borne out by our own data (Fig. 2, right axis), increasing leads to polaron overlap [27], and thus collapse of the magnetization per hole [21]. As shown in Fig. 1, this is accompanied by a rapid increase in (decrease in ), which inverts from negative to positive [19, 21] at , reflecting dominance of intra-polaron F Co4+-Co3+ interactions over extra-polaron AF Co3+-Co3+ interactions. At this pivotal (vertical dashed line, Fig. 1) multiple experimental probes indicate short-range F order, including small-angle neutron scattering (SANS) [10], inelastic neutron spectroscopy [21], neutron diffraction [12, 30], and specific heat [22, 10]. As shown in the phase diagram, signatures of nanoscale magnetic inhomogeneity then turn on at temperature , followed at a lower by spin/cluster-glass freezing. Most dramatically, a percolation transition then occurs at (solid vertical line, Fig. 1), where a low temperature IMT occurs and long-range F order is detected by neutron diffraction [31, 12], SANS [11, 10], and magnetometry [9, 8]. In Fig. 2 this is reflected in a sharp upturn in magnetization (blue, right axis) and F volume fraction (black, right axis). This percolation transition can also be controlled with voltage in electrolyte-gated LSCO [32, 33]. A final important composition on the phase diagram is at (vertical line, Fig. 1), where multiple probes (e.g., SANS, specific heat, La NMR, magnetotransport [10, 24]) reveal uniform long-range F order, i.e., an end to the low magnetically-phase-separated regime [10]. gradually increases with further doping, reaching K at .
The picture that emerges from the above, i.e., spin-state polarons generating nanoscale F regions that percolate into long-range F order at , has become widely accepted. This masks a troubling inconsistency, however. Specifically, simple statistical arguments indicate that percolation of seven-site polarons into a long-range F network should occur at . This can be understood by dividing the cubic (LSCO is cubic above and mildly rhombohedrally distorted at lower ) site percolation threshold of by 7 (the number of sites in the polaron), yielding . The number of isolated polarons in fact peaks at (see Fig. 3(b), inset), prior to percolation of the polarons at . As discussed in the Supplemental Material, Sec. S.II [13], the low specific heat (e.g., at K, left axis, Fig. 2) supports this, the Schottky specific heat signature of the spin-state polarons peaking at then leveling off at , before rising again at due to electronic contributions to in the F metallic state [10, 22]. Critically, this doping level at which polaron percolation is expected () is substantially lower than the experimentally observed at which percolation to a long-range F metallic state occurs. In this work, we finally resolve this issue, using a model of interacting dilute and disordered magnetic moments that we investigate using large-scale Monte-Carlo simulations. This reveals a vital role for magnetic frustration, a previously ignored factor in the phase diagrams of such materials. We expect this physics to also play a role in the phase behavior of other heavily-studied doped cobaltites, such as La1-xCaxCoO3, La1-xBaxCoO3, Pr1-xCaxCoO3, etc. Moreover, while the spin-state aspect to the polarons is specific to cobaltites, frustration may also play a role in other systems exhibiting magnetic polaron to long-range order transitions, such as manganites.
Theoretical model.– To address the question of what delays the onset of percolation in LSCO, we study an effective disordered classical spin model that captures the essential microscopic physics.
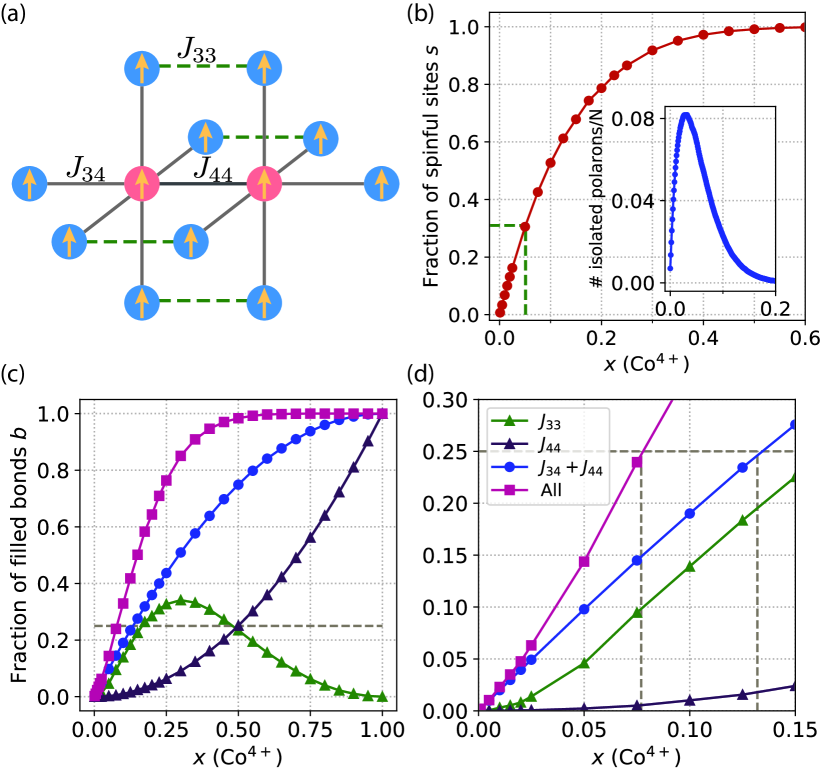
Starting from an empty cubic lattice, we randomly populate a fraction of the sites with Ising spins , corresponding to Co4+ ions. Two neighboring spins interact ferromagnetically with coupling constant , reflecting the fact that the Curie-Weiss temperature is positive for and the fully doped end-member SrCoO3 is F ( K). Note that we consider Ising spins here to account for the easy-axis anisotropy in the material. We then place spins on all empty sites neighboring an spin, which models the emergence of spin-state polarons due to transitions from LS (low-spin) to IS (intermediate-spin) states on the Co3+ sites neighboring a Co4+. The nearest-neighbor interaction between and spins is also F, , leading to the formation of large spin polaronic clusters, consisting of 7 sites for an isolated polaron. In contrast, the interaction between two neighboring spins is AF, . This is consistent with a negative for thermally excited IS Co3+ spins at .
The presence of both F and AF interactions leads to frustration of polarons as shown in Fig. 3(a) for two neighboring polarons. In the F configuration shown, the F bonds and are satisfied, thus frustrating the AF bonds . The fact that the number of spinful sites rapidly grows with the fraction of Co4+ sites is shown in Fig. 3(b). Since an isolated polaron contains sites, the initial slope of the curve is , which levels off once the polarons overlap at larger . The maximal number of isolated polarons occurs at (Fig. 3(b), inset). This marks the onset of frustration, which suppresses the development of F order once a macroscopic site cluster forms at , where reaches the site percolation threshold . Note that we neglect the weak correlation between the occupation probability of spinful sites as they are added as few-site polaronic clusters, which will result in a slightly larger numerical value of . To further elucidate frustration, we investigate the phenomenological model Hamiltonian
| (1) |
Here, correspond to F and to AF interactions and runs over all nearest-neighbor spinful sites of type on the cubic lattice.
Let us first consider the limit , where only F interactions are present. As shown in Fig. 3(c,d), counting only and bonds (blue points), the bond percolation limit at [34, 35] is reached at Co4+ doping level (Fig. 3(d) is a magnified view of Fig. 3(c) to enable this to be seen more clearly). Since all interactions in this limit are F, this implies the emergence of a macroscopic F cluster (consisting solely of F bonds) and the onset of F order at . In contrast, considering and counting all bonds (magenta points), a macroscopic percolating cluster emerges already at . Critically, however, is AF, so the development of F order does not coincide with bond percolation. Instead, spins in the macroscopic cluster will experience frustration due to the random distribution of F and AF bonds, and we expect a spin glass (SG) phase at low temperatures. The degree of frustration is controlled by the ratios and , which also set the endpoint of the SG phase and the emergence of F order at larger , as we show next.
We numerically investigate the model in Eq. (1) using large-scale parallel tempering Monte-Carlo (MC) simulations. We simulate systems of size with and for () disorder realizations for () using a combination of Metropolis and parallel-tempering updating steps. The total number of MC steps is , , for increasing system sizes. We use the first half of these steps for thermalization and measure observables only during the second half of the simulation. Error bars are obtained using the standard jackknife method [36]. We choose the F exchange couplings to be equal , since the F transition temperature of LSCO varies only slightly from to K over the doping range , whereas the bond number ratio varies from two to zero over the same range. Because there are only few bonds for small doping ( for ), our results in this range depend only weakly on . We set , which corresponds to moderate frustration and gives , close to the experimentally observed value in LSCO. A smaller merely shifts closer to , whereas a larger may result in an intermediate AF phase; this is in fact observed in some doped cobaltites, e.g., La1-xBaxCoO3 [37].
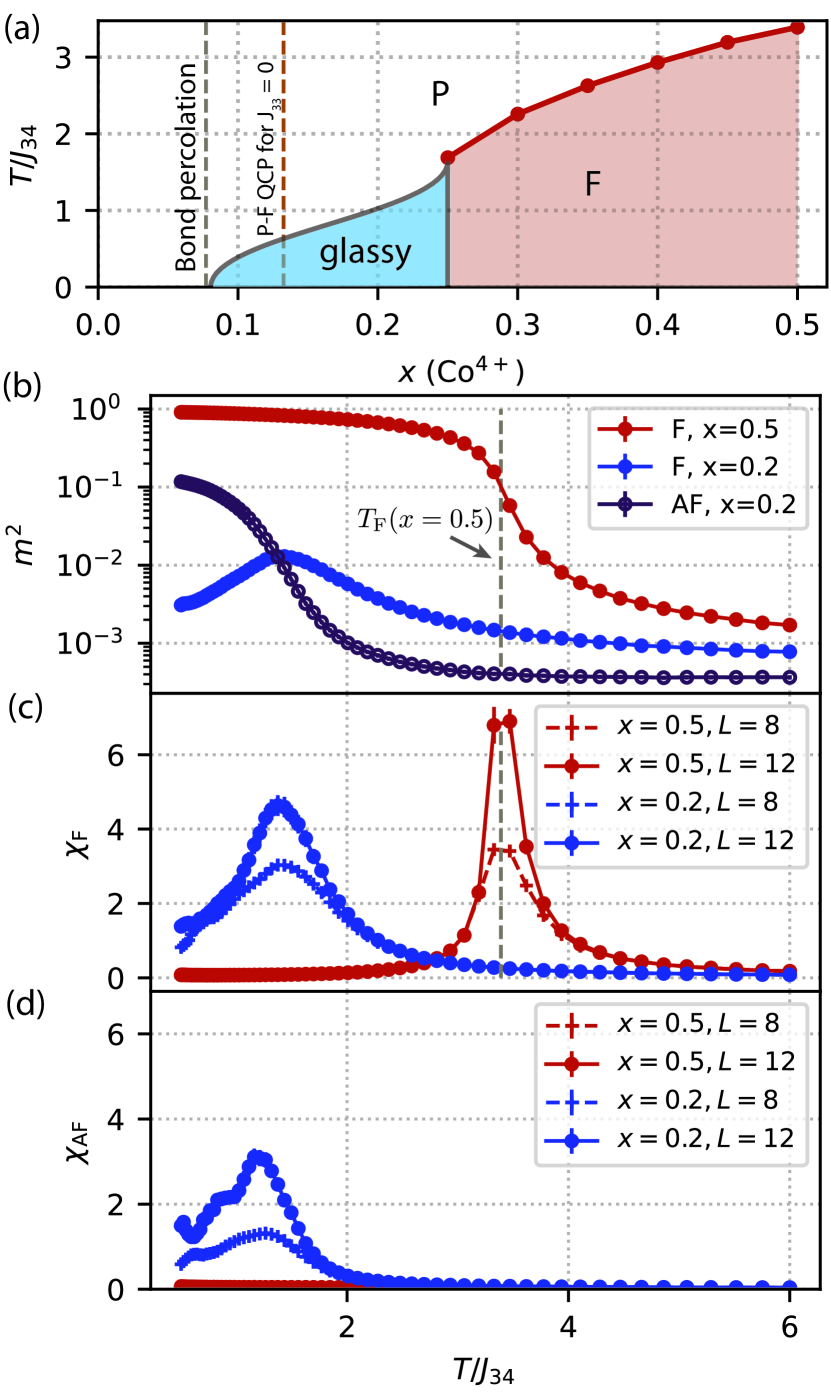
The resulting finite temperature phase diagram as a function of , and for , , is shown in Fig. 4(a); this is plotted over the same range of shown in the phase diagram in Fig. 1. At large , where F bonds dominate, the system enters a F phase at a transition temperature that is slightly smaller than the value of the system due to missing bonds and AF bonds in the macroscopic spin cluster. We obtain from the crossing of the F Binder cumulants [38, 39] for different system sizes (see [13] for details). Here, is the magnetization, is the spin at site , and the brackets () denote thermal (disorder) averages.
decreases as is reduced and for the crossing of the Binder cumulants is absent, implying that true long-range F order ceases to exist. By analogy to the Edwards-Anderson model [40, 41, 42], we expect the system to exhibit a magnetic-glassy multicritical point [43, 44, 45] and develop a low-T spin glass (SG) phase for . We qualitatively verify this scenario by investigating both F and AF observables, as shown in Fig. 4(b-d). At the system behaves like a typical ferromagnet with a peak in the F susceptibility that grows with system size (Fig. 4(c)) and a saturation magnetization that approaches unity as (Fig. 4(b)). In contrast, at , we find competing F and AF fluctuations with broad peaks of comparable size in (Fig. 4(c)) and (Fig. 4(d)), where measures the susceptibility at wavevector . Both F and AF order parameter magnetizations are small (and finite) in such a finite system (Fig. 4(b)). We leave a detailed study of the glassy phase, and other parameter regions in this model, for future work.
We can determine the boundary of the glassy phase on the lower doping side from our bond percolation analysis presented above (Fig. 3(c)), which gave . Since the SG transition temperature must vanish at this point, we obtain the phase diagram shown in Fig. 4(a), which bears a striking resemblance to the experimental phase diagram in Fig. 1. Note that we focus on phase transitions below the line, where finite order parameters develop. This is a strong indication that our model correctly captures the microscopic physics in the low and intermediate doping range in LSCO, and that it is the frustration of polarons due to competing AF and F interactions that underlies the shift of the percolation threshold from the naively expected value to the experimentally observed value . Given the universality of the spin-state physics and spin-state polaron formation in other doped cobaltites, such as La1-xCaxCoO3, La1-xBaxCoO3, Pr1-xCaxCoO3, etc., and their similar qualitative behavior with doping, it is highly likely that this model can be applied far more broadly than to La1-xSrxCoO3.
Conclusion.– In essence, this work reveals that a factor previously ignored in the physics of doped cobaltites - magnetic frustration - plays an inherent role in shaping their electronic/magnetic phase diagrams. Such frustration, which is of broad importance in condensed matter systems, delays the percolation associated with magnetic polarons, playing a vital role in the insulator-metal transition in these systems. This is yet another illustration of the importance of frustration in magnetic materials, in this case coupled to the ubiquitous problem of the insulator-metal transition.
Acknowledgements.
We acknowledge valuable discussions with B. I. Shklovskii and T. Vojta. Experimental work at the University of Minnesota (UMN) was supported by the US Department of Energy through the UMN Center for Quantum Materials under DE-SC-0016371. Work at Argonne National Laboratory (crystal growth and magnetic characterization) was supported by the U.S. Department of Energy, Office of Science, Basic Energy Sciences, Materials Science and Engineering Division. During conception and execution of the theory work, R.M.F. and P.P.O. were supported by the National Science Foundation through the UMN MRSEC under Grant No. DMR-1420013. P.P.O also acknowledges support from start-up funds from Iowa State University during the late stages of the theory work.References
- Imada et al. [1998] M. Imada, A. Fujimori, and Y. Tokura, Rev. Mod. Phys. 70, 1039 (1998).
- Das Sarma et al. [2005] S. Das Sarma, M. P. Lilly, E. H. Hwang, L. N. Pfeiffer, K. W. West, and J. L. Reno, Phys. Rev. Lett. 94, 136401 (2005).
- Meir [1999] Y. Meir, Phys. Rev. Lett. 83, 3506 (1999).
- Zhang et al. [2002] L. Zhang, C. Israel, A. Biswas, R. L. Greene, and A. de Lozanne, Science 298, 805 (2002).
- Ward et al. [2009] T. Z. Ward, J. D. Budai, Z. Gai, J. Z. Tischler, L. Yin, and J. Shen, Nature Physics 5, 885 (2009).
- Dagotto [2005] E. Dagotto, Science 309, 257 (2005).
- Tokura [2003] Y. Tokura, Physics Today 56, 50 (2003).
- Señarís-Rodríguez and Goodenough [1995] M. A. Señarís-Rodríguez and J. B. Goodenough, Journal of Solid State Chemistry 118, 323 (1995).
- Wu and Leighton [2003] J. Wu and C. Leighton, Phys. Rev. B 67, 174408 (2003).
- He et al. [2009a] C. He, S. El-Khatib, J. Wu, J. W. Lynn, H. Zheng, J. F. Mitchell, and C. Leighton, EPL 87, 27006 (2009a).
- Wu et al. [2005] J. Wu, J. W. Lynn, C. J. Glinka, J. Burley, H. Zheng, J. F. Mitchell, and C. Leighton, Phys. Rev. Lett. 94, 037201 (2005).
- Phelan et al. [2006a] D. Phelan, D. Louca, S. Rosenkranz, S.-H. Lee, Y. Qiu, P. J. Chupas, R. Osborn, H. Zheng, J. F. Mitchell, J. R. D. Copley, J. L. Sarrao, and Y. Moritomo, Phys. Rev. Lett. 96, 027201 (2006a).
- Note [1] The Supplemental Material contains details on the construction of the phase diagram in Fig. 1 (Sec. S.I), on the doping evolution of the low temperature specific heat (Sec. S.II)., and on the results of the F Binder cumulant in the theoretical model (Sec. S.III).
- Podlesnyak et al. [2006] A. Podlesnyak, S. Streule, J. Mesot, M. Medarde, E. Pomjakushina, K. Conder, A. Tanaka, M. W. Haverkort, and D. I. Khomskii, Phys. Rev. Lett. 97, 247208 (2006).
- Haverkort et al. [2006] M. W. Haverkort, Z. Hu, J. C. Cezar, T. Burnus, H. Hartmann, M. Reuther, C. Zobel, T. Lorenz, A. Tanaka, N. B. Brookes, H. H. Hsieh, H.-J. Lin, C. T. Chen, and L. H. Tjeng, Phys. Rev. Lett. 97, 176405 (2006).
- Korotin et al. [1996] M. A. Korotin, S. Y. Ezhov, I. V. Solovyev, V. I. Anisimov, D. I. Khomskii, and G. A. Sawatzky, Phys. Rev. B 54, 5309 (1996).
- Noguchi et al. [2002] S. Noguchi, S. Kawamata, K. Okuda, H. Nojiri, and M. Motokawa, Phys. Rev. B 66, 094404 (2002).
- Raccah and Goodenough [1967] P. M. Raccah and J. B. Goodenough, Phys. Rev. 155, 932 (1967).
- Jonker and Van Santen [1953] G. H. Jonker and J. H. Van Santen, Physica 19, 120 (1953).
- Jonker [1966] G. H. Jonker, Journal of Applied Physics 37, 1424 (1966).
- Podlesnyak et al. [2011] A. Podlesnyak, G. Ehlers, M. Frontzek, A. S. Sefat, A. Furrer, T. Strässle, E. Pomjakushina, K. Conder, F. Demmel, and D. I. Khomskii, Phys. Rev. B 83, 134430 (2011).
- He et al. [2009b] C. He, S. Eisenberg, C. Jan, H. Zheng, J. F. Mitchell, and C. Leighton, Phys. Rev. B 80, 214411 (2009b).
- He [2009] C. He, Magneto-Electronic Phase Separation in Doped Cobaltites, Ph.D. thesis, University of Minnesota (2009).
- Smith et al. [2008] R. X. Smith, M. J. R. Hoch, P. L. Kuhns, W. G. Moulton, A. P. Reyes, G. S. Boebinger, J. Mitchell, and C. Leighton, Phys. Rev. B 78, 092201 (2008).
- Smith et al. [2012] R. X. Smith, M. J. R. Hoch, W. G. Moulton, P. L. Kuhns, A. P. Reyes, G. S. Boebinger, H. Zheng, and J. F. Mitchell, Phys. Rev. B 86, 054428 (2012).
- He et al. [2007] C. He, M. A. Torija, J. Wu, J. W. Lynn, H. Zheng, J. F. Mitchell, and C. Leighton, Phys. Rev. B 76, 014401 (2007).
- Yamaguchi et al. [1996] S. Yamaguchi, Y. Okimoto, H. Taniguchi, and Y. Tokura, Phys. Rev. B 53, R2926 (1996).
- Podlesnyak et al. [2008] A. Podlesnyak, M. Russina, A. Furrer, A. Alfonsov, E. Vavilova, V. Kataev, B. Büchner, T. Strässle, E. Pomjakushina, K. Conder, and D. I. Khomskii, Phys. Rev. Lett. 101, 247603 (2008).
- Alfonsov et al. [2009] A. Alfonsov, E. Vavilova, V. Kataev, B. Büchner, A. Podlesnyak, M. Russina, A. Furrer, T. Strässle, E. Pomjakushina, K. Conder, and D. I. Khomskii, J. Phys.: Conf. Ser. 150, 042003 (2009).
- Phelan et al. [2006b] D. Phelan, D. Louca, K. Kamazawa, S.-H. Lee, S. N. Ancona, S. Rosenkranz, Y. Motome, M. F. Hundley, J. F. Mitchell, and Y. Moritomo, Phys. Rev. Lett. 97, 235501 (2006b).
- Sathe et al. [1996] V. G. Sathe, A. V. Pimpale, V. Siruguri, and S. K. Paranjpe, J. Phys.: Condens. Matter 8, 3889 (1996).
- Orth et al. [2017] P. P. Orth, R. M. Fernandes, J. Walter, C. Leighton, and B. I. Shklovskii, Phys. Rev. Lett. 118, 106801 (2017).
- Walter et al. [2018] J. Walter, T. Charlton, H. Ambaye, M. R. Fitzsimmons, P. P. Orth, R. M. Fernandes, and C. Leighton, Phys. Rev. Materials 2, 111406 (2018).
- Stauffer and Aharony [1994] D. Stauffer and A. Aharony, Introduction to Percolation Theory, 2nd ed. (Taylor & Francis, London (UK), 1994).
- Shklovskii and Efros [1984] B. I. Shklovskii and A. L. Efros, Electronic Properties of Doped Semiconductors, Springer Series in Solid-State Sciences, Vol. 45 (Springer, Heidelberg, 1984).
- Miller [1974] R. G. Miller, Biometrika 61, 1 (1974).
- Tong et al. [2011] P. Tong, J. Yu, Q. Huang, K. Yamada, and D. Louca, Phys. Rev. Lett. 106, 156407 (2011).
- Binder [1981] K. Binder, Z. Physik B - Condensed Matter 43, 119 (1981).
- Sandvik [2010] A. W. Sandvik, AIP Conference Proceedings 1297, 135 (2010).
- Edwards and Anderson [1975] S. F. Edwards and P. W. Anderson, J. Phys. F: Met. Phys. 5, 965 (1975).
- Katzgraber et al. [2006] H. G. Katzgraber, M. Körner, and A. P. Young, Phys. Rev. B 73, 224432 (2006).
- Kawashima and Rieger [2005] N. Kawashima and H. Rieger, in Frustrated Spin Systems (WORLD SCIENTIFIC, 2005) pp. 491–596.
- Le Doussal and Harris [1988] P. Le Doussal and A. B. Harris, Phys. Rev. Lett. 61, 625 (1988).
- Hasenbusch et al. [2007] M. Hasenbusch, F. P. Toldin, A. Pelissetto, and E. Vicari, Phys. Rev. B 76, 094402 (2007).
- Hasenbusch et al. [2008] M. Hasenbusch, A. Pelissetto, and E. Vicari, Phys. Rev. B 78, 214205 (2008).
See pages ,1,,2,,3,,4 of SM_LSCO_frustrated_polarons-v1.pdf