Quasistatic kinetic avalanches and self-organized criticality in deviatorically loaded granular media
Abstract
The behavior of granular media under quasi-static loading has recently been shown to attain a stable evolution state corresponding to a manifold in the space of micromechanical variables. This state is characterized by sudden transitions between metastable jammed states, involving the partial micromechanical rearrangement of the granular medium. Using numerical simulations of two-dimensional granular media under quasistatic biaxial compression, we show that the dynamics in the stable evolution state is characterized by scale-free avalanches well before the macromechanical stationary flow regime traditionally linked to a self-organized critical state. This, together with the non-uniqueness and the non-monotony of macroscopic deformation curves, suggests that the statistical avalanche properties and the susceptibilities of the system cannot be reduced to a function of the macromechanical state. The associated scaling exponents are non-universal and depend on the interactions between particles. For stiffer particles (or samples at low confining pressure) we find distributions of avalanche properties compatible with the predictions of mean-field theory. The scaling exponents decrease below the mean-field values for softer interactions between particles. These lower exponents are consistent with observations for amorphous solids at their critical point. We specifically discuss the relationship between microscopic and macroscopic variables, including the relation between the external stress drop and the internal potential energy released during kinetic avalanches.
I Introduction
Mechanical systems with evolving internal structure often exhibit intermittency or avalanche dynamics under quasistatic mechanical driving (see Sethna et al. (2001); Salje and Dahmen (2014); Nicolas et al. (2018) for reviews).
Specifically, intermittent athermal dynamics dominated by slip dislocations are observed in the plastic deformation of single crystals Miguel et al. (2001); Zaiser (2006); Friedman et al. (2012) as well as amorphous materials such as bulk metallic Wang et al. (2009); Antonaglia et al. (2014) and colloidal Schall et al. (2007) glasses, high entropy alloys Hu et al. (2018); Rizzardi et al. (2018),
and granular assemblies Dahmen et al. (2011); Denisov et al. (2016); Berthier et al. (2019a), with their prevalent dynamics being successfully captured through discrete element (DEM) simulations in idealized athermal quasistatic (AQS) conditions considering Lennard-Jones (LJ) particles — simulating molecular dynamics in glassy materials Maloney and Lemaître (2004); Salerno et al. (2012); Salerno and Robbins (2013); Parisi et al. (2017); Zhang et al. (2017); Shang et al. (2020) — as well as soft spheres Lerner and Procaccia (2009); Karmakar et al. (2010) — simulating assemblies of larger spherical aggregates — and elastic interactions — simulating granular matter Gimbert et al. (2013); Pouragha and Wan (2016); Karimi and Barrat (2018).
In granular materials, where potentials are exclusively repulsive, intermittency occurs upon the activation of fragile jammed states Cates et al. (1998); Liu and Nagel (1998), where the system is consolidated in marginally stable solid-like configurations that become unstable under infinitesimal stress variations. Jamming states can only exist within certain conditions Liu and Nagel (1998). Under external mechanical driving, and in absence of thermal fluctuations, jamming is observed to be limited below a macroscopic shear stress threshold, , often referred to as a critical point, which becomes stationary after an initial transient regime Bi et al. (2011). When the system is pushed above , jammed states are unlikely and the excess of free energy (corresponding to the excess of shear stress) is dissipated through particle rearrangements.
Under strain driving, such dissipation reestablishes the mechanical stability at stress values below .
Such a sequence of quasistatic metastable states leads to an elastic/plastic stress-deformation response and the macromechanical state of the system eventually hovers around , which can be considered a case of self-organized criticality (SOC) Bak and Chen (1991); Chen et al. (1991); Zapperi et al. (1995); Watkins et al. (2016) characterized by critical avalanche dynamics exhibiting scale-free behavior.
The hypothesis of SOC in the deformation of amorphous materials inspired the development of the theory of elasto-plasticity, bridging the gap between macromechanical rheology models and SOC (see Nicolas et al. (2018) for an extensive review). Elastoplastic models (EPM), as defined in soft-matter physics Nicolas et al. (2018), represent amorphous materials as lattices of bistable – either elastic or plastic – representative volume elements or sites. Under strain or stress driving, each site experiences an affine elastic deformation. When the local stress at a site overcomes a local threshold, representing a local mechanical instability, the element undergoes a local non-affine plastic-deformation event involving a predefined stress propagator interacting with other elements and triggering an avalanche as a cascading event. Conceptual mean field models interpret the residual stresses to local instabilities as scalars undergoing a stochastic process Hébraud and Lequeux (1998). Within this later category, the simplified and mathematically solvable slip mean field theory (SMFT) Ben-Zion and Rice (1993); Dahmen et al. (2009, 2011); Dahmen (2017), considering all-to-all homogeneous site interactions, provides a remarkably apt conceptual model for a wide spectrum of processes including the macromechanics and the statistical features of externally measured avalanche dynamics in granular media Dahmen et al. (1998); Mehta et al. (2006); Dahmen et al. (2011); Geller et al. (2015); Denisov et al. (2016); Zhang et al. (2017). Such results reinforced the idea of a predominant mean-field universality class in the avalanche statistics Corwin et al. (2005); Dahmen et al. (2011); Geller et al. (2015); Denisov et al. (2016); Zhang et al. (2017); Parisi et al. (2017); Nicolas et al. (2018). In SMFT, SOC appears in the thermodynamic limit as an asymptotic approach to a regime at stress value characterized by a divergence of scales in avalanche statistics. Following scaling relations Dahmen (2017), the macromechanical evolutionary path of strain-driven () amorphous solids leading to the steady-state flow regime is uniquely represented in the SMFT by the stress-strain relation:
| (1) |
Such a generalized macromechanical perspective is by construction insufficient to describe the dynamics and statistics of slip avalanches as a function of state Nicolas et al. (2018). Both experiments and DEM simulations display a non-monotonous evolution towards , implying that the relation does not represent a function of state Karmakar et al. (2010). Furthermore, initial configurations determine the response during such a transient regime and do not converge to through the same evolutionary path (e.g. Fig. 1). A widespread scientific endevour aims to understand the limitations and discrepancies of atomistic DEM, coarse-grained full tensorial Lin et al. (2014); Budrikis et al. (2017); Karimi and Barrat (2018); Korchinski et al. (2021), scalar Chen et al. (1991); Baret et al. (2002); Picard et al. (2005), and mean-field Hébraud and Lequeux (1998); Picard et al. (2005); Agoritsas et al. (2015); Lin and Wyart (2016); Ferrero and Jagla (2019) EPM under the lens of the micromechanics of avalanche dynamics Rodney et al. (2011); Budrikis et al. (2017); Nicolas et al. (2018). Other studies focusing on the internal topology of the granular material suggest that the state of compact granular media is better parameterized by a micromechanical description of the particle configuration and the network of contact forces, which can be only partially represented in terms of its macromechanics. Specifically, the role of internal structures to the mechanics of granular media has been discussed in early conceptual models Cates et al. (1998); Liu and Nagel (1998), experiments Miller et al. (1996); Mueth et al. (1998); Liu et al. (1995); Cates et al. (1998); Howell et al. (1999); Andò et al. (2012); Gendelman et al. (2016); Berthier et al. (2019a, b), DEM Tordesillas (2007); Guo and Zhao (2013); Kuhn (1999); Pouragha and Wan (2017a) and new mechanical-statistical theories of granular matter Edwards and Oakeshott (1989); Blumenfeld and Edwards (2009); Blumenfeld et al. (2012); Bi et al. (2015); Baule et al. (2018); Bililign et al. (2019); Ball (2019); Bi et al. (2011). Indeed, the definition of fragile matter is intrinsically linked to the existence of force-chain structures Cates et al. (1998) and experiments reveal how the nucleation of failure events is directly linked to local topological measurements such as the betweenness centrality Berthier et al. (2019b). Parallel DEM studies identified a stable evolution state (SES) in a space of independent structural variables. The SES is reached after an adaptation transient, reached considerably before the stationary flow regime observed in the macromechanical variables Pouragha and Wan (2016). As an extended micromechanical representation of the jamming transition, the SES describes a subset of micromechanical states upon which the internal structure of granular media starts to evolve leading to stick-slip like events or avalanches. In particular, the same spontaneous shear localization leading to the non-monotonous macromechanical state evolution can degenerate into different evolutionary paths towards the flow regime even under similar intial conditions Masson and Martinez (2001); Desrues and Viggiani (2004); Desrues and Hammad (1989); Pouragha and Wan (2017b), reaching the same topological SES at different values of stress. The parametric study in Pouragha and Wan (2016) shows that once SES is reached, regardless of the initial condition and material parameters, the granular assembly starts to exhibit irreversible deformations that are predominantly governed by micro-avalanches.
Here, we analyze the statistics of kinetic avalanches identified during AQS biaxial compression in DEM simulations of granular assemblies. We interpret the results in the context of different hypothesis regarding the coarse-grained description of amorphous materials. We show how the distribution of avalanche sizes is independent of the macroscopic state of the system once SES is reached, even when the macromechanical paths from different initial conditions (e.g. loose vs. dense assemblies) differ significantly. More importantly, the SES itself exhibits the properties of a self-organized critical state. Thus, while this critical state includes the final steady-state regime at the customary critical stress value , it is reached significantly earlier. Because of that, rather than using the unique term critical point to designate both, we will distinguish between the final steady state regime at and criticality as the statistical mechanics concept refering to a divergence of susceptabilities. We also show that while the statistical avalanche behavior is stationary within SES, each individual avalanche modifies noticeably the state of the system, introducing a characteristic delay, a.k.a. a pseudogap, in the interevent times between consecutives avalanches. This leads to stronger correlations between the states at which avalanches are triggered than between the states at which avalanches stop and suggests that the SES defines an evolving stability limit leading to the steady-state regime at the macroscopic scale rather than a stability basin towards which the system is relaxed after each avalanche. Moreover, we find non-universality in the power-law exponents defining the statistics of the energy transfers involved in avalanches. In this case, we expose a dependence of the exponents on the softness of the interactions between particles. The external stress drop is found to be approximately proportional to the drop of internal elastic energy caused by configurational changes, but, due to the presence of soft lateral walls, this is not the case for the energy dissipated by frictional forces and damping. The relation between internal energy drops and the peaks of kinetic energy are consistent with a specific set of assumptions within the SMFT formulation. This consistency allows us to relate the non-universality of our results with a potential transition between the expectations of SMFT and elasto-plasticity based on the estimated critical exponents.
The manuscript is organized as follows:
In section II we introduce our numerical DEM simulations of granular assemblies, review the definition of SES and explain how the definition of kinetic avalanches is used to implement the quastistic biaxial compression driving. In section III we present the statistical analysis of the avalanche properties, focusing on the average relations between avalanche-size measurements, the existing correlations between events and their full distributions with the corresponding fitted exponents. In section IV we discuss the conditions and properties of avalanche criticality and compare them with the mean-field solution of elastoplastic models. Final conclusions are presented in section V.
II Background and Methods
II.1 Computational Model
The software package PFC2D Inc (2008) has been used here for discrete element (DEM) simulation of 2d granular assemblies under AQS compression. A linear contact model with constant stiffness is considered along normal and tangential directions with their respective stiffnesses, and being the same and equal to . The tangential force is restricted by a Coulomb friction law with for all simulations. A numerical damping of is also considered which acts as a drag-like force on particles by artificially ramping changes in velocities (see Inc (2008) for exact definition). The radii of circles are uniformly distributed over and with , around an average radius of . To avoid overcrowding the figures and for a better readability, the results in this paper are presented in their dimensional forms with SI units. The material and loading parameters adopted for numerical simulations are summarized in Table 1.
| name | num. of particles | confining pressure | driving rate | initial porosity |
|---|---|---|---|---|
| D20kSc5 | 19520 | 2.3 | 0.156 | |
| L20kSc5 | 19353 | 2.3 | 0.190 | |
| D5kSc5 | 6374 | 2.4 | 0.159 | |
| L5kSc5 | 5504 | 2.4 | 0.192 | |
| D2kSc5 | 1593 | 1.3 | 0.165 | |
| D5kSc6 | 6374 | 2.4 | 0.154 | |
| D5kFc5 | 6374 | 7.0 | 0.159 | |
| D5kFc6 | 6374 | 7.0 | 0.154 | |
| D5kFc7 | 6374 | 7.0 | 0.120 |
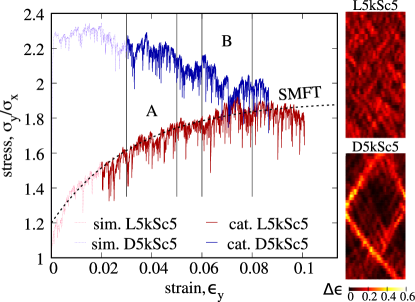
The rectangular sample has an initial aspect ratio of 2-to-1 which is confined in between frictionless walls. During the initial so-called compaction stage, the particles are slowly inflated, as a common numerical technique, to obtain the target isotropic pressure on the walls. During this stage the interparticle friction is artificially modified to achieve the desired initial density. The friction is set to at the end of compaction. Next, the deviatoric load is applied by moving the top and bottom walls towards each other with a straining rate of while the stress on the lateral walls, , is kept constant through a servo-control mechanism. The wall velocity is sufficiently small to keep the inertia number well below the quasi-static limit Da Cruz et al. (2005). Moreover, to ensure a quasi-static loading, the driving is halted during surges in kinetic energy, as is explained in detail later. The typical stress-strain responses and internal displacement maps are exemplified by a pair of initially loose and dense assemblies in Fig. 1. A relatively monotonic and homogeneous average trend is seen for loose assembly (L5kSc5) while the dense assembly (D5kSc5) experiences a peak of stress before dropping to the steady-state regime at larger axial strains. This previous transient regime is linked to the formation of shear localization bands (see right-bottom map in Fig. 1)
II.2 Internal dynamics
At any given instance, the energy of the granular system comprises the following parts: The kinetic energy of particles, , the internal elastic energy stored at contact points, , the dissipation due to frictional and drag forces, , and the external work by vertical and lateral stresses, and , respectively. The balance of energies is given by . For a system of particles, the total instantaneous kinetic energy can be expressed as , where and are the mass and moment of inertia of particle, respectively, and and are translational and angular velocities. Considering that the velocity of the lateral walls is, on average, proportional to the vertical driving rate, a characteristic value for total kinetic energy of a homogeneous sample can be defined as: , where is the sample’s height. We use as a reference parameter to define the energy thresholds for avalanche detection.
The microscopic configuration of contact points creates a heterogeneous landscape of elastic potentials. Even under monotonic driving the system exhibits a non-linear mechanical response involving sharp local accelerations, complex internal velocity fields and global bursts of internal kinetic energy that cannot be simplified in terms of the external measures such as Radjai and Roux (2002). Considering a quastistically slow driving, the system is episodically trapped in a series of metastable jammed configurations well represented by the potential-energy Bonfanti et al. (2019). The external AQS driving pushes the system through local mechanical instabilities that trigger local dynamics in the form of frictional sliding between particles at contact points, or the collective buckling of chained contact forces Cates et al. (1998); Tordesillas (2007); Nicot et al. (2017). These initial instabilities can develop into collective internal avalanches whose propagation is almost independent of the driving speed and is controlled, instead, by particle-scale dissipative forces due to the drag-like forces and inter-particle friction.
II.3 Stable evolution state
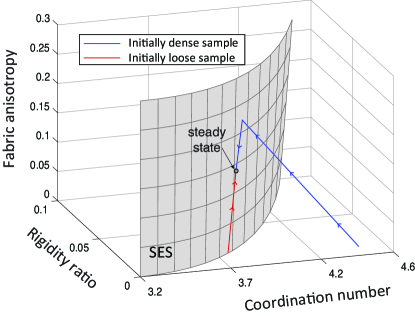
The mechanical evolution of the assembly is determined by a sequence of episodes of quiescent deformation and sudden avalanches involving configurational rearrangements. Recent studies Pouragha and Wan (2016, 2017a, 2017b, 2018a) suggested that mechanically stable configurations are constrained by a stable evolution state surface (SES) defined as a manifold observed in the space of three micromechanical variables: coordination number (average number of contacts per particle), rigidity ratio (average contact deformation relative to the particle size, which scales with ), and fabric anisotropy (a measure for directional distribution of contacts), as represented in Fig. 2. The concept of SES has been proven to be effective in developing new micromechanical constitutive models for granular materials Pouragha and Wan (2018a).
Considering a dense sample, the initial state of the assembly is located on the stable side (right side in Fig. 2) of the SES. As the sample is loaded deviatorically, the microstructure quickly evolves through loss and gain of contacts approaching the SES limit Pouragha and Wan (2017a). Upon reaching the SES, the assembly appears to have just enough constraints to retain metastable static equilibrium Pouragha and Wan (2016); Bonfanti et al. (2019). As such, the additional deviatoric straining introduced by the monotonic driving acts as an initial perturbation pushing the assembly beyond the stability limit and triggering the avalanche as a sudden increase in the internal kinetic energy. Kinematic momentum is known to modulate the jamming transition in shear processes Lemaître and Caroli (2009); LU et al. (2007); Nicot et al. (2012); Gimbert et al. (2013) and alters the stability conditions during the transition. The kinematic momentum caused by avalanches is rapidly dissipated, hence acting as a transient overshooting mechanism Maimon and Schwarz (2004) pushing the system away from the fragile SES towards more stable (non-fragile) configurations under quasistatic conditions, as discussed in more detail later in Section III.4.
The resulting sequence of avalanches involves rearrangements adjusting the number and orientation of contacts bringing gradually the micromechanical state of the granular assembly towards the steady state at , where the deviatoric straining is sustained with no appreciable change in the micromechanical state of the assembly. The evolution within the SES towards the final steady state is not necessarily unique and depends on the original configuration and loading path. This is most clearly observed for the initially loose cases whose initial state falls on SES, see Fig. 2.
II.4 Quasistatic driving and kinetic avalanches

To guarantee a quasitatic condition and in particular, a clean separation between independent avalanches, in our simulations, the driving is halted as soon as an avalanche is detected. Such a detection occurs when the total kinetic energy () exceeds a selected threshold value . A similar strategy was used by Salerno et al. (2012); Salerno and Robbins (2013) for the DEM simulations of amorphous materials. As an example, Fig. 3 shows the assembly magnitudes in a typical simulation (D5kFc6) during the time interval containing 2 avalanches. The jumps in , up to several decades (Fig. 3.a), signals the onset of avalanches triggered by the sudden release of elastic potential energy (Fig. 3.b). Such a release of elastic energy is signified also by the drop in the boundary stress, (Fig. 3.c), while the lateral strain is adjusted to keep constant. The surplus of kinetic energy is dissipated over time by frictional sliding and drag-like forces (Fig. 3.a,b). Since the simulations are athermal, the heat transfer due to dissipation compensates the loss in internal energy. The numerical results exhibit dissipation intervals (grey areas in Fig. 3.a) considerably longer than the duration of the first rebound () of the potential energy release (Fig. 3.c). Once is damped below , the external driving is resumed. The factors defining and from the base have been selected to optimize the resolution and the computational speed. The values of are just above noise fluctuations in all of our simulations, and is low enough to represent a precise measure of the dissipated energy guaranteeing the quasistatic limit.
We obtain an avalanche catalog by labeling individual avalanches with a sorted index and represent them as a marked point process. Instead of the instant in simulation time when the -th avalanche initiates at , we select as our temporal scale, which is stationary during the propagation of the avalanche because of the quasistatic driving. We also record the “size” of each avalanche as measured by different means. In particular, we focus in this study on the duration of the potential energy release , the stress drop , the peak in kinetic energy , the total dissipated energy until the quasi-static driving resumes, , which accounts for the friction at the contact points () and the drag-like forces (), the work against the lateral walls , where is the 2d volume of the assembly whose variation during a given avalanche can be safely neglected. The term kinetic avalanches is used here to specify the avalanche detection method and driving protocol, based on the internal kinetic energy. However, following the observations presented below, we will argue that most avalanche detection protocols based on other physical measures such as external stress, or internal elastic energy drop would render similar results.
In the following sections, we study avalanches occurring within the SES, including avalanches before reaching the steady state (see intervals A in Fig. 1). The behavioural characteristics of all assemblies at SES are argued to be the same Pouragha and Wan (2016). We will verify that avalanche statistics are stationary within the SES regime from the analysis of subcatalogs, such as the intervals A and B represented in Fig. 1.
III Results
III.1 Energy partition and avalanche scaling relations
As illustrated for the interval represented in Fig. 3.b, the energy supplied to the system as external work along the y-axis
()
is mostly dissipated during the avalanche processes () or transferred to the lateral walls (). The difference corresponds to variations in the elastic potential energy . Instead of following a random sequence of drops and loads, self-organizes towards a stationary value — determined by the flow regime in terms of elastoplasticity, or the SES in terms of granular microstructure — and fluctuates around that value through a sequence of loading and avalanche cycles.
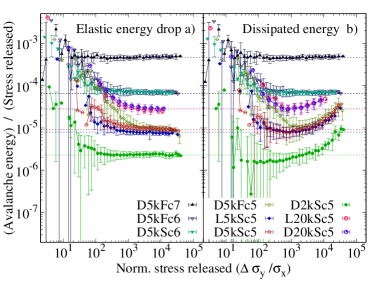
This metastable cascade appears also in the external macromechanics of the assembly, i.e. in the stress drop (). For kinetic avalanches, Fig. 4 tests the linearity between the external and the internal elastic potential drop averaged at windows, (left), as well as the average dissipated energy, (right). Recalling that the lateral stress is kept constant, is considered as the characteristic stress measure and, as such, the normalized stress release () is used for describing the avalanche size. On average, and for sufficiently large avalanches, is approximately proportional to in all simulations. This is different from the behavior of : For most simulations, is not proportional to , though such a proportionality has been observed in other works Salerno et al. (2012). The difference between and reflects the contribution of the lateral walls to the energy balance (), which appears to be more prominent for large avalanches but disappears at high confining pressures. In addition, we observe a scaling factor, matching an apparent relation . This relation is represented as horizontal dashed lines in Fig. 4. This scaling relation is reasonably close to the expectations from a dimensional analysis: Following a linear elastic relation, the change in elastic energy can be written in terms of the wall stresses and the normalized stress released:
| (2) |
where is the system’s volume with being the porosity, and the macroscopic Young’s moduli, and the associated Poisson ratio. The macroscopic Young’s moduli also depends on coordination number () and the total volume, Chang et al. (1995); Pouragha and Wan (2018b). Taking into account that the stress ratio fluctuates in no more than 1/3 of its average value within the catalog (Fig. 1), Eq. 2 can be simplified to give the following scaling:
| (3) |
III.2 Distribution of avalanche sizes
In addition to the scaling relations between different measures of avalanche sizes, the distribution of these sizes close to criticality also satisfy scaling relations of interest for the comparison with other avalanche phenomena and modelling approaches (see section IV).
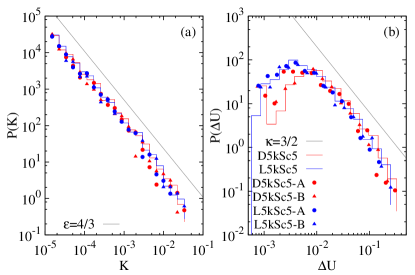
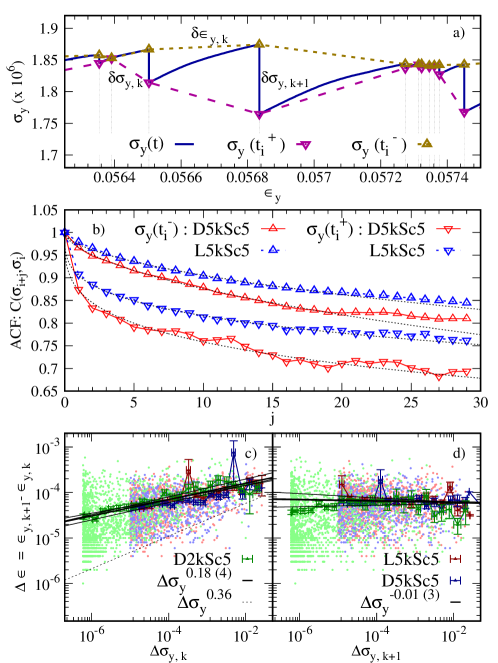
Fig. 5 shows the binned avalanche distributions for and on a log-log scale for a loose and a dense assembly of particles under similar external and internal conditions during different time intervals. In particular, the external stress in the assemblies is considerably different during interval , and evolves towards almost indistinguishable stress values () as both systems approach the steady-state regime (see Fig. 1).
Note that in a macromechanical formulation, the state of the material is different during strain hardening (interval for the loose case), strain softening (interval for the dense case), and close to the steady state (interval ). However, despite such differences in stress state and the softening/hardening rate, no pronounced differences between the distributions are present in Fig. 5. Both distributions of and appear to be compatible with the scale-free hypothesis, i.e., the distributions follow a power law decay, and , to a good approximation over a wide range of scales, although finite size effects and limited statistics might play a role. The collapse of data with different initial densities and stress values further confirms that the state of the material associated with meta-stable avalanches is not sufficiently represented by macromechanical state variables, such as stress ratio and porosity, as commonly used in coarse-grained models. Considering that avalanche statistics can be represented in terms of state variables one needs a higher-dimensional space capable of representing all states with coinciding statistical properties, such as intervals and of dense and loose assemblies, in a unique manifold. In this regard, here we propose the SES as a viable candidate for such representation, since all evaluated intervals fall inside the SES manifold.
To further investigate the collapse of the avalanche data, we focus on the standard scaling ansatz for self-similar behavior:
| (4) |
where is a measure of the avalanche size, is the associated critical exponent, is a universal scaling function and is a characteristic avalanche size. This characteristic should be controlled by the finite system size as well as by other parameters. We attempt the following general ansatz motivated by the usual relations found in finite size scaling of scale-free phenomena Privman (1990)
| (5) |
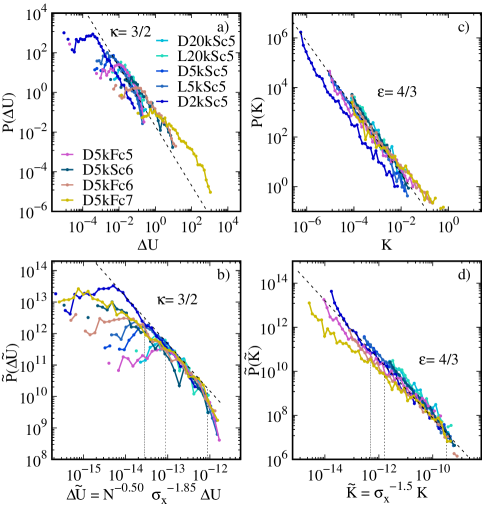
If the scale-free hypothesis is valid, should be universal and all the distributions of obtained with different parameters should collapse when rescaled by the characteristic event size, i.e. the distribution of should be independent of system size and parameters. Fig. 6 shows the distribution of (a,b) and (c,d) without scaling (a,c) and scaled (b,d) according to Eq. 5 using the best exponents found to collapse the exponential cutoffs into a single curve on visual inspection. Note that the y-axes are normalized independently, since the normalization of the distributions are non-trivially affected by the lower cutoffs. We find a reasonable collapse for for potential energy drops and corresponding to a fractal dimension , where corresponds to the dimension of the specific system, which is two for our model. The dependence on is reasonable from the analysis in section III.1, if we assume that the intrinsic measure is also characteristic of the avalanche propagation at a given simulation size Lerner and Procaccia (2009). For the peaks of kinetic energy () we find a good agreement with , and . Therefore, appears to be an intensive quantity. We argue that the instantaneous is probably dominated by a few fast-moving particles at a size-independent characteristic speed. In agreement with the quastatistic hypothesis, we do not observe any apparent relation with the speed of the external driving (), such that , except for a shortening of the scale-free regime. The latter is caused by the lower bound of the power-law behavior controlled by the applied threshold in the definition of the avalanches, which results in a sharp cutoff in which in turn translates into a smoother transition in . The distribution of avalanche durations are presented in the Fig. S1 of the Supplementary Material. Such distributions appear to be compatible with a power-law distribution with exponent . Yet, the power-law range is too short to provide a reliable estimate of the exponent.
| stiffness | events | ||||
|---|---|---|---|---|---|
| D2kSc5 | (stiff limit) | 1684 | 1.62(10) | 1.32(10) | 1.95(5) |
| L5kSc5 | ” ” | 979 | 1.60(7) | 1.34(5) | 1.85(10) |
| D5kSc5 | ” ” | 788 | 1.71(8) | 1.33(6) | 1.83(4) |
| L20kSc5 | ” ” | 130 | 1.77(17) | 1.45(6) | 1.85(15) |
| D20kSc5 | ” ” | 236 | 1.49(11) | 1.36(4) | 1.69(6) |
| D5kFc5 | ” ” | 1215 | 1.46(6) | 1.36(4) | 1.71(5) |
| D5kSc6 | 396 | 1.41(8) | 1.14(11) | 1.65(8) | |
| D5kFc6 | 851 | 1.32(5) | 1.14(6) | 1.71(4) | |
| D5kFc7 | (soft limit) | 633 | 1.08(3) | 1.02(8) | 1.48(7) |
| SMFT(1) | 1.5 | 1.33 | 1.5 | ||
| SMFT(2) | 1.5 | 1.5 | 1 | ||
| 2D EPM | 1.25–1.28 | 1.2 Budrikis et al. (2017) | 1.45Budrikis et al. (2017) |
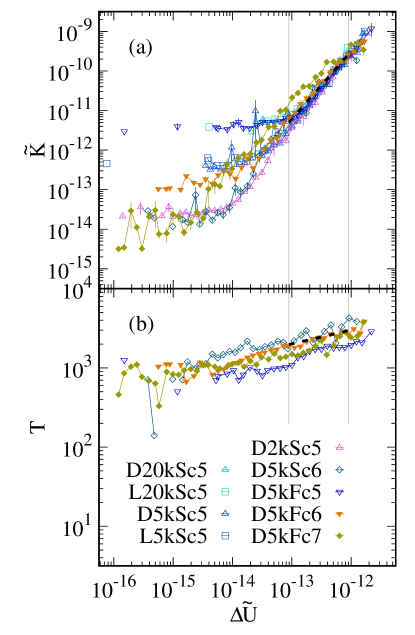
The relation between and of individual avalanches agrees with the scaling relation found in Fig. 6. In particular, Fig. 7 shows the average duration (a) and the rescaled kinetic peaks (b) expressed in bins of . Over a range of a factor 25 in (x-axis in Fig. 7) and 150 in (y-axis in Fig. 7.b), the conditional averages for all simulations collapse and agree with a power-law relation between avalanche energies: with . As a particular case, a clear lower exponent is found at high confining pressures (D5kFc7). In a similar way, we can assess the average relation between and the duration of the avalanche , rendering a power-law relation . Notice that the values of have not been scaled since no clear parameter nor size dependencies have been observed in its distribution.
Visually, the exponent values seem to be in reasonable agreement with the expected values of the slip mean field theory (SMFT), , , represented as dashed lines in Fig. 6 and the , see Section IV for an extended discussion. However, a closer inspection reveals a clear dependency on confining pressure. In order to estimate their actual values we evaluate the avalanche sizes in their rescaled form considering the exponents used in Fig. 6 and the ranges of scale invariance shown as black segments in Fig.7, to mitigate the effect of on .
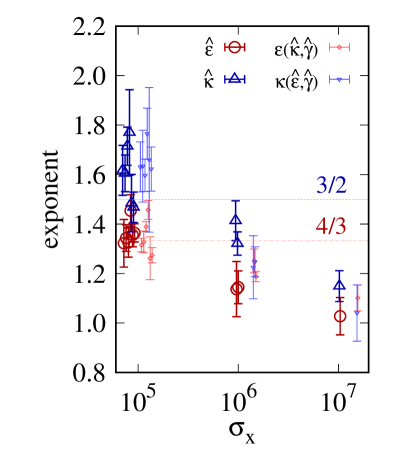
The exponents and characterizing the distributions of and , respectively, have been estimated using the maximum likelihood method following the recipe in (Baró and Vives, 2012) within the intervals and represented in Fig. 7. For simulations at high confining pressures () we increase the fitting ranges to and to take advantage of the extended power-law regime to lower values (see individual distributions and selected estimation ranges in Fig. S4, S5 of the supplementary material). All estimated exponents are summarized in Table 2 and represented in Fig. 8 as a function of the confining pressure . Table 2 includes the least square fit of for each experiment and Fig. 8 represents as well the expected exponents considering the approximated scaling relation , which renders the scaling relation between exponents:
| (6) |
This relation can be deduced from Eq. (4).
The maximum likelihood estimation method reveals that both exponents and decrease with the confining pressure, from and for to and for . The exponent also decreases from , close to the value found by averaging all the conditional average dependencies of Fig. 7, to the value for (golden lines in Fig. 7).
In general, the maximum likelihood method provides a more robust estimation of the exponent than . This is probably a consequence of the extended scale-free regime in , given the lower exponent values and the sharper cutoff at .
The scaling relation captured by Eq. (6) is consistent with the estimated exponents when used to determine and , especially at low confining pressures.
The consistency between the two estimation methods asserts the robustness of the results and the existence of an actual dependence beyond statistical artifacts that could alter the exponent estimation within the fitting intervals.
We notice as well that this agreement survives at high confining pressures, close to the singular undetermined point at . Such values are close to the values reported in DEM simulations with Lennard-Jones (LJ) potentials Shang et al. (2020).
Note that lower scaling exponents () are not expected in the framework of scale invariance since they would imply a divergence of energy released for large system sizes.
However, it is possible that estimated exponents () in finite systems are lower even though the true scaling exponent is . This difference corresponds, in that case, to the form of the scaling function Christensen et al. (2008).
Variations of exponents as function of input parameters or conditions are fairly common in DEM Salerno and Robbins (2013); Karimi and Barrat (2016) and FEM Budrikis et al. (2017) simulations of amorphous materials exhibiting SOC, but they are seldom observed in conceptual models and they are usually linked to the superposition of different subcritical processes Amitrano (2003); Lord-May et al. (2020), the sweeping through criticality Didier Sornette (1994), or rare regions, a.k.a Griffiths phases Vazquez et al. (2011).
III.3 Temporal correlations
Considering the selected AQS driving protocol, the time between avalanches is best defined in terms of the strain component , since is constant during external driving and during the avalanche propagation intervals, i.e., avalanches are instantaneous in terms of . Thus, interevent times are represented as . Correlations between avalanches are often observed in natural mechanical processes. In particular, we are interested in the presence of temporal clustering, linked to triggering phenomena, which is often observed in natural systems Utsu et al. (1995); Weiss and Carmen Miguel (2004); Crane and Sornette (2008); Sornette and Utkin (2009); Baró et al. (2013); Hainzl et al. (2014); Baró et al. (2014); Davidsen et al. (2017); Kumar et al. (2020) but seldom reproduced in conceptual constitutive models unless explicitly introduced Dieterich (1972); Hainzl et al. (1999); Mehta et al. (2006); Zöller et al. (2006); Ben-Zion and Lyakhovsky (2006); Jagla (2014); Zhang and Shcherbakov (2016); Baró and Davidsen (2018). Conversely, conceptual and numerical elastoplastic models identify a power-law relation in the distribution of the local residual-stresses or stability limits close to the steady state, a.k.a. pseudogap (Hébraud and Lequeux, 1998; Picard et al., 2005; Karmakar et al., 2010; Lin et al., 2014; Agoritsas et al., 2015) leading to quasiperiodicity in the strain increments between consecutive avalanches Lin and Wyart (2016). Recent studies revealed that the pseudogap is more prominent for large system sizes Ruscher and Rottler (2020); Ferrero and Jagla (2019); Korchinski et al. (2021), contrasting with the naive expectation of quasiperiodicity being caused solely by finite-size effects. We address this question in section IV.2 through the analysis of presented here.
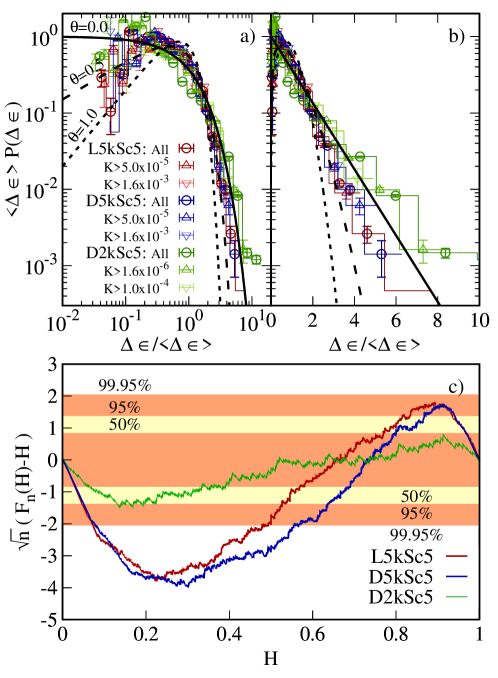
Fig. 9 shows the statistical analysis of the time between avalanches as measured by the axial strain increment for selected samples L5kSc5, D5kSc5, D2kSc5 used here as examples. Each of the lines represent the strain increments between consecutive events with energy above different thresholds values. The distribution of interevent times in linear-log scale (Fig. 9.b) follows an exponential distribution for long interevent times, suggesting that avalanches are independent of one another and follow a Poisson process with a stationary characteristic avalanche rate Touati et al. (2009); Baró et al. (2013); Baró and Davidsen (2017). Similar results have been recently reported by Kuhn et al. (2019) (Kuhn and Daouadji, 2019) for non-spherical particles. In contrast, self-excitations usually involve strong correlations between large events Utsu et al. (1995); Baró et al. (2013) which would be easily identified as an excess of short interevent times. No such an excess is observed in Fig. 9(a). Therefore we can rule out the presence of self-excitations in our simulations. On the contrary, most thresholds values reveal a deficit of short interevent times compared to a homogeneous Poisson process in all simulations. This implies regularity, i.e. the existence of characteristic (quasiperiodic) interevent times, which might be linked to finite size effects or the aforementioned pseudogap.
This deviation from Poisson behavior in the avalanche process can also be verified by the rejection method first proposed in (Bi et al., 1989), so-called Bi test, consisting of the evaluation of the statistical variable , where is the shortest of the intervals preceding or following event (i.e., ) in terms of strain and is the next interevent time in the same temporal direction of (i.e. if and if ). The Kolmogorov-Smirnov test over the values shown in Fig. 9.c displays a rotated ’S’ profile characteristic of regular processes, in opposition to the a rotated ’Z’ profile, which is associated with clustering or self-excitation mechanisms Baró et al. (2014). The ’S’ profile is clear in all simulations (see Fig. S3 in the supplementary material). The Poisson hypothesis is rejected at 95% confidence interval in all simulations and at 99.95% in most of them, including D5kSc5 and L5kSc5. In the case of D2kSc5 the distribution falls short to reject the Poisson hypothesis at the 99.95% confidence interval. This discrepancy is in line with the better agreement with a Poisson process observed for the distribution of waiting times of D2kSc5 (Fig. 9). We verified numerically that the deficit of short interevent times is more pronounced in larger simulations. In particular, the fraction of rescaled interevent times below the expected first quartile of a normalized exponential distribution is for particles, for particles and for particles with respect to the expected if the process were Poisson (see Fig. S6 in the supplementary material). Unfortunately, since the threshold selection to define avalanches is size dependent, we cannot straightforwardly infer the relation which is expected to go as Lerner and Procaccia (2009).
III.4 Stress correlations
Fig. 1 shows that the macromechanical state of the system is constrained within an evolving narrow stripe following a well-defined path at the large scale. However, the commonly used smooth average stress-strain relation is clearly a broad approximation. At the scale displayed in Fig. 3 the intrinsic metastable dynamics arising from the competition between the slow driving and the fast relaxation in the form of avalanches exhibits its non-smooth behaviour. As an example, Fig. 10.a shows a close-up to the macromechanics of one of the simulations. We mark the stress () at the onset of the avalanche () and at the end of the avalanche (). Fig. 10.a also shows an example of interevent loading time , preceded by an avalanche with stress drop and followed by an avalanche with stress drop . The regularity in the distribution of interevent times exposed in Fig. 9 could be a consequence of a characteristic release or reloading of stress correlated to the interevent times, similar to predictions of the elastic rebound theory Reid (1910) and related earthquake models Zöller et al. (2006). Fig. 10.b shows the autocorrelation function (ACF) of the sequences of and , respectively, for a pair of loose and dense assemblies with similar simulation parameters. Since the macromechanics of the system are relatively smooth at the long range, as shown in Fig. 1, both autocorrelations persist for long times and remain at significant positive values over the shown range. In particular, correlations decay to a good approximation as a stretched exponential for with for and a faster for . Therefore, values are significantly more persistent than , suggesting that the state triggering the avalanches is more regular than the state arresting it. This hypothesis is confirmed by a comparison between the scatter plots of and as a function of (Fig. 10.c and d). The duration of an interevent loading time does not affect the size of the next avalanche (Fig. 10.d). Instead, the size of an avalanche correlates with the next interevent loading time (Fig. 10.c). Specifically, after an event with stress drop , the system needs to load a characteristic minimum amount of strain to trigger the next avalanche. This so called time-predictability Shimazaki and Nakata (1980) is consistent with the lack of short interevent times (Fig. 9.a). In terms of the SES representation, and at least for the testing procedure adopted in this study, the upper values of stress, i.e. , represent a better candidate for an objective reference state, and can be associated with SES. The fact that the interevent times are correlated with their preceding events implies that typically the avalanches can be considered as excursions bringing the system away from the critical SES limit towards more stable configurations. The following loading has then a tendency to return the system to the SES.
We have shown that both distributions of avalanche sizes and interevent times are stationary once the SES is reached. On the other hand, the effective macroscopic Young’s moduli within the SES is non-stationary and evolves towards the steady state in non-unique evolutionary paths (Fig. 1). This implies that a time dependence exists in the average stress reloading amount between consecutive avalanches () or the avalanche rates (), even within the SES. To verify this hypothesis we evaluate such average reloading sizes in addition to the the effective elastic modulus () and average avalanche sizes () in relatively broad intervals of strain, i.e. driving, of containing around 70-100 avalanches each. We build a catalog considering all strain intervals in L5kSc5 and D5kSc5 within SES together, since the input parameters are similar and include a large variability in , mostly positive in L5kSc5 and mostly negative in D5kSc5 (see Fig. 1). We report the following Pearson correlation coefficients with respect to :
| (7) |
the latter being effectively null. Therefore, we argue that the effective macroscopic Young’s modulus is determined by the rate of avalanches and the reloading between avalanches in a way that low rates and high stress reloading correlates with positive effective moduli, while the characteristic size of avalanches is effectively constant, as already argued in section III.2. Some of the issues pertaining to time averaging such meta-stable quasistatic behaviours are discussed in Combe and Roux (2000).
IV Discussion
Non-linear mechanics and avalanches in amorphous solids are often studied under the lens of AQS shear driving. Both atomistic and coarse-grained simulations usually consider overdamped systems of soft particles, usually modeled with attractive LJ potentials in DEM models, returning short-range or far-field homogeneous stress transfer functions in a coarse-grained representation, either isotropic when considering interactions along the maximum shear plane Ben-Zion and Rice (1993); Dahmen et al. (2011), or polar Eshelby inclusions, when considering off-plane interactions Hébraud and Lequeux (1998); Picard et al. (2004); Albaret et al. (2016). The DEM simulations of compact granular assemblies presented here differ from some of the previous considerations. Most notably, the system is driven by biaxial compression, instead of shear, particles have inertia and the stress distribution is channeled in complex force-chain networks resulting in highly disordered long-range interactions.
IV.1 Biaxial compression
Biaxial and triaxial compression experiments Lockner (1993); Baró et al. (2013); Lennartz-Sassinek et al. (2014); Davidsen et al. (2017); Baró et al. (2018), and numerical simulations Amitrano (2003); Kun et al. (2014) such as the ones presented in this work, serve as analogues for geomechanical processes. Mechanics at the mesoscale are dominated by internal shear processes introduced by residual deviatoric stresses at contact points. The correspondence with macroscopic shear is especially clear when activity is localized in a shear band Lennartz-Sassinek et al. (2014); Kwiatek et al. (2014); Davidsen et al. (2017) (see deformation of D5kSc5 in Fig. 1) but not so much when deformation is homogeneously distributed within the sample (L5kSc5 in Fig. 1). Avalanche statistics shown in previous sections appear to be independent of internal details once the system reaches SES, whether system exhibits softening behaviour associated with localized failure (e.g. in the case of D5kSc5), or monotonic hardening leading to diffuse failure (e.g. in the case of L5kSc5). This suggests that the similarities in avalanche statistics is linked to particle scale mechanisms, such as frictionally arrested stick-slip events and force-chain buckling, rather than the coarse-grained elasto-plastic macromechanics Tordesillas et al. (2009). On the other hand, the introduction of soft, instead of fixed, lateral walls affects the energy partition of the system dynamics in general (Fig. 3) and the avalanche energy budget in particular. For purely strain-controlled loading programmes, such as in constant-volume tests, an average proportionality is reported between and Salerno et al. (2012); Salerno and Robbins (2013). In our study presented here, the equivalence between and , and thus, the proportionality between the stress drop and the energies, does not stand, because of the free production of lateral work . Specifically, Fig. 4 shows that such a proportionality is maintained in and, therefore, lost for in general. Recalling the different scaling exponents in and , the equivalence is asymptotically recovered at high confining pressures, given .
IV.2 Effect of inertia and the pseudogap
Recent experiments in granular aggregates reported interevent time distributions consistent with triggering Kumar et al. (2020). Inertia is known to affect statistics of both avalanche sizes and temporal correlations and could potentially constitute a mechanism of triggering explaining such observation.
The relatively slow dissipation of the kinetic energy with respect to the stress drops we observe (see Fig. 3) might trigger secondary avalanches in the form of new spikes in and . Similar phenomena have been reported in the signal profiles of acoustic emission events during the uniaxial compression of concrete samples Vu and Weiss (2020), We do observe, in rare occasions, a double peak in the kinetic energy within the same avalanche profile (not shown). Nevertheless, given the selected AQS driving protocol and low values of , we can be certain that such double peaks are absorbed in a single avalanche event, recovering a practical independence between avalanches under the definition suggested in Ref. Janićević et al. (2016). No evidence of self-excitation is found in either the Poisson-rejection test (Figs. 9.c) or the distribution of interevent times shown in Fig. 9.b, which exhibits an exponential decay.
On the contrary, we report a deficit of short interevent times linked to regularity in the macromechanical state of the system at the onset of an avalanche (Fig. 10). This indicates that the process has a certain time-predictability Shimazaki and Nakata (1980), well identified as a characteristic minimum recharging strain as represented in Fig. 10.c.
This regularity of interevent times is predicted by finite size effects as considered in some earthquake hazard assessment frameworks Salditch et al. (2020). In small systems, all avalanches dissipate macroscopic fractions of elastic energy, causing longer reloading times after large avalanches. This effect disapears in the thermodynamic limit, where all subcritical and critical avalanches are massless. Alternatively, a similar quasiperiodic behavior is predicted in elastoplasticity by the presence of a so-called ’pseudogap’ in the density of residual-stresses, i.e. the local stress differences to failure through different mechanisms, usually represented on a coarse-grained scale Hébraud and Lequeux (1998); Picard et al. (2004); Karmakar et al. (2010); Lin et al. (2014); Lin and Wyart (2016); Ferrero and Jagla (2019). Rather than a gap i.e., absence of small residual stresses (), the pseudogap is characterized by a power-law decay in the density of low values attributed to the non-monotonous evolution of residual-stresses towards the stability limit which corresponds to an absorbing boundary in a stochastic process representations Lin and Wyart (2016):
| (8) |
The pseudogap introduces a characteristic delay in the interevent times between consecutive avalanches, defined here as the strain needed to activate the lowest value in Eq. (8), and rendering the Weibull renewal behavior Karmakar et al. (2010):
| (9) |
Such a behavior is shown in Fig. 9(a,b) as the black lines.
Recent studies in DEM Ruscher and Rottler (2020), FEM Korchinski et al. (2021) and conceptual Ferrero and Jagla (2019) models identified an additional system-size dependent plateau overlapping with the pseudogap, which vanishes in the thermodynamic limit. According to these results, quasi-periodicity would be more prominent in large systems while interevent times in small systems would be better described by a Poisson process. This system-size dependence, opposite to the expectations from finite size effects, qualitatively agrees with our results presented in Fig. 9 and is numerically verified in the supplementary material (Fig. S3, S6). However, the analysis presented in Fig. 9 is insufficient to determine the system-size dependency of the plateau or the exponent defining the pseudogap following the analysis presented in Lin et al. (2014). Instead one can use hyperscaling relations to address the latter as we discuss in section IV.5. Yet, Fig. 9 shows that the distribution of short interevent times are close to the expectations of the Weibull renewal model with an exponent between 0.5 and 1, with a generally higher exponent, suggesting a more prominent pseudogap in the large samples (Fig. 9.a). At the region of long interevent times, the distributions are better reproduced by the Poisson hypothesis instead (Fig. 9.b). This might indicate a change in the distribution of , marking the end of the power-law regime described by Eq. (8).
Finally, inertial effects were found to affect the critical exponents determinining bulk avalanche statistics in DEM simulations of LJ particles Salerno et al. (2012); Salerno and Robbins (2013); Karimi and Barrat (2016); Karimi et al. (2017).
This feature could as well be related to the observation that the states triggering avalanches, herein considered to be constrained to a SES manifold, are more regular than the arrested states (see section III.4).
The kinetic energy introduced by ‘fast’ external driving is known to affect mechanical equilibrium Anthony and Marone (2005); Lemaître and Caroli (2009); LU et al. (2007); Nicot et al. (2012).
We propose that the SES represents a collection of metastable configurational limits to the mechanical equilibrium that are marginally reachable under quasistatic conditions Bonfanti et al. (2019).
When an avalanche is initiated at SES, the excess kinetic energy prevents the relaxation of the system at a fragile state, e.g. the same configurational state at the onset of the avalanche. The configurational state arresting the avalanche, which is reached at , needs to be stable while the system still retains a relatively high amount of kinetic energy (see Fig. 3). Since the excess of kinetic energy is dampened below before resuming the driving, we believe that the particle inertia during the avalanche has to affect the distribution of residual stresses, and the properties of the pseudogap.
This idea of stability overshooting was conceptually captured in a deppining model with transient effects predicting a system-size dependence on the time-predictability of transitions Maimon and Schwarz (2004) qualitatively similar to the one observed in the pseudogap, verified at the stiff particles limit in our simulations. A similar effect is reproduced by the addition of dynamic weakening in some EPM, and the SMFT in particular Dahmen et al. (2009). However, the effect on avalanche sizes is far from being trivial. Numerical studies with LJ particles found non-monotonous relations between critical exponents and inertia, and regimes with characteristic and time-predictable avalanches Salerno and Robbins (2013), being the latter predicted in SMFT as well Dahmen et al. (2009).
IV.3 Stiff granular particles
Apart from particle inertia, most coarse-grained EPM also overlook the non-linearity of the internal stress fields Liu et al. (1995); Mueth et al. (1998); Howell et al. (1999).
The hypothesis of the uniformity in the stress propagation enabling the coarse-graining in elastoplastic models is known to fail in the presence of stiff particles Nicolas et al. (2018).
As mentioned, stress distribution in granular media is governed by the structural topology of contact points, generating complex force-chain networks, highly susceptible to small variations of stress. A cross-over between fragile and amorphous materials has long been suggested to exist as a function of softness or deformability Cates et al. (1998), even in the absence of attractive particle potential Liu and Nagel (1998); Lerner and Procaccia (2009). The variation in the power-law exponents in Fig. 8 is in agreement with such a transition (see section IV.5 for a more detailed discussion).
Recent studies have suggested the introduction of internal structural variables such as compativity Edwards and Oakeshott (1989); Frenkel et al. (2008); Blumenfeld et al. (2012), angoricity Henkes et al. (2007); Blumenfeld and Edwards (2009); Bi et al. (2015); Baule et al. (2018), or the more recent concept of keramicity Bililign et al. (2019); Ball (2019); Baule et al. (2018) complementing the stress-strain formulation traditionally considered in EPM. Based on our results, we propose the SES concept as an alternative micromechanical representation of the state of granular materials determined by the structure of internal contact network rather than the macromechanics Pouragha and Wan (2018a).
IV.4 Interpretation of avalanche sizes in terms of elastoplasticity
The EPM formulation separates plastic avalanche events from the elastic deformation caused by the AQS driving. Although the separation of temporal scales is not as straightforward in DEM simulations, one can still find a correspondence between the variables defining avalanches in the different modeling approaches. In this sense, we are interested in the conceptual picture provided by the SMFT, which is arguably the simplest EPM framework to characterize avalanche statistics, and has shown good agreement with the statistics of avalanches in granular assemblies sharing in particular the same universal critical exponents Dahmen et al. (2011); Denisov et al. (2016); Geller et al. (2015).
In the SMFT, the avalanches are measured in terms of a global signal ( in short intervals) which accounts for the collective velocity of displacement of the constituting elements (a.k.a. cells) of the model, and is proportional to the rate of external stress drop under strain driving. Henceforth, the size of an avalanche of duration starting at time is a measure proportional to stress drop. Similarly, is proportional to the total kinetic energy dissipated, and is proportional to the maximum peak of the instantaneous kinetic energy within the avalanche. In order to compare DEM results with the expectations from elastoplasticity, we first need to establish reliable links between the avalanche sizes defined within the conceptual framework proposed in the SMFT and the measures defining avalanche sizes in DEM.
Considering EPM formulations, it is natural to assume an approximate proportionality between elastic energy and small deformations. Given its mean-field nature, the SMFT assumes an exact proportionlity () during avalanches, and predicts an approximate proportionality with the elastic energy release. This is consistent with the observed proportionality between internal elastic energy and illustrated in Fig. 4. We adopt the strain drop as the avalanche size following the convention in Refs. Salerno et al. (2012); Salerno and Robbins (2013). Moreover, to remain consistent with SMFT, the avalanche duration has been defined in this work to be the time interval of the potential energy release, which is virtually indistinguishable from the time interval of the stress drop.
Although represents the peak in our simulations and, hence, it is reminiscent of ,
the dissipation process is significantly slower compared to the rise of kinetic energy. In contrast, SMFT considers a strict overdamped limit where all inertial effects are instantly dissipated. Therefore, we argue that the pick of kinetic energy reached during the initial avalanche growth corresponds to the collective cumulative energy in terms of SMFT. In Fig. 3.a we observe a separation of temporal scales between the kinetic energy rise time, roughly matching the temporal interval (, ), and the characteristic dissipation time (see the grey areas in Fig. 3.a). Almost no energy has been dissipated at . We therefore adopt in terms of the variables in SMFT.
This assumption can be verified by comparing the values of with an auxiliary avalanche variable (see Fig. S7 in supplementary material). If we assume a temporal proportionality between and , for consistency . Therefore the proportionality implies , as verified in Fig. S7.
However, for the sake of completeness, in the next section we compare our results considering both (herein referred as model SMFT(1)) and (SMFT(2)) to validate our hypothesis in light of the exponent values.
IV.5 Non-universal critical exponents
In the absence of self-excitation the spatial extension of avalanches serves as a proxy of local spatial correlations and, therefore, one can assess system susceptibilities from avalanche statistics. Since no divergence of activity rate is observed in the catalogs, criticality has to be linked to a divergence of characteristic scales in avalanche distributions. Hence the power-law distributions and reported in section III.2 are a trademark of criticality. Close to criticality such distributions obey a scaling form:
| (10) |
where and are the so-called critical exponents (Table 2), are universal scaling functions (often in the form of an exponential cut-off) and are characteristic avalanche sizes, related to the correlation length. When approaching criticality, the correlation length diverges such that for any finite system it eventually takes on the system size value. Therefore, , where is the lateral size of the system. Considering that the system stays close to criticality, at the stiff particle limit () our simulation results are consistent with (see section III.2). Values have been commonly found in previous studies Maloney and Lemaître (2004) and DEM simulations Salerno and Robbins (2013); Shang et al. (2020). Other FEM simulations Karimi et al. (2017) reported a dependence of exponents and on a damping coefficient that could, potentially, include the contribution of confining pressure to the avalanche propagation. Here for the sake of the discussion we will consider to be invariant to .
In SMFT, the relations between the average sizes, energies, and durations take the following power-law form (see Dahmen (2017)):
| (11) |
Considering the proportionality between differential deformation and avalanche sizes, one can prove that the monotonic driving brings the system towards the aforementioned stationary SOC flow regime around with scale-free statistics, leading to Eq. 1. Considering the exponents above, and the proportionalty between and , criticality imposes power-law distributions with the following exponent relations (see Dahmen (2017)):
| (12) |
In Table 2 we compare our results with the predictions of SMFT in both interpretations of (models SMFT(1) and SMFT(2)) and the typical range of exponents reported in numerical studies considering similar relation between observables Budrikis et al. (2017); Liu et al. (2016); Nicolas et al. (2018). We notice that studies investigating the effect of dimensionality reported no significant differences between 2D and 3D systems Budrikis et al. (2017); Salerno and Robbins (2013). The most remarkable observation is that the exponents in our simulations are non-universal. When the confining pressure is low, or contacts are relatively stiff (), the granular compact assemblies in all three exponents , , is consistent with SMFT(1), i.e. considering , although exponents and are slightly higher than expected by SMFT. Notice that this agreement holds for both loose and dense assemblies, even when the macromechanical evolutionary path is different from SMFT in the latter. The correspondence with the SMFT predictions is progressively lost for higher confining pressures. In the extreme case of , the exponent is still close to the mean field prediction, and in agreement with recent results in 2D EPM simulations (e.g. in Budrikis et al. (2017)). However, and decrease towards values close to 1.0. Note that plays a minor role in the relation between and when both exponents are close to , see Eq. (6). The exponents and at high confining pressures, which depart from SMFT predictions, are closer to the predictions from EPM within 2D lattices, where lower exponents are reported: and Budrikis et al. (2017); Liu et al. (2016), Jagla (2015) or even down to Shang et al. (2020). The ranges found in are also consistent with previous reports comparing experiments and DEM simulations Barés et al. (2017), and simulations with variable heterogeneity Ma et al. (2020). It has been argued that this change of behavior can be interpreted as a transition between different universality classes Budrikis et al. (2017). In that case, our results might indicate a transition between conceptual limits.
To sum up, the statistics of avalanches in non-cohesive assemblies of stiff particles are relatively close to the expectations of the SMFT, specially for the most robust exponent , whilst the avalanches for soft particles are close to the predictions of elastoplasticity with short range interactions or geometric propagators. This might signal a dependence to softness of the propagation of interactions, as already predicted Cates et al. (1998) and observed in impact experiments Clark et al. (2015a). A plausible explanation is that the force chains formations are more prominent at the stiff-particle limit, and as such, the effective interactions are long-ranged Clark et al. (2015b) and avalanches can be represented in terms of isotropic homogeneous and independent branching processes. On the contrary, at the soft-particle limit, the deformability of particles accommodates the stress variation in finite structures well modelled by Eshelby-like propagators in the coarse-grained mesoscale. Therefore, we argue that the non-equilibrium statistical physics of fragile matter do not significantly differ from those of amorphous materials with attractive potentials as long as correlations, or influence of force-chain structures, are damped at short length scales. Similar parameter-dependent exponents have been found in other simulations and linked to changes in the effective dimension of avalanche location Amitrano (2003); Niemann et al. (2012). From standard renormalization theory it is known that, in general, effective system dimensions and the range of interactions condition the universality class, i.e. the critical exponents. The behavior at intermediate softness could therefore represent a cross-over phenomenon, giving rise to an “effective” set of exponents that would depend on the system size.
Finally, following the hyperscaling relation between avalanche-size distribution and the pseudogap Lin and Wyart (2016):
| (13) |
Assuming as constant, the exponent , determining the distribution of residual stresses, Eq. (8), and interevent times, transitions from for stiff particles to for soft particles if we use the fitted values of from Table 2. These two extreme cases (represented in Fig. 9) are in agreement, respectively, with the expected found in mean field models Lin and Wyart (2016) and found in DEM simulations considering LJ potentials Liu et al. (2016); Jagla (2015); Shang et al. (2020). Overall, we observe a general correspondence between the exponents fitted at low confining pressure with the predictions of SMFT, and we recover the usual ranges of values found in EPM and other simulations of amorphous materials at higher confining pressures.
IV.6 Avalanche statistics on the SES are stationary and scale free
The interpretation of the SES manifold as a stability limit solves the problem of the non-monotonous evolution from a macroscopic point of view, once structural configurational aspects are taken into account. Beyond that, and as far as we can tell, the SES defines the ’state’ of the assembly where avalanche statistics is non-degenerated. Upon reaching the SES at different stress values, and once the variations in the avalanche activity rate are accounted for, no difference in the statistics of avalanches is observed (Fig. 5). The distributions of avalanche sizes are virtually identical, independently of the values, the evolutionary path, and the initial configuration. Focusing on the result at the stiff-particle limit, and despite the complexity of the internal processes involved, the macromechanical evolution of loose assemblies, such as L5kSc5 in Fig. 1, is in agreement with the predictions of the SMFT (Eq. (1)). In particular, the SMFT predictions extend way beyond the proximity-limit of , and apply to the entire observation interval. In contrast, initially dense assemblies, such as D5kSc5 in Fig. 1, display the typical peak in stress and post-peak strain softening which is not captured by Eq. (1) nor the scaling relations in SMFT. However, once SES is reached, the distributions in Fig. 5 are already compatible with the scale-free behavior with SMFT universality, besides the aforementioned finite size effects, way before the steady state flow regime. Therefore, we argue that the SES is not only an attractor manifold to the internal state of the system, but might as well correspond to the self-organized critical (SOC) state Bak and Chen (1991); Chen et al. (1991); Zapperi et al. (1995); Watkins et al. (2016) from the perspective of out-of-equilibrium statistical physics. This is also demonstrated in Ref. Pouragha and Wan (2018a) where a preliminary measure for a distance to criticality is suggested based on the concept of SES. Further studies are nevertheless necessary to determine whether the SES is indeed an exact representation of avalanche criticality or yet another approximation. This question can be addressed in principle through a finite size scaling analysis of avalanche distributions in terms of the parameters representing the distance to SES. Yet, it is a comptuationally cumbersome task if one wants to obtain statistically reliable conclusions Budrikis et al. (2017), which remains a challenge for the future.
V Conclusions:
We presented a statistical analysis of kinetic avalanches recorded during DEM simulations of granular assemblies with elastic potentials under AQS conditions. It showed that criticality, in the form of power-law statistics, is degenerated in the space of the commonly used macroscopic state variables such as stress and strains. Instead, internal measurements, such as the fabric anisotropy, the rigidity ratio, and average coordination number, in which the manifold herein referred to as stable evolutionary state (SES) is defined, appear to provide a more appropriate representation of criticality, and closeness to criticality, in terms of avalanche statistics and susceptibilities. In particular, we have presented evidence that points towards the existence of a link between (i) the SES, identified as an attractor of the evolution of granular systems in the space of internal measurements Pouragha and Wan (2018a) and (ii) criticality characterized by a divergence of susceptibilities and scale-free avalanches. Therefore, we argue that the SES is itself a self-organized critical (SOC) state, representing a basin of attraction to the state of the system with scale-free independent avalanches before reaching the stationary flow regime.
We interpret the observed time predictability as evidence that the SES corresponds to a stability limit under AQS conditions.
In terms of the residual-stress formulation, we conjecture that the SES, determined by the potential energy landscape, dominates the dynamics during driving as considered in EPM, although the high susceptibility of the system might introduce non-affine stress rearrangements through the force-chain network. Conversely, based on the higher correlation between states at the onset of avalanches than between states arresting avalanches, we believe that the avalanche propagation is strongly affected by the transient kinetic energy in underdamped inertial systems.
Therefore, the stability of the assembly during the compression process is determined by the combined effect of equilibrium constraints governing the quasi-static stability and the transient addition of kinetic energy during avalanche propagation. Testing this hypothesis further remains a challenge for the future, potentially involving simulations with alternative control protocols, the inclusion of thermal effects and/or the tuning of frictional and damping parameters.
On the other hand, the reported avalanche interevent times are compatible with the power-law pseudogap hypothesis, rendering a Weibull renewal process for large system sizes, while the Poisson hypothesis is still valid for small systems. This is in agreement with the possible existence of a system-size dependent plateau in the distribution of residual stresses recently discussed in the literature Ruscher and Rottler (2020); Korchinski et al. (2021); Ferrero and Jagla (2019).
Despite the particular aspects of our simulations, the reported avalanche statistics do not differ significantly from the expectations of EPM and can, in fact, bridge the gap between the depinning universality class associated with the slip mean field theory (SMFT) and the extended non-universal exponents in yielding Lin et al. (2014) that could represent a cross-over towards a new universality class of elastoplasticity and, therefore, be invariant with respect to the dimensionality of the system Budrikis et al. (2017).
We found that the external stress drop () is proportional to the internal energy drop and a good proxy for the internal displacement, or in terms of the slip mean field theory (SMFT) Dahmen et al. (2011); Dahmen (2017). The peak of kinetic energy () serves as a good proxy for the avalanche energy . The observed exponents characterizing the critical state are non-universal and display a transition from (i) the expected values for SMFT, for stiff particles or low confining pressures in our simulations, to (ii) the lower exponents observed in 2d simulations of amorphous materials Budrikis et al. (2017); Liu et al. (2016); Jagla (2015); Shang et al. (2020), for soft particles or high confining pressures in our simulations. This could be linked to the known change in spatial distribution and anisotropy of correlations in the two limits, which depends on the structure and robustness of the internal force-chain network connecting the contact points Cates et al. (1998); Clark et al. (2015a). In particular, for stiff particles, small displacements in a single contact can propagate through the force-chain and span the whole system, resulting in a homogeneous and isotropic long-ranged response at the coarse-grained scale, similar to the interactions in the SMFT. In contrast, soft-particles accommodate variations of stress at a short-range scale, reminiscent of the typical Eshelby inclusion modeled in 2d EPM Albaret et al. (2016). On the other hand, intertial effects are found to depend on stiffness and are known to affect avalanche statistics as well Salerno et al. (2012); Salerno and Robbins (2013); Karimi and Barrat (2016); Karimi et al. (2017). Finally, the relation between stiffness and the universality class is further reinforced by the indirect estimation of the exponent defining the distribution of residual stresses, which satisfies the expectations of mean-field models Lin and Wyart (2016) for stiff particles and 2D EPM for soft particles Liu et al. (2016); Jagla (2015); Shang et al. (2020).
To summarize, based on our results we propose a static stability limit (SES) as a candidate for a SOC state reached before the traditional flow regime, and a link between the collection of critical exponents defining the critical state and the stiffness of the particles. These two novel conjectures should serve as a starting point to extend our understanding of the discussed non-universality in the deformation of amorphous materials, and the role of the internal structure and its dynamics during the deformation. Indeed, we strongly believe that this might be a fundamental aspect to understand the fit of fragile matter within elastoplastic theory.
Acknowledgements.
Daniel Korchinski for fruitful discussions. J.B. thanks financial support from the Banco de Santander - María de Maetzu fellowship program, and the AXA Research Fund through the project RheMechFail. This work was financially supported by the Natural Sciences and Engineering Research Council of Canada (NSERC).References
- Sethna et al. (2001) J. P. Sethna, K. A. Dahmen, and C. R. Myers, Nature 410, 242 (2001).
- Salje and Dahmen (2014) E. K. Salje and K. A. Dahmen, Annual Review of Condensed Matter Physics 5, 233 (2014),
- Nicolas et al. (2018) A. Nicolas, E. E. Ferrero, K. Martens, and J.-L. Barrat, Rev. Mod. Phys. 90, 045006 (2018).
- Miguel et al. (2001) M. C. Miguel, A. Vespignani, S. Zapperi, J. Weiss, and J.-R. Grasso, Nature 410, 667 (2001).
- Zaiser (2006) M. Zaiser, Advances in Physics 55, 185 (2006), .
- Friedman et al. (2012) N. Friedman, A. T. Jennings, G. Tsekenis, J.-Y. Kim, M. Tao, J. T. Uhl, J. R. Greer, and K. A. Dahmen, Phys. Rev. Lett. 109, 095507 (2012).
- Wang et al. (2009) G. Wang, K. Chan, L. Xia, P. Yu, J. Shen, and W. Wang, Acta Materialia 57, 6146 (2009).
- Antonaglia et al. (2014) J. Antonaglia, W. J. Wright, X. Gu, R. R. Byer, T. C. Hufnagel, M. LeBlanc, J. T. Uhl, and K. A. Dahmen, Phys. Rev. Lett. 112, 155501 (2014).
- Schall et al. (2007) P. Schall, D. A. Weitz, and F. Spaepen, Science 318, 1895 (2007), .
- Hu et al. (2018) Y. Hu, L. Shu, Q. Yang, W. Guo, P. K. Liaw, K. A. Dahmen, and J.-M. Zuo, Communications Physics 1, 61 (2018).
- Rizzardi et al. (2018) Q. Rizzardi, G. Sparks, and R. Maaß, JOM 70, 1088 (2018).
- Dahmen et al. (2011) K. a. Dahmen, Y. Ben-Zion, and J. T. Uhl, Nature Physics 7, 554 (2011).
- Denisov et al. (2016) D. V. Denisov, K. A. Lörincz, J. T. Uhl, K. A. Dahmen, and P. Schall, Nature Communications 7, 10641 (2016).
- Berthier et al. (2019a) E. Berthier, J. E. Kollmer, S. E. Henkes, K. Liu, J. M. Schwarz, and K. E. Daniels, Phys. Rev. Materials 3, 075602 (2019a).
- Maloney and Lemaître (2004) C. Maloney and A. Lemaître, Phys. Rev. Lett. 93, 016001 (2004).
- Salerno et al. (2012) K. M. Salerno, C. E. Maloney, and M. O. Robbins, Phys. Rev. Lett. 109, 105703 (2012).
- Salerno and Robbins (2013) K. M. Salerno and M. O. Robbins, Phys. Rev. E 88, 062206 (2013).
- Parisi et al. (2017) G. Parisi, I. Procaccia, C. Rainone, and M. Singh, Proceedings of the National Academy of Sciences 114, 5577 (2017),
- Zhang et al. (2017) D. Zhang, K. A. Dahmen, and M. Ostoja-Starzewski, Phys. Rev. E 95, 032902 (2017).
- Shang et al. (2020) B. Shang, P. Guan, and J.-L. Barrat, Proceedings of the National Academy of Sciences 117, 86 (2020),
- Lerner and Procaccia (2009) E. Lerner and I. Procaccia, Phys. Rev. E 79, 066109 (2009).
- Karmakar et al. (2010) S. Karmakar, E. Lerner, and I. Procaccia, Phys. Rev. E 82, 055103(R) (2010).
- Gimbert et al. (2013) F. Gimbert, D. Amitrano, and J. Weiss, EPL (Europhysics Letters) 104, 46001 (2013).
- Pouragha and Wan (2016) M. Pouragha and R. Wan, Granular Matter 18, 38 (2016).
- Karimi and Barrat (2018) K. Karimi and J.-L. Barrat, Scientific Reports 8, 4021 (2018).
- Cates et al. (1998) M. E. Cates, J. P. Wittmer, J.-P. Bouchaud, and P. Claudin, Phys. Rev. Lett. 81, 1841 (1998).
- Liu and Nagel (1998) A. J. Liu and S. R. Nagel, Nature 396, 21 (1998).
- Bi et al. (2011) D. Bi, J. Zhang, B. Chakraborty, and R. P. Behringer, Nature 480, 355 (2011).
- Bak and Chen (1991) P. Bak and K. Chen, Scientific American 264, 46 (1991).
- Chen et al. (1991) K. Chen, P. Bak, and S. P. Obukhov, Phys. Rev. A 43, 625 (1991).
- Zapperi et al. (1995) S. Zapperi, K. B. Lauritsen, and H. E. Stanley, Phys. Rev. Lett. 75, 4071 (1995).
- Watkins et al. (2016) N. W. Watkins, G. Pruessner, S. C. Chapman, N. B. Crosby, and H. J. Jensen, Space Science Reviews 198, 3 (2016).
- Hébraud and Lequeux (1998) P. Hébraud and F. Lequeux, Phys. Rev. Lett. 81, 2934 (1998).
- Ben-Zion and Rice (1993) Y. Ben-Zion and J. R. Rice, Journal of Geophysical Research: Solid Earth 98, 14109 (1993),
- Dahmen et al. (2009) K. A. Dahmen, Y. Ben-Zion, and J. T. Uhl, Phys. Rev. Lett. 102, 175501 (2009).
- Dahmen (2017) K. A. Dahmen, Mean field theory of slip statistics, in Avalanches in Functional Materials and Geophysics, edited by E. K. Salje, A. Saxena, and A. Planes (Springer International Publishing, Cham, 2017) pp. 19–30.
- Dahmen et al. (1998) K. Dahmen, D. Ertaş, and Y. Ben-Zion, Phys. Rev. E 58, 1494 (1998).
- Mehta et al. (2006) A. P. Mehta, K. A. Dahmen, and Y. Ben-Zion, Phys. Rev. E 73, 056104 (2006).
- Geller et al. (2015) D. A. Geller, R. E. Ecke, K. A. Dahmen, and S. Backhaus, Phys. Rev. E 92, 060201(R) (2015).
- Corwin et al. (2005) E. I. Corwin, H. M. Jaeger, and S. R. Nagel, Nature 435, 1075 (2005).
- Lin et al. (2014) J. Lin, A. Saade, E. Lerner, A. Rosso, and M. Wyart, EPL (Europhysics Letters) 105, 26003 (2014).
- Budrikis et al. (2017) Z. Budrikis, D. F. Castellanos, S. Sandfeld, M. Zaiser, and S. Zapperi, Nature Communications 8, 15928 (2017).
- Korchinski et al. (2021) D. Korchinski, C. Ruscher, and J. Rottler, arXiv preprint arXiv:2101.10688 (2021).
- Baret et al. (2002) J.-C. Baret, D. Vandembroucq, and S. Roux, Phys. Rev. Lett. 89, 195506 (2002).
- Picard et al. (2005) G. Picard, A. Ajdari, and F. Lequeux, L. Bocquet, Phys. Rev. E 71, 010501(R) (2005).
- Agoritsas et al. (2015) E. Agoritsas, E. Bertin, K. Martens, and J.-L. Barrat, The European Physical Journal E 38, 71 (2015).
- Lin and Wyart (2016) J. Lin and M. Wyart, Phys. Rev. X 6, 011005 (2016).
- Ferrero and Jagla (2019) E. E. Ferrero and E. A. Jagla, Soft Matter 15, 9041 (2019).
- Rodney et al. (2011) D. Rodney, A. Tanguy, and D. Vandembroucq, Modelling and Simulation in Materials Science and Engineering 19, 083001 (2011).
- Miller et al. (1996) B. Miller, C. O’Hern, and R. P. Behringer, Phys. Rev. Lett. 77, 3110 (1996).
- Mueth et al. (1998) D. M. Mueth, H. M. Jaeger, and S. R. Nagel, Physical Review E 57, 3164 (1998).
- Liu et al. (1995) C. h. Liu, S. R. Nagel, D. A. Schecter, S. N. Coppersmith, S. Majumdar, O. Narayan, and T. A. Witten, Science 269, 513 (1995),
- Howell et al. (1999) D. Howell, R. P. Behringer, and C. Veje, Phys. Rev. Lett. 82, 5241 (1999).
- Andò et al. (2012) E. Andò, S. Hall, G. Viggiani, J. Desrues, and P. Bésuelle, Géotechnique Letters 2, 107 (2012).
- Gendelman et al. (2016) O. Gendelman, Y. G. Pollack, I. Procaccia, S. Sengupta, and J. Zylberg, Physical Review Letters 116, 078001 (2016),
- Berthier et al. (2019b) E. Berthier, M. A. Porter, and K. E. Daniels, Proceedings of the National Academy of Sciences 116, 16742 (2019b),
- Tordesillas (2007) A. Tordesillas, Philosophical Magazine 87, 4987 (2007),
- Guo and Zhao (2013) N. Guo and J. Zhao, Computers and Geotechnics 47, 1 (2013).
- Kuhn (1999) M. R. Kuhn, Mechanics of materials 31, 407 (1999).
- Pouragha and Wan (2017a) M. Pouragha and R. Wan, International Journal of Solids and Structures 110, 94 (2017a).
- Edwards and Oakeshott (1989) S. Edwards and R. Oakeshott, Physica A: Statistical Mechanics and its Applications 157, 1080 (1989).
- Blumenfeld and Edwards (2009) R. Blumenfeld and S. F. Edwards, The Journal of Physical Chemistry B 113, 3981 (2009),
- Blumenfeld et al. (2012) R. Blumenfeld, J. F. Jordan, and S. F. Edwards, Phys. Rev. Lett. 109, 238001 (2012).
- Bi et al. (2015) D. Bi, S. Henkes, K. E. Daniels, and B. Chakraborty, Annual Review of Condensed Matter Physics 6, 63 (2015),
- Baule et al. (2018) A. Baule, F. Morone, H. J. Herrmann, and H. A. Makse, Rev. Mod. Phys. 90, 015006 (2018).
- Bililign et al. (2019) E. S. Bililign, J. E. Kollmer, and K. E. Daniels, Phys. Rev. Lett. 122, 038001 (2019).
- Ball (2019) P. Ball, Nature Materials 18, 196 (2019).
- Masson and Martinez (2001) S. Masson and J. Martinez, Journal of engineering mechanics 127, 1007 (2001).
- Desrues and Viggiani (2004) J. Desrues and G. Viggiani, International Journal for Numerical and Analytical Methods in Geomechanics 28, 279 (2004).
- Desrues and Hammad (1989) J. Desrues and W. Hammad, in Proc. of the Int. Workshop on Numerical Methods for Localization and Bifurcation of Granular Bodies (1989) pp. 57–67.
- Pouragha and Wan (2017b) M. Pouragha and R. Wan, Journal of Engineering Mechanics 143, C4016002 (2017b).
- Inc (2008) I. C. G. Inc, Minneapolis: Itasca Consulting Group Inc. (2008).
- Da Cruz et al. (2005) F. da Cruz, S. Emam, M. Prochnow, J.-N. Roux, and F. Chevoir, Physical Review E 72, 021309 (2005).
- Radjai and Roux (2002) F. Radjai and S. Roux, Phys. Rev. Lett. 89, 064302 (2002).
- Bonfanti et al. (2019) S. Bonfanti, R. Guerra, C. Mondal, I. Procaccia, and S. Zapperi, Phys. Rev. E 100, 060602(R) (2019).
- Nicot et al. (2017) F. Nicot, H. Xiong, A. Wautier, J. Lerbet, and F. Darve, Granular Matter 19, 18 (2017).
- Pouragha and Wan (2018a) M. Pouragha and R. Wan, Mechanics of Materials 126, 57 (2018a).
- Lemaître and Caroli (2009) A. Lemaître and C. Caroli, Phys. Rev. Lett. 103, 065501 (2009).
- LU et al. (2007) K. LU, E. E. Brodsky, and H. P. Kavehpour, Journal of Fluid Mechanics 587, 347–372 (2007).
- Nicot et al. (2012) F. Nicot, N. Hadda, F. Bourrier, L. Sibille, R. Wan, and F. Darve, International Journal of solids and Structures 49, 1252 (2012).
- Maimon and Schwarz (2004) R. Maimon and J. M. Schwarz, Phys. Rev. Lett. 92, 255502 (2004).
- Chang et al. (1995) C. S. Chang, S. J. Chao, and Y. Chang, International journal of solids and structures 32, 1989 (1995).
- Pouragha and Wan (2018b) M. Pouragha and R. Wan, International journal of solids and structures 138, 97 (2018b).
- Privman (1990) V. Privman, Finite size scaling and numerical simulation of statistical systems (World Scientific Singapore, 1990).
- Liu et al. (2016) C. Liu, E. E. Ferrero, F. Puosi, J.-L. Barrat, and K. Martens, Phys. Rev. Lett. 116, 065501 (2016).
- Zapperi et al. (1997) S. Zapperi, A. Vespignani, and H. E. Stanley, Nature 388, 658 (1997).
- Baró and Vives (2012) J. Baró and E. Vives, Phys. Rev. E 85, 066121 (2012).
- Christensen et al. (2008) K. Christensen, N. Farid, G. Pruessner, and M. Stapleton, The European Physical Journal B 62, 331 (2008).
- Karimi and Barrat (2016) K. Karimi and J.-L. Barrat, Phys. Rev. E 93, 022904 (2016).
- Amitrano (2003) D. Amitrano, Journal of Geophysical Research: Solid Earth 108 (2003), 10.1029/2001JB000680,
- Lord-May et al. (2020) C. Lord-May, J. Baró, D. W. Eaton, and J. Davidsen, Phys. Rev. Research 2, 043324 (2020).
- Didier Sornette (1994) Didier Sornette, J. Phys. I France 4, 209 (1994).
- Vazquez et al. (2011) F. Vazquez, J. A. Bonachela, C. López, and M. A. Muñoz, Phys. Rev. Lett. 106, 235702 (2011).
- Utsu et al. (1995) T. Utsu, Y. Ogata, et al., Journal of Physics of the Earth 43, 1 (1995).
- Weiss and Carmen Miguel (2004) J. Weiss and M. Carmen Miguel, Materials Science and Engineering: A 387-389, 292 (2004), 13th International Conference on the Strength of Materials.
- Crane and Sornette (2008) R. Crane and D. Sornette, Proceedings of the National Academy of Sciences 105, 15649 (2008),
- Sornette and Utkin (2009) D. Sornette and S. Utkin, Phys. Rev. E 79, 061110 (2009).
- Baró et al. (2013) J. Baró, A. Corral, X. Illa, A. Planes, E. K. H. Salje, W. Schranz, D. E. Soto-Parra, and E. Vives, Phys. Rev. Lett. 110, 088702 (2013).
- Hainzl et al. (2014) S. Hainzl, J. Moradpour, and J. Davidsen, Geophysical Research Letters 41, 8818 (2014),
- Baró et al. (2014) J. Baró, J.-M. Martín-Olalla, F. J. Romero, M. C. Gallardo, E. K. H. Salje, E. Vives, and A. Planes, Journal of Physics: Condensed Matter 26, 125401 (2014).
- Davidsen et al. (2017) J. Davidsen, G. Kwiatek, E.-M. Charalampidou, T. Goebel, S. Stanchits, M. Rück, and G. Dresen, Phys. Rev. Lett. 119, 068501 (2017).
- Kumar et al. (2020) P. Kumar, E. Korkolis, R. Benzi, D. Denisov, A. Niemeijer, P. Schall, F. Toschi, and J. Trampert, Scientific Reports 10, 626 (2020).
- Dieterich (1972) J. H. Dieterich, Journal of Geophysical Research (1896-1977) 77, 3771 (1972),
- Hainzl et al. (1999) S. Hainzl, G. Zöller, and J. Kurths, Journal of Geophysical Research: Solid Earth 104, 7243 (1999),
- Zöller et al. (2006) G. Zöller, S. Hainzl, Y. Ben-Zion, and M. Holschneider, Tectonophysics 423, 137 (2006), spatiotemporal Models of Seismicity and Earthquake Occurrence.
- Ben-Zion and Lyakhovsky (2006) Y. Ben-Zion and V. Lyakhovsky, Geophysical Journal International 165, 197 (2006),
- Jagla (2014) E. A. Jagla, Phys. Rev. E 90, 042129 (2014).
- Zhang and Shcherbakov (2016) X. Zhang and R. Shcherbakov, Scientific Reports 6, 36668 EP (2016), article.
- Baró and Davidsen (2018) J. Baró and J. Davidsen, Phys. Rev. E 97, 033002 (2018).
- Ruscher and Rottler (2020) C. Ruscher and J. Rottler, Soft Matter 16, 8940 (2020).
- Touati et al. (2009) S. Touati, M. Naylor, and I. G. Main, Phys. Rev. Lett. 102, 168501 (2009).
- Baró and Davidsen (2017) J. Baró and J. Davidsen, European Physical Journal: Special Topics 226, 3211 (2017).
- Kuhn and Daouadji (2019) M. R. Kuhn and A. Daouadji, Granular Matter 21, 10 (2019).
- Bi et al. (1989) H. Bi, G. Börner, and Y. Chu, Astronomy and Astrophysics 218, 19 (1989).
- Reid (1910) H. F. Reid, The California Earthquake of April 18, 1906, Report of the State Earthquake Investigation Commission (1910).
- Shimazaki and Nakata (1980) K. Shimazaki and T. Nakata, Geophysical Research Letters 7, 279 (1980),
- Combe and Roux (2000) G. Combe and J.-N. Roux, Physical Review Letters 85, 3628 (2000).
- Picard et al. (2004) G. Picard, A. Ajdari, F. Lequeux, and L. Bocquet, The European Physical Journal E 15, 371 (2004).
- Albaret et al. (2016) T. Albaret, A. Tanguy, F. Boioli, and D. Rodney, Phys. Rev. E 93, 053002 (2016).
- Lockner (1993) D. Lockner, International Journal of Rock Mechanics and Mining Sciences & Geomechanics Abstracts 30, 883 (1993).
- Lennartz-Sassinek et al. (2014) S. Lennartz-Sassinek, I. G. Main, M. Zaiser, and C. C. Graham, Phys. Rev. E 90, 052401 (2014).
- Baró et al. (2018) J. Baró, K. A. Dahmen, J. Davidsen, A. Planes, P. O. Castillo, G. F. Nataf, E. K. H. Salje, and E. Vives, Phys. Rev. Lett. 120, 245501 (2018).
- Kun et al. (2014) F. Kun, I. Varga, S. Lennartz-Sassinek, and I. G. Main, Phys. Rev. Lett. 112, 065501 (2014).
- Kwiatek et al. (2014) G. Kwiatek, T. H. W. Goebel, and G. Dresen, Geophysical Research Letters 41, 5838 (2014),
- Tordesillas et al. (2009) A. Tordesillas, J. Zhang, and R. Behringer, Geomechanics and Geoengineering: An International Journal 4, 3 (2009).
- Vu and Weiss (2020) C.-C. Vu and J. Weiss, Phys. Rev. Lett. 125, 105502 (2020).
- Janićević et al. (2016) S. Janićević, L. Laurson, K. J. Måløy, S. Santucci, and M. J. Alava, Phys. Rev. Lett. 117, 230601 (2016).
- Salditch et al. (2020) L. Salditch, S. Stein, J. Neely, B. D. Spencer, E. M. Brooks, A. Agnon, and M. Liu, Tectonophysics 774, 228289 (2020).
- Karimi et al. (2017) K. Karimi, E. E. Ferrero, and J.-L. Barrat, Phys. Rev. E 95, 013003 (2017).
- Anthony and Marone (2005) J. L. Anthony and C. Marone, Journal of Geophysical Research: Solid Earth 110 (2005), 10.1029/2004JB003399,
- Frenkel et al. (2008) G. Frenkel, R. Blumenfeld, Z. Grof, and P. R. King, Phys. Rev. E 77, 041304 (2008).
- Henkes et al. (2007) S. Henkes, C. S. O’Hern, and B. Chakraborty, Phys. Rev. Lett. 99, 038002 (2007).
- Jagla (2015) E. A. Jagla, Phys. Rev. E 92, 042135 (2015).
- Barés et al. (2017) J. Barés, D. Wang, D. Wang, T. Bertrand, C. S. O’Hern, and R. P. Behringer, Phys. Rev. E 96, 052902 (2017).
- Ma et al. (2020) G. Ma, Y. Zou, K. Gao, J. Zhao, and W. Zhou, Geophysical Research Letters 47, e2020GL090458 (2020), e2020GL090458 2020GL090458,
- Clark et al. (2015a) A. H. Clark, A. J. Petersen, L. Kondic, and R. P. Behringer, Phys. Rev. Lett. 114, 144502 (2015a).
- Clark et al. (2015b) A. H. Clark, A. J. Petersen, L. Kondic, and R. P. Behringer, Physical review letters 114, 144502 (2015b).
- Niemann et al. (2012) R. Niemann, J. Baró, O. Heczko, L. Schultz, S. Fähler, E. Vives, L. Mañosa, and A. Planes, Phys. Rev. B 86, 214101 (2012).