Multi-scale Radio and X-ray Structure of the High-redshift Quasar PMN J0909+0354
Abstract
The high-redshift quasar PMN J0909+0354 () is known to have a pc-scale compact jet structure, based on global 5-GHz very long baseline interferometry (VLBI) observations performed in 1992. Its kpc-scale structure was studied with the Karl G. Jansky Very Large Array (VLA) in the radio and the Chandra space telescope in X-rays. Apart from the north-northwestern jet component seen in both the VLA and Chandra images at separation from the core, there is another X-ray feature at in the northeastern (NE) direction. To uncover more details and possibly structural changes in the inner jet, we conducted new observations at 5 GHz using the European VLBI Network (EVN) in 2019. These data confirm the northward direction of the one-sided inner jet already suspected from the 1992 observations. A compact core and multiple jet components were identified that can be traced up to kpc projected distance towards the north, while the structure becomes more and more diffuse. A comparison with arcsec-resolution imaging with the VLA shows that the radio jet bends by between the two scales. The direction of the pc-scale jet as well as the faint optical counterpart found for the newly-detected X-ray point source (NE) favors the nature of the latter as a background or foreground object in the field of view. However, the extended ( kpc) emission around the positions of the quasar core and NE detected by the Wide-field Infrared Survey Explorer (WISE) in the mid-infrared might suggest physical interaction of the two objects.
1 Introduction
Quasars, powerful active galactic nuclei (AGN) fuelled by accretion onto supermassive black holes populate the observable Universe up to redshift (Wang et al., 2021). Even for a redshift that was considered ‘very high’ for quasars known two decades ago, the corresponding age of the Universe is only about 2 billion years. Studying low- and high-redshift quasars thus provides information on the evolution of this class of objects (e.g. Dunlop & Peacock, 1990; Delvecchio et al., 2017) and may also help us refining cosmological models (e.g. Gurvits et al., 1999; Lusso & Risaliti, 2017).
Radiation from jetted AGN in the radio is caused by synchrotron emission of relativistic charged particles, while the role of the dominant processes in X-rays is still under debate (e.g. Breiding et al., 2017; Harris et al., 2017; Lucchini et al., 2017). X-ray emission of AGN jets might originate from inverse-Compton (IC) scattering of electrons on the cosmic microwave background (CMB), boosting the CMB energy density proportionally to the square of the bulk Lorentz factor () of the relativistic jet. This IC/CMB model can explain the morphology of one-sided X-ray jets enhanced by with a structure extending to hundreds of kpc from the galactic nucleus into the inter-galactic space. The surface brightness of radio synchrotron emission scales down with increasing redshift by , limiting the observable population in the early Universe. In case of the IC/CMB radiation, surface brightness decreases likewise, but it is balanced out by the rising energy density of CMB photons by , potentially turning X-ray emission into a redshift-independent tracer of AGN jets (Schwartz, 2002).
So far, less than twenty radio quasars have been imaged with the Chandra X-ray Observatory to search for kpc-scale X-ray jets. There are two clear cases when these extend beyond the known radio jet (Schwartz et al., 2019, 2020). Studying sources with detectable emission in both radio and X-ray bands, physical conditions derived from the observations can be compared. Applying high-resolution very long baseline interferometry (VLBI) imaging of pc-scale radio jets at multiple epochs, apparent jet component proper motions and core brightness temperatures can be measured, and physical conditions (viewing angle, bulk Lorentz factor) of high-redshift AGN jets can be determined (e.g. Frey et al., 2015; Perger et al., 2018; Zhang et al., 2020; An et al., 2020). Currently this sample is very limited at the highest redshifts. Therefore multi-epoch VLBI imaging of another jetted object is of particular interest.
The high-redshift (, Lee et al., 2013)111Another, slightly different value for the redshift can also be found in the literature (, Véron-Cetty & Véron, 1993) quasar PMN J0909+0354 (hereafter J0909+0354; right ascension , declination , Petrov, 2021) is a known radio and X-ray source. Here we present a study of its kpc- and pc-scale radio structure as well as Chandra X-ray imaging of its kpc-scale emission. In Section 2, we introduce the target source. Section 3 gives details of the radio and X-ray observations used in the analysis. Our results are presented in Section 4 and discussed in Section 5. The paper is concluded with a summary in Section 6.
For calculations, we applied parameters of the standard flat CDM cosmological model as km s-1 Mpc-1, , and . At the redshift of the quasar, 1 milli-arcsecond (mas) angular separation corresponds to pc projected linear distance.
2 The Target Quasar
2.1 Radio and X-ray Emission of J0909+0354
| (GHz) | (mJy) | Reference | |
| FIRST | Helfand et al. (2015) | ||
| NVSS | Condon et al. (1998) | ||
| GBT | White & Becker (1992) | ||
| Becker et al. (1991) | |||
| Gregory et al. (1996) | |||
| PMN | Griffith et al. (1995) | ||
| CLASS | Myers et al. (2003) |
The quasar J0909+0354 has been detected with -mJy level flux densities at various frequencies in different sky surveys. Flux densities from the following observations are listed in Table 1. Karl G. Jansky Very Large Array (VLA) A-configuration imaging observations at 1.5, 4.9, and 8 GHz revealed that the radio emission of the quasar can be resolved into a double structure: a compact core and a secondary component at about angular separation in the north-northwestern direction (Gobeille et al., 2014). Archival Very Long Baseline Array (VLBA) observations (Petrov, 2021, project code: BP171AB, PI: L. Petrov) of J0909+0354 at 4.3 and 7.6 GHz show compact, unresolved radio emission up to pc, with 111 and 76 mJy total flux densities, respectively222From http://astrogeo.org/cgi-bin/imdb_get_source.csh?source=J0909%2B0354. Global VLBI observations at 5 GHz resolved the pc-scale morphology, revealing a compact synchrotron self-absorbed core and a more diffuse jet structure visible up to pc (Paragi et al., 1999).
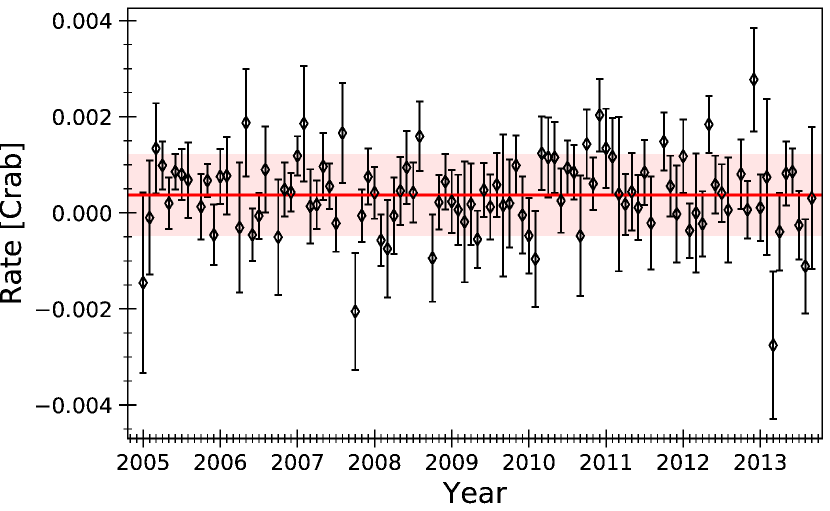
X-ray emission of the quasar was first detected by ROSAT (ROentgen SATellite) in the keV energy range with a flux of erg cm-2 s-1 (Brinkmann et al., 1997). Fluxes from observations by the BeppoSAX and Swift space telescopes are erg cm-2 s-1 (photon index , Donato et al., 2005) and erg cm-2 s-1 (, Oh et al., 2018), in the keV and keV energy ranges, respectively. The light curve of J0909+0354 observed in the framework of the 105-month Swift-BAT all-sky hard X-ray survey revealed some variability in the keV energy range (Fig. 1).
2.2 Emission in Other Wavebands
| Filter | (mag) | Reference | ||
| GALEX | 152.8 nm | Martin et al. (2005); Vanden Berk et al. (2020) | ||
| 227.1 nm | ||||
| Swift-UVOT | 345.6 nm | Roming et al. (2005); Yershov (2014) | ||
| SDSS DR16 | 354.3 nm | Ahumada et al. (2020) | ||
| 477.0 nm | ||||
| 623.1 nm | ||||
| 765.5 nm | ||||
| 913.4 nm | ||||
| Gaia DR2 | 500 nm | Gaia Collaboration et al. (2016, 2018) | ||
| 700 nm | ||||
| 850 nm | ||||
| Pan-STARRS | 486.6 nm | Chambers et al. (2016) | ||
| 621.5 nm | ||||
| 754.5 nm | ||||
| 867.9 nm | ||||
| 963.3 nm | ||||
| UKIDSS | 1.031 m | Lawrence et al. (2007) | ||
| 1.248 m | ||||
| 1.630 m | ||||
| 2.201 m | ||||
| WISE | 3.35 m | Wright et al. (2010); Cutri et al. (2014) | ||
| 4.60 m | ||||
| 11.6 m | ||||
| 22.1 m |
The quasar J0909+0354 is also a source of electromagnetic radiation detected in various surveys in the ultraviolet, optical, and infrared wavebands, which are listed in Table 2.
The quasar was not detected in -rays with either of the INTErnational Gamma-Ray Astrophysics Laboratory (INTEGRAL, Winkler et al., 2003), the Large Area Telescope of Fermi Gamma-Ray Space Telescope (Fermi-LAT Atwood et al., 2009), the Compton Gamma Ray Observatory (CGRO, e.g. Kanbach et al., 1989; Meegan et al., 1998; Thompson et al., 1993; Goldstein et al., 2013), or the Astro-rivelatore Gamma aImmagini LEggero mission (AGILE, Tavani et al., 2009).
3 Observations and Data Reduction
3.1 Very Large Array
For a quantitative comparison of radio emission between pc and kpc scales, we utilized data obtained with the VLA at 1.5, 6.2, and 8.5 GHz.
The 8.5 GHz observations were carried out on 1998 March 14, in the framework of the Cosmic Lens All-Sky Survey (CLASS, Myers et al., 2003) (project code: AM593, PI: S. Myers), in which 27 stations participated. The on-source time for J0909+0354 was 39 s. Two intermediate frequency channels (IFs) were used with one spectral channel in each, the total bandwidth was 50 MHz. The data were recorded in full polarization with 3.3 s integration time. We calibrated the phases and amplitudes with the National Radio Astronomy Observatory (NRAO) Astronomical Image Processing System333http://www.aips.nrao.edu/index.shtml (AIPS, e.g., Diamond, 1995; Greisen, 2003) package, following the steps of standard data reduction described in the cookbook444http://www.aips.nrao.edu/cook.html for VLA continuum data, using 3C 48 as primary flux density calibrator.
The GHz observations were conducted on 2012 November 18 (project code: 12B-230, PI: J. Wardle) with the participation of 26 telescopes. In the -h long observing run, 39 sources were targeted including calibrators, from which the on-source time for J0909+0354 was 316 s. A total of 16 IFs were used with 64 spectral channels in each IF. The total bandwidth was MHz. The data were recorded in full polarization, and were correlated with 1 s averaging time.
The measurements at GHz were conducted on 2016 October 25 (project code: 16B-015, PI: J. S. Farnes), with 26 antennae participating. From the total 10 h of observation, the on-source time for J0909+0354 was 126 s. The 64 MHz total bandwidth was divided into 16 IFs, with 64 spectral channels in each. The data were recorded in full polarization, and were correlated with 1 s averaging time.
We calibrated the phases and amplitudes of the 1.5 and 6.2 GHz VLA data sets with the Common Astronomy Software Applications555http://casa.nrao.edu (casa, McMullin et al., 2007) software using 3C 48, J0738+1741, and J0831+0429 as calibrators, following the steps of the standard data reduction for VLA continuum observations666http://casaguides.nrao.edu/index.php?title=VLA_Continuum_Tutorial_3C391-CASA5.5.0. Then we exported the data to uvfits format.
The calibrated visibilities of all three VLA observations were then imported to the difmap program777ftp://ftp.astro.caltech.edu/pub/difmap/difmap.html (Shepherd, 1997), where we carried out hybrid mapping with cycles of phase and amplitude self-calibration and imaging (applying the clean deconvolution method by Högbom, 1974). Finally, to quantitatively describe the brightness distribution of the source, we fitted circular Gaussian model components directly to the self-calibrated visibility data (Pearson, 1995). Uncertainties for the fitted model parameters were calculated following Lee et al. (2008).
3.2 Very Long Baseline Interferometry
To study the pc-scale radio structure of the quasar J0909+0354, we used archival data as well as new observations made by various VLBI arrays. The latest and most sensitive data set was acquired at 5 GHz with the European VLBI Network (EVN) on 2019 March 1 (project code: EP115, PI: K. Perger). The observation lasted for a total 6 h involving 15 radio telescopes: Jodrell Bank Mk2 (United Kingdom), Westerbork (The Netherlands), Effelsberg (Germany), Medicina, Noto (Italy), Onsala (Sweden), Tianma, Nanshan (China), Toruń (Poland), Yebes (Spain), Svetloe, Zelenchukskaya, Badary (Russia), Hartebeesthoek (South Africa), and Irbene (Latvia). The on-source integration time was 5.24 h. The data were recorded at a rate of Mbit s-1 in left and right circular polarizations. The total bandwidth was 16 MHz per polarization in 32 spectral channels per IF, and a total of 8 IFs were used. The data were correlated with 2 s averaging time at the EVN Data Processor at the Joint Institute for VLBI European Research Infrastructure Consortium (Dwingeloo, the Netherlands).
We calibrated the phases and amplitudes of the visibilites in the AIPS package. We applied a priori amplitude calibration based on radio telescope gain curves and measured system temperatures, then removed inter-channel delay and phase offsets using a 1-min data segment of a bright calibrator source (J0909+0121). Visual inspection and flagging of the visibilities were followed by global fringe fitting (Schwab & Cotton, 1983) on the target source J0909+0354. The calibrated data were exported into uvfits format for further analysis.
For a comparison, we also recovered and analyzed the archival data observed by a global VLBI network on 1992 September 27–28 (Paragi et al., 1999). Nine telescopes, Effelsberg, Medicina, Onsala, the phased array of the Westerbork Synthesis Radio Telescope, as well as Green Bank, Haystack, Owens Valley, and the phased VLA (the latter four in the USA) participated in the observations which were part of a 24-h long experiment. The on-source time for J0909+0354 was 3 h. The data were recorded in left circular polarization with a total bandwidth of 28 MHz in 7 IFs, and were correlated in the Max Planck Institute for Radio Astronomy (Bonn, Germany). For further analysis, we used the visibility data calibrated by Paragi et al. (1999).
To supplement our long-track VLBI observations for studying possible changes in the pc-scale radio structure of J0909+0354, we also analyzed archival ‘snapshot’ data obtained with the VLBA. These observations were conducted in the framework of the 7th VLBA Calibrator Survey888http://astrogeo.org/vcs7/ (Petrov, 2021, project code: BP171AB, PI: L. Petrov) on 2013 April 28. All ten telescopes of the array participated in the dual-frequency (4.3 and 7.6 GHz) observation which was carried out in right circular polarization, with an on-source time of 1 min. The total bandwidth was 32 MHz in 8 IFs. The a priori calibrated visibility data sets were produced by the pima v2.03 software (Petrov et al., 2011) and were obtained from the Astrogeo VLBI image database999http://astrogeo.org/.
All four calibrated VLBI data sets were then imported to the difmap program for phase and amplitude self-calibration, imaging and model fitting, similarly to the VLA data treatment described above. Errors for the fitted model parameters were calculated following Lee et al. (2008), considering an additional calibration uncertainty for flux densities.
3.3 X-ray Observations
The X-ray emission associated with the quasar J0909+0354 was observed with the Chandra Advanced CCD Imaging Spectrometer (ACIS) as part of a survey of radio-loud quasars at (ObsID 20404, PI: D. Schwartz). We then used 77.5-ks follow-up observation (ObsIDs 22568, 23161, and 23162, PI: D. Schwartz) to reveal the extended X-ray features. The latter observations took place on February 17, 18, and 20, in 2020. The data were reduced with ciao (Chandra Interactive Analysis of Observations) version 4.12 (Fruscione et al., 2006), using Sherpa version 2 (Doe et al., 2007). Imaging used SAOImage ds9 version 8.2b1 (Joye & Mandel, 2005). Background was determined to be 0.05910.0013 counts arcsec-2 from two rectangular regions totaling 34,131 arcsec2, away from the quasar and not including sources.
4 Results
4.1 Kiloparsec-scale Structure
Model fitting to the visibilities of the 1.5, 6.2, and 8.5-GHz VLA observations resulted in two components for all three data sets: a compact core and a slightly more diffuse feature (discussed in detail in subsection 5.5) at to the north-northwestern (NNW) direction (position angle as measured from north through east, Fig. 2). The sums of the flux densities of the circular Gaussian model components describing the kpc-scale radio structure is mJy, mJy, and mJy, for the 1.5, 6.2, and 8.5 GHz data, respectively101010Although we utilized the same 8.5-GHz data set, our data reduction resulted in a flux density higher than reported by Myers et al. (2003, Table 1). As we found the same scaling factor for all other sources in the observation, we attribute this to the different amplitude calibration process in AIPS.. The properties of the two fitted components for the VLA data sets are listed in Table 3. As it was previously noted by Gobeille et al. (2014), we examined the nature of NNW, and found that its three-point spectral index111111Used in the convention. between 1.5 and 8.5 GHz is . The three-point spectral index for the core between 1.5 and 8.5 GHz is To avoid the possible effect of time variability, we also determined the spectral index for this component by separately processing the first and last two IFs from the same 6.2 GHz observation. Repeating the hybrid mapping and Gaussian model fitting on these two subsets, we found the values and for the core and NNW components, respectively. The latter value is consistent with the identification of the NNW component as a steep-spectrum jet hotspot – see further discussion on this in subsection 5.5 below.
| R.A. | Dec. | ||||||
|---|---|---|---|---|---|---|---|
| (mJy) | (′′) | () | |||||
| 1.5 GHz | core | 0 | 0 | ||||
| NNW | |||||||
| 6.2 GHz | core | 0 | 0 | ||||
| NNW | |||||||
| 8.5 GHz | core | 0 | 0 | ||||
| NNW |
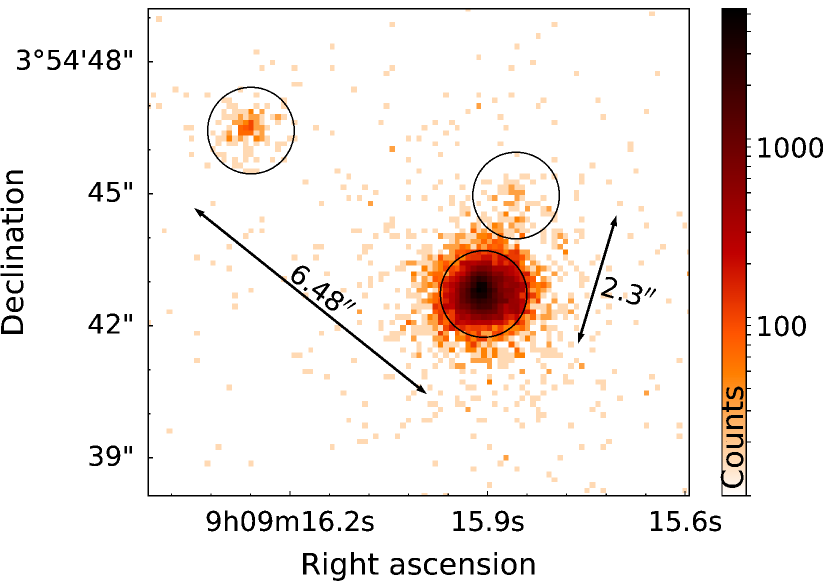
The Chandra 0.57 keV X-ray image of J0909+0354 is shown in Fig. 3, and reveals three distinct features. There is bright emission from the quasar, from a point-like source in angular distance at position angle , and emission extending from the quasar toward the NNW component at position angle . We interpret the latter feature as a kpc-scale jet, with enhanced emission at its end coincident with NNW.
To establish the reality of the jet, we performed a high fidelity simulation of the quasar, using saotrace-2.0.4_03121212http://cxc.harvard.edu/cal/Hrma/SAOTrace.html to generate rays which are passed to marx-5.5.0131313https://space.mit.edu/CXC/MARX/ (Davis et al., 2012) to simulate an ACIS-S image. We measure 9539 counts in a 14 circle around the quasar, 54 in a 24 06 box region defined between the core and NNW, and 28 in the circle around the NNW radio emission at the end of the jet. Normalizing the simulated counts to the number in the quasar (i.e. the core component), we predict that 36.5 counts from the quasar scatter into the jet box, and that 6.4 scatter into the NNW region, giving a net 17.29.5 counts for the box area, and 21.55.9 in the NNW region. Interpreting all the emission to the NNW as a single jet would result in 39.010.4 counts. With the average background of 0.03 counts, detections of X-ray photons are significant () in the box and NNW regions, either considering the emission as an ensemble continuous jet or as two separate features. Taking the dimensions of the box area and the extraction circle around NNW into account, there are counts arcsec-2 and counts arcsec-2 in the two features, respectively, implying an enhancement at the latter component.
The quasar fits a power law photon spectrum , using the galactic absorption cm-2 and also fitting an intrinsic absorption of cm-2 at the source. The measured keV flux of erg cm-2 s-1 corresponds to a luminosity of erg s-1 in the 2.1 to 30 keV rest frame band. This value is consistent with previous X-ray measurements in similar bandwidths. Interpreting all the emission to the NNW as due to an X-ray jet, it would have a photon spectrum and a flux of erg cm-2 s-1. Such a jet flux would be of the quasar flux. This is consistent with but somewhat lower than the median jet-to-core ratio from a sample of quasars at lower redshifts (Marshall et al., 2018). We cannot exclude a significant contribution to the jet flux from a point-like X-ray source at the NNW component. Taking the extraction circle of radius about the NNW region, we fit a photon spectrum . Considered as an upper limit, such a source could be contributing erg cm-2 s-1 of the flux extending to the NNW.
The source to the NE fits a power law with photon index , giving a flux erg cm-2 s-1.
4.2 Parsec-scale Structure
In the original publication of the global VLBI observations, Paragi et al. (1999) identified multiple jet components in the pc-scale radio structure of the quasar J0909+0354. However, a conclusive analysis of the jet structure extended to the north was hampered by the lack of the long north–south baselines in the global VLBI array. This resulted in a relatively poorer angular resolution in that position angle. After our re-analysis of the 1992 data, the best Gaussian fit to the visibility data provided 3 model components (Fig. 4c, Table 4). The integral flux density based on the fitted circular Gaussian model components is mJy. Since the major axis of the elongated restoring beam coincided with the jet direction, additional observations were needed for the reliable characterization of the inner jet structure in J0909+0354.
| (mJy) | (mas) | () | (mas) | ( K) | ||||
| global | core | 0 | 0 | |||||
| 1992 | A1 | |||||||
| 5 GHz | A2 | |||||||
| 4.3 GHz | core | 0 | 0 | |||||
| B1 | ||||||||
| VLBA | B2 | |||||||
| 2013 | ||||||||
| 7.6 GHz | core | 0 | 0 | |||||
| B | ||||||||
| EVN | core | 0 | 0 | |||||
| 2019 | C1 | |||||||
| 5 GHz | C2 |
The longer north–south interferometric baselines of the 2019 EVN observation resulted in a nearly circular restoring beam (Fig. 4b). Three circular Gaussian components were found as the best-fit model of the brightness distribution (Table 4). The higher north–south resolution of the EVN observations allows us to conduct a detailed analysis of the pc-scale morphology of the quasar. The jet propagates towards the north, and is clearly detectable up to mas ( pc). It becomes more diffuse with the increasing distance with respect to the core, apparently splitting into two branches like a fork at mas. The peak intensity in the image is mJy beam-1, the integral flux density of the fitted model components is mJy (within pc projected distance; Fig. 4b, Table 4).
For a qualitative comparison of the 1992 and 2019 images obtained at the same observing frequency, we restored the clean map of the most recent 2019 observations with the same elongated beam as of the 1992 global VLBI observations (Fig. 4d). The overall structure of the source is clearly similar at both epochs, with more diffuse emission detected in the outer regions of the jet in 2019 (Fig. 4c and 4d). This can be attributed to the higher sensitivity of the new EVN observations compared to the old global VLBI observations.
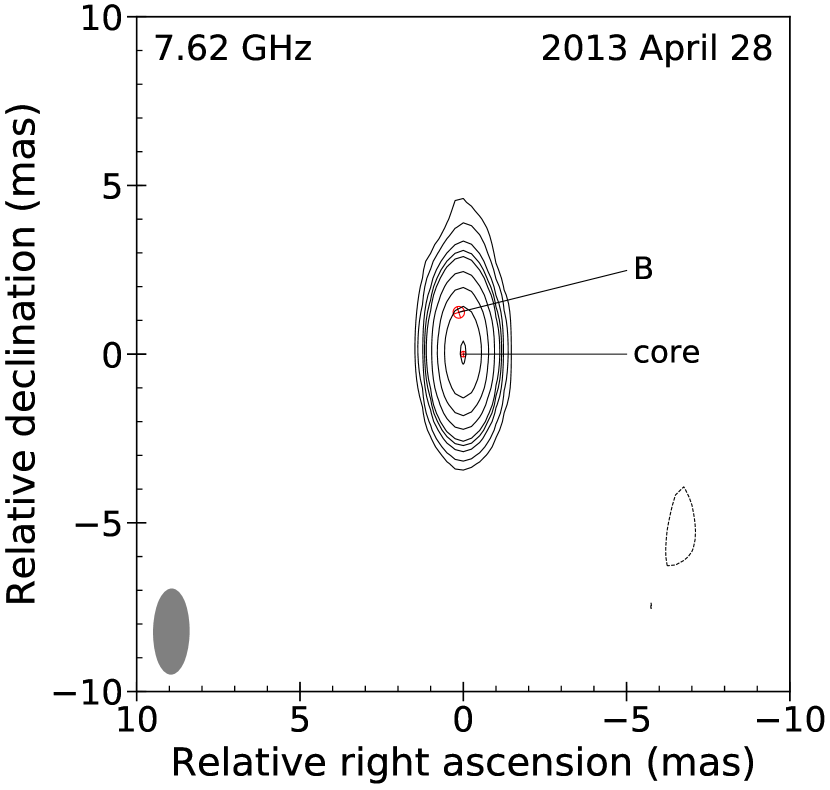
The structure of the quasar appears less resolved in the 4.3 (Fig. 4a) and 7.6 GHz VLBA (Fig. 5) images compared to the global (Fig. 4c) and EVN (Fig. 4b) measurements, due to the larger restoring beam that is more elongated to the north–south direction. However, the jet direction towards the north is still discernible. Model fitting to the 4.3-GHz VLBA data set resulted in 3 components (Table 4); the peak intensity is mJy beam-1, while the integral flux density of the model components is mJy (within pc projected distance). Our best-fit model for the 7.6 GHz VLBA data consists of 2 components (Table 4). The integral flux density of the fitted Gaussian model components is mJy (within pc projected distance), while the peak intensity of the clean map is mJy beam-1.
Using the fitted model parameters (Table 4), we calculated the apparent brightness temperatures () for the core components at each VLBI epoch, applying the
| (1) |
formula (e.g. Condon et al., 1982). Here is the flux density in Jy, is the angular size of the fitted circular Gaussian model component (full width at half maximum, FWHM) in mas, and is the observing frequency in GHz. Values for the global, VLBA and EVN observations are K, K, K, and K, respectively.
We also calculated Doppler factors according to the
| (2) |
equation, where is the intrinsic brightness temperature of the source. Lower and upper limits of the Doppler factor were given by applying K (Readhead, 1994) and K (Homan et al., 2006). The former corresponds to the equipartition state between the energy densities of the emitting plasma and the magnetic field, while the latter is a characteristic value determined for pc-scale AGN jets based on VLBI observations. The resulting values of the Doppler factor for the VLBA and EVN data sets are between and (Table 4, Cols. 8 and 9). Constrained by the upper limit on the model component FWHM of the global VLBI measurement, only lower limits were found for the values of brightness temperatures and Doppler factors in 1992.
Applying the following equation (Ghisellini et al., 1993),
| (3) |
a lower limit to the Doppler factor can be calculated, assuming that the X-ray emission originates from the synchrotron self-Compton process of the quasar jet141414This correlation is valid for a discrete jet. For a continuous jet, the transformation should be applied. In the case of J0909+0354, there is little difference between the values for the two jet models., where , , and are the flux density (Jy), frequency (GHz) and FWHM diameter (mas) of the core model component from the given VLBI observation, respectively, and are the flux density (Jy) and energy (keV) of the X-ray emission, while is the spectral index (assumed value, e.g. Ghisellini et al. 1993), GHz is the cutoff frequency of the high-energy radiation, and . Values of the inverse-Compton Doppler factor are for both the EVN and VLBA observations, while it is for the global VLBI data set, making the two independent estimates of the Doppler factor consistent with each other.
5 Discussion
5.1 Inner Jet Structure
Both the 1992 global VLBI and 2019 EVN observations show a complex pc-scale morphology with a compact core and a jet extending northwards, which is also hinted by the morphology in the GHz VLBA image (Figs. 4c, 4a, and 4b, respectively). However, as the major axis position angle of the elongated restoring beams in both the global and the VLBA snapshot observations almost perfectly coincides with the jet direction, in the following we will only discuss the jet structure in details based on the new EVN observations. The mas-scale radio image at 5 GHz (Fig. 4b) reveals a jet morphology extending up to mas (150 pc) towards the north, with respect to the core component (i.e. the synchrotron self-absorbed base of the radio jet).
The jet becomes more diffuse at mas ( pc), and apparently splits into two branches. The observed division can be explained by the radio jet interacting with a denser region of the surrounding interstellar medium (e.g., Attridge et al., 1999; Dallacasa et al., 2013). Alternatively, the fork-like morphology can be attributed to the spine–sheath structure of the jet. The model, supported by numerical simulations as well (e.g., McKinney, 2006; Komissarov et al., 2007), states that the inner region (spine) of the AGN jet propagates with relativistic speeds, while it is surrounded by a slower sub-relativistic sheath (e.g., Komissarov, 1990). Similar structure can be found in the pc-scale jets of, e.g., Mrk 501 (Giroletti et al., 2004), 3C 66A (0219+428) and 3C 380 (1828+487; Figs. 2 and 4 in Lister et al., 2013), 4C 76.03 (0404+768; Fig. 5 in Dallacasa et al., 2013), 3C 84 (Nagai et al., 2014), 1308+326 (Britzen et al., 2017), and S5 0836+710 (Vega-García et al., 2020). The spine–sheath structure has recently been reported in one of the best studied cases of the core–jet morphology in the quasar 3C 273 (Bruni et al., 2021). Seven out of these eight quasars have complex morphology on kpc scales, i.e., hotspots, multiple components, extended jets, or radio lobes (Kellermann et al., 1971; Pedlar et al., 1990; Wilkinson et al., 1991; Hummel et al., 1992; Murphy et al., 1993; Price et al., 1993; Akujor & Garrington, 1995; Xu et al., 1995; Taylor et al., 1996; Cassaro et al., 1999; Perucho et al., 2012; Perley & Meisenheimer, 2017), while 4C 76.03 has a compact structure, unresolved with the VLA (Xu et al., 1995). Similarly to our target source, J0909+0354, a single hotspot was identified in the kpc-scale jet of 3C 273 (e.g. Meisenheimer & Heavens, 1986; Perley & Meisenheimer, 2017).
The structured jet has a pronounced footprint in the linearly polarized emission (e.g. Pushkarev et al., 2005; Murphy et al., 2013), and it is also visible in the full polarized intensity in the manner of the relative brightening of the outer regions further away from the jet axis (Giroletti et al., 2004; Ghisellini et al., 2005; Nagai et al., 2014; Giovannini et al., 2018; Ros et al., 2020). The influence of external processes (such as the effect of the surrounding medium) on the observed properties of the jet are negligible in the spine–sheath model (e.g. McKinney, 2006).
A similar approach was discussed in the framework of the two-fluid jet model by Pelletier & Roland (1989), in which both the superluminal motion at pc scales, and hotspots at kpc scales are explained by an outer thermal electron–proton flow (propagating at non-relativistic speeds, called jet) and an inner relativistic electron–positron plasma (called beam). The apparent split in the pc-scale radio jet (also referred to as limb-brightening) occurs at a distance where the magnetic field becomes weaker than a critical value, hence allowing the relativistic and thermal components to interflow. The two-fluid model accounts the observed one-sidedness to the different fraction of the relativistic flow components in the jet and counter-jet (at pc scales), and thus the asymmetric re-acceleration of the thermal flow (resulting in hotspots at kpc scales), rather than the effect of Doppler-beaming/deboost. The model was recently applied to e.g. 3C 273 (Bruni et al., 2021), was proposed to explain (Kharb et al., 2015) the structure of multiple sources showing both blazar and Fanaroff–Riley type II characteristics (e.g. Landt et al., 2006; Kharb et al., 2010, 2015), and was addressed in the discussion of the blazar PKS 0735+178 which is reported to show a Fanaroff–Riley type II kpc-structure (Goyal et al., 2009).
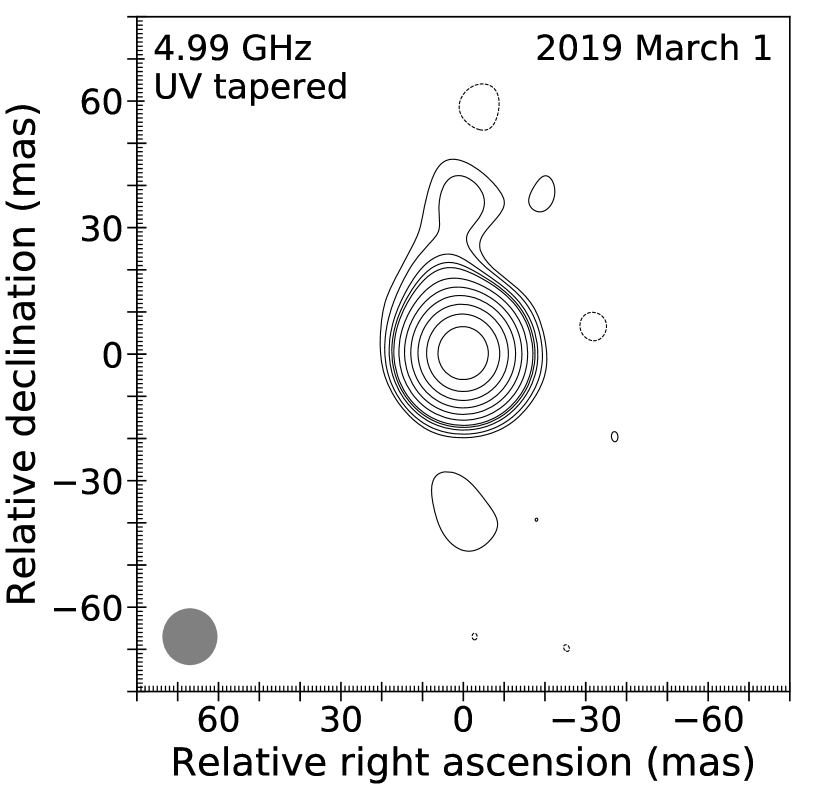
To further emphasize the diffuse emission of the pc-scale jet, we applied a Gaussian taper (i.e., a scheme where the weights of the visibilities decrease as a function of radius) with a value of 0.2 at 10 million wavelength radius to the EVN data set, and repeated the hybrid mapping and Gaussian model fitting procedure. The tapered image (Fig. 6) confirms the bending of the jet which is indicated by the weak ( mJy flux density) model component found at mas from the core (at position angle).
The relative positions of VLBI model components (Table 4) and the overall shape of the jet imply that the emission continues towards the NNW component identified in the VLA radio map (as well as in the Chandra image), but is resolved out by the EVN between -pc and kpc scales. Moreover, model component positions indicate a bending trajectory: the jet shows a slight turn towards the northwestern direction by between pc (C1) and kpc (NNW). Such apparent bending have been detected in numerous blazar jets (e.g., Conway & Murphy, 1993; Hong et al., 2004; Kharb et al., 2010; Zhao et al., 2011; Singal, 2016; Perger et al., 2018). In our case, such morphology might appear interrupted between the components C1 and NNW due to an insufficient brightness sensitivity of the observing system.
We note that the positional discrepancy between the two VLBA data sets, the absence of the outer jet component at 7.6 GHz, and the large difference between the core flux densities at the two observing frequency bands can be explained as some of the inner jet components at 7.6 GHz are blended into the core at 4.3-GHz, and that the outer components (i.e. the counterparts of B1 and B2) are too faint to be detected at 7.6 GHz due to the steepening of the spectrum of the jet further away from the core.
5.2 Jet Parameters
Brightness temperatures determined from VLBA and EVN measurements well exceed both the theoretical ( K , Readhead, 1994) and the somewhat lower empirical ( K, Homan et al., 2006) limits. The relativistic enhancement is thus clearly indicated by the high values of the Doppler factor (, ). Flux densities at different-epoch VLBI observations reveal the variability of the source at pc scales. We note that due to the improper resolution of the interferometer (i.e. the upper limit on the FWHM diameter of the core), only lower limits could be determined for the brightness temperature and Doppler factors of the global VLBI observation, therefore we excluded these data from further analysis of the jet parameters.
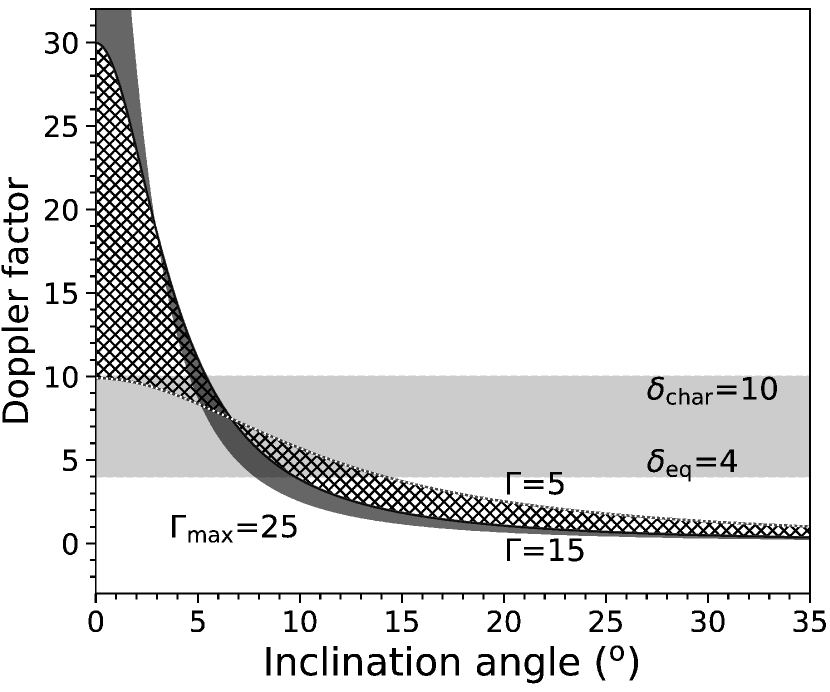
Using parameters derived from the models fitted to the visibility data of the EVN observation, we estimated the inclination angle of the jet with respect to the line of sight of the observer. We chose the value of the bulk Lorentz factor to be between and (typical values found for high-redshift AGN jets, e.g. Volonteri et al., 2011). The estimated inclination angle of the jet is in the range and assuming the values of the equipartition and empirical Doppler factors, respectively. Assuming the empirical upper limit on the bulk Lorentz factor (, determined in a pc-scale proper motion study of a large sample of AGN jets, Kellermann et al., 2004) for our calculation, the viewing angle of the jet is constrained to the ranges of and , for the equipartition and empirical Doppler factors, respectively. The possible ranges of jet parameters are illustrated in Fig 7. We note that using the inverse-Compton Doppler factor (), upper limits on the jet inclination angle of , , and can be derived by applying bulk Lorentz factors of , , and , respectively.
5.3 Radio Jet Proper Motion Based on the VLBA and EVN Measurements
Based on the circular Gaussian model components fitted to the 2013 VLBA and 2019 EVN visibility data, we estimated the apparent proper motion in the pc-scale jet of J0909+0354. Although, including the 1992 global VLBI observations could make the estimation more accurate (due to the longer time span), we do not consider this model as a starting point, because of the unfortunate network geometry.
Since both the 2013 and 2019 data are characterized by a core and two additional jet components, we assumed that the B1 and B2 components in 2013 (VLBA data, 4.3 GHz) correspond to C1 and C2 in 2019 (EVN data, 5 GHz), respectively. This is further supported by the fact that the component position angles are equal within the uncertainties (Table 4, Col. 5). Over the 5.84-yr time span, the calculated proper motion values for the components B1–C1 and B2–C2 are mas yr-1 and mas yr-1, respectively. These correspond to and apparent superluminal speeds, considering the cosmological time dilatation. Although apparent proper motion values as high as our estimates ( and ) are presented in the literature (e.g. 13 AGN with , 3 AGN with , Kellermann et al., 2004), both the lowest and highest values of the bulk Lorentz factor determined for either of the component transverse speeds ( and ) are much higher than the range of determined for AGN jets (Volonteri et al., 2011), and even the lowest value well exceeds the empirical maximum of (e.g. Kellermann et al., 2004; Lister et al., 2016; Pushkarev et al., 2017), thus making the determined proper motions rather questionable. We note that due to the slightly different frequency and the different resolutions, the apparent core position (with the core–jet emission blended together) may be different in the VLBA and EVN radio maps, resulting in an apparently different core–jet separation. In any case, new sensitive follow-up VLBI observations to be conducted at 5 GHz in the next 5–10 yr could settle the issue.
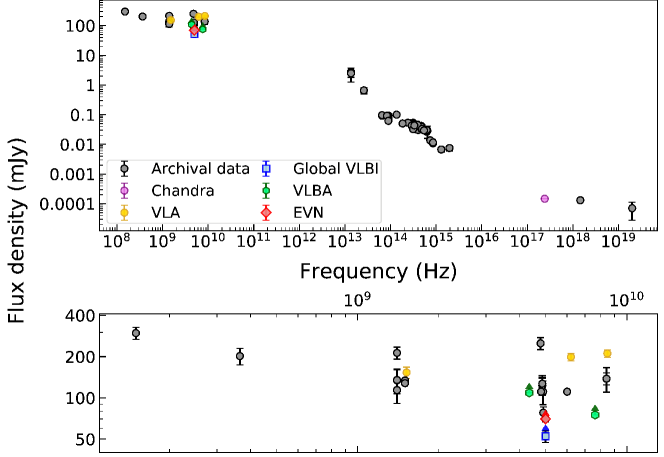
5.4 Broad-band and Radio Spectra
The broad-band and radio spectra of the quasar are shown in the upper and lower panels of Fig. 8, respectively. Data were obtained from the NASA/IPAC Extragalactic Database151515https://ned.ipac.caltech.edu/, the photometry tool of the VizieR service161616http://vizier.unistra.fr/vizier/sed/, and from Chandra, VLA, global VLBI, VLBA, and EVN observations discussed in this paper.
The differences in total flux densities at similar frequencies but different epochs can partly be attributed to the different angular resolutions of the iffnterferometer arrays (FIRST, NVSS, and CLASS, Helfand et al., 2015; Condon et al., 1998; Myers et al., 2003) and single-dish (PMN, GBT, Griffith et al., 1995; Becker et al., 1991; White & Becker, 1992; Gregory et al., 1996) observations. We fitted the logarithm of the flux density values of the entire radio waveband (from 150 MHz to GHz) with a linear curve, and found a spectral index of for the kpc-scale structure.
The flux density variability of the pc-scale emission is between the epochs of the global VLBI, VLBA, and EVN observations at GHz. We calculated radio spectral indices for the pc-scale structure using the flux densities determined from the simultaneous dual-frequency VLBA observations and the new EVN data. The power-law spectral index in the GHz frequency range is and , for the VLBA and VLBA–EVN total flux density data, respectively. Similarly, spectral indices for the core components are and . On the one hand, as the quasar shows significant flux density variability on pc scales (Table 4), these values should be treated with caution. Although parallel observations with the VLBA are not affected by variability, the steep spectrum can be the result of the different angular resolution at the two frequencies, thus the comparisons of the components and flux densities remain uncertain. On the other hand, steep spectra with were previously found for high-redshift () quasars, albeit with not Doppler-boosted radio emission (e.g. Frey et al., 2003, 2005, 2008, 2010, 2011; Coppejans et al., 2016; Cao et al., 2017), the blazar PSO 0309+27 (at , Spingola et al., 2020) between GHz and GHz frequencies, as well as J0906+6930 () in the GHz GHz frequency range (although its core spectral index flattens to below 8.4 GHz, Zhang et al., 2017).
5.5 Kpc-scale Structure: the NNW Component
As noted in subsection 4.1, the radio spectrum of the NNW component between 1.5 GHz and 8.5 GHz is consistent with its identification as a jet hotspot. Not that many high-redshift sources demonstrate well-pronounced kpc-scale jets and/or extended morphological features which might be suspected as being jets. An increasing rareness of detectable jets at both pc and kpc scales in AGN with increasing redshift is rather natural (e.g., Gurvits, 1999; Gurvits et al., 2015). Nevertheless, such examples are known: J1405+0415 at (Gurvits et al., 1992; Yang et al., 2008), J2217+0220 at (Lobanov et al., 2001), and J21340419 (Perger et al., 2018) at , to list just three of them.
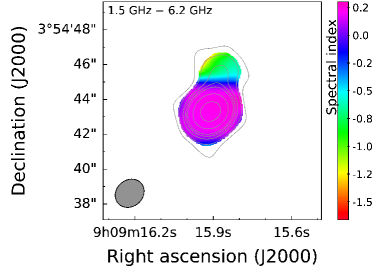
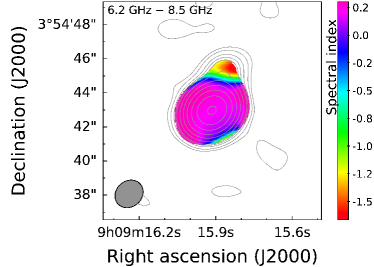
Two-point spectral indices (, , ) calculated from the VLA observations for the NNW component show a spectral steepening with increasing frequency, which is also indicated in the GHz and GHz spectral index maps in Fig. 9. Interpreting NNW as the approaching hotspot of the quasar, we expect it to have a flatter spectrum than the receding one (e.g. Dennett-Thorpe et al., 1997; Ishwara-Chandra & Saikia, 2000). Thus non-detection of the other (receding) hotspot can be explained by the fact that the spectral index difference is enhanced resulting from the small inclination angle of J0909+0354 (e.g. Dennett-Thorpe et al., 1997; Ishwara-Chandra & Saikia, 2000). We can apply the formula
| (4) |
where is the ratio of the flux densities of the approaching and receding sides of the jet, is the speed of the jet, is the jet inclination angle with respect to the line of sight of the observer, and is the spectral index of the hotspot. With (e.g. from Dennett-Thorpe et al., 1997), (upper limit calculated for J0909+0354), and single-epoch NNW spectral index , the flux density ratio for the approaching (NNW) and receding hotspots of the kpc-scale jet is . Flux densities for the hotspot on the receding side are then expected to be approximately mJy, mJy, and mJy, for the 1.5, 6.2, and 8.5 GHz frequency bands, respectively. These values are in the same order of magnitude as the rms noise of the VLA clean maps (Fig. 2), which can naturally explain the non-detection of the hotspot on the receding side of the kpc-jet by the array. Considering higher jet speeds or lower jet viewing angles results in even lower flux density estimates. The spectral steepening of NNW with increasing frequency implies radiation losses due to spectral aging (e.g. Krolik & Chen, 1991; Blundell et al., 1999; Ishwara-Chandra & Saikia, 2000; Vaddi et al., 2019).
There is an apparent contradiction between identifying NNW as a hotspot and the proposed spine-sheath feature observed on pc scales (subsection 5.1). This can be resolved by taking into account the different timescales of the pc- and kpc-scale structures. Although the injection to hotspots is expected to originate from a continuous supply of particles, there is a large physical distance between the inner jet ( pc) and the kpc-scale NNW component ( kpc). The kpc projected distance of NNW with respect to the core component translates to kpc length considering the upper limit of on the jet inclination angle. The presently observed hotspot-like characteristics are not expected to be affected by the more recent state of the pc-scale structure. Assuming the speed of the jet fueling NNW is , it takes Myr in the rest frame of the quasar for the newly developed changes in the pc-scale jet to propagate to the kpc-scale structure. The hotspot scenario is further supported by the X-ray detection of enhanced emission at the NNW region, and a jet-like feature connecting it to the core (Section 4.1). Concluding the discussion above, identification of NNW as a hotspot cannot be excluded.
5.6 Kpc-scale Structure: the NE Component
From the survey of Civano et al. (2016), the post facto probability of such an unrelated strong source being within 7″of our target is . However, with more than 300,000 distinct X-ray sources in the second Chandra source catalog (Evans et al., 2020), such a probability is not evidence of association with the quasar J0909+0354. Indeed, there is a faint source in the Pan-STARRS images coincident with the NE X-ray source. We estimate magnitudes of , respectively, from the prescription of Waters et al. (2020). An optical object is also detected at the position of the NE feature in the bands in the Dark Energy Camera Legacy Survey171717Legacy Surveys / D. Lang (Perimeter Institute), https://www.legacysurvey.org/viewer?ra=137.31786883&dec=3.91286574&layer=ls-dr9&zoom=15 (DECaLS, Dey et al., 2019). We note that, contrary to NE, the NNW component has no optical counterpart. With no radio emission at or in the direction of the NE feature, there is no evidence to associate it with J0909+0354, and we will assume here that it is a foreground or background object.
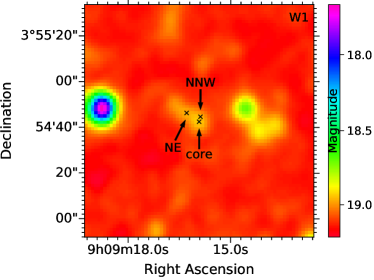
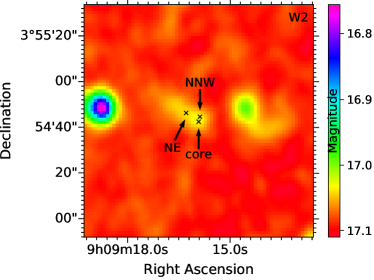
Mid-infrared WISE maps (from the AllWISE data release, Wright et al., 2010; Mainzer et al., 2011) centered at the position of J0909+0354 at m () and m () show an extended emission surrounding the core component and NE (Fig. 10; DN-to-magnitude conversion was carried out as described by Cutri et al., 2011). The emission can be traced up to ( kpc projected linear distance) with respect to the position of the core. We note that the extended emission can be a blend of individual sources located at different cosmological distances but seen in projection, considering the angular resolution of WISE ( and for and , respectively). But a physical connection between the two objects (J0909+0354 and NE) cannot be ruled out based on the data available.
6 Summary and conclusions
Using data from multi-epoch VLBI imaging experiments, we characterized the pc-scale structure of the high-redshift quasar J09090354. Fitting circular Gaussian model components to the visibility data of global VLBI, VLBA, and EVN measurements, we found a Doppler-enhanced core and multiple jet components. The inner jet is extended towards the north, i.e. appears to be related to the NNW component of the kpc-scale radio structure seen in the 1.5, 6.2, and 8.5-GHz VLA images, as well as the X-ray jet in the Chandra image. We discussed the possible nature of the NNW component, using VLA observations at 1.5, 6.2, and 8.5 GHz. Although its possible identification as a hotspot is supported by its steep radio spectrum and the X-ray detection with Chandra, the one-sidedness of the kpc-scale extended structure may challenge this interpretation. The high brightness temperatures of the core components (and hence the high Doppler factors), the estimated small viewing angles with respect to the line of sight to the observer, the bending of the jet between pc and kpc scales, and the flux density variability of the quasar are all characteristics of a blazar-type AGN. Measurements of the apparent proper motion of pc-scale jet components and determination of the jet inclination angle and bulk Lorentz factor proved to be difficult because of the unfavorable restoring beam orientation in the first-epoch VLBI experiment in 1992. Future 5-GHz VLBI observations could provide sufficient data for refining our estimates of the inner jet inclination (). The apparent jet bending between pc and kpc scales in J09090354 indicated also by our tapered EVN image could possibly be directly observable with medium-resolution ( mas) radio interferometric imaging.
Based on data from archival observations and the GHz VLA observation, we studied the radio spectrum of the quasar at kpc scales, which resulted in an overall radio spectral index of . We also determined the pc-scale spectral indices, based on the fitted model parameters to the core component of the the dual-frequency VLBA and the new EVN observations. We found the values and for the two- and three-point spectral indices, respectively. As the three-point spectral index could be considered flat (i.e. ) within the uncertainties, we conclude that the apparent spectral steepness suggested by can be attributed to the blending of flux densities of different jet components in the dual-frequency VLBA observations. Flux density variability of the source on pc scale can also play a role.
We investigated the additional X-ray component (NE) without a radio counterpart identified in the Chandra image located at separation from the quasar in the northeastern direction. A faint optical counterpart was found for the NE component in Pan-STARRS and DECaLS. We assume that this feature has no physical connection with J0909+0354. It is most likely a foreground or background object seen close to the quasar only in projection. However, the faint elongated (up to pc projected linear size) mid-infrared emission region containing both the core and NE in the m and m WISE images might suggest a physical interaction between J09090354 and another nearby X-ray and optical quasar located at the NE position. Information about the redshift of the NE source would be needed to unambiguously decide whether the two object are physically close to each other.
References
- Ahumada et al. (2020) Ahumada, R., Allende Prieto, C., Almeida, A., et al. 2020, ApJS, 249, 3, doi: 10.3847/1538-4365/ab929e
- Akujor & Garrington (1995) Akujor, C. E., & Garrington, S. T. 1995, A&AS, 112, 235
- An et al. (2020) An, T., Mohan, P., Zhang, Y., et al. 2020, Nature Communications, 11, 143, doi: 10.1038/s41467-019-14093-2
- Astropy Collaboration et al. (2013) Astropy Collaboration, Robitaille, T. P., Tollerud, E. J., et al. 2013, A&A, 558, A33, doi: 10.1051/0004-6361/201322068
- Attridge et al. (1999) Attridge, J. M., Roberts, D. H., & Wardle, J. F. C. 1999, ApJ, 518, L87, doi: 10.1086/312078
- Atwood et al. (2009) Atwood, W. B., Abdo, A. A., Ackermann, M., et al. 2009, ApJ, 697, 1071, doi: 10.1088/0004-637X/697/2/1071
- Becker et al. (1991) Becker, R. H., White, R. L., & Edwards, A. L. 1991, ApJS, 75, 1, doi: 10.1086/191529
- Blundell et al. (1999) Blundell, K. M., Rawlings, S., & Willott, C. J. 1999, AJ, 117, 677, doi: 10.1086/300721
- Breiding et al. (2017) Breiding, P., Meyer, E. T., Georganopoulos, M., et al. 2017, ApJ, 849, 95, doi: 10.3847/1538-4357/aa907a
- Brinkmann et al. (1997) Brinkmann, W., Yuan, W., & Siebert, J. 1997, A&A, 319, 413
- Britzen et al. (2017) Britzen, S., Qian, S. J., Steffen, W., et al. 2017, A&A, 602, A29, doi: 10.1051/0004-6361/201629999
- Brogan et al. (2018) Brogan, C. L., Hunter, T. R., & Fomalont, E. B. 2018, arXiv e-prints, arXiv:1805.05266. https://arxiv.org/abs/1805.05266
- Bruni et al. (2021) Bruni, G., Gómez, J. L., Vega-García, L., et al. 2021, arXiv e-prints, arXiv:2101.07324. https://arxiv.org/abs/2101.07324
- Cao et al. (2017) Cao, H. M., Frey, S., Gabányi, K. É., et al. 2017, MNRAS, 467, 950, doi: 10.1093/mnras/stx160
- Cassaro et al. (1999) Cassaro, P., Stanghellini, C., Bondi, M., et al. 1999, A&AS, 139, 601, doi: 10.1051/aas:1999511
- Chambers et al. (2016) Chambers, K. C., Magnier, E. A., Metcalfe, N., et al. 2016, arXiv e-prints, arXiv:1612.05560. https://arxiv.org/abs/1612.05560
- Civano et al. (2016) Civano, F., Marchesi, S., Comastri, A., et al. 2016, ApJ, 819, 62, doi: 10.3847/0004-637X/819/1/62
- Condon et al. (1982) Condon, J. J., Condon, M. A., Gisler, G., & Puschell, J. J. 1982, ApJ, 252, 102, doi: 10.1086/159538
- Condon et al. (1998) Condon, J. J., Cotton, W. D., Greisen, E. W., et al. 1998, AJ, 115, 1693, doi: 10.1086/300337
- Conway & Murphy (1993) Conway, J. E., & Murphy, D. W. 1993, ApJ, 411, 89, doi: 10.1086/172809
- Coppejans et al. (2016) Coppejans, R., Frey, S., Cseh, D., et al. 2016, MNRAS, 463, 3260, doi: 10.1093/mnras/stw2236
- Cutri et al. (2011) Cutri, R. M., Wright, E. L., Conrow, T., et al. 2011, Explanatory Supplement to the WISE Preliminary Data Release Products
- Cutri et al. (2014) Cutri et al., R. M. 2014, VizieR Online Data Catalog, II/328
- Dallacasa et al. (2013) Dallacasa, D., Orienti, M., Fanti, C., Fanti, R., & Stanghellini, C. 2013, MNRAS, 433, 147, doi: 10.1093/mnras/stt710
- Davis et al. (2012) Davis, J. E., Bautz, M. W., Dewey, D., et al. 2012, in Society of Photo-Optical Instrumentation Engineers (SPIE) Conference Series, Vol. 8443, Space Telescopes and Instrumentation 2012: Ultraviolet to Gamma Ray, ed. T. Takahashi, S. S. Murray, & J.-W. A. den Herder, 84431A, doi: 10.1117/12.926937
- Delvecchio et al. (2017) Delvecchio, I., Smolčić, V., Zamorani, G., et al. 2017, A&A, 602, A3, doi: 10.1051/0004-6361/201629367
- Dennett-Thorpe et al. (1997) Dennett-Thorpe, J., Bridle, A. H., Scheuer, P. A. G., Laing, R. A., & Leahy, J. P. 1997, MNRAS, 289, 753, doi: 10.1093/mnras/289.4.753
- Dey et al. (2019) Dey, A., Schlegel, D. J., Lang, D., et al. 2019, AJ, 157, 168, doi: 10.3847/1538-3881/ab089d
- Diamond (1995) Diamond, P. J. 1995, in Astronomical Society of the Pacific Conference Series, Vol. 82, Very Long Baseline Interferometry and the VLBA, ed. J. A. Zensus, P. J. Diamond, & P. J. Napier, 227
- Doe et al. (2007) Doe, S., Nguyen, D., Stawarz, C., et al. 2007, in Astronomical Society of the Pacific Conference Series, Vol. 376, Astronomical Data Analysis Software and Systems XVI, ed. R. A. Shaw, F. Hill, & D. J. Bell, 543
- Donato et al. (2005) Donato, D., Sambruna, R. M., & Gliozzi, M. 2005, A&A, 433, 1163, doi: 10.1051/0004-6361:20034555
- Dunlop & Peacock (1990) Dunlop, J. S., & Peacock, J. A. 1990, MNRAS, 247, 19
- Evans et al. (2020) Evans, I. N., Primini, F. A., Miller, J. B., et al. 2020, in American Astronomical Society Meeting Abstracts, Vol. 235, American Astronomical Society Meeting Abstracts #235, 154.05
- Frey et al. (2008) Frey, S., Gurvits, L. I., Paragi, Z., & É. Gabányi, K. 2008, A&A, 484, L39, doi: 10.1051/0004-6361:200810040
- Frey et al. (2003) Frey, S., Mosoni, L., Paragi, Z., & Gurvits, L. I. 2003, MNRAS, 343, L20, doi: 10.1046/j.1365-8711.2003.06869.x
- Frey et al. (2015) Frey, S., Paragi, Z., Fogasy, J. O., & Gurvits, L. I. 2015, MNRAS, 446, 2921, doi: 10.1093/mnras/stu2294
- Frey et al. (2010) Frey, S., Paragi, Z., Gurvits, L. I., Cseh, D., & Gabányi, K. É. 2010, A&A, 524, A83, doi: 10.1051/0004-6361/201015554
- Frey et al. (2011) Frey, S., Paragi, Z., Gurvits, L. I., Gabányi, K. É., & Cseh, D. 2011, A&A, 531, L5, doi: 10.1051/0004-6361/201117341
- Frey et al. (2005) Frey, S., Paragi, Z., Mosoni, L., & Gurvits, L. I. 2005, A&A, 436, L13, doi: 10.1051/0004-6361:200500112
- Fruscione et al. (2006) Fruscione, A., McDowell, J. C., Allen, G. E., et al. 2006, in Society of Photo-Optical Instrumentation Engineers (SPIE) Conference Series, Vol. 6270, Society of Photo-Optical Instrumentation Engineers (SPIE) Conference Series, ed. D. R. Silva & R. E. Doxsey, 62701V, doi: 10.1117/12.671760
- Gaia Collaboration et al. (2016) Gaia Collaboration, Brown, A. G. A., Vallenari, A., et al. 2016, A&A, 595, A2, doi: 10.1051/0004-6361/201629512
- Gaia Collaboration et al. (2018) —. 2018, A&A, 616, A1, doi: 10.1051/0004-6361/201833051
- Ghisellini et al. (1993) Ghisellini, G., Padovani, P., Celotti, A., & Maraschi, L. 1993, ApJ, 407, 65, doi: 10.1086/172493
- Ghisellini et al. (2005) Ghisellini, G., Tavecchio, F., & Chiaberge, M. 2005, A&A, 432, 401, doi: 10.1051/0004-6361:20041404
- Giovannini et al. (2018) Giovannini, G., Savolainen, T., Orienti, M., et al. 2018, Nature Astronomy, 2, 472, doi: 10.1038/s41550-018-0431-2
- Giroletti et al. (2004) Giroletti, M., Giovannini, G., Feretti, L., et al. 2004, ApJ, 600, 127, doi: 10.1086/379663
- Gobeille et al. (2014) Gobeille, D. B., Wardle, J. F. C., & Cheung, C. C. 2014, arXiv e-prints, arXiv:1406.4797. https://arxiv.org/abs/1406.4797
- Goldstein et al. (2013) Goldstein, A., Preece, R. D., Mallozzi, R. S., et al. 2013, ApJS, 208, 21, doi: 10.1088/0067-0049/208/2/21
- Goyal et al. (2009) Goyal, A., Gopal-Krishna, Anupama, G. C., et al. 2009, MNRAS, 399, 1622, doi: 10.1111/j.1365-2966.2009.15385.x
- Gregory et al. (1996) Gregory, P. C., Scott, W. K., Douglas, K., & Condon, J. J. 1996, ApJS, 103, 427, doi: 10.1086/192282
- Greisen (2003) Greisen, E. W. 2003, in Astrophysics and Space Science Library, Vol. 285, Information Handling in Astronomy - Historical Vistas, ed. A. Heck, 109, doi: 10.1007/0-306-48080-8_7
- Griffith et al. (1995) Griffith, M. R., Wright, A. E., Burke, B. F., & Ekers, R. D. 1995, ApJS, 97, 347, doi: 10.1086/192146
- Gurvits (1999) Gurvits, L. I. 1999, in Perspectives on Radio Astronomy: Science with Large Antenna Arrays, ed. M. P. van Harlem, 183–190, doi: http://adsabs.harvard.edu/pdf/2000pras.conf..183G
- Gurvits et al. (2015) Gurvits, L. I., Frey, S., & Paragi, Z. 2015, in Extragalactic Jets from Every Angle, ed. F. Massaro, C. C. Cheung, E. Lopez, & A. Siemiginowska, Vol. 313, 327–328, doi: 10.1017/S1743921315002434
- Gurvits et al. (1992) Gurvits, L. I., Kardashev, N. S., Popov, M. V., et al. 1992, A&A, 260, 82
- Gurvits et al. (1999) Gurvits, L. I., Kellermann, K. I., & Frey, S. 1999, A&A, 342, 378. https://arxiv.org/abs/astro-ph/9812018
- Harris et al. (2017) Harris, D. E., Lee, N. P., Schwartz, D. A., et al. 2017, ApJ, 846, 119, doi: 10.3847/1538-4357/aa845c
- Helfand et al. (2015) Helfand, D. J., White, R. L., & Becker, R. H. 2015, ApJ, 801, 26, doi: 10.1088/0004-637X/801/1/26
- Högbom (1974) Högbom, J. A. 1974, A&AS, 15, 417
- Homan et al. (2006) Homan, D. C., Kovalev, Y. Y., Lister, M. L., et al. 2006, ApJ, 642, L115, doi: 10.1086/504715
- Hong et al. (2004) Hong, X. Y., Jiang, D. R., Gurvits, L. I., et al. 2004, A&A, 417, 887, doi: 10.1051/0004-6361:20031784
- Hummel et al. (1992) Hummel, C. A., Muxlow, T. W. B., Krichbaum, T. P., et al. 1992, A&A, 266, 93
- Hunter (2007) Hunter, J. D. 2007, Computing in Science and Engineering, 9, 90, doi: 10.1109/MCSE.2007.55
- Ishwara-Chandra & Saikia (2000) Ishwara-Chandra, C. H., & Saikia, D. J. 2000, MNRAS, 317, 658, doi: 10.1046/j.1365-8711.2000.03677.x
- Joye & Mandel (2005) Joye, W. A., & Mandel, E. 2005, in Astronomical Society of the Pacific Conference Series, Vol. 347, Astronomical Data Analysis Software and Systems XIV, ed. P. Shopbell, M. Britton, & R. Ebert, 110
- Kanbach et al. (1989) Kanbach, G., Bertsch, D. L., Fichtel, C. E., et al. 1989, Space Sci. Rev., 49, 69, doi: 10.1007/BF00173744
- Kellermann et al. (1971) Kellermann, K. I., Jauncey, D. L., Cohen, M. H., et al. 1971, ApJ, 169, 1, doi: 10.1086/151113
- Kellermann et al. (2004) Kellermann, K. I., Lister, M. L., Homan, D. C., et al. 2004, ApJ, 609, 539, doi: 10.1086/421289
- Kharb et al. (2010) Kharb, P., Lister, M. L., & Cooper, N. J. 2010, ApJ, 710, 764, doi: 10.1088/0004-637X/710/1/764
- Kharb et al. (2015) Kharb, P., Stanley, E., Lister, M., et al. 2015, in Extragalactic Jets from Every Angle, ed. F. Massaro, C. C. Cheung, E. Lopez, & A. Siemiginowska, Vol. 313, 211–218, doi: 10.1017/S1743921315002203
- Komissarov (1990) Komissarov, S. S. 1990, Soviet Astronomy Letters, 16, 284
- Komissarov et al. (2007) Komissarov, S. S., Barkov, M. V., Vlahakis, N., & Königl, A. 2007, MNRAS, 380, 51, doi: 10.1111/j.1365-2966.2007.12050.x
- Kovalev et al. (2005) Kovalev, Y. Y., Kellermann, K. I., Lister, M. L., et al. 2005, AJ, 130, 2473, doi: 10.1086/497430
- Krolik & Chen (1991) Krolik, J. H., & Chen, W. 1991, AJ, 102, 1659, doi: 10.1086/115985
- Landt et al. (2006) Landt, H., Perlman, E. S., & Padovani, P. 2006, ApJ, 637, 183, doi: 10.1086/498261
- Lawrence et al. (2007) Lawrence, A., Warren, S. J., Almaini, O., et al. 2007, MNRAS, 379, 1599, doi: 10.1111/j.1365-2966.2007.12040.x
- Lee et al. (2013) Lee, K.-G., Bailey, S., Bartsch, L. E., et al. 2013, AJ, 145, 69, doi: 10.1088/0004-6256/145/3/69
- Lee et al. (2008) Lee, S.-S., Lobanov, A. P., Krichbaum, T. P., et al. 2008, AJ, 136, 159, doi: 10.1088/0004-6256/136/1/159
- Lister et al. (2013) Lister, M. L., Aller, M. F., Aller, H. D., et al. 2013, AJ, 146, 120, doi: 10.1088/0004-6256/146/5/120
- Lister et al. (2016) —. 2016, AJ, 152, 12, doi: 10.3847/0004-6256/152/1/12
- Lobanov et al. (2001) Lobanov, A. P., Gurvits, L. I., Frey, S., et al. 2001, ApJ, 547, 714, doi: 10.1086/318391
- Lucchini et al. (2017) Lucchini, M., Tavecchio, F., & Ghisellini, G. 2017, MNRAS, 466, 4299, doi: 10.1093/mnras/stw3316
- Lusso & Risaliti (2017) Lusso, E., & Risaliti, G. 2017, A&A, 602, A79, doi: 10.1051/0004-6361/201630079
- Mainzer et al. (2011) Mainzer, A., Bauer, J., Grav, T., et al. 2011, ApJ, 731, 53, doi: 10.1088/0004-637X/731/1/53
- Marshall et al. (2018) Marshall, H. L., Gelbord, J. M., Worrall, D. M., et al. 2018, ApJ, 856, 66, doi: 10.3847/1538-4357/aaaf66
- Martin et al. (2005) Martin, D. C., Fanson, J., Schiminovich, D., et al. 2005, ApJ, 619, L1, doi: 10.1086/426387
- McKinney (2006) McKinney, J. C. 2006, MNRAS, 368, 1561, doi: 10.1111/j.1365-2966.2006.10256.x
- McMullin et al. (2007) McMullin, J. P., Waters, B., Schiebel, D., Young, W., & Golap, K. 2007, in Astronomical Society of the Pacific Conference Series, Vol. 376, Astronomical Data Analysis Software and Systems XVI, ed. R. A. Shaw, F. Hill, & D. J. Bell, 127
- Meegan et al. (1998) Meegan, C. A., Paciesas, W. S., Pendleton, G. N., et al. 1998, in American Institute of Physics Conference Series, Vol. 428, Gamma-Ray Bursts, 4th Hunstville Symposium, ed. C. A. Meegan, R. D. Preece, & T. M. Koshut, 3–9, doi: 10.1063/1.55355
- Meisenheimer & Heavens (1986) Meisenheimer, K., & Heavens, A. F. 1986, Nature, 323, 419, doi: 10.1038/323419a0
- Murphy et al. (1993) Murphy, D. W., Browne, I. W. A., & Perley, R. A. 1993, MNRAS, 264, 298, doi: 10.1093/mnras/264.2.298
- Murphy et al. (2013) Murphy, E., Cawthorne, T. V., & Gabuzda, D. C. 2013, MNRAS, 430, 1504, doi: 10.1093/mnras/sts561
- Myers et al. (2003) Myers, S. T., Jackson, N. J., Browne, I. W. A., et al. 2003, MNRAS, 341, 1, doi: 10.1046/j.1365-8711.2003.06256.x
- Nagai et al. (2014) Nagai, H., Haga, T., Giovannini, G., et al. 2014, ApJ, 785, 53, doi: 10.1088/0004-637X/785/1/53
- Oh et al. (2018) Oh, K., Koss, M., Markwardt, C. B., et al. 2018, ApJS, 235, 4, doi: 10.3847/1538-4365/aaa7fd
- Paragi et al. (1999) Paragi, Z., Frey, S., Gurvits, L. I., et al. 1999, A&A, 344, 51
- Pearson (1995) Pearson, T. J. 1995, in Astronomical Society of the Pacific Conference Series, Vol. 82, Very Long Baseline Interferometry and the VLBA, ed. J. A. Zensus, P. J. Diamond, & P. J. Napier, 267
- Pedlar et al. (1990) Pedlar, A., Ghataure, H. S., Davies, R. D., et al. 1990, MNRAS, 246, 477
- Pelletier & Roland (1989) Pelletier, G., & Roland, J. 1989, A&A, 224, 24
- Perger et al. (2018) Perger, K., Frey, S., Gabányi, K. É., et al. 2018, MNRAS, 477, 1065, doi: 10.1093/mnras/sty837
- Perley & Meisenheimer (2017) Perley, R. A., & Meisenheimer, K. 2017, A&A, 601, A35, doi: 10.1051/0004-6361/201629704
- Perucho et al. (2012) Perucho, M., Martí-Vidal, I., Lobanov, A. P., & Hardee, P. E. 2012, A&A, 545, A65, doi: 10.1051/0004-6361/201219785
- Petrov (2021) Petrov, L. 2021, AJ, 161, 14, doi: 10.3847/1538-3881/abc4e1
- Petrov et al. (2011) Petrov, L., Kovalev, Y. Y., Fomalont, E. B., & Gordon, D. 2011, AJ, 142, 35, doi: 10.1088/0004-6256/142/2/35
- Price et al. (1993) Price, R., Gower, A. C., Hutchings, J. B., et al. 1993, ApJS, 86, 365, doi: 10.1086/191783
- Pushkarev et al. (2005) Pushkarev, A. B., Gabuzda, D. C., Vetukhnovskaya, Y. N., & Yakimov, V. E. 2005, MNRAS, 356, 859, doi: 10.1111/j.1365-2966.2004.08535.x
- Pushkarev et al. (2017) Pushkarev, A. B., Kovalev, Y. Y., Lister, M. L., & Savolainen, T. 2017, MNRAS, 468, 4992, doi: 10.1093/mnras/stx854
- Readhead (1994) Readhead, A. C. S. 1994, ApJ, 426, 51, doi: 10.1086/174038
- Roming et al. (2005) Roming, P. W. A., Kennedy, T. E., Mason, K. O., et al. 2005, Space Sci. Rev., 120, 95, doi: 10.1007/s11214-005-5095-4
- Ros et al. (2020) Ros, E., Kadler, M., Perucho, M., et al. 2020, A&A, 633, L1, doi: 10.1051/0004-6361/201937206
- Schwab & Cotton (1983) Schwab, F. R., & Cotton, W. D. 1983, AJ, 88, 688, doi: 10.1086/113360
- Schwartz et al. (2019) Schwartz, D., Siemiginowska, A., Worrall, D., et al. 2019, Astronomische Nachrichten, 340, 30, doi: 10.1002/asna.201913554
- Schwartz (2002) Schwartz, D. A. 2002, ApJ, 569, L23, doi: 10.1086/340482
- Schwartz et al. (2020) Schwartz, D. A., Siemiginowska, A., Snios, B., et al. 2020, ApJ, 904, 57, doi: 10.3847/1538-4357/abbd99
- Shepherd (1997) Shepherd, M. C. 1997, in Astronomical Society of the Pacific Conference Series, Vol. 125, Astronomical Data Analysis Software and Systems VI, ed. G. Hunt & H. Payne, 77
- Singal (2016) Singal, A. K. 2016, ApJ, 827, 66, doi: 10.3847/0004-637X/827/1/66
- Spingola et al. (2020) Spingola, C., Dallacasa, D., Belladitta, S., et al. 2020, A&A, 643, L12, doi: 10.1051/0004-6361/202039458
- Tavani et al. (2009) Tavani, M., Barbiellini, G., Argan, A., et al. 2009, A&A, 502, 995, doi: 10.1051/0004-6361/200810527
- Taylor et al. (1996) Taylor, G. B., Vermeulen, R. C., Readhead, A. C. S., et al. 1996, ApJS, 107, 37, doi: 10.1086/192354
- Thompson et al. (1993) Thompson, D. J., Bertsch, D. L., Fichtel, C. E., et al. 1993, ApJS, 86, 629, doi: 10.1086/191793
- Vaddi et al. (2019) Vaddi, S., Kharb, P., Daly, R. A., et al. 2019, MNRAS, 484, 385, doi: 10.1093/mnras/sty3494
- Vanden Berk et al. (2020) Vanden Berk, D. E., Wesolowski, S. C., Yeckley, M. J., et al. 2020, MNRAS, 493, 2745, doi: 10.1093/mnras/staa411
- Vega-García et al. (2020) Vega-García, L., Lobanov, A. P., Perucho, M., et al. 2020, A&A, 641, A40, doi: 10.1051/0004-6361/201935168
- Véron-Cetty & Véron (1993) Véron-Cetty, M. P., & Véron, P. 1993, ESO Scientific Report, No. 13
- Volonteri et al. (2011) Volonteri, M., Haardt, F., Ghisellini, G., & Della Ceca, R. 2011, MNRAS, 416, 216, doi: 10.1111/j.1365-2966.2011.19024.x
- Wang et al. (2021) Wang, F., Yang, J., Fan, X., et al. 2021, ApJ, 907, L1, doi: 10.3847/2041-8213/abd8c6
- Waters et al. (2020) Waters, C. Z., Magnier, E. A., Price, P. A., et al. 2020, ApJS, 251, 4, doi: 10.3847/1538-4365/abb82b
- White & Becker (1992) White, R. L., & Becker, R. H. 1992, ApJS, 79, 331, doi: 10.1086/191656
- Wilkinson et al. (1991) Wilkinson, P. N., Akujor, C. E., Cornwell, T. J., & Saikia, D. J. 1991, MNRAS, 248, 86, doi: 10.1093/mnras/248.1.86
- Winkler et al. (2003) Winkler, C., Courvoisier, T. J. L., Di Cocco, G., et al. 2003, A&A, 411, L1, doi: 10.1051/0004-6361:20031288
- Wright et al. (2010) Wright, E. L., Eisenhardt, P. R. M., Mainzer, A. K., et al. 2010, AJ, 140, 1868, doi: 10.1088/0004-6256/140/6/1868
- Xu et al. (1995) Xu, W., Readhead, A. C. S., Pearson, T. J., Polatidis, A. G., & Wilkinson, P. N. 1995, ApJS, 99, 297, doi: 10.1086/192189
- Yang et al. (2008) Yang, J., Gurvits, L. I., Lobanov, A. P., Frey, S., & Hong, X. Y. 2008, A&A, 489, 517, doi: 10.1051/0004-6361:200809846
- Yershov (2014) Yershov, V. N. 2014, Ap&SS, 354, 97, doi: 10.1007/s10509-014-1944-5
- Zhang et al. (2020) Zhang, Y., An, T., & Frey, S. 2020, Science Bulletin, 65, 525, doi: 10.1016/j.scib.2020.01.008
- Zhang et al. (2017) Zhang, Y., An, T., Frey, S., et al. 2017, MNRAS, 468, 69, doi: 10.1093/mnras/stx392
- Zhao et al. (2011) Zhao, W., Hong, X. Y., An, T., et al. 2011, A&A, 529, A113, doi: 10.1051/0004-6361/201016192