Evolution of Berry curvature and Reentrant Quantum Anomalous Hall Effect in an Intrinsic Magnetic Topological Insulator
Abstract
Recently, the magnetic topological insulator (TI) MnBi2Te4 emerged as a competitive
platform to realize quantum anomalous Hall (QAH) states. We report a Berry-curvature splitting mechanism to realize the QAH effect in the disordered magnetic TI multilayers when switching from an antiferromagnetic order to a ferromagnetic order. We reveal that the splitting of spin-resolved Berry curvature, originating from the separation of the critical points during the magnetic switching, can give rise to a QAH insulator. We present a global phase diagram, and also provide a phenomenological picture to elucidate the Berry curvature splitting mechanism by the evolution of topological charges. At last, we predict that the Berry curvature splitting mechanism will lead to a reentrant QAH effect, which can be detected by tuning the gate voltage. Our theory will be instructive for the studies of the QAH effect in MnBi2Te4 in future experiments.
quantum anomalous Hall effect, Berry curvature, disorder, localization
pacs:
72.15.Rn, 73.20.Fz, 73.21.-b, 73.43.-fIntroduction.— The quantum anomalous Hall (QAH) state was proposed as a novel quantum state that exhibits quantized Hall conductance from topologically nontrivial bands rather than Landau levels Haldane (1988). Experimentally, the QAH state was initially realized in Cr-doped (Bi,Sb)2Te3 thin films, where the band gap is inverted by the Zeeman splitting Liu et al. (2008); Yu et al. (2010); Chang et al. (2013); Checkelsky et al. (2014); Kou et al. (2014); Liu et al. (2016); He et al. (2018). However, the QAH effect in a magnetically doped topological insulator (TI) occurs at very low temperatures due to inhomogeneity introduced by magnetic dopants. Recently, a breakthrough was made in realization of an intrinsic magnetic TI in a van der Waals layered material MnBi2Te4 Gong et al. (2019); Zhang et al. (2019); Li et al. (2019a); Otrokov et al. (2019a); Vidal et al. (2019a); Hu et al. (2020a); Wu et al. (2019); Li et al. (2019b); Chen et al. (2019a); Vidal et al. (2019b); Shi et al. (2019); Ding et al. (2020); Hu et al. (2020b); Xu et al. (2020); Tian et al. (2020); Hao et al. (2019); Ge et al. (2020); Liu et al. (2020); Deng et al. (2020a). MnBi2Te4 exhibits antiferromagnetic (AFM) order and supports an axion insulator state without an external magnetic field. Applying the magnetic field to drive a transition from an AFM order to a ferromagnetic (FM) order can result in a quantum phase transition from an axion insulator to a QAH state in the even-number septuple-layered MnBi2Te4 Liu et al. (2020); Deng et al. (2020a); Otrokov et al. (2019b); Deng et al. (2020b). Meanwhile, the QAH state was also observed in the odd-number septuple-layered MnBi2Te4, but the quantization of Hall resistance strongly depends on disorder and external magnetic fields Deng et al. (2020a). This implies that disorder and magnetization are two key ingredients to determine and manipulate the QAH effect in this intrinsic magnetic TI material Anderson (1958); Abrahams et al. (1979); Belitz and Kirkpatrick (1994); Onoda and Nagaosa (2003); Qiao et al. (2016); Chen et al. (2019b); Li and Cheng (2021) . More importantly, it remains an open question that the onset temperature of the QAH in MnBi2Te4 is still an order of magnitude smaller than the inverted band gap Deng et al. (2020a). Therefore, it is crucial to understand the origin of the QAH state and disorder effects in the few-layer MnBi2Te4 during the magnetic switching.
In this article, we propose a mechanism of the QAH effect in the few-layer magnetic TI MnBi2Te4. We reveal that the splitting of spin-resolved Berry curvature during the magnetic reversal can give rise to a QAH insulator phase even without closing the global energy gap in the disordered magnetic TI. This is in contrast to the band inversion mechanism of the clean QAH insulator, which always involves the closing and reopening of the bulk gap Yu et al. (2010). We further show that the Berry curvature can only be carried by the conducting states near the critical points and thus they are separated with increasing Zeeman splitting. This suggests that the disorder-induced critical points play a key role in realizing the QAH state in disordered magnetic TIs. We provide a phenomenological theory based on the evolution of topological charges at the critical points to interpret the creation of the QAH phase. At last, we predict a reentrant QAH effect, i.e. a QAH-normal insulator-QAH transition, to verify our theory in future transport experiments.
Model Hamiltonian.— The Hamiltonian of few-layer MnBi2Te4 at the point can be written as Zhang et al. (2020); Lian et al. (2020); Zhang et al. (2019); Li et al. (2021)
with the nonmagnetic part and the FM part of the effective Hamiltonian given by
and
in the four-orbital basis of , , and . Here we introduce a dimensionless magnetization strength to describe the evolution from an AFM phase at to a FM phase at . The mass terms are and , and the wave vectors are , with the model parameters , , , and Lian et al. (2020). denotes inversion-symmetry breaking potential strength. If , the system reduces to the Bernevig-Hughes-Zhang model describing a 2D TI with a pair of helical edge modes when Bernevig et al. (2006). Such a pair of helical edge modes has been recently observed by transport measurement in MnBi2Te4 multilayers Lin et al. (2021); Liu et al. (2021), and we focus on and in the following. Other parameters are set as , , , and unless specified Zhang et al. (2019) and is discretized into a square lattice with a lattice constant .
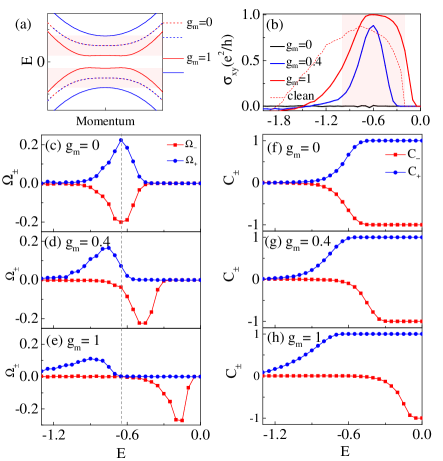
Figure 1(a) plots the energy spectrum of the Hamiltonian with . For the AFM phase with , the spectrum is double degenerated (see the dashed lines) due to the coexistence of an effective time-reversal symmetry and inversion symmetry. When turning on the FM term with , the two degenerate bands split and leave an energy spacing between them (see the solid blue, red lines and red shaded region). In the following, we will show that the interplay of the band splitting and the disorder induced localization effect can give rise to a QAH insulator phase in the red shaded region without closing the global energy gap. Here, the magnetic disorder that dominates in magnetic TI is included as , where the random potential with disorder strength and the Pauli matrix acting on the spin degrees of freedom.
QAH insulator from Berry curvature splitting.— To characterize the QAH effect of MnBi2Te4 in the presence of the magnetic disorder , we adopt the zero-temperature Hall conductance defined as . Here the spin-polarized Chern number is evaluated by the real-space noncommutative Kubo formula Prodan (2009, 2011); Sheng et al. (2005, 2006)
| (3) | |||||
imposing the periodic boundary condition in both and directions. is ensemble averaged over random configurations, and (, ) denotes the position operator. is the spectral projector onto the positive () or negative () eigenvalue of , where is the projector onto the state of eigenenergy and .
Figure 1(b) depicts the disorder-averaged zero-temperature Hall conductance as a function of the Fermi energy for various magnetization . We fix the disorder strength and only show the part since the part is the same due to particle-hole symmetry. For the AFM phase with , the system preserves an averaged time-reversal symmetry and thus the Hall conductance approaches zero. Note that the averaged time-reversal symmetry means that time-reversal symmetry, which is violated by magnetic disorder, remains unbroken on average Fu and Kane (2012). When we turn on the magnetization , grows and exhibits a peak near when , and it is fully quantized to be when , meaning that a QAH insulator phase shows up (in the red region). For comparison, we also show at for a clean sample () (see the red dashed line). Apparently, is non-quantized in this case and the system behaviors as as an anomalous Hall metal Chen et al. (2020). This suggests the disorder plays an important role and can lead to the QAH insulator from a metal in the red region [see Fig 1(b)].
To elucidate the origin of the QAH insulator phase in Fig. 1(b), we investigate the spin-polarized Berry curvature and the spin-polarized Chern number in Figs. 1(c-h). At , one can see that the Berry curvature shows two peaks of opposite values at in Fig. 1(c). Meanwhile, the spin-polarized Chern numbers show a Heaviside function behavior with in Fig. 1(f). Here the spin-polarized Chern numbers originate from the topological nature of the 2D TI, which has been recently observed by transport measurement of MnBi2Te4 multilayers Lin et al. (2021); Liu et al. (2021). By increasing , the two peaks of the Berry curvature separate as shown in Figs. 1(d-e) and therefore the two Chern numbers with opposite sign are no longer symmetric with respect to zero [see Figs. 1(g-h)]. This gives rise to a net Hall conductance plateau near when in Fig. 1(b). As a result, we conclude that that the QAH insulator found above results from the Berry curvature splitting caused by disorder and Zeeman splitting.
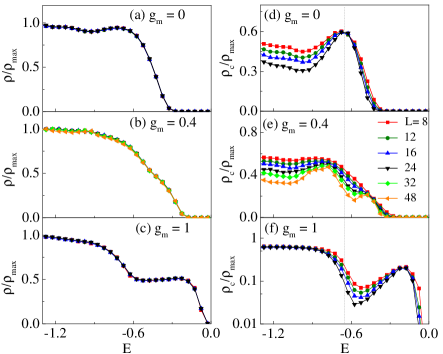
Next, let us explore the relation between the Berry curvature and the conducting states. The localized and extended states can be distinguished by smooth changes in boundary conditions of the wave function Arovas et al. (1988); Huo and Bhatt (1992); Zhu et al. (2019). The total density of states and the density of conducting states for a sample with size are defined as and , where and are the total number of states and the number of conducting states at , respectively.
In Figs. 2(a-c), the density of state spreads towards the band gap with increasing thanks to the splitting of two generate bands. However, the band gap does not close as the magnetization increases from to , implying the QAH insulator in Fig.1 cannot be attributed to the band inversion. For comparison, we plot the density of conducting states against for different in Figs. 2(d-f). Generally, the decrease in with the system size indicates an insulating phase since the density of conducting states goes to zero in the large limit, while does not change with at the critical point. When , there are two double generate critical points at due to the averaged time-reversal symmetry. They split and move to and when , and then to and when . This leads to a mobility gap between two critical points since is nonzero [see Figs. 2(b-c)]. The quantized Hall conductance region in Fig. 1(b) is exactly the same as the mobility gap region, which verifies that the QAH insulator results from the splitting the Berry curvature without closing the global energy gap in the disordered magnetic TI. We would like to emphasize that the critical point positions of are consistent with the peak positions of the Berry curvatures in Figs. 1(c-e). This demonstrates that the Berry curvature is only carried by the conducting states.
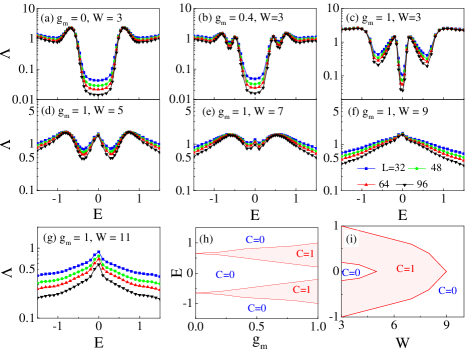
Phase diagram and phenomenological theory.– To gain the global phase structure, we perform the finite-size scaling analysis of the localization length to obtain the phase diagrams of the magnetic TI. The localization length can be evaluated by the standard transfer matrix method using a long cylinder sample of with the periodic boundary condition in the direction and the open boundary condition in the direction MacKinnon and Kramer (1981, 1983); Kramer and MacKinnon (1993). The sample length is chosen to be . The normalized localization length increases (decreases) with the increase in width of the sample for a metallic (insulator) phase, and for a critical point Kramer and MacKinnon (1993).
Figures 3(a)-(c) plot the normalized localization length against the energy for different magnetization strengths at . The conduction and valence bands both possess two degenerate critical points with at and they separate apart with increasing . This is in accordance with the scaling behaviors of the density of conducting states . When we further increases disorder strength for , the critical points move toward the band center [see Figs. 3(d-g)]. One pair of the critical points annihilate at the band center when [see Fig. 3(d)], while the other pair survive for much stronger disorder and eliminate until [see Fig. 3(f)]. We summarize the main results in the phase diagrams in Figs. 3(h)-(i). It is clear that a pair of QAH phases with in the conduction and valence bands are created, and the energy window of the QAH phases is expanded with increasing without closing the global energy gap [see Fig. 3(h)]. Then by increasing disorder strength , the two QAH phases move to the band center, merge together and at last annihilate in strong disorder limit [see Fig. 3(i)]. Such a disorder-induced floating of critical points behavior was also previously discovered in quantum Hall systems Liu et al. (1996); Xie et al. (1996).
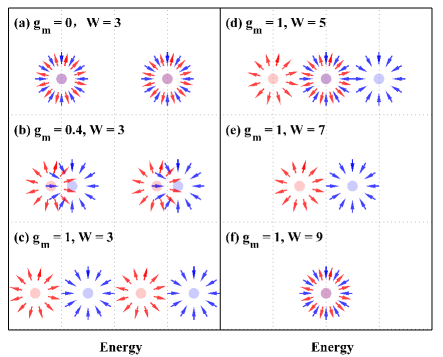
Next, we provide a phenomenological theory to explain the QAH insulator due to the Berry curvature splitting. For a nonmagnetic TI with , the valence bands of the TI carry the Chern numbers due to the nontrivial spin texture, which is analogous to the skyrmions with topological charges in magnetic insulators Qi et al. (2006). The skyrmions with ( ) for valence (conduction) band are schematically plotted as spins pointing outwards and inwards spheres in Fig .4, respectively. In the absence of magnetization , one can see two skyrmions of opposite charges in valence (conduction) band overlap. Then by increasing magnetization strength to , the two skirmions in valence (conduction) bands with ( ) separate in accordance with the Berry curvature splitting discussed in Fig. 1. This gives rise to the QAH insulator phase with within two skirmions in the valence (conduction) band, since the total topological charge below the Fermi energy is one. If we further increase the disorder strength , one pair of skyrmions from conduction and valence bands with opposite topological charges will merge and eliminate in pair at the band center [see Fig. 4(d)]. In this circumstance, the two QAH phases within conduction and valence merge together [see Fig. 4(e)] and the QAH phase survive until the pair of skyrmions merges in Fig. 4(f).
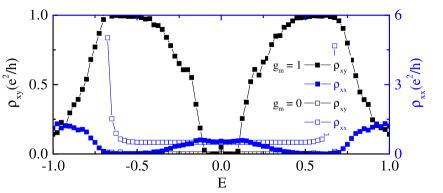
Discussion and conclusion.– The proposed QAH effect induced by the Berry curvature splitting can, in principle, be experimentally detected by a six-terminal Hall bar. Figure 5 shows the Hall resistance and the longitudinal resistance versus the energy . and are evaluated by the Landauer-Bütticker formula Datta (1995). Notably, it is found that the Hall resistance plateaus shows a reentrant behavior for , namely from () to a and then , by varying the Fermi energy , where the longitudinal resistance shows two zero-resistance plateaus correspondingly. This means the system goes through a QAH-normal insulator-QAH transition, which we call the reentrant QAH effect. The reentrant QAH behavior is distinct from the reentrant quantum Hall effect observed in the TI system König et al. (2008) as well as the QAH effect originating from the band inversion Yu et al. (2010). Therefore, we propose the reentrant QAH effect as a unique feature for the QAH effect due to the Berry curvature splitting in the presence of moderate disorder.
In reality, due to the localized states in the mobility gap, the quantized Hall conductance in the QAH can be observed only when the variable range hopping conductance is suppressed. Here Mott (1968); Tsigankov and Efros (2002) where with density of states , the localization length , the constant and the temperature . Thus, the onset temperature of the QAH can be much lower than the inverted gap, since that is usually only a few Kelvin Feng et al. (2015); Ying et al. (2016); Deng et al. (2020b, a) is much smaller than the energy gap. To enhance the QAH onset temperature, it is desirable to reduce the density of impurity states and decrease the localization length of impurity states.
Acknowledgement.— We thank Haiwen Liu, Hailong Li and Hua Jiang for illuminating discussions. This work is financially supported by NBRPC (Grants No. 2015CB921102), NSFC (Grants Nos. 11534001, 11822407, 12074108, and 11704106), and supported by the Fundamental Research Funds for the Central Universities. C.-Z. Chen are also funded by the Priority Academic Program Development of Jiangsu Higher Education Institutions. D.-H.X. is also supported by the Chutian Scholars Program in Hubei Province.
References
- Haldane (1988) F. D. M. Haldane, Phys. Rev. Lett. 61, 2015 (1988).
- Liu et al. (2008) C.-X. Liu, X.-L. Qi, X. Dai, Z. Fang, and S.-C. Zhang, Phys. Rev. Lett. 101, 146802 (2008).
- Yu et al. (2010) R. Yu, W. Zhang, H.-J. Zhang, S.-C. Zhang, X. Dai, and Z. Fang, Science 329, 61 (2010).
- Chang et al. (2013) C.-Z. Chang, J. Zhang, X. Feng, J. Shen, Z. Zhang, M. Guo, K. Li, Y. Ou, P. Wei, L.-L. Wang, Z.-Q. Ji, Y. Feng, S. Ji, X. Chen, J. Jia, X. Dai, Z. Fang, S.-C. Zhang, K. He, Y. Wang, L. Lu, X.-C. Ma, and Q.-K. Xue, Science 340, 167 (2013).
- Checkelsky et al. (2014) J. Checkelsky, R. Yoshimi, A. Tsukazaki, K. Takahashi, Y. Kozuka, J. Falson, M. Kawasaki, and Y. Tokura, Nature Physics 10, 731 (2014).
- Kou et al. (2014) X. Kou, S.-T. Guo, Y. Fan, L. Pan, M. Lang, Y. Jiang, Q. Shao, T. Nie, K. Murata, J. Tang, Y. Wang, L. He, T.-K. Lee, W.-L. Lee, and K. L. Wang, Phys. Rev. Lett. 113, 137201 (2014).
- Liu et al. (2016) C.-X. Liu, S.-C. Zhang, and X.-L. Qi, Annual Review of Condensed Matter Physics 7, 301 (2016).
- He et al. (2018) K. He, Y. Wang, and Q.-K. Xue, Annual Review of Condensed Matter Physics 9, 329 (2018).
- Gong et al. (2019) Y. Gong, J. Guo, J. Li, K. Zhu, M. Liao, X. Liu, Q. Zhang, L. Gu, L. Tang, X. Feng, D. Zhang, W. Li, C. Song, L. Wang, P. Yu, X. Chen, Y. Wang, H. Yao, W. Duan, Y. Xu, S.-C. Zhang, X. Ma, Q.-K. Xue, and K. He, Chinese Physics Letters 36, 076801 (2019).
- Zhang et al. (2019) D. Zhang, M. Shi, T. Zhu, D. Xing, H. Zhang, and J. Wang, Phys. Rev. Lett. 122, 206401 (2019).
- Li et al. (2019a) J. Li, Y. Li, S. Du, Z. Wang, B.-L. Gu, S.-C. Zhang, K. He, W. Duan, and Y. Xu, Science Advances 5 (2019a).
- Otrokov et al. (2019a) M. M. Otrokov, I. I. Klimovskikh, H. Bentmann, D. Estyunin, A. Zeugner, Z. S. Aliev, S. Gaß, A. U. B. Wolter, A. V. Koroleva, A. M. Shikin, and et al., Nature 576, 416 (2019a).
- Vidal et al. (2019a) R. C. Vidal, H. Bentmann, T. R. F. Peixoto, A. Zeugner, S. Moser, C.-H. Min, S. Schatz, K. Kißner, M. Ünzelmann, C. I. Fornari, H. B. Vasili, M. Valvidares, K. Sakamoto, D. Mondal, J. Fujii, I. Vobornik, S. Jung, C. Cacho, T. K. Kim, R. J. Koch, C. Jozwiak, A. Bostwick, J. D. Denlinger, E. Rotenberg, J. Buck, M. Hoesch, F. Diekmann, S. Rohlf, M. Kalläne, K. Rossnagel, M. M. Otrokov, E. V. Chulkov, M. Ruck, A. Isaeva, and F. Reinert, Phys. Rev. B 100, 121104 (2019a).
- Hu et al. (2020a) C. Hu, K. N. Gordon, P. Liu, J. Liu, X. Zhou, P. Hao, D. Narayan, E. Emmanouilidou, H. Sun, Y. Liu, and et al., Nature Communications 11 (2020a).
- Wu et al. (2019) J. Wu, F. Liu, M. Sasase, K. Ienaga, Y. Obata, R. Yukawa, K. Horiba, H. Kumigashira, S. Okuma, T. Inoshita, and et al., Science Advances 5, eaax9989 (2019).
- Li et al. (2019b) H. Li, S.-Y. Gao, S.-F. Duan, Y.-F. Xu, K.-J. Zhu, S.-J. Tian, J.-C. Gao, W.-H. Fan, Z.-C. Rao, J.-R. Huang, J.-J. Li, D.-Y. Yan, Z.-T. Liu, W.-L. Liu, Y.-B. Huang, Y.-L. Li, Y. Liu, G.-B. Zhang, P. Zhang, T. Kondo, S. Shin, H.-C. Lei, Y.-G. Shi, W.-T. Zhang, H.-M. Weng, T. Qian, and H. Ding, Phys. Rev. X 9, 041039 (2019b).
- Chen et al. (2019a) Y. J. Chen, L. X. Xu, J. H. Li, Y. W. Li, H. Y. Wang, C. F. Zhang, H. Li, Y. Wu, A. J. Liang, C. Chen, S. W. Jung, C. Cacho, Y. H. Mao, S. Liu, M. X. Wang, Y. F. Guo, Y. Xu, Z. K. Liu, L. X. Yang, and Y. L. Chen, Phys. Rev. X 9, 041040 (2019a).
- Vidal et al. (2019b) R. C. Vidal, A. Zeugner, J. I. Facio, R. Ray, M. H. Haghighi, A. U. B. Wolter, L. T. Corredor Bohorquez, F. Caglieris, S. Moser, T. Figgemeier, T. R. F. Peixoto, H. B. Vasili, M. Valvidares, S. Jung, C. Cacho, A. Alfonsov, K. Mehlawat, V. Kataev, C. Hess, M. Richter, B. Büchner, J. van den Brink, M. Ruck, F. Reinert, H. Bentmann, and A. Isaeva, Phys. Rev. X 9, 041065 (2019b).
- Shi et al. (2019) M. Z. Shi, B. Lei, C. S. Zhu, D. H. Ma, J. H. Cui, Z. L. Sun, J. J. Ying, and X. H. Chen, Phys. Rev. B 100, 155144 (2019).
- Ding et al. (2020) L. Ding, C. Hu, F. Ye, E. Feng, N. Ni, and H. Cao, Phys. Rev. B 101, 020412 (2020).
- Hu et al. (2020b) Y. Hu, L. Xu, M. Shi, A. Luo, S. Peng, Z. Y. Wang, J. J. Ying, T. Wu, Z. K. Liu, C. F. Zhang, Y. L. Chen, G. Xu, X.-H. Chen, and J.-F. He, Phys. Rev. B 101, 161113 (2020b).
- Xu et al. (2020) L. Xu, Y. Mao, H. Wang, J. Li, Y. Chen, Y. Xia, Y. Li, D. Pei, J. Zhang, H. Zheng, and et al., Science Bulletin 65, 2086 (2020).
- Tian et al. (2020) S. Tian, S. Gao, S. Nie, Y. Qian, C. Gong, Y. Fu, H. Li, W. Fan, P. Zhang, T. Kondo, S. Shin, J. Adell, H. Fedderwitz, H. Ding, Z. Wang, T. Qian, and H. Lei, Phys. Rev. B 102, 035144 (2020).
- Hao et al. (2019) Y.-J. Hao, P. Liu, Y. Feng, X.-M. Ma, E. F. Schwier, M. Arita, S. Kumar, C. Hu, R. Lu, M. Zeng, Y. Wang, Z. Hao, H.-Y. Sun, K. Zhang, J. Mei, N. Ni, L. Wu, K. Shimada, C. Chen, Q. Liu, and C. Liu, Phys. Rev. X 9, 041038 (2019).
- Ge et al. (2020) J. Ge, Y. Liu, J. Li, H. Li, T. Luo, Y. Wu, Y. Xu, and J. Wang, National Science Review 7, 1280 (2020).
- Liu et al. (2020) C. Liu, Y. Wang, H. Li, Y. Wu, Y. Li, J. Li, K. He, Y. Xu, J. Zhang, and Y. Wang, Nature Materials 19, 522 (2020).
- Deng et al. (2020a) Y. Deng, Y. Yu, M. Z. Shi, Z. Guo, Z. Xu, J. Wang, X. H. Chen, and Y. Zhang, Science 367, 895 (2020a).
- Otrokov et al. (2019b) M. M. Otrokov, I. P. Rusinov, M. Blanco-Rey, M. Hoffmann, A. Y. Vyazovskaya, S. V. Eremeev, A. Ernst, P. M. Echenique, A. Arnau, and E. V. Chulkov, Phys. Rev. Lett. 122, 107202 (2019b).
- Deng et al. (2020b) H. Deng, Z. Chen, A. Wolos, M. Konczykowski, K. Sobczak, J. Sitnicka, I. V. Fedorchenko, J. Borysiuk, T. Heider, L. Plucinski, and et al., Nature Physics 17, 36 (2020b).
- Anderson (1958) P. W. Anderson, Phys. Rev. 109, 1492 (1958).
- Abrahams et al. (1979) E. Abrahams, P. W. Anderson, D. C. Licciardello, and T. V. Ramakrishnan, Phys. Rev. Lett. 42, 673 (1979).
- Belitz and Kirkpatrick (1994) D. Belitz and T. R. Kirkpatrick, Rev. Mod. Phys. 66, 261 (1994).
- Onoda and Nagaosa (2003) M. Onoda and N. Nagaosa, Phys. Rev. Lett. 90, 206601 (2003).
- Qiao et al. (2016) Z. Qiao, Y. Han, L. Zhang, K. Wang, X. Deng, H. Jiang, S. A. Yang, J. Wang, and Q. Niu, Phys. Rev. Lett. 117, 056802 (2016).
- Chen et al. (2019b) C.-Z. Chen, H. Liu, and X. C. Xie, Phys. Rev. Lett. 122, 026601 (2019b).
- Li and Cheng (2021) Y.-H. Li and R. Cheng, Phys. Rev. Lett. 126, 026601 (2021).
- Zhang et al. (2020) R.-X. Zhang, F. Wu, and S. Das Sarma, Phys. Rev. Lett. 124, 136407 (2020).
- Lian et al. (2020) B. Lian, Z. Liu, Y. Zhang, and J. Wang, Phys. Rev. Lett. 124, 126402 (2020).
- Li et al. (2021) H. Li, H. Jiang, C.-Z. Chen, and X. C. Xie, Phys. Rev. Lett. 126, 156601 (2021).
- Bernevig et al. (2006) B. A. Bernevig, T. L. Hughes, and S.-C. Zhang, Science 314, 1757 (2006).
- Lin et al. (2021) W. Lin, Y. Feng, Y. Wang, Z. Lian, H. Li, Y. Wu, C. Liu, Y. Wang, J. Zhang, Y. Wang, X. Zhou, and J. Shen, (2021), arXiv:2105.10234 .
- Liu et al. (2021) C. Liu, Y. Wang, M. Yang, J. Mao, H. Li, Y. Li, J. Li, H. Zhu, J. Wang, L. Li, and et al., Nature Communications 12 (2021).
- Prodan (2009) E. Prodan, Phys. Rev. B 80, 125327 (2009).
- Prodan (2011) E. Prodan, Journal of Physics A: Mathematical and Theoretical 44, 113001 (2011).
- Sheng et al. (2005) L. Sheng, D. N. Sheng, C. S. Ting, and F. D. M. Haldane, Phys. Rev. Lett. 95, 136602 (2005).
- Sheng et al. (2006) D. N. Sheng, Z. Y. Weng, L. Sheng, and F. D. M. Haldane, Phys. Rev. Lett. 97, 036808 (2006).
- Fu and Kane (2012) L. Fu and C. L. Kane, Phys. Rev. Lett. 109, 246605 (2012).
- Chen et al. (2020) C.-Z. Chen, H. Jiang, D.-H. Xu, and X. C. Xie, Science China Physics, Mechanics & Astronomy 63, 107811 (2020).
- Arovas et al. (1988) D. P. Arovas, R. N. Bhatt, F. D. M. Haldane, P. B. Littlewood, and R. Rammal, Phys. Rev. Lett. 60, 619 (1988).
- Huo and Bhatt (1992) Y. Huo and R. N. Bhatt, Phys. Rev. Lett. 68, 1375 (1992).
- Zhu et al. (2019) Q. Zhu, P. Wu, R. N. Bhatt, and X. Wan, Phys. Rev. B 99, 024205 (2019).
- MacKinnon and Kramer (1981) A. MacKinnon and B. Kramer, Phys. Rev. Lett. 47, 1546 (1981).
- MacKinnon and Kramer (1983) A. MacKinnon and B. Kramer, Zeitschrift für Physik B Condensed Matter 53, 1 (1983).
- Kramer and MacKinnon (1993) B. Kramer and A. MacKinnon, Reports on Progress in Physics 56, 1469 (1993).
- Liu et al. (1996) D. Z. Liu, X. C. Xie, and Q. Niu, Phys. Rev. Lett. 76, 975 (1996).
- Xie et al. (1996) X. C. Xie, D. Z. Liu, B. Sundaram, and Q. Niu, Phys. Rev. B 54, 4966 (1996).
- Qi et al. (2006) X.-L. Qi, Y.-S. Wu, and S.-C. Zhang, Phys. Rev. B 74, 085308 (2006).
- Datta (1995) S. Datta, Electronic Transport in Mesoscopic Systems, Cambridge Studies in Semiconductor Physics and Microelectronic Engineering (Cambridge University Press, 1995).
- König et al. (2008) M. König, H. Buhmann, L. W. Molenkamp, T. Hughes, C.-X. Liu, X.-L. Qi, and S.-C. Zhang, Journal of the Physical Society of Japan 77, 031007 (2008).
- Mott (1968) N. Mott, Journal of Non-Crystalline Solids 1, 1 (1968).
- Tsigankov and Efros (2002) D. N. Tsigankov and A. L. Efros, Phys. Rev. Lett. 88, 176602 (2002).
- Feng et al. (2015) Y. Feng, X. Feng, Y. Ou, J. Wang, C. Liu, L. Zhang, D. Zhao, G. Jiang, S.-C. Zhang, K. He, X. Ma, Q.-K. Xue, and Y. Wang, Phys. Rev. Lett. 115, 126801 (2015).
- Ying et al. (2016) T. Ying, Y. Gu, X. Chen, X. Wang, S. Jin, L. Zhao, W. Zhang, and X. Chen, Science Advances 2 (2016), 10.1126/sciadv.1501283.