Circumnuclear Multi-phase Gas in Circinus Galaxy IV: absorption owing to high- CO rotational transitions
Abstract
We studied the absorption features of CO lines against the continuum originating from the heated dust in the obscuring tori around active galactic nuclei (AGNs). We investigated the formation of absorption lines corresponding to the CO rotational transitions using three-dimensional non-LTE line transfer simulations considering the dust thermal emission. As in Papers I–III of this series, we performed post-processed radiative transfer calculations using the “radiation-driven fountain model” (Wada et al., 2016), which yields a geometrically thick obscuring structure around the nucleus. This model is consistent with the spectral energy distribution of the nearest type-2 Seyfert galaxy, the Circinus galaxy. We found that the continuum-subtracted channel maps of and higher transitions show absorption regions along the disk mid-plane for an edge-on viewing angle. The spectra consist of multiple absorption and emission features, reflecting the internal inhomogeneous and turbulent structure of the torus. The deepest absorption feature is caused by the gas on the near-side of the torus between and 15 pc, which is located in front of the AGN-heated dust inside pc. We also found that a spatial resolution of 0.5–1.0 pc is necessary to resolve the absorption features. Moreover, the inclination angle must be close to the edge-on angle (i.e., ) to observe the absorption features. The findings of the present study imply that combining our radiation-hydrodynamic model with high-resolution observations of CO (7-6) by ALMA can provide new information about the internal structure of the molecular tori in nearby AGNs.
1 INTRODUCTION
In the standard picture of active galactic nuclei (AGNs), the broad emission line region is enshrouded by an optically as well as geometrically thick material (Antonucci, 1993). However, the actual structure of the obscuring material is not well understood; hence, it is often postulated to be a torus-like object (Urry & Padovani, 1995) (see also Netzer, 2015, for review). This situation is rapidly changing owing to the high spatial resolution of the Atacama Large Millimeter/submillimeter Array (ALMA). Recently, the obscuring material consisting of molecular gas and dust has been resolved in several nearby AGNs (García-Burillo et al., 2016; Izumi et al., 2018; Combes et al., 2019; Imanishi et al., 2016, 2020).
However, the internal structure of the molecular tori revealed by ALMA is still unclear; for example, it is unclear whether the tori are clumpy or smooth, and the internal turbulent structure, even in nearby AGNs, is unknown. A promising approach to answer these questions is to make a comparison between synthetic observations based on realistic theoretical models and actual multi-wavelength observations of the tori. Such a comparison is especially important for observations conducted with a resolution of , which corresponds to sub-pc scales in nearby AGNs. However, in such comparisons, classical torus models, which phenomenologically assume the geometry, size, and internal structure of the torus, cannot reveal much information regarding the obscuring material in AGNs.
In contrast to phenomenological torus models, Wada (2012) proposed a physics-motivated picture of the obscuring structures around the central engine in AGNs based on three-dimensional (3D) radiation-hydrodynamic models. Their “radiation-driven fountain” model, in which both outflowing and inflowing gases are driven by the radiation from the accretion disk, naturally forms a geometrically thick disk extending for tens of parsecs (see also Namekata & Umemura, 2016; Dorodnitsyn et al., 2016; Dorodnitsyn & Kallman, 2017; Chan & Krolik, 2017; Williamson et al., 2020). This quasi-steady circulation of gas obscures the central source; hence, the differences in the spectral energy distributions (SEDs) of typical type 1 and type-2 Seyfert galaxies can be explained by invoking different viewing angles (Schartmann et al., 2014). In Wada et al. (2016) (hereafter, W16), we applied this radiation-driven fountain model to the Circinus galaxy, which is the nearest ( 4 Mpc) type 2 Seyfert galaxy. Post-processed three-dimensional radiation transfer calculations were used to model the dust thermal emission; based on this, “polar” emission in the mid-infrared band (12 ) was detected, which is often observed in nearby Seyfert galaxies (Hönig et al., 2013; Tristram et al., 2014; Asmus et al., 2016). In addition, it was confirmed that the viewing angle should be larger than 75∘ (i.e., close to edge-on) to explain the observed SED and the 10 m absorption feature of the Circinus galaxy (Prieto et al., 2010).
To confirm whether the radiation-driven fountain model can explain observational properties in addition to the SED in the Circinus galaxy, we recently conducted a quantitative comparison between this model and multi-wavelength observations. In Wada et al. (2018a) (hereafter, Paper I), we calculated molecular line emissions, such as those from 12CO (hereafter, CO)(2–1), using the best-fit model of W16. The model results were further compared with ALMA Cycle-4 observations of rotational lines of CO and of the fine structure line of atomic carbon, [CI] 1-0 (Izumi et al., 2018) (hereafter, Paper II). The same model was also used to calculate optical emission lines from ionized gas, such as [OIII] 5007 Å. We found that radiation-driven outflows irradiated by the central source can help explain the properties of the observed emission lines (e.g., the Baldwin, Phillips & Terlevich (BPT) diagrams (Baldwin et al., 1981)) and the structure of the narrow-line regions (NLRs) (Wada et al., 2018b) (hereafter, Paper III). In addition, the X-ray spectral properties were investigated using the same strategy, and they were found to be consistent with observations (Buchner et al. 2021; Ogawa et al. in prep.).
In Papers I and II, we focused on the molecular and atomic emission lines. However, if the background source is sufficiently warm, then the physical conditions of the cold ISM located between the observer and the source can be derived using absorption lines. Low- CO absorption has been detected in some radio galaxies against the emission from radio jets (Israel et al., 1990, 1991; Jaffe & McNamara, 1994; Espada et al., 2010; Kameno et al., 2020). In ultra-luminous infrared galaxies (ULIRGs), CO absorption owing to rotation-vibration transitions has also been detected against the thermal emission from heated dust in the near-infrared (Spoon et al., 2004, 2005; Shirahata et al., 2013, 2017; Baba et al., 2018).
However, CO absorption features owing to rotational transitions have not been detected in radio-quiet AGNs or Seyfert galaxies at submillimeter wavelengths (for example, Okuda et al., 2013). This is in contrast to the observations of the CO absorption in ULIRGs owing to the rotation-vibration transitions (Shirahata et al., 2013, 2017). Therefore, it is important to understand the reason for the absence of CO absorption lines in low-luminosity AGNs and the conditions necessary to form CO absorption features owing to the rotational transitions against the dust continuum. We suspect that the cool dust ( 100 K) in the tori of low-luminosity AGNs may serve as the background source at submillimeter wavelengths. There are several possible reasons for the absence of CO absorption features; 1) it could be due to the low-luminosity dust continuum in AGNs, 2) there is no temperature gradient between the dust and gas, 3) the covering fraction of the foreground gas is small compared to the extent of the background source, and 4) the opacity of the foreground molecular gas is low. Alternatively, it is possible that the spatial resolution of past observations in the millimeter and submillimeter wavelength range was not sufficiently high111In Okuda et al. (2013), the spatial resolution was approximately with Nobeyama Radio Observatory (NRO)/RAINBOW interferometer and with the IRAM Plateau de Bure Interferometer. compared to the size of the background source and molecular tori. In this case, the extended emission line features may contaminate the absorption features of smaller size. Therefore, it is important to study the effect of spatial resolution on the observed line properties, especially with the advent of ALMA.
To clarify the aforementioned points theoretically, we need realistic 3D models that include the dust component and molecular gas distributions, from which we can calculate both the background dust continuum and molecular line intensities. Note that the temperature of the dust associated with the ISM should be self-consistently determined from the radiation field of the AGN. Therefore, we use the radiation-driven fountain model, as in the previous papers of this series. However, in the theoretical calculations presented in Papers I and II, we did not consider the dust emission. Therefore, in this work, we performed new 3D radiative transfer calculations including both the continuum emission owing to the AGN-heated dust and the rotational transition lines of CO.
In this study, CO lines were calculated using the same non-local thermodynamic equilibrium radiative transfer code used in Papers I and II.
The background dust thermal emission was calculated using the 3D open source radiative transfer code RADMC-3D (Dullemond et al., 2012).
In contrast to Papers I and II, in which relatively low- transitions were considered,
in the present study, we investigated transitions up to . This is because we expect
the thermal dust emission to be brighter for higher- transitions, which can be observed with ALMA.
In this fourth paper of the series, we would like to address the following questions: (1) Can the absorption features be observed at millimeter and submillimeter wavelengths against the continuum originating from the AGN-heated dust of several tens of kelvin in the radiation-driven fountain model? (2) What are the conditions necessary to realize point (1) (e.g., the transitions suitable for observations, spatial resolution of the synthetic observations, and viewing inclination angles)? (3) How do the absorption features correspond to the internal spatial and kinematic structures of the obscuring material? The answers to these questions would be useful for conducting future high-resolution observations with ALMA, for example, using CO (806.7 GHz) for local AGNs 222 In this study, we focused only on the CO rotational transitions. The radiative transfer calculations for the CO rotation-vibration transitions in the near-infrared region will be discussed in a subsequent paper (Matsumoto et al., in prep.)..
One may wonder that if the internal density of the tori is clumpy, we could also use high-density tracers, such as HCO+. In fact, Yamada, Wada, & Tomisaka (2007) studied HCO+ and HCN line structures for a hydrodynamic model of the starburst-driven torus (Wada & Norman, 2002); their method is basically the same as the one used in this paper, but the AGN feedback was not included. Because CO is abundant and the background dust continuum is brighter in sub-millimetre, we here focus on high lines of CO (the critical density for CO (7-6) is cm-3). Absorption for HCO+ or other lines will be discussed elsewhere.
The remainder of this paper is organized as follows. In §2, our input model, namely the radiation-driven fountain model, is briefly explained, and the radiation transfer calculations for the dust and CO lines are described. The results, including the CO intensity maps and spectra, are presented in §3. The implications for future observations are discussed in §4, and finally, the paper is concluded in §5.
2 NUMERICAL METHODS AND MODEL
2.1 Input model: Radiation-driven fountain
The input model used for the line transfer calculations in this work is the same as that used in Papers I–III. This model consistently explains the infrared SED of the Circinus galaxy when the viewing angle is 75∘ or higher (W16).
The hydrodynamic model was obtained using a 3D Eulerian hydrodynamic code (Wada, 2012, 2015) with a uniform grid, which accounts for radiative feedback processes from the AGN using a ray-tracing method. We assume a time-independent external potential: , where pc, kpc, km s-1, and km s-1 to represent a stellar potential. We adopt implicit time integration for the radiative cooling. To prepare quasi-steady initial conditions without the radiative feedback from the AGN, we first evolve an axisymmetric and rotationally supported thin disk with uniform density profiles with 1% of random fluctuation in density. The radius of the gas disk in this case is approximately 16 pc, and the total gas mass was also assumed to be . After the thin disks is dynamically settled, the radiation feedback from the AGN and supernovae (SNe) feedback (the supernova rate is fixed to be 0.014 yr-1 during the calculation) are turned on.
We assumed solar metallicity and cooling functions for 20 K K (Meijerink & Spaans, 2005; Wada et al., 2009). The central black hole mass was assumed to be , which is comparable to the value estimated from maser observations of Circinus (Greenhill et al., 2003). The Eddington ratio was set to 0.2 and the bolometric luminosity to erg s-1. The ultraviolet flux is assumed to be , where denotes the angle from the rotational axis (-axis). The X-ray radiation, on the other hand, assumed to be spherically symmetric (Netzer, 1987). The UV and X-ray fluxes are calculated from the bolometric luminosity (Marconi et al., 2004; Hopkins et al., 2007). The total X-ray luminosity (2–10 keV) is erg s-1.
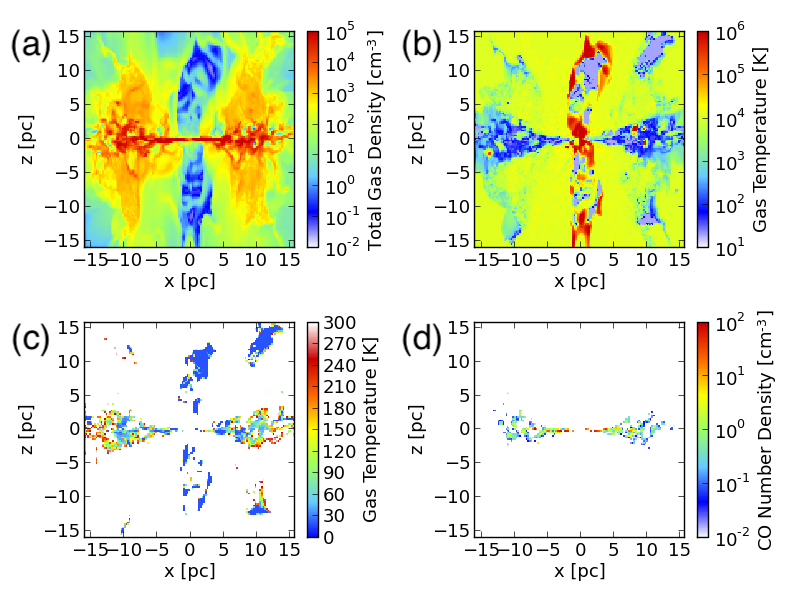
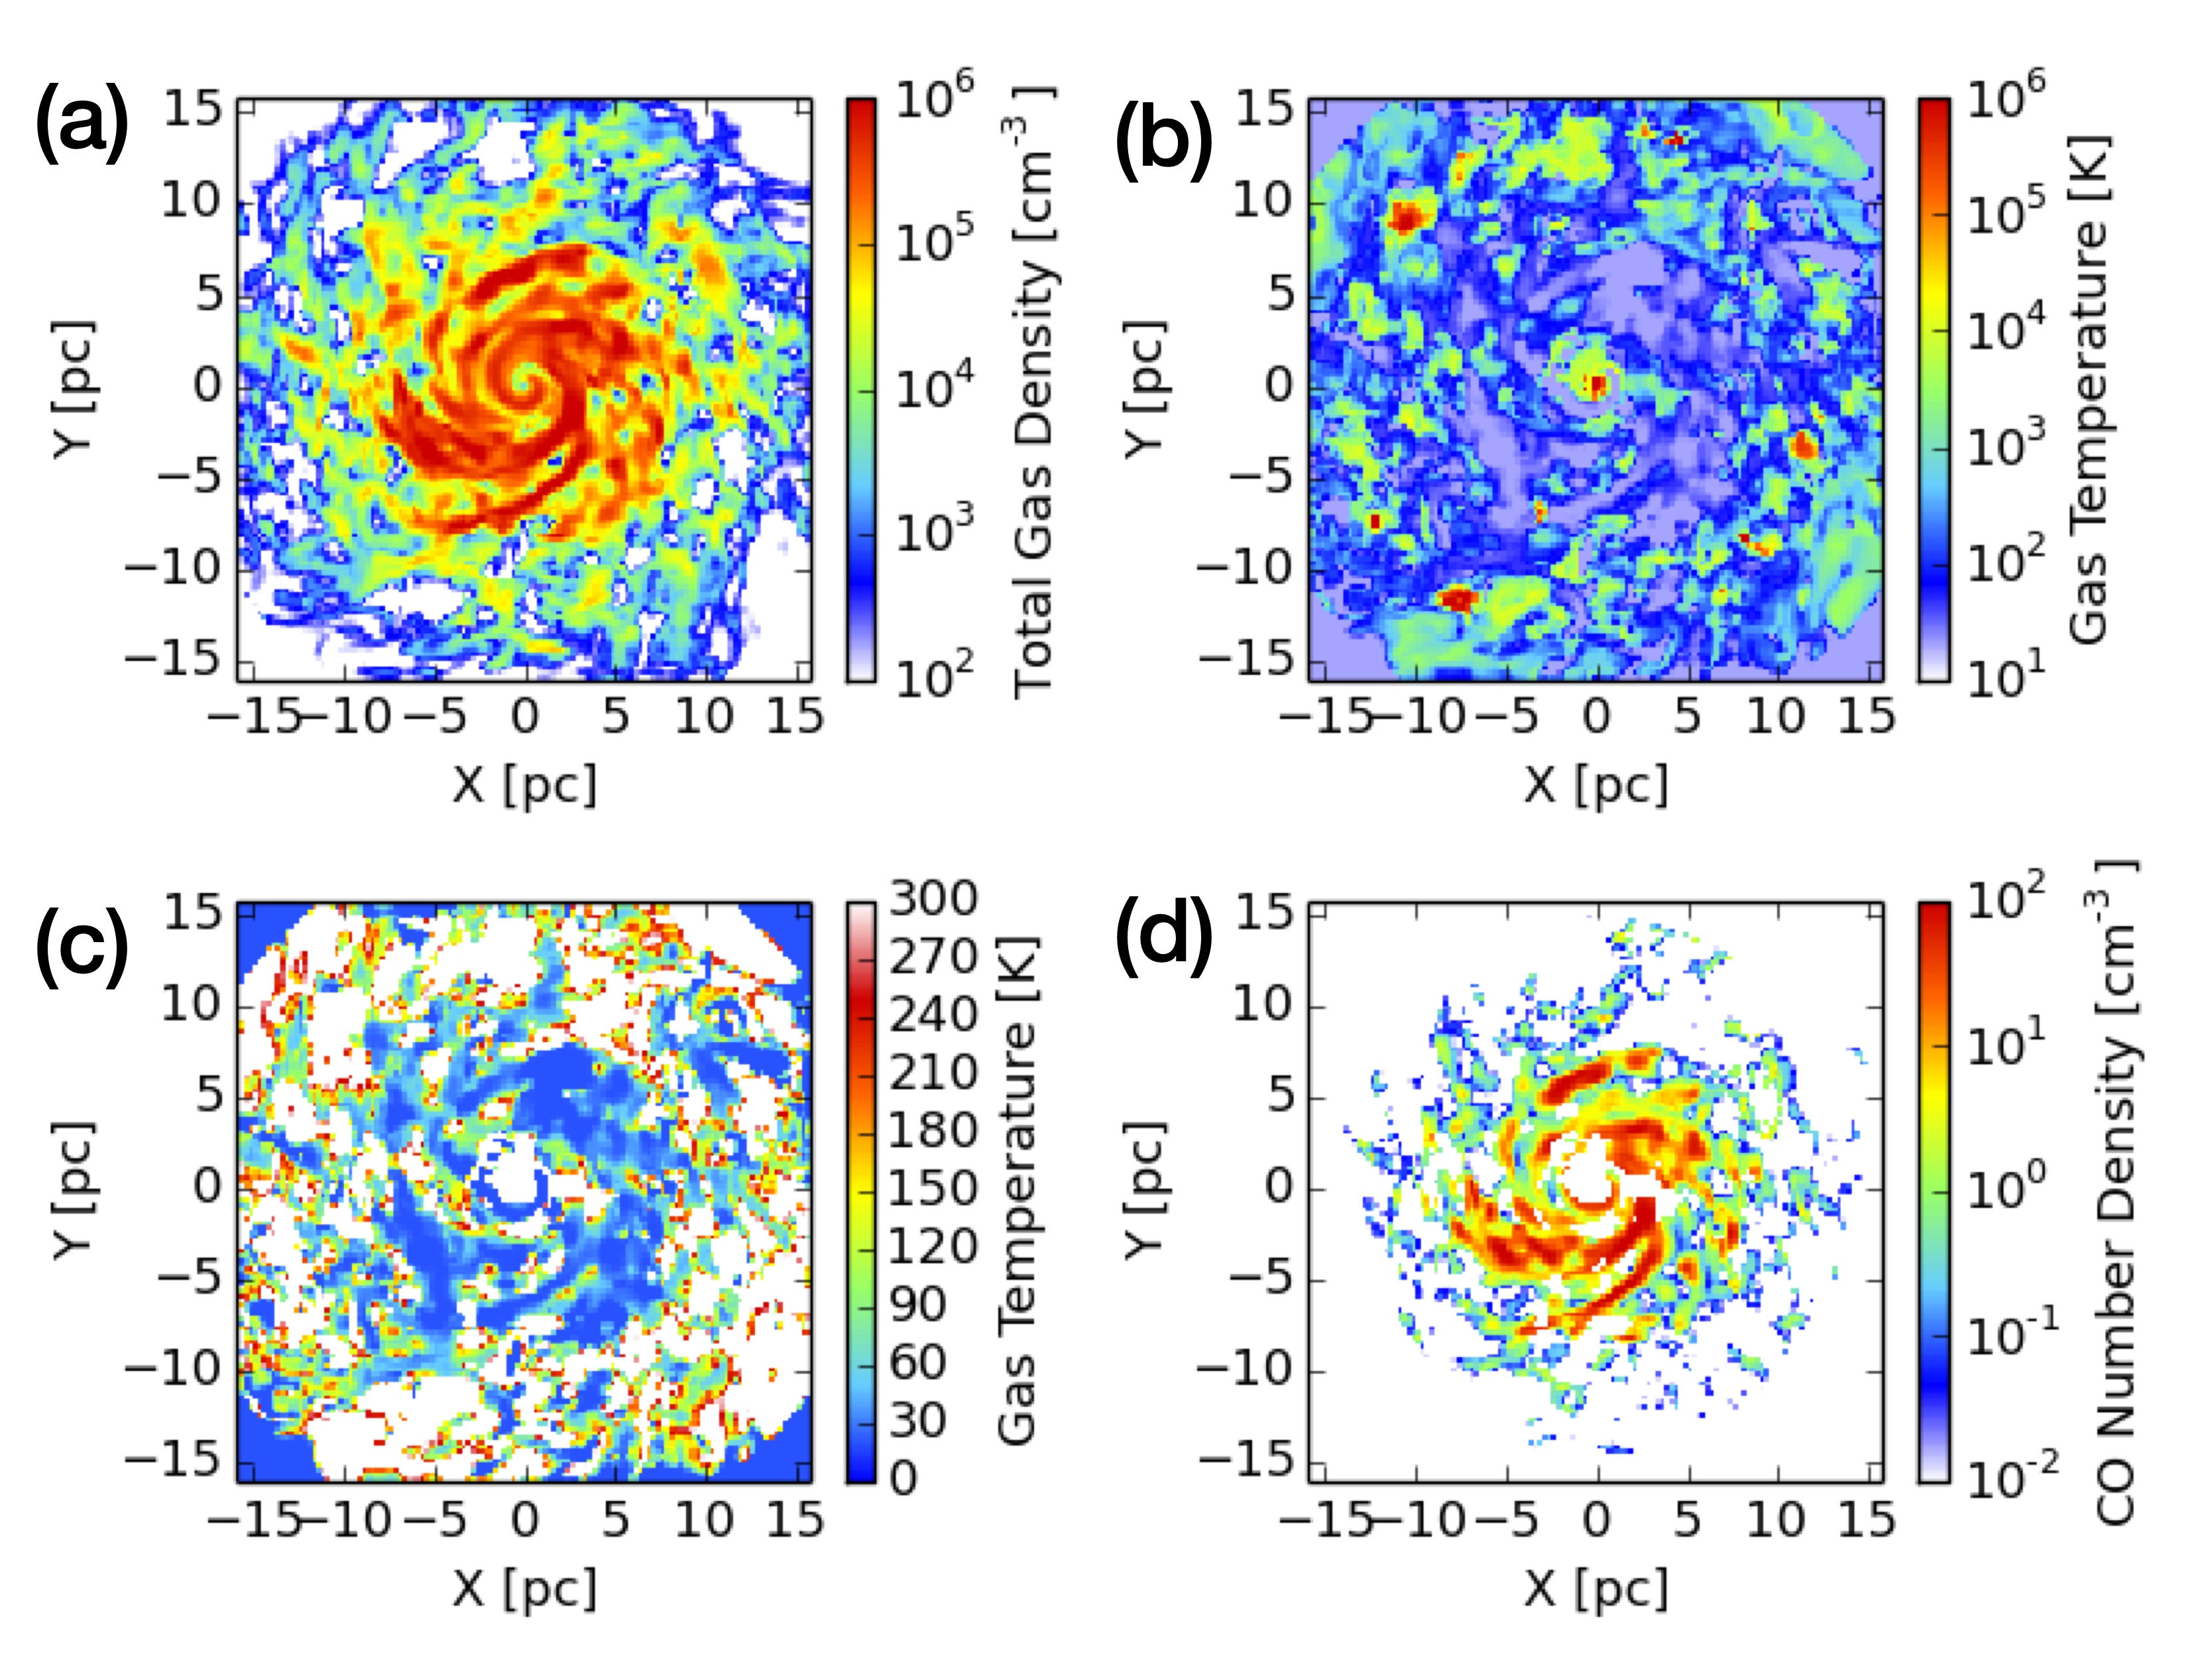
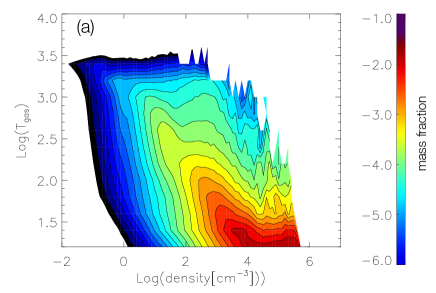
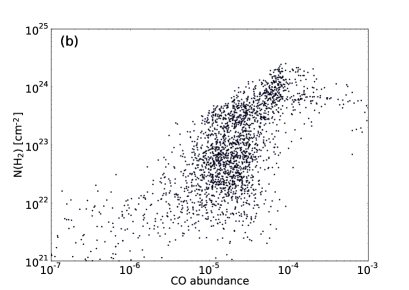
Figures 1 and 2 shows the distributions of gas density, temperature, and CO number density in the input model. As shown in the phase-diagram (Fig. 3(a) ), the high density gas ( cm-3) is mostly cold ( K). CO is more abundant in this high density region (Fig. 3(b)) that forms a thin disk with spiral-like features (Fig. 2(d)).
We solved the non-equilibrium X-ray dominated region (XDR) chemistry (Maloney, Hollenbach, & Tielens, 1996; Meijerink & Spaans, 2005) for all the 2563 zones (i.e., a resolution of 0.125 pc). At every hydrodynamic time step, the gas density, gas and dust temperatures, ionization parameters in the 2563 grid cells, and the time step (typically 50-100 years) are passed to the chemistry module. The chemistry module iteratively calculates the chemical network to reach an equilibrium for the time step, and it returns the abundances of the species to the hydrodynamic part. The abundance distributions are advected based on the gas velocity obtained in the hydrodynamic part. We used a selection of reactions from the chemical network described by Meijerink & Spaans (2005); Ádámkovics et al. (2011) for 26 species: H, H2, H+, H, H, H-, e-, O, O2, O+, O, O2, H+, OH, OH+, H2O, H2O+, H3O+, C, C+, CO, Na, Na+, He, He+, and HCO+ 333To save computational memory, we solve the advection of the species between the grid cell only for H, H+, H2, O, O+, H2O, OH, C, C+, and .
The size of the chemical network is the maximum one to solve the non-equilibrium chemistry in the hydrodynamic grid cells for more than 10000 time steps, but it ensures that the the important species for the present study, such as CO, is consistent with the results with 1-D calculations based on the full network. For example, for () cm-2 , cm-3 and the X-ray flux erg cm-2 s-1, the full network including S- and N-bearing species, Meijerink & Spaans (2005) predicted that the CO abundance is () relative to H2, whereas it is () in the high density region ( cm-3) in our model (Fig. 3(b)). Moreover, the observed CO (3-2) peak flux of the molecular torus of the Circinus galaxy obtained by ALMA (Paper II) is consistent with our prediction (see Appendix, Fig. 12) within a factor of two (i.e., 16 mJy/beam vs. 28 mJy/beam)444More generally, in a comparison study among various PDR chemical codes including the XDR model of Meijerink & Spaans (2005), Röllig et al. (2007) pointed out that a small network can give similar results as a big network. .
The metallicity could also affect the abundance of not only for CO, but also that of other species. In Paper III, we calculated the optical emission lines of the ionized outflows, assuming the solar metallicity. We found that the emission lines from the ISM around the AGN are consistent with the observed properties, for example such as the line ratios, e.g., [OIII]/H and [SII]/H. Therefore, the assumption of the solar metallicity in this paper is a reasonable first choice for the AGN model.
2.2 Radiative transfer of CO lines
We used a 3D line transfer code (Wada & Tomisaka, 2005; Yamada, Wada, & Tomisaka, 2007), which is based on a Monte Carlo and long-characteristic radiative transfer code (Hogerheijde, & van der Tak, 2000). The rate equations and radiative transfer equations were iteratively solved, considering that photon packages propagate into each grid cell. We solved the following equation
| (1) |
where the source function is given by
| (2) |
The optical depth is
defined as ,
where the dust-to-gas mass ratio is fixed as an assumption throughout the paper, i.e., is the dust density and is the gas density (determined using the hydrodynamic model) in each grid cell.
The dust temperature in each grid cell is computed using RADMC-3D (§2.3).
The coefficients and for a spectral line can be determined using the absorption and emission between levels and with number density and , respectively, such that
| (3) | |||||
| (4) |
where is a line-profile function that peaks around the frequency , and and are the Einstein probability coefficients. The line profile is given by
| (5) |
We assumed that the width of the line profile is influenced by micro-turbulence, that is, a hypothetical turbulent motion inside each grid cell, and used the turbulent velocity as a free parameter (see §4 for details). In the fiducial model, we assumed km s-1 . Note that the line width of molecular lines observed in external galaxies is usually much larger than the value assumed here. This is because the velocity shear owing to the galactic rotation may be convolved with the observed line width if the beam size is not sufficiently small. Additionally, here corresponds to the velocity dispersion in a grid cell (0.25 pc).
The mean intensity was evaluated using the Monte Carlo approach (Hogerheijde, & van der Tak, 2000), in which the integration is performed along the rays incident on each cell from infinity.
The 3D hydrodynamic grid data (i.e., density, temperature, abundances, and three components of the velocity) from the 2563 grid cells were averaged to produce data corresponding to 1283 grid cells (i.e., having a spatial resolution of 0.25 pc) to reduce the computational cost. These data were fed into the 3D non-LTE line transfer code, as described in the next section, to derive the line intensities. For each grid cell, rays were considered. We calculated 15 rotational transitions of CO (i.e., ). The level populations converged with an error less than for after 10 iterations.
Once the radiation field and optical depth were determined for all grid cells, we “observed” it from arbitrary directions and generated 3D data cubes (of positions and line-of-sight velocity) for selected transitions.
2.3 Dust continuum
To obtain the source function for the dust continuum in each grid cell,
we used the 3D radiative transfer code RADMC-3D (version 0.41) (Dullemond et al., 2012)555https://www.ita.uni-heidelberg.de/ dullemond/software/radmc-3d/.
The SED of the AGN was taken from Schartmann et al. (2005).
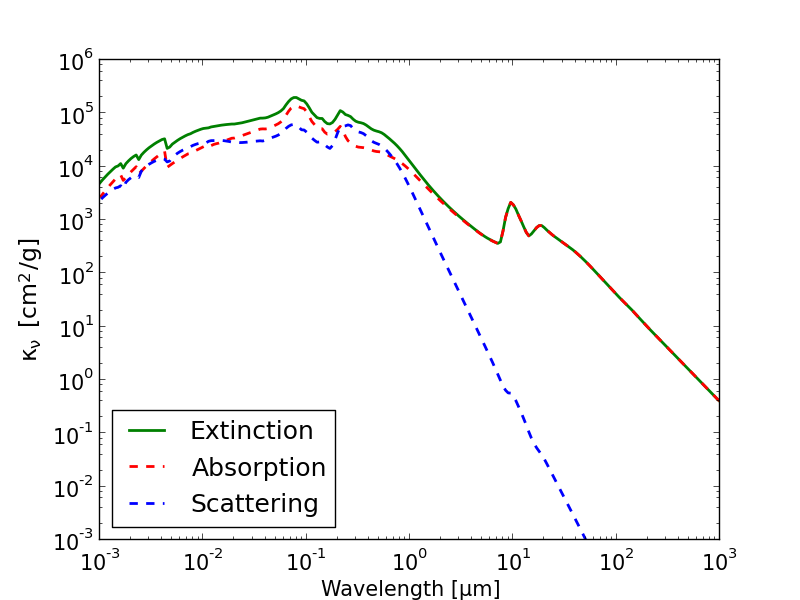
The opacity curve used is shown in Fig. 4.
The size of the
dust grains was assumed to be between 0.01m and 0.1m, and their distribution function was adopted from Mathis et al. (1977).
We assumed that the dust is composed of silicate and graphite with a mass ratio of 0.625:0.375 (Mathis et al., 1977; Schartmann et al., 2005).
Schartmann et al. (2014) calculated the infrared spectrum in the Circinus assuming the same dust model, and
found that the SED and the 10m absorption feature well fit the observations, if the inclination angle is larger than
75∘.
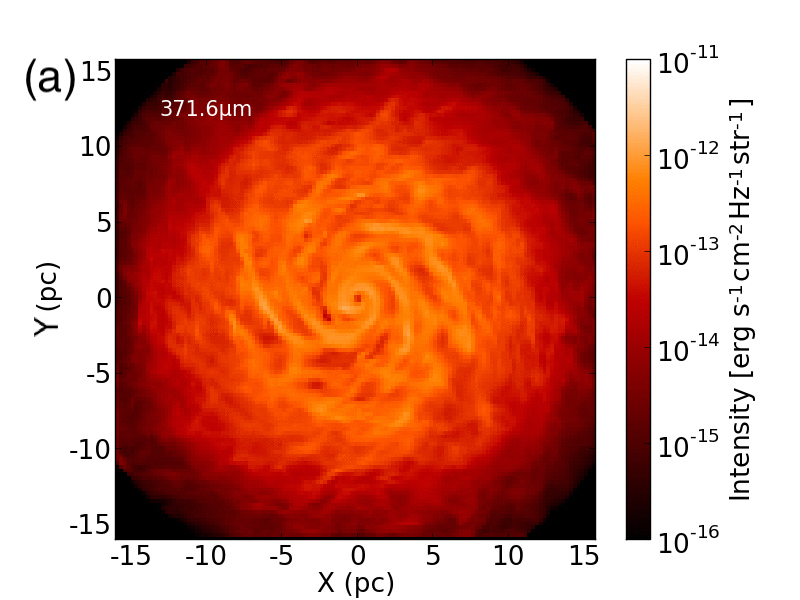
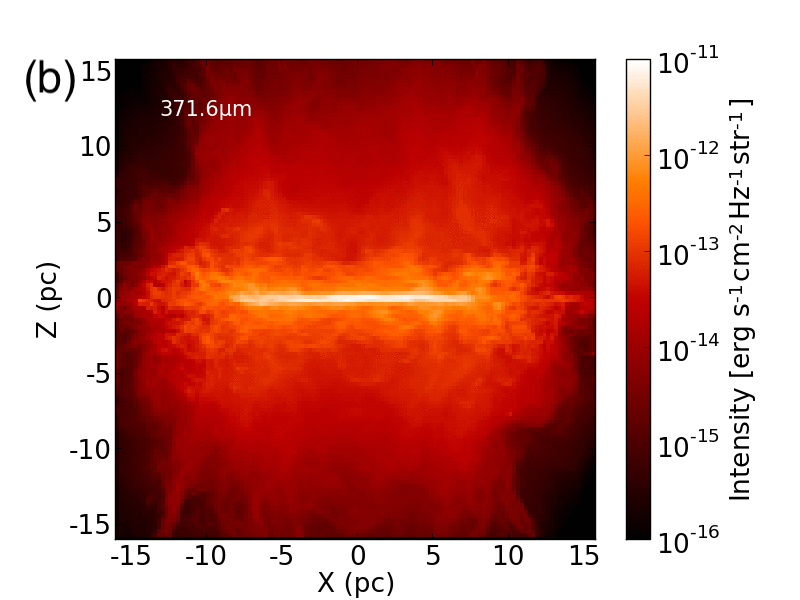
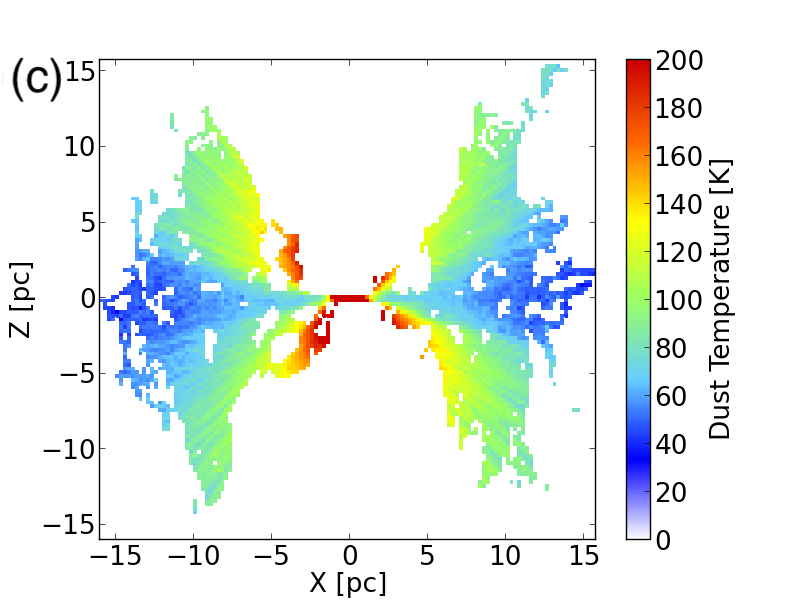
The 2D distribution of the dust temperature and the continuum dust emission given by Eq. (2) are shown in Fig. 5. The size of each grid cell is 0.25 pc in this case. It is clear that most of the dust emission is concentrated in the disk mid-plane (i.e., pc), and it forms a spiral-like structure in the face-on view.
3 RESULTS
3.1 Intensity maps and spectra of CO rotational transition lines
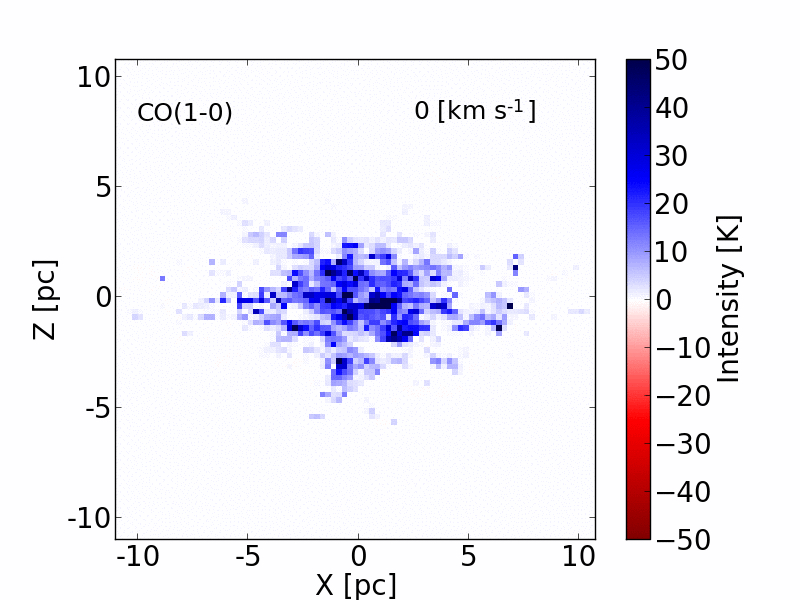
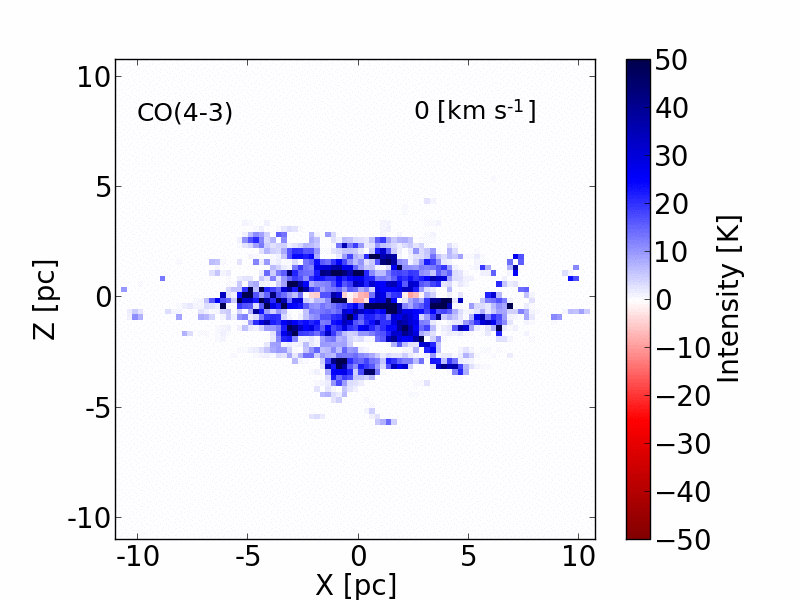
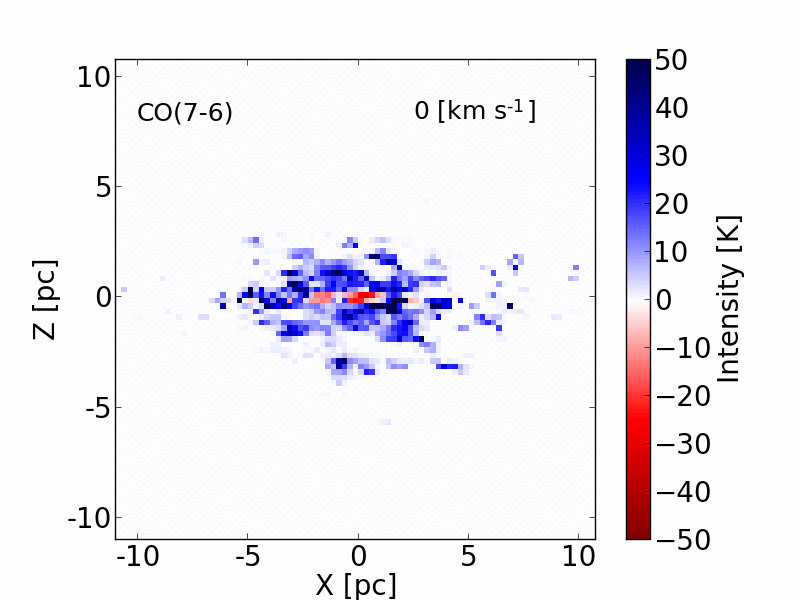
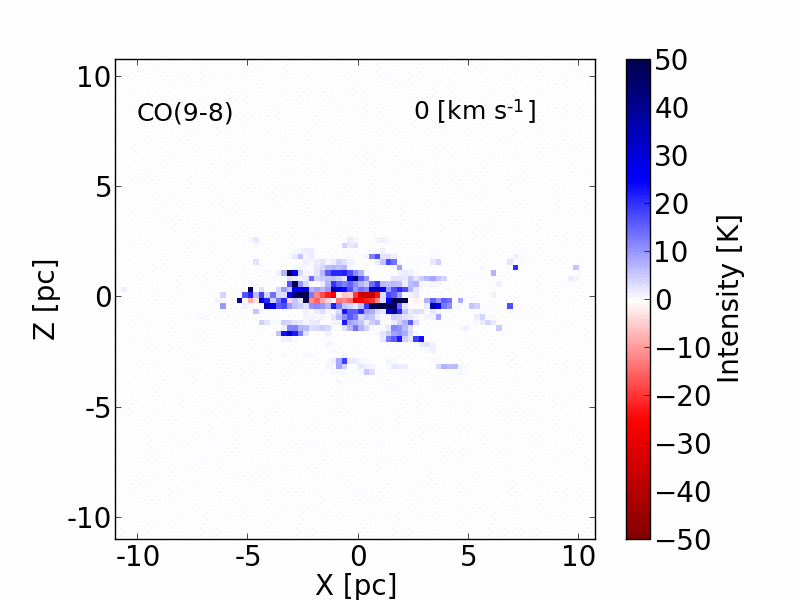
Figure 6 shows the intensity maps for km s-1 at 115.3, 461.0, 806.7, and 1036.9 GHz, corresponding to the rest frame frequencies of CO(1–0), CO(4–3), CO(7–6), and CO(9–8), respectively, for an inclination angle (i.e., edge-on). We assumed km s-1 (the effect of will be discussed in §4). In these maps, the dust continuum was subtracted from the total intensity, and hence, the negative intensity (i.e., red regions) represents absorption. The CO(1–0) map shows that the emission dominates the entire region, forming a thick disk with a scale height of pc. In contrast, absorption regions can be seen in the CO(7–6) and CO(9–8) maps, which appear as thin disks ( pc). This is because the thermal emission from the AGN-heated dust as well as the distribution of CO are concentrated along the thin disk, as seen in Fig. 5.
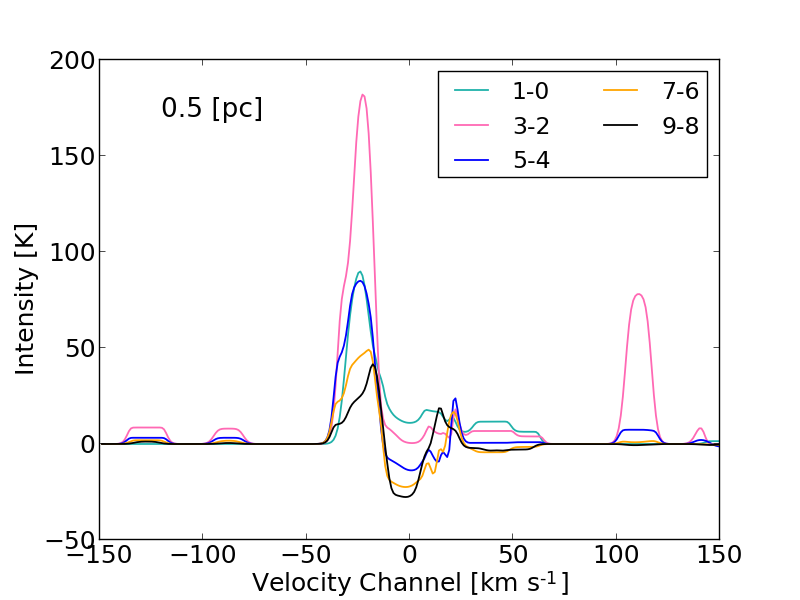
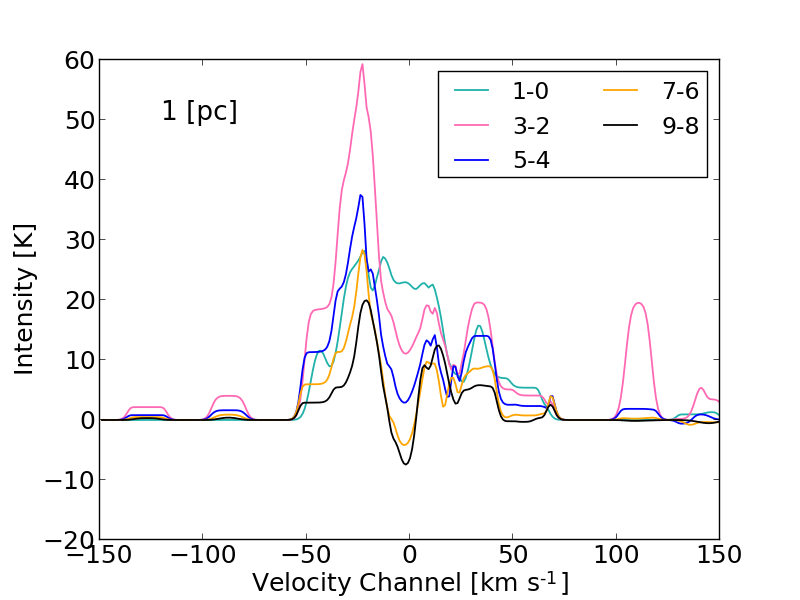
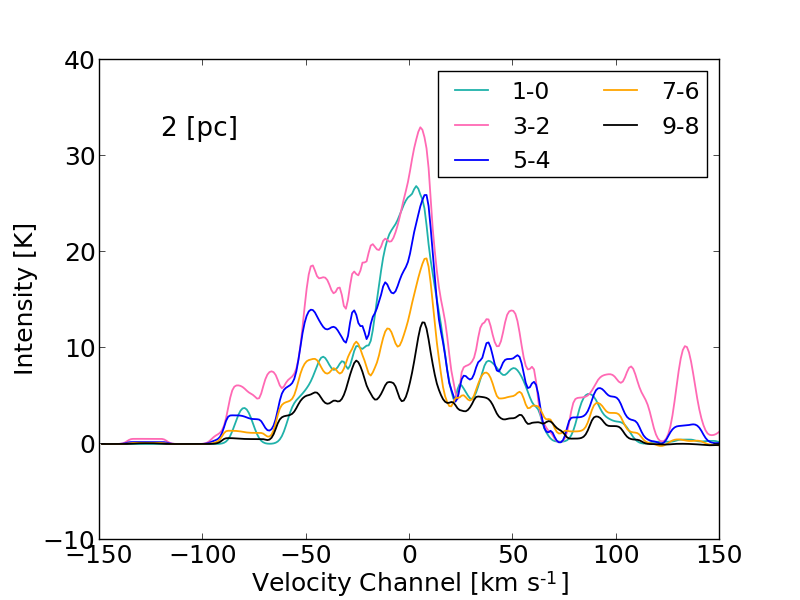
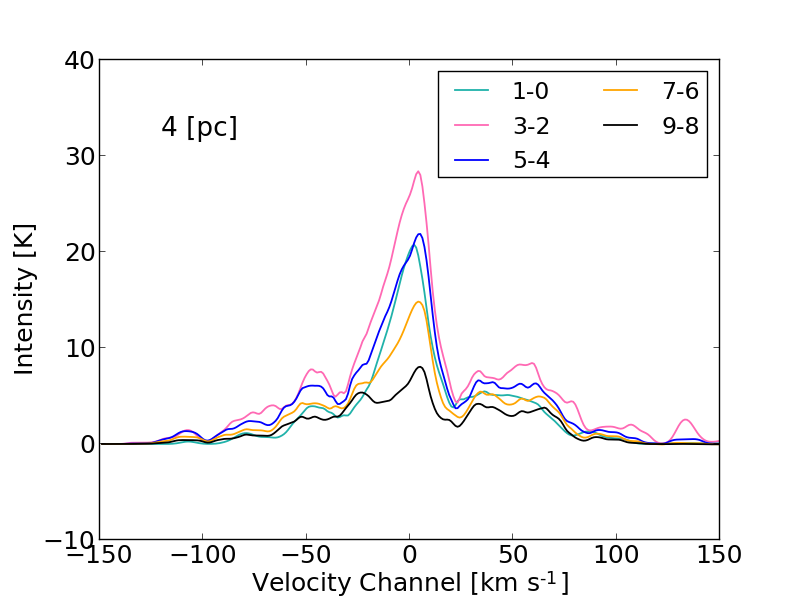
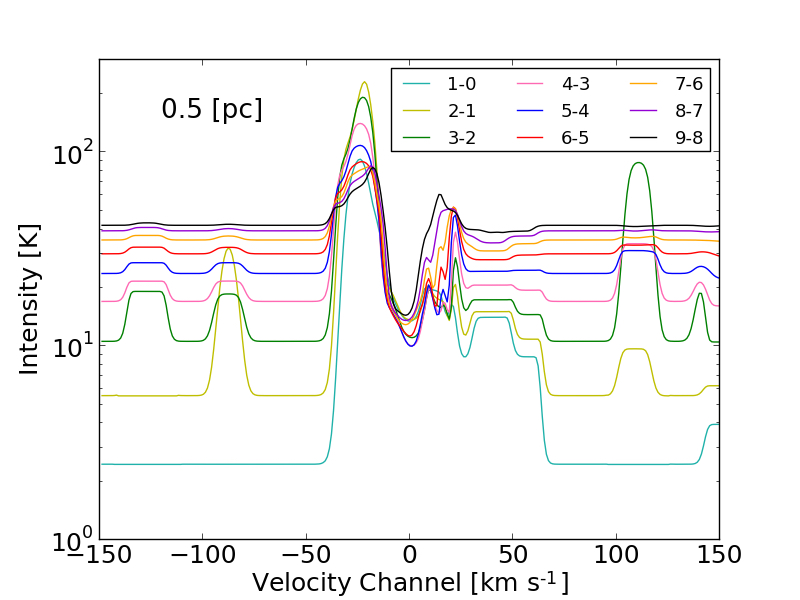
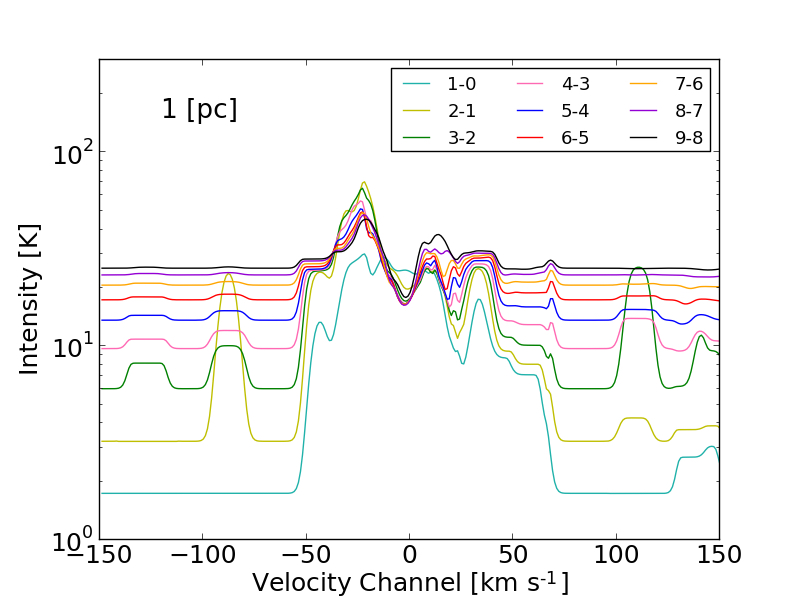
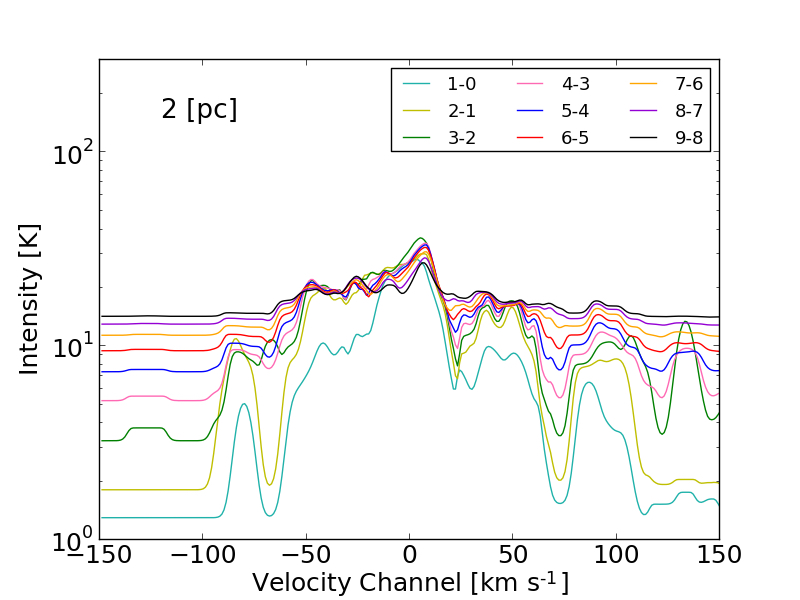
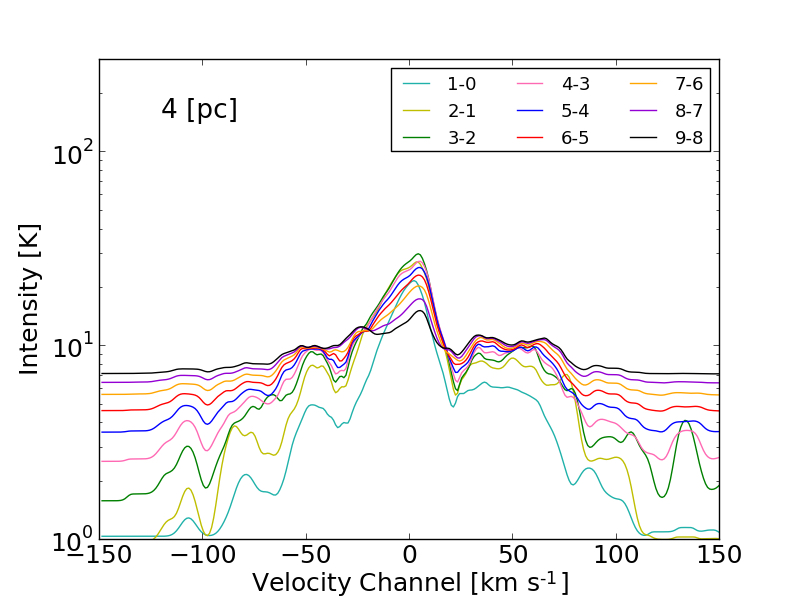
Note that if the observed beam size is not as small as the scale height of the absorption regions in Fig. 6, then the emission may contaminate the absorption, and the absorption features may not be observed. Thus, to evaluate this phenomenon quantitatively, we studied the effect of different averaging areas on the spectra. Figure 7 shows five continuum-subtracted spectra666The raw spectra before subtracting the dust continuum are presented in the Appendix. (CO(1–0) to CO(9–8)) toward the center for four different averaging areas: 0.5 pc 0.5 pc, 1 pc 1 pc, 2 pc 2 pc, and 4 pc 4 pc. We assumed that the viewing angle is edge-on. The four plots in Fig. 7 roughly correspond to observations with four different “beam” sizes. For higher- transitions, the absorption features around 0 km s-1 are more prominent for beam sizes of 0.5 and 1.0 pc. However, for beam sizes of 2 and 4 pc, only the emission lines with self-absorption-like features are observed.
Conversely, for lower- transitions, such as CO(1–0) and CO(3–2), the intensity is positive throughout the velocity range. Independent emissions are also observed at km s-1 , which correspond to high-velocity components with non-circular motions near the center ( pc) (see Fig. 9).
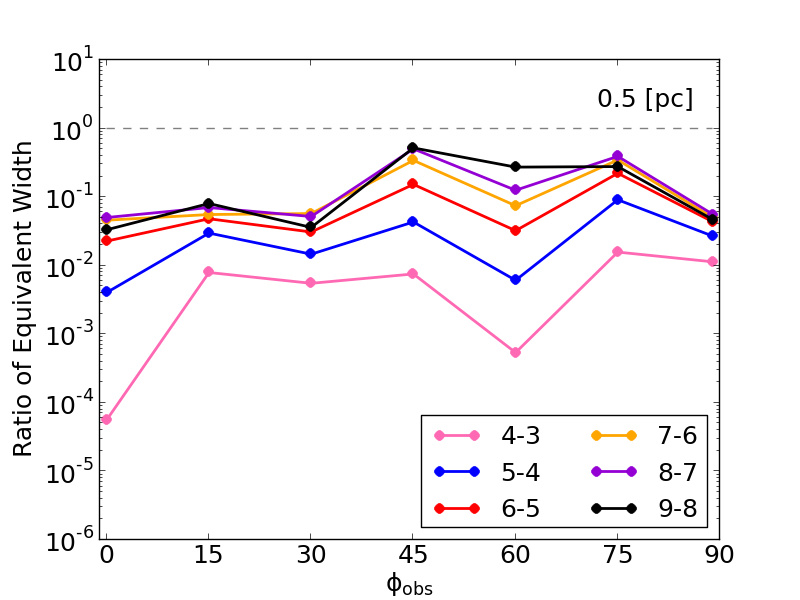
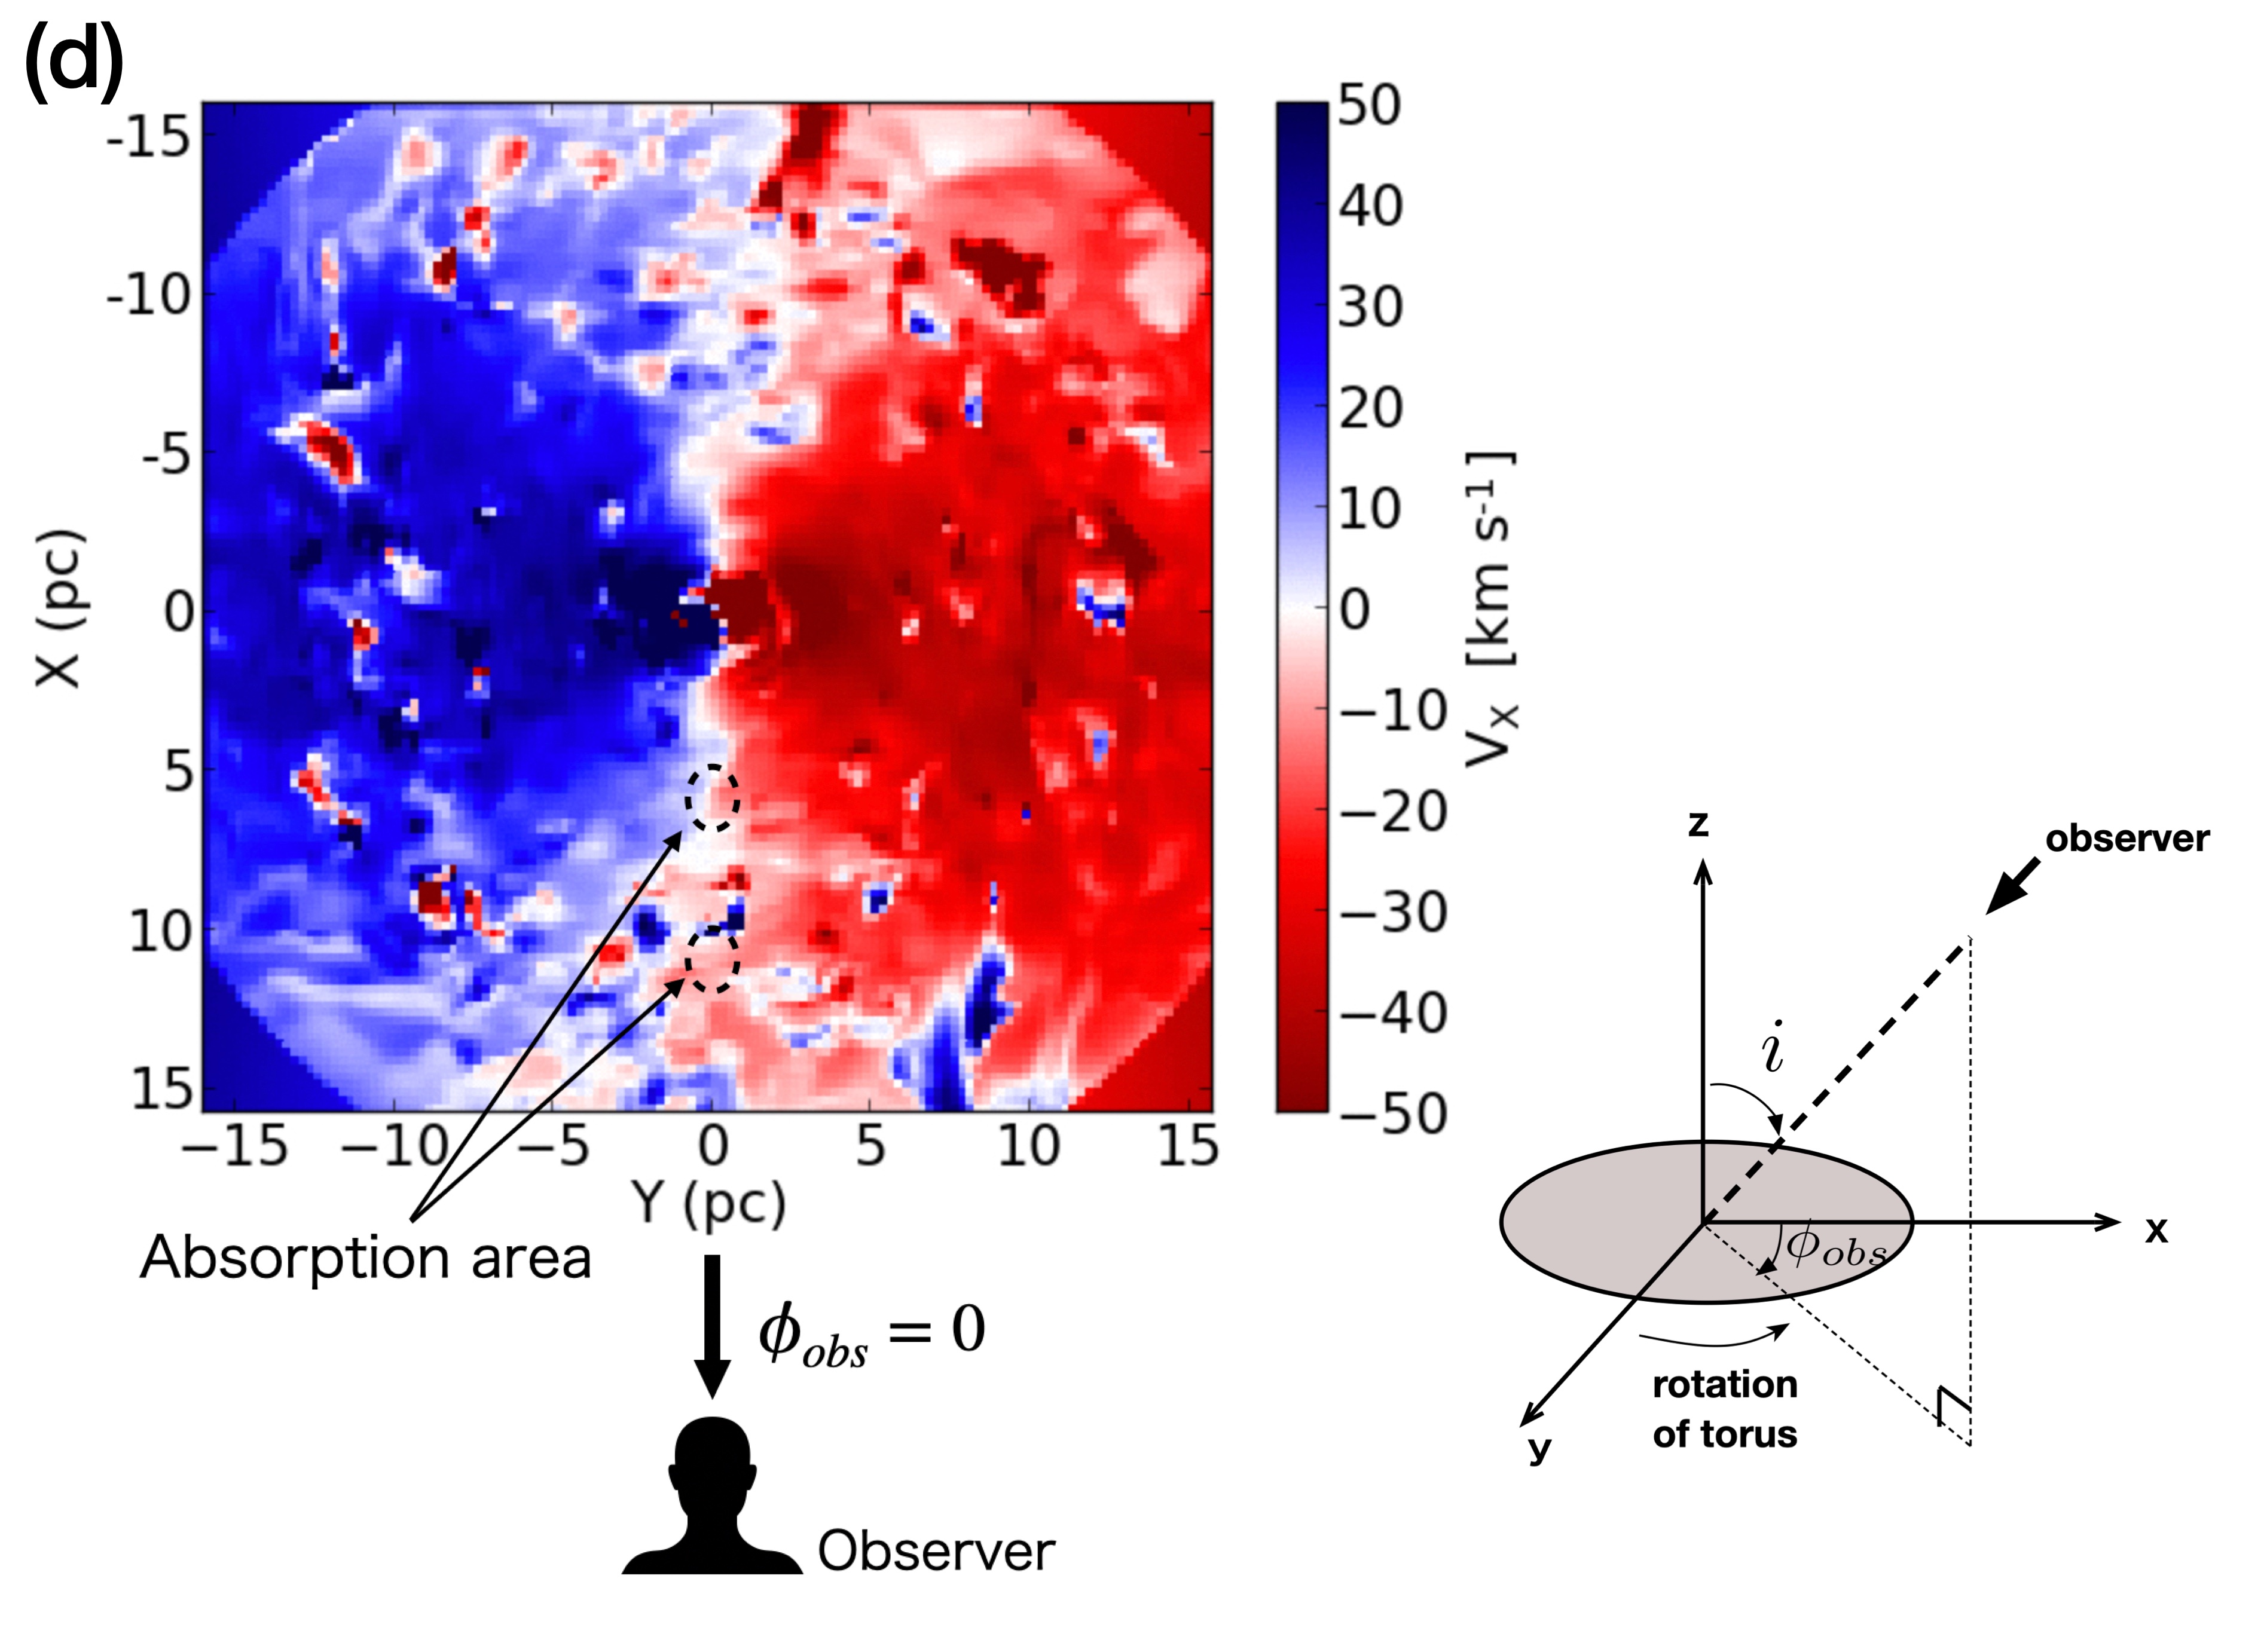
Note that in Figs. 6 and 7, we fixed the azimuthal angle of the observer (, see Fig. 9(d) ) to . However, the input model used in this work, that is, the radiation-driven fountain model (Wada et al., 2016), emplys a fully 3D calculation that does not assume axisymmetry. Moreover, the structure of the ISM is not necessarily homogeneous in the azimuthal direction, as also seen in Figs. 2 and 5(a). Therefore, we expect the spectra to depend on for a given inclination angle. To quantify this, in Fig. 8, we plot as a function of the azimuthal angle for CO(1–0), …, CO(9–8) at , where is the ratio of the equivalent width of an emission line to that of an absorption line against the continuum, defined as
| (6) |
If , then the spectral features are dominated by emission in the velocity range to km s-1 . A larger value of implies stronger absorption features, as seen in Fig. 7 for a beam size of 0.5 pc. Figure 8 shows that although the emission dominates for all azimuthal angles, there is more absorption at higher- transitions, such as , and . For transitions with and higher, we find that . We also observe that there are weak variations in with , which reflects the non-uniform structure of the density and velocity in the torus.
3.2 Origin of the spectral features
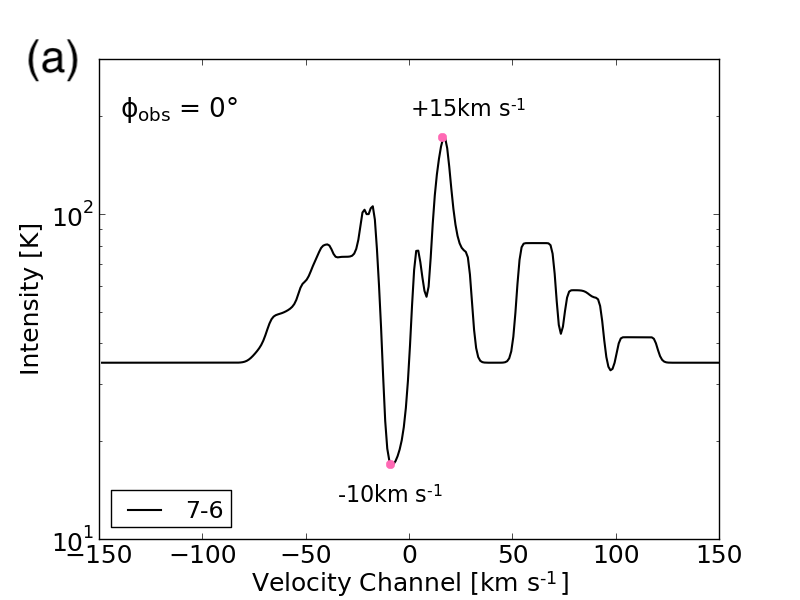
One of the main advantages of our model is that we can use it to identify the formation mechanism of the absorption (or emission) line features in the obtained spectra as well as their location along the line of sight. This information is important for understanding the structures of the molecular tori when interpreting spectra in future observations. To demonstrate this, in Fig. 9, we compare the spectrum, change in intensity along the line of sight and velocity field of CO(7–6) obtained using our input model. Figure 9(a) shows the CO(7–6) spectrum for and . The spectrum has several positive and negative peaks777Note that in Fig. 9, is observed along (i.e., ); hence, positive velocities imply that the gas moves outward (i.e., blue-shifted), and negative velocities imply that the gas moves inward (i.e., red-shifted)., but we only focused on the two prominent features at km s-1 and km s-1 .
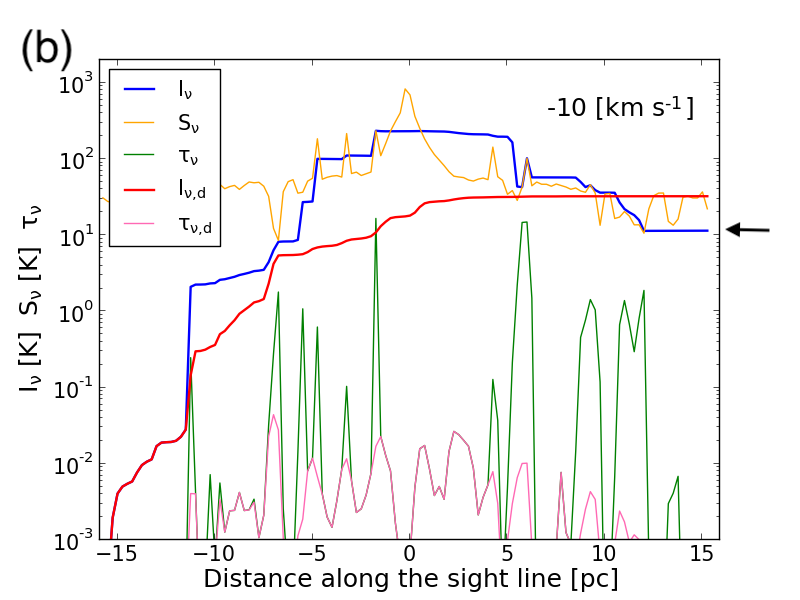
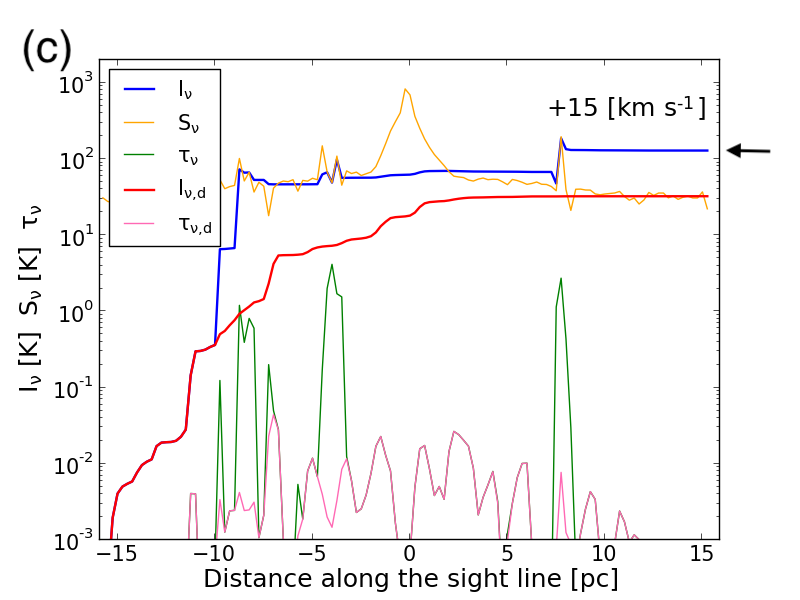
In Figs. 9(b) and (c), the observer is located on the extreme right (i.e., far beyond pc). Now, if the observed intensity (blue solid line) is less than the intensity of dust emission (red line), then it appears as an absorption feature, else it appears as an emission feature. Fig. 9(b) shows that the strong absorption feature at km s-1 appears between 10 and 16 pc, which corresponds to the outer region of the torus. The emission line feature at km s-1 is mainly caused by the dense region with at pc.
These spectral features also reflect the internal velocity field of the torus. In Fig. 9(d), the line-of-sight velocity () field is plotted for an observer located at and . The absorption feature at km s-1 corresponds to the inflow component seen in red at pc. This inflow component can also be observed on the opposite side (i.e., pc and ). The two strong absorption features at km s-1 seen in Fig. 9(b) are indicated by dashed circles in Fig. 9(d). The emission line at km s-1 seen in Fig. 9(a) originates from one of the clumpy “blue” regions along . The clumpy regions around pc observed in the velocity map are caused by supernova feedback in the radiation-driven fountain model (Wada, 2012; Wada et al., 2016). This feedback makes the torus geometrically thick, as seen in Fig. 1(a), and hence, some of the emission features with high velocities in the CO spectra (see Fig. 7) depend on the observer’s azimuthal angle . This is also the reason for the weak dependence of on (see Fig. 8).
4 Discussion and implications for future observations
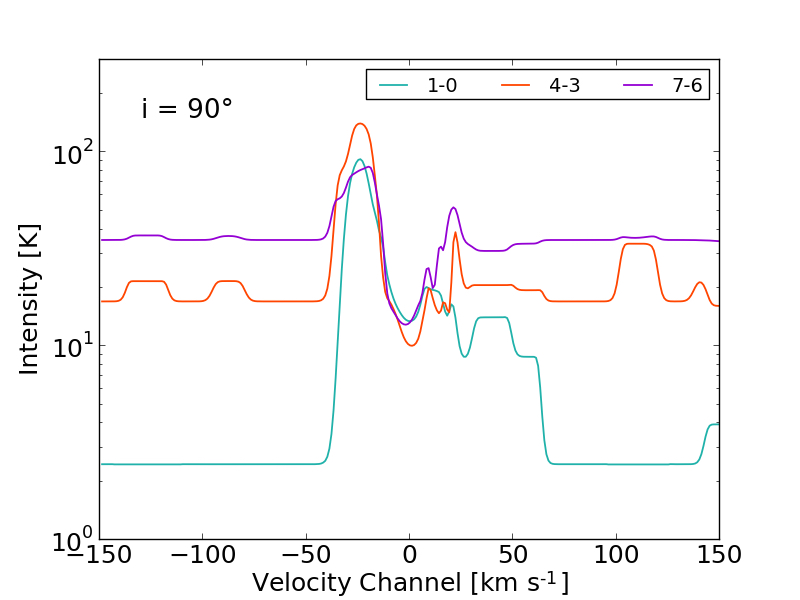
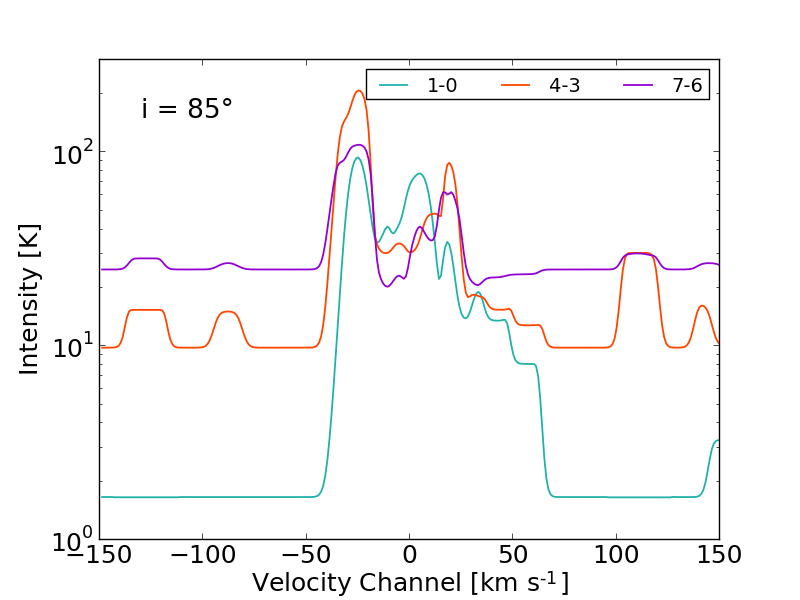
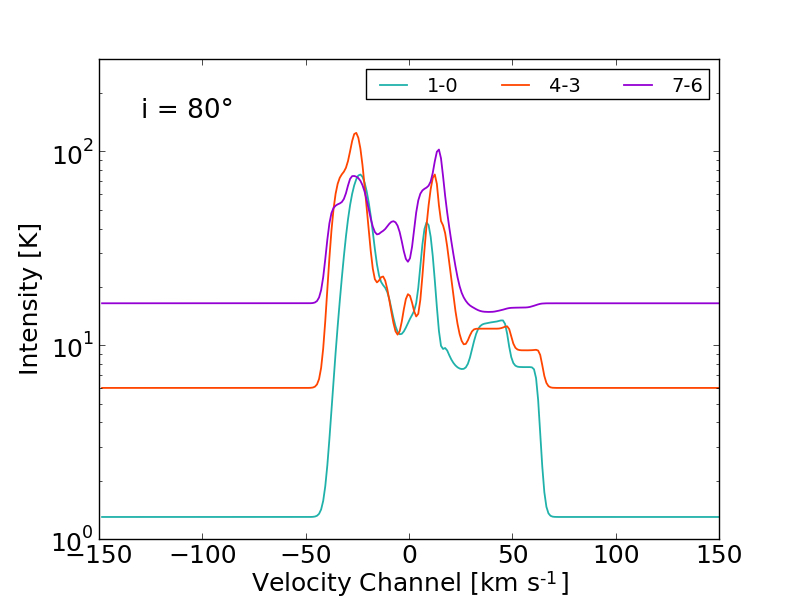
In recent ALMA observations, the molecular tori in some nearby Seyfert galaxies have been spatially resolved (García-Burillo et al., 2014, 2016; Imanishi et al., 2016, 2020; Izumi et al., 2018; Combes et al., 2019). According to the unified model of AGNs, the tori in type-2 AGNs should be close to edge-on; however, their inclination angles are not precisely determined. In W16, the infrared SED was estimated using the same hydrodynamic model as in this work, and it was suggested that the inclination angle of the torus should be larger than in the Circinus galaxy to explain the absorption feature at m in the observed SED. This is consistent with the cone-like structure of the NLR observed in the Circinus galaxy (Paper III). In this study, we investigated the dependence of the absorption features owing to the rotational transitions of CO on the inclination angle of the torus.
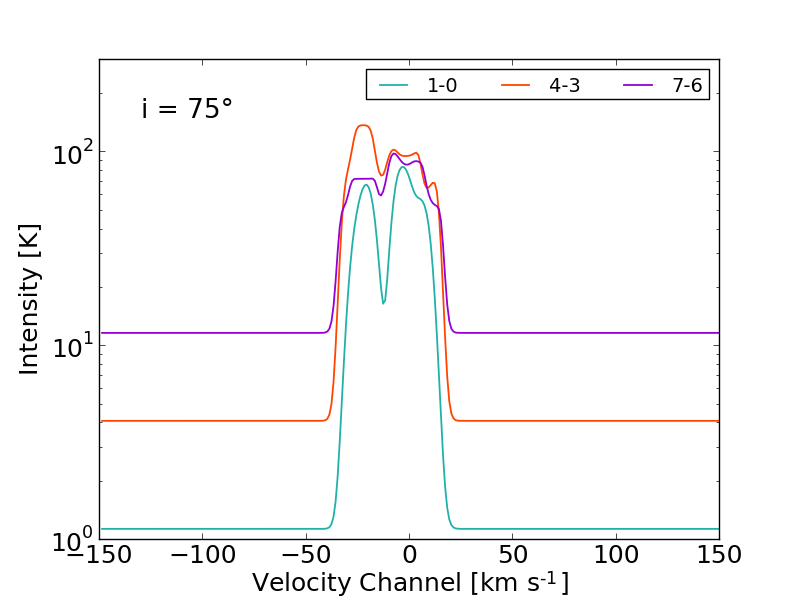
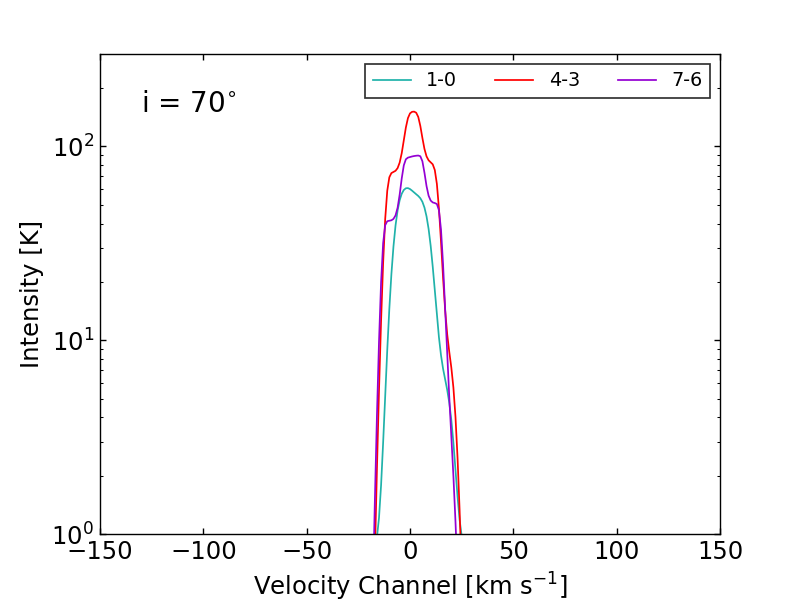
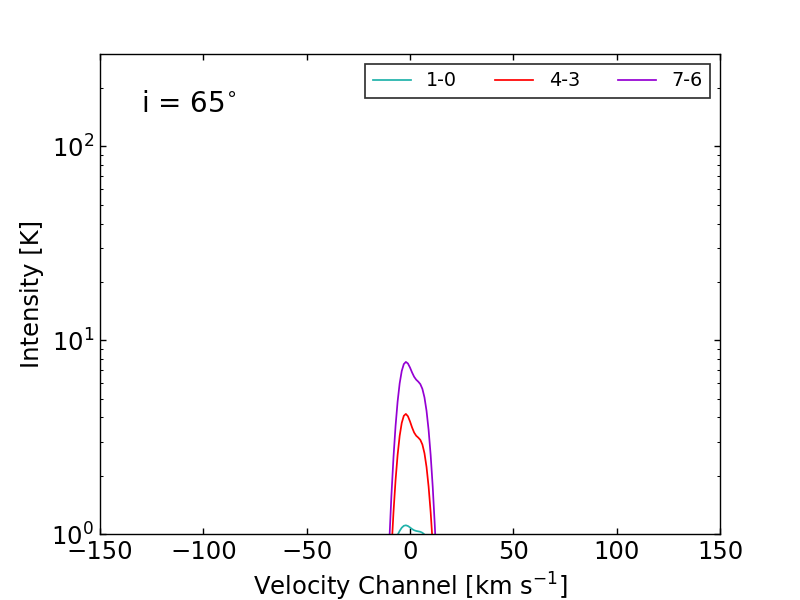
Fig. 10 shows the spectra of three transitions, CO(1–0), (4–3), and (7–6), for six different viewing angles toward the nucleus. We observe that the deep absorption feature at km s-1 in the CO(4–3) and (7–6) spectra becomes shallower for and ; whereas no absorption features are observed for , or smaller. For the smaller viewing angles (i.e., close to face-on), there is almost no dense molecular gas along the line of sight (see Fig. 1), if the beam size is small, therefore we observe weak emissions even for CO (1-0). It should be noted that the spectra also depend weakly on the azimuthal angle, because of the internal inhomogeneous structure of the torus (see Fig. 8). However, we find that the absorption features are more sensitive to the inclination angle. For example, for CO(7–6), absorption features against the continuum are detected for five azimuthal directions out of nine for and , whereas no absorption features are observed against the continuum for . In other words, to detect absorption features in the continuum of the CO rotational transition lines, it is necessary (but not sufficient) for the torus to be close to edge-on, that is, .
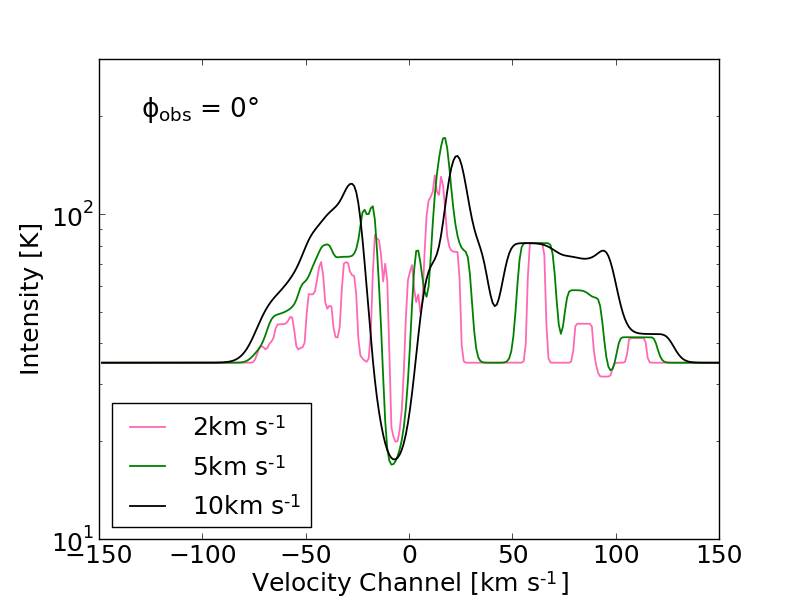
In the results presented in §3, we assumed that the internal turbulent velocity or “micro”-turbulence in each grid cell of size (0.25 pc)3 was 5 km s-1 . In Fig. 11, we plot the CO(7–6) spectra for different turbulent velocities, namely, and 10 km s-1 . The deepest absorption line at km s-1 appears for all three cases, but the line width decreases with the turbulent velocity. Moreover, the broad emission line features seen for km s-1 are split into multiple emission and absorption lines for km s-1 .
If the continuum absorption is observed in nearby type-2 Seyfert galaxies (e.g., the Circinus galaxy) by future high-resolution observations, we could obtain some information about the internal velocity structures of the molecular torus. Our results suggest that the width of the continuum absorption depends on the assumed turbulence velocity below the spatial scale of 0.25 pc; it is km s-1 for km s-1 at FWHM, and km s-1 for 2.5 km s-1 . As shown in §3, the continuum absorption is mainly generated from the gas around r = 10-15 pc (Fig. 9), where the velocity dispersion of the gas in the input model is km s-1 ; whereas the rotational velocity at the radius is 30 km s-1 (Fig. 11(bottom)). Therefore, the line width of the continuum absorption seen in the spectra reflects the internal velocity dispersion of the ISM rather than the velocity shear.
On the other hand, the self-absorption features seen in the spectra are difficult to be understood in principle because it cannot be distinguished from multiple emission lines. However, Fig. 11 shows that the emission lines for 2 km s-1 and 10 km s-1 are clearly different. In the former case, the emission features around the continuum absorption are separated into several components. Thus, the structures of the emission features may also reflect to the internal velocity field on a sub-pc scale.
5 Conclusions
Absorption features owing to silicates and CO rotation-vibration transitions are powerful tools for understanding the physical conditions and structure of the dense ISM in AGNs, such as ULIRGs (see e.g., Spoon et al., 2004; Shirahata et al., 2013, 2017; Baba et al., 2018). However, absorption features of molecular lines in the millimeter and submillimeter wavelength range have never been observed in Seyfert galaxies (Okuda et al., 2013), where the dust in the molecular tori is heated by the nuclear radiation. Although the dust temperature is not high (i.e., 100 K), it could still lead to the formation of a background source. Therefore, it is important to understand the conditions necessary to observe CO absorption features against the dust continuum.
To address this problem theoretically, in this work, we used a realistic 3D physical model that includes both the dust component and molecular gas distribution. Specifically, we used the radiation-driven fountain model (Wada, 2012; Wada et al., 2016), from which we calculated both the background dust continuum and molecular line intensities. The temperature of the dust associated with the ISM was self-consistently determined from the radiation field of the AGN. The hydrodynamic model employed consistently explains the multi-wavelength observations of the Circinus galaxy, as discussed in the previous papers of this series (Papers I–III).
In contrast to Papers I and II,
in this study, we conducted new three-dimensional radiative transfer calculations
including both the continuum emission owing to the AGN-heated dust
and the emission owing to the rotational transition lines of CO.
We investigated the spectral properties of several CO rotational lines () and calculated
the dust thermal emission
using the three-dimensional radiative transfer code RADMC-3D (Dullemond et al., 2012).
Our main findings can be summarized as follows:
(1) We studied the absorption features against the continuum originating from the AGN-heated dust of several tens of kelvin in the radiation-driven fountain model. We found that the continuum-subtracted channel maps of and higher transitions show absorption regions along the disk mid-plane. For lower- transitions (e.g., and ), emission features dominate, but self-absorption features exist at low velocities ( km s-1 ). The spectra consist of multiple absorption and emission features reflecting the complicated structure of the density and velocity in the torus. The deepest absorption feature is caused by the infalling gas on the near-side of the torus between and 15 pc, which is located in front of the heated dust within pc.
(2) We found the conditions necessary to detect CO absorption features against the continuum, which are: (a) the transitions should be at or higher, (b) the spatial resolution should be high, in the range 0.5–1.0 pc, and c) the tori should be observed nearly edge-on (i.e., for CO(7–6)). Conditions (a) and (b) can be achieved by ALMA for nearby AGNs.
(3) We also found the correlation between the absorption features and the internal spatial and kinematic structure of the obscuring material, such as the bulk motion (e.g., inflow toward the center) and turbulent motion. Moreover, the internal turbulent velocity () in each grid cell (i.e., (0.25 pc)3 in the present work) was found to affect the width of the continuum absorption lines, which was established using , and 10 km s-1 .
The results presented in this work imply that appropriate conditions are required for observing CO absorption features owing to rotational transitions in the submillimeter range in nearby Seyfert galaxies. Nevertheless, our model can provide new information about the internal structure of the molecular tori in nearby AGNs when combined with ALMA observations, for example, of CO(7–6) at Band 10.
Appendix
Figure 12 shows the same spectra as in Fig. 7 but without subtracting the dust continuum. These raw spectra show that the continuum levels are higher for higher transitions. The deep absorption features in the range to km s-1 for beam sizes 0.5 and 1 pc are common for most transitions; however, they transform into self-absorption features if the continuum level is extremely high.
References
- Ádámkovics et al. (2011) Ádámkovics, M., Glassgold, A. E., & Meijerink, R. 2011, ApJ, 736, 143
- Asmus et al. (2016) Asmus, D., Hönig, S. F., & Gandhi, P. 2016, ApJ, 822, 109
- Antonucci (1993) Antonucci, R. 1993, ARA&A, 31, 473
- Baldwin et al. (1981) Baldwin, J. A., Phillips, M. M., & Terlevich, R. 1981, PASP, 93, 5. doi:10.1086/130766
- Buchner et al. (2021) Buchner, J. et al. submitted.
- Baba et al. (2018) Baba, S., Nakagawa, T., Isobe, N., et al. 2018, ApJ, 852, 83. doi:10.3847/1538-4357/aa9f25
- Chan & Krolik (2017) Chan, C.-H., & Krolik, J. H. 2017, ApJ, 843, 58
- Combes et al. (2019) Combes, F., García-Burillo, S., Audibert, A., et al. 2019, A&A, 623, A79. doi:10.1051/0004-6361/201834560
- Dorodnitsyn & Kallman (2017) Dorodnitsyn, A., & Kallman, T. 2017, ApJ, 842, 43
- Dorodnitsyn et al. (2016) Dorodnitsyn, A., Kallman, T., & Proga, D. 2016, ApJ, 819, 115
- Dullemond et al. (2012) Dullemond, C. P., Juhasz, A., Pohl, A., et al. 2012, Astrophysics Source Code Library. ascl:1202.015
- Espada et al. (2010) Espada, D., Peck, A. B., Matsushita, S., et al. 2010, ApJ, 720, 666. doi:10.1088/0004-637X/720/1/666
- García-Burillo et al. (2014) García-Burillo, S., Combes, F., Usero, A., et al. 2014, A&A, 567, A125
- García-Burillo et al. (2016) García-Burillo, S., Combes, F., Ramos Almeida, C., et al. 2016, ApJ, 823, L12
- Greenhill et al. (2003) Greenhill, L. J., Booth, R. S., Ellingsen, S. P., et al. 2003, ApJ, 590, 162
- Hönig et al. (2013) Hönig, S. F., Kishimoto, M., Tristram, K. R. W., et al. 2013, ApJ, 771, 87
- Hogerheijde, & van der Tak (2000) Hogerheijde, M. R. & van der Tak, F. F. S. 2000, A&Ap, 362, 697
- Hopkins et al. (2007) Hopkins, P. F., Hernquist, L., Cox, T. J., Robertson, B., & Krause, E. 2007, ApJ, 669, 67
- Imanishi et al. (2016) Imanishi, M., Nakanishi, K., & Izumi, T. 2016, ApJ, 822, L10
- Imanishi et al. (2020) Imanishi, M., Nguyen, D. D., Wada, K., et al. 2020, ApJ, 902, 99. doi:10.3847/1538-4357/abaf50
- Izumi et al. (2018) Izumi, T., Wada, K., Fukushige, R., et al. 2018, ApJ, 867, 48. doi:10.3847/1538-4357/aae20b (Paper II)
- Israel et al. (1990) Israel, F. P., van Dishoeck, E. F., Baas, F., et al. 1990, A&A, 227, 342
- Israel et al. (1991) Israel, F. P., van Dishoeck, E. F., Baas, F., et al. 1991, A&A, 245, L13
- Jaffe & McNamara (1994) Jaffe, W. & McNamara, B. R. 1994, ApJ, 434, 110. doi:10.1086/174708
- Kameno et al. (2020) Kameno, S., Sawada-Satoh, S., Impellizzeri, C. M. V., et al. 2020, ApJ, 895, 73. doi:10.3847/1538-4357/ab8bd6
- Laor & Draine (1993) Laor, A., & Draine, B. T. 1993, ApJ, 402, 441
- Marconi et al. (2004) Marconi, A., Risaliti, G., Gilli, R., et al. 2004, MNRAS, 351, 169
- Maloney, Hollenbach, & Tielens (1996) Maloney, P. R., Hollenbach, D. J., & Tielens, A. G. G. M. 1996, ApJ, 466, 561
- Mathis et al. (1977) Mathis, J. S., Rumpl, W., & Nordsieck, K. H. 1977, ApJ, 217, 425. doi:10.1086/155591
- Meijerink & Spaans (2005) Meijerink, R., & Spaans, M. 2005, A&A, 436, 397
- Namekata & Umemura (2016) Namekata, D., & Umemura, M. 2016, MNRAS, 460, 980
- Netzer (2015) Netzer, H. 2015, ARA&A, 53, 365. doi:10.1146/annurev-astro-082214-122302
- Netzer (1987) Netzer, H. 1987, MNRAS, 225, 55
- Okuda et al. (2013) Okuda, T., Iguchi, S., & Kohno, K. 2013, ApJ, 768, 19. doi:10.1088/0004-637X/768/1/19
- Prieto et al. (2010) Prieto, M. A., Reunanen, J., Tristram, K. R. W., et al. 2010, MNRAS, 402, 724
- Röllig et al. (2007) Röllig, M., Abel, N. P., Bell, T., et al. 2007, A&A, 467, 187. doi:10.1051/0004-6361:20065918
- Schartmann et al. (2005) Schartmann, M., Meisenheimer, K., Camenzind, M., et al. 2005, A&A, 437, 861. doi:10.1051/0004-6361:20042363
- Schartmann et al. (2014) Schartmann, M., Wada, K., Prieto, M. A., Burkert, A., & Tristram, K. R. W. 2014, MNRAS, 445, 3878 (Sch14)
- Shirahata et al. (2013) Shirahata, M., Nakagawa, T., Usuda, T., et al. 2013, PASJ, 65, 5. doi:10.1093/pasj/65.1.5
- Shirahata et al. (2017) Shirahata, M., Nakagawa, T., Oyabu, S., et al. 2017, Publication of Korean Astronomical Society, 32, 169. doi:10.5303/PKAS.2017.32.1.169
- Spoon et al. (2004) Spoon, H. W. W., Armus, L., Cami, J., et al. 2004, ApJS, 154, 184. doi:10.1086/422813
- Spoon et al. (2005) Spoon, H. W. W., Keane, J. V., Cami, J., et al. 2005, Astrochemistry: Recent Successes and Current Challenges, 231, 281. doi:10.1017/S1743921306007277
- Tristram et al. (2014) Tristram, K. R. W., Burtscher, L., Jaffe, W., et al. 2014, A&A, 563, A82
- Urry & Padovani (1995) Urry, C. M., & Padovani, P. 1995, PASP, 107, 803
- van der Tak et al. (2007) van der Tak, F. F. S., Black, J. H., Schöier, F. L., Jansen, D. J., & van Dishoeck, E. F. 2007, A&A, 468, 627
- Viti et al. (2014) Viti, S., García-Burillo, S., Fuente, A., et al. 2014, A&A, 570, A28
- Wada (2012) Wada, K. 2012, ApJ, 758, 66
- Wada (2015) Wada, K. 2015, ApJ, 812, 82
- Wada & Norman (2002) Wada, K. & Norman, C. A. 2002, ApJ, 566, L21 (WN02)
- Wada & Tomisaka (2005) Wada, K. & Tomisaka, K. 2005, ApJ, 619, 93
- Wada et al. (2009) Wada, K., Papadopoulos, P. P., & Spaans, M. 2009, ApJ, 702, 63
- Wada et al. (2016) Wada, K., Schartmann, M., & Meijerink, R. 2016, ApJ, 828, L19 (W16)
- Wada et al. (2018a) Wada, K., Fukushige, R., Izumi, T., et al. 2018, ApJ, 852, 88. doi:10.3847/1538-4357/aa9e53 (Paper I)
- Wada et al. (2018b) Wada, K., Yonekura, K., & Nagao, T. 2018, ApJ, 867, 49. doi:10.3847/1538-4357/aae204 (Paper III)
- Williamson et al. (2020) Williamson, D., Hönig, S., & Venanzi, M. 2020, ApJ, 897, 26. doi:10.3847/1538-4357/ab989e
- Yamada, Wada, & Tomisaka (2007) Yamada, M., Wada, K., & Tomisaka, K. 2007, ApJ, 671, 73