The hybrid radio/X-ray correlation of the black hole transient MAXI J1348–630
Abstract
Black hole low mass X-ray binaries in their hard spectral state are found to display two different correlations between the radio emission from the compact jets and the X-ray emission from the inner accretion flow. Here, we present a large data set of quasi-simultaneous radio and X-ray observations of the recently discovered accreting black hole MAXI J1348–630 during its 2019/2020 outburst. Our results span almost six orders of magnitude in X-ray luminosity, allowing us to probe the accretion-ejection coupling from the brightest to the faintest phases of the outburst. We find that MAXI J1348–630 belongs to the growing population of outliers at the highest observed luminosities. Interestingly, MAXI J1348–630 deviates from the outlier track at erg s-1 and ultimately rejoins the standard track at erg s-1, displaying a hybrid radio/X-ray correlation, observed only in a handful of sources. However, for MAXI J1348–630 these transitions happen at luminosities much lower than what observed for similar sources (at least an order of magnitude). We discuss the behaviour of MAXI J1348–630 in light of the currently proposed scenarios and we highlight the importance of future deep monitorings of hybrid correlation sources, especially close to the transitions and in the low luminosity regime.
keywords:
accretion, accretion discs – black holes physics – stars: individual: MAXI J1348–630 – ISM: jets and outflows – radio continuum: stars – X-rays: binaries1 Introduction
Black holes (BH) low mass X-ray binaries (LMXBs) are binary systems comprising a BH that accretes matter from a low mass companion star. Occasionally, these systems enter outburst phases during which the X-ray luminosity is greatly variable and several transitions between distinct accretion states are observed (e.g. Remillard & McClintock 2006; Corral-Santana et al. 2016; Tetarenko et al. 2016; Belloni & Motta 2016) A strong coupling exists between accretion and ejection in BH LMXBs, as the relativistic jets powered by these sources are highly dependent on the state of the accretion disk. From an observational point of view, BH LMXBs in the hard spectral state are characterised by a non-linear correlation between the radio and X-ray luminosities (, e.g. Hannikainen et al. 1998; Corbel et al. 2000; Gallo et al. 2003). Based on scale-invariant properties of black hole accretion and jet production, this correlation has also been extended to AGNs by including the mass as an additional parameter (Merloni et al., 2003; Falcke et al., 2004; Plotkin et al., 2012). BH LMXBs are divided in two populations which lie on two different tracks of the radio/X-ray diagram. Originally, the few "historical" BH sources were found to lie on a track labeled as standard, with a power law index 0.6 (such as GX 339–4, V404 Cyg and now also MAXI J1820070, Corbel et al. 2000; Corbel et al. 2003; Corbel et al. 2013; Gallo et al. 2003; Bright et al. 2020; Shaw et al. 2021). These sources appear to maintain this correlation down to the quiescent level (Corbel et al., 2013; Gallo et al., 2019; Tremou et al., 2020). As new observations accumulate, more and more sources (labeled outliers) were found to lie on a different branch, well below the standard track, with a steeper slope (Coriat et al., 2011). We note that in some works the two populations are referred to as radio-loud and radio-quiet, one of the two ways to interpret the data, see Coriat et al. (2011) for more details. Outliers could be characterized by more negative radio spectral indices (Espinasse & Fender, 2018) and lower rms variability (Dinçer et al., 2014; Motta et al., 2018) with respect to standard track sources, which may be indications for understanding the nature of the two different tracks. While the reasons for the the existence of this dichotomy are still unclear, several explanations for the observed scenario have been proposed. A physical difference in the disk-jet coupling may be responsible for the two groups. This could originate from the structure of the inner accretion flow or alternatively the properties of jets might differ between the two tracks, causing different levels of radio emission (Coriat et al. 2011; see also Section 4 for more details). The existence of the two tracks has also been questioned statistically (e.g. Gallo et al. 2014; Gallo et al. 2018) if one considers the whole sample of sources. However, it is particularly important to precisely track the behaviour of specific sources, such as H1743–322 (Coriat et al., 2011; Williams et al., 2020), for which the path on the diagram is very clear, to pinpoint the overall behaviour which may be masked in the whole sample due to overlap of sources and possible transition between the two tracks.
In this Letter we present radio and X-ray observations of MAXI J1348–630 to highlight its behaviour on the radio/X-ray diagram. Thanks to the deep and long term coverage of our multi-wavelength monitoring, we are able to probe the source behaviour on the radio/X-ray diagram in great detail, from the bright phases, down to the lowest level of emission in outburst, when the source is close to its quiescent state. So far this has been possible for only a limited number of sources, especially over a single outburst (see for instance Corbel et al. 2013 and Shaw et al. 2021). MAXI J1348–630 is a new BH LMXB discovered in January 2019 (Yatabe et al., 2019; Tominaga et al., 2020), located at a distance kpc (Chauhan et al., 2021). We note that Lamer et al. (2021) recently reported a distance kpc from observations with eROSITA. While in this paper we assume kpc, to include the second distance measurement we quote all derived luminosities with a factor . In Carotenuto et al. (2021) we have presented the full X-ray and radio monitoring of the source during its 2019/2020 outburst. The source first completed a whole cycle in the Hardness Intensity Diagram (HID), and then exhibited a sequence of hard state re-brightenings (e.g. Russell et al. 2019b; Al Yazeedi et al. 2019; Pirbhoy et al. 2020). Our radio observations detected and monitored the rise, quenching and re-activation of compact jets through the different phases of the outburst. In addition, single-sided and resolved discrete ejecta were detected (Carotenuto et al., 2021). Two jet components were launched 2 months apart and both displayed a very high proper motion ( mas day-1).
2 Observations
MAXI J1348–630 has been monitored with MeerKAT (Jonas & MeerKAT Team, 2016; Camilo et al., 2018) at 1.28 GHz, as part of the ThunderKAT Large Survey Programme (Fender et al., 2017), and with the Australia Telescope Compact Array (ATCA) at 5.5 and 9 GHz. On the X-ray side, MAXI J1348–630 was regularly monitored by the Neil Gehrels Swift Observatory (Gehrels et al., 2004) with the X-ray Telescope (XRT, Burrows et al. 2005), and by the Monitor of All-sky X-ray Image (MAXI, Matsuoka et al. 2009). The full observing campaign on MAXI J1348–630 has already been presented in Carotenuto et al. (2021) and we refer to that work for details on the radio and X-ray data processing. In this work we also include two additional detections of MAXI J1348–630 during its seventh hard state re-flare (September-October 2020, Negoro et al. 2020; Carotenuto et al. 2020), from observations performed with MeerKAT, ATCA and Swift/XRT and not reported in Carotenuto et al. (2021).
3 The Radio/X-ray correlation of MAXI J1348–630
To characterise the behaviour of MAXI J1348–630 in the radio/X-ray diagram, we selected epochs with quasi-simultaneous ( h) radio and X-ray observations between MJD 58509 and 58522, and after MJD 58597, during which the system was in the hard and intermediate state (see Zhang et al. 2020 and Carotenuto et al. 2021 for details on the state transitions). For each epoch we converted the measured radio flux density to the 5 GHz monochromatic luminosity , assuming a distance kpc and using either the measured spectral index (see Table 1) when available, or the average spectral index . The unabsorbed 1–10 keV X-ray flux obtained from Swift/XRT was converted to the integrated luminosity . For simultaneity, we selected Swift epochs taken less than 24 hours before or after the corresponding radio observations. When this was not possible, we interpolated the X-ray flux from a exponential fit to the smoothly-evolving Swift/XRT light curve, adding a conservative 10% error on the interpolated X-ray fluxes and checking the consistency with the simultaneous MAXI data. This leads to a sample of 44 measurements on the radio/X-ray diagram, with a total of 39 detections of MAXI J1348–630 in radio and X-rays.
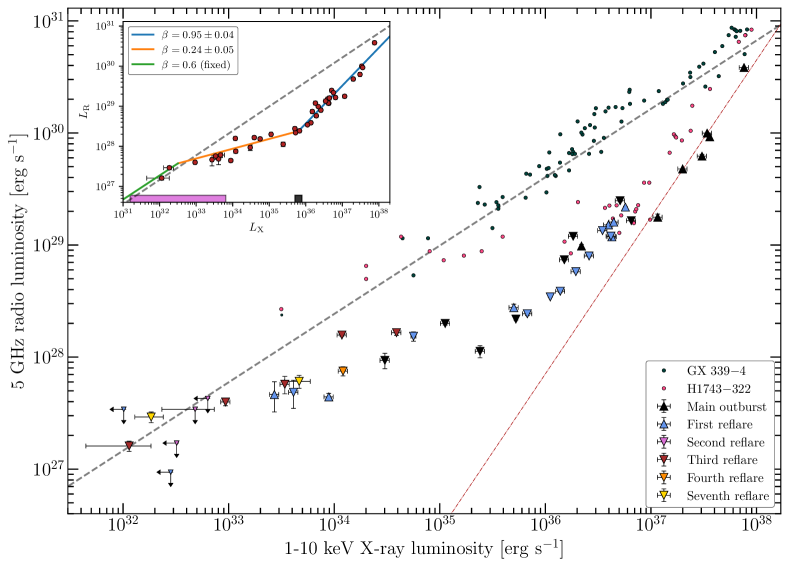
A sample of the flux values is reported in Table 1, while the full data set is provided as online supplementary material, and the radio/X-ray measurements of MAXI J1348–630 are shown in Figure 1. We note that our monitoring allowed us to probe the behaviour of MAXI J1348–630 over six orders of magnitude in the X-ray luminosity and almost four in its radio luminosity, which so far has rarely been possible for XRBs. Moreover, our measurements include three detections at erg s-1, which are of key importance to probe the accretion/ejection connection at the lowest luminosities. To allow a direct comparison, measurements of GX 339–4 (Corbel et al., 2013; Tremou et al., 2020) and H1743–322 (Coriat et al., 2011) are also shown, as the two sources are representative of the standard and outlier branches, respectively. MAXI J1348–630 immediately appeared to be incompatible with the standard track, being significantly fainter in radio than GX 339–4 below erg s-1. For between 5 and erg s-1 the source appeared to follow a steep correlation, globally consistent with the population of outliers. We note that the track followed during the decay of the main outburst was brighter in radio with respect to the rising phase, possibly similar to the rise and decay phases of the 2010/2011 outburst of GX 339–4 (Corbel et al., 2013). For erg s-1, MAXI J1348–630 transitioned to a flatter correlation. Unlike the main outburst, the rise and decay of the first reflare are consistent with the same track. On MJD 58614, 58621 and 58628 the radio core detected with MeerKAT was not completely separated due to the presence of discrete ejecta, hence we put a caveat on the radio fluxes obtained from source fitting in those three epochs (the two detections with the lowest radio emission during the decay of the main outburst and the faintest radio detection during the rise of the first reflare, see Figure 1. As decreases, the source ultimately re-joins the standard track at erg s-1 and is clearly detected down to 10 erg s-1, displaying a behaviour similar to H1743–322 (Coriat et al., 2011), but transitioning between the two tracks at vastly lower radio and X-ray luminosities.
We fit our radio and X-ray data of MAXI J1348–630 using curvefit from the SciPy package to obtain a tentative estimation of the correlation slopes. Visual inspection shows that, given the evolution of MAXI J1348–630 on the diagram, a single power law does not appear to be adequate to fit the whole data set. Therefore, we adopt a double-broken power law, making the distinction between a steep branch followed when , a flatter correlation for , and assuming that the source follows the standard track with for . We note that this fit is for illustrative purposes, and the results should only be taken as indicative, given the significant dispersion of the data obtained by merging the various phases of the outburst. The results of the fit are shown in the inset of Figure 1. For the high luminosity part, we obtain a slope with erg s-1, while the fit yields for the flat branch. Since we fixed , the only parameter left is , namely the transition luminosity between the flat branch and the standard track, which is not constrained by the fit, as we obtain: erg s-1. While the other parameters of the fit depend weakly on the unconstrained value of , this means that we cannot in principle rule out that the flat branch extends down to quiescence. However, we note that for H1743–322 and Swift J1753.5–0127, the two sources more similar to MAXI J1348–630, there is clear evidence that the standard track is followed in the low-flux regime (Coriat et al., 2011; Williams et al., 2020; Plotkin et al., 2017). Moreover, we note that points with erg s-1 seem to be more consistent with the steeper correlation , which is also shown for illustrative purpose on Figure 1.
| MJD | Outburst phase | X-ray fluxb | Radio flux density | Spectral index | Telescopes |
|---|---|---|---|---|---|
| 1–10 keV | mJy | ||||
| 58509.9 | Main outburst rise | 38.1 0.3 | 3.4 0.1 | 0.02 0.09 | ATCA/Swift |
| 58511.0 | 201 20 | 6.2 0.4 | 0.1 0.2 | ATCA/Swifta | |
| 58512.0 | 346 35 | 13.70 0.05 | MeerKAT/Swifta | ||
| 58514.0 | 528 53 | 21.9 0.8 | 0.18 0.02 | ATCA/Swifta | |
| 58515.2 | 590 59 | 28.6 0.1 | MeerKAT/Swifta | ||
| 58515.9 | 625 3 | 34.4 1.4 | ATCA/Swift | ||
| 58519.9 | 1320 132 | 135 1 | 0.155 0.003 | ATCA/Swifta | |
| a Interpolated X-ray flux. | |||||
| b In units of 10-10 erg cm-2 s-1. | |||||
4 Discussion
We have presented a detailed view of the radio/X-ray correlation of MAXI J1348–630 during its 2019/2020 outburst. The source clearly belongs to the growing population of outlier BHs. We traced the evolution of MAXI J1348–630 down to very low luminosities and observed it as it rejoined the standard correlation. Spanning six orders of magnitude in X-ray luminosity, the observations collected on MAXI J1348–630 constitute the most complete data set of an outlier obtained over a single outburst.
4.1 Evidence for an hybrid correlation
We find that MAXI J1348–630 is a new member of a restricted group of sources which appear to transition between the two known tracks. This particular behaviour, labeled hybrid (Xie & Yuan, 2016), has already been observed (usually only partially) in H1743–322 (Coriat et al., 2011; Williams et al., 2020), Swift J1753.5–0127 (Plotkin et al., 2017), XTE J1752–223 (Ratti et al., 2012), MAXI J1659–152 (Jonker et al., 2012), GRS 1739–278 (Xie et al., 2020), MAXI J1535–571 (Russell et al., 2019a; Parikh et al., 2019) and MAXI J1631–472 (Monageng et al., 2021). However, MAXI J1348–630 is, after H1743–322, only the second source in this regime to have such detailed monitoring, allowing the radio/X-ray behaviour to be so well constrained. Other sources classified as outliers have not been observed at such low luminosity (e.g. Corbel et al. 2004; Brocksopp et al. 2005). In fact, all outliers could also belong to the hybrid class (Motta et al. 2018, see Bahramian et al. 2018 for a global display of the diagram). The path of MAXI J1348–630 in the radio/X-ray diagram agrees well with H1743–322 (Jonker et al., 2010; Coriat et al., 2011). We note that, while both sources display a steep correlation at high luminosities and re-join the standard track before approaching quiescence, MAXI J1348–630 overall spans a broader range in and , and is significantly fainter in radio than H1743–322 in the flat part of the correlation. Moreover, the transition luminosity between the two correlations is harder to identify in MAXI J1348–630 than in H1743–322, for which Coriat et al. (2011) find erg s-1 assuming a distance of 8 kpc, corresponding to , and for which the standard track is reached at . This is higher than what is inferred for MAXI J1348–630 in this work. If we assume a 7 black hole (Tominaga et al., 2020; Carotenuto et al., 2021), the indicative value of erg s-1 corresponds to a transition happening at 7 10, while MAXI J1348–630 would re-join the standard track at the low value of 10. It is important to note that our monitoring was conducted during a single outburst (including the following reflares), while the data on H1743–322 were accumulated over multiple outbursts (Coriat et al., 2011; Williams et al., 2020).
4.2 The radio-quiet hypothesis
There is not yet a universal consensus on the origin of the two tracks and on what drives the change in correlation of a given source on the radio/X-ray diagram. As outlined by Coriat et al. (2011), the two groups might be characterised by different levels of radio emission, possibly arising from different jet properties. Standard track sources and outliers could be labeled as, respectively, radio-loud and radio-quiet. As suggested by Motta et al. (2018), the existence of two populations on the diagram may be the result of geometric effects, rather than intrinsic differences between sources. Low inclination sources could appear radio-louder due to geometry and Doppler boosting, and thus would lie on the standard track. While we still lack a precise estimation of the MAXI J1348–630 inclination angle , considerations on the discrete ejecta proper motion yield (Carotenuto et al., 2021). Hence, as a medium-low inclination source, geometric effects might not be suited to explain the fainter level of radio emission from MAXI J1348–630, similarly to what has been found for MAXI J1535–571 (Russell et al., 2019a; Parikh et al., 2019). However, misaligned jets are possible (e.g. Miller-Jones et al. 2019).
Alternatively, physical differences between compact jets from different systems might be at the basis of the observed dichotomy on the diagram. Hints of a radio spectral difference between standard sources and outliers have been found by Espinasse & Fender (2018), possibly supporting this hypothesis. Compact jets powered by MAXI J1348–630 showed an average spectral index , which is more in agreement with a standard-track source than with an outlier. We tested the agreement with a Kolmogorov-Smirnov test on our spectral index distribution against the Gaussian distributions from Espinasse & Fender (2018), similarly to Williams et al. (2020). The null hypothesis was our distribution being consistent either with the standard or with the outlier distribution. For the outlier case, we find a p-value of 10-5, while we obtain a p-value of 0.33 when we test our distribution against the standard one. Therefore, we are able to reject the null hypothesis in the first case, concluding that the jet spectral index distribution of MAXI J1348–630 is inconsistent with what is observed for the population of outliers. We cannot draw conclusions regarding the agreement with the distribution observed in standard sources.
If a physical difference in the jets can explain the two tracks, this could possibly imply a change in the properties or in the morphology of the jets when sources belonging to the hybrid correlation transition between the two groups, as argued in Koljonen & Russell (2019). This should produce observable effects, including, according to Espinasse & Fender (2018), a significant change in the radio spectral index distribution between the tracks. For MAXI J1348–630 we could not constrain the spectral index at low luminosities, hence we cannot confirm or rule out a potential radio spectral difference between the two tracks, but such effect is not observed in other sources (e.g. Shaposhnikov et al. 2007), questioning the validity of this scenario. Alternatively, outliers could be characterised by compact jets with higher magnetic fields with respect to standard track sources (Pe’er & Casella, 2009). While we have no measurement on the jet’s magnetic field in MAXI J1348–630, an evolution of the magnetic field throughout the outburst, possibly increasing with the accretion rate and, thus, with , could explain the observed hybrid correlation, as argued by Coriat et al. (2011).
4.3 The X-ray-loud hypothesis
An alternative approach is to invoke differences in the X-ray emission produced by the accretion flow between the two groups. It has been proposed that sources on the outlier track could be characterised by radiatively efficient accretion flows (e.g. Coriat et al. 2011; Huang et al. 2014), such as the Luminous Hot Accretion Flow (LHAF, Yuan & Zdziarski 2004) and would be brighter in X-rays than standard track sources. Those might in turn be modeled with the radiatively inefficient accretion flows, such as the Advection Dominated Accretion Flows (ADAF, e.g. Narayan & Yi 1994). Outliers could then be called X-ray-loud instead of radio-quiet. Switching between tracks, hybrid sources would change from an an inefficient ADAF in the low flux regime to an efficient LHAF at high luminosity (Coriat et al., 2011). This is also supported by the detection of hard X-ray cutoffs in the spectra of sources on the outlier track, implying an effective cooling of the electrons responsible for the Comptonization of disk photons (Koljonen & Russell, 2019). It has been shown that the radiative efficiency of the accretion flow could depend on the mass accretion rate and hence on (Narayan & Yi, 1995), and a change from an ADAF to various types of LHAF is possible above a given critical luminosity , where is the electron temperature in keV and is the viscosity parameter of the accretion disk (Xie & Yuan, 2012). This would produce the outlier track. In the context of the accretion-jet model (Xie & Yuan, 2016), different values of lead to different , playing a key role in differentiating between standard track sources and outliers. The path of MAXI J1348–630 agrees quite well with this scenario, since it is consistent with the standard track at erg s-1 and then moves to the flat part at the transition between the two tracks above 10 erg s-1, which could be a proxy for a low value of , and possibly a low . Future insights on the values of (see for instance Tetarenko et al. 2018) and (e.g. Koljonen & Russell 2019) would be crucial to quantify this agreement. A radiatively efficient accretion flow could also explain the behaviour of neutron star systems (NS XRBs), which are found to be generally fainter in radio than BH XRBs (e.g. Migliari & Fender 2006; Tudor et al. 2017). At a given , the observed might be increased by the additional X-ray emission coming from the solid surface. However, given the various nature of NS systems (Tudor et al., 2017; Gallo et al., 2018), the global situation appears to be more complex and a full comparison with NS XRBs is beyond the scope of this Letter.
As an alternative, Meyer-Hofmeister & Meyer (2014) suggested the presence of a weak, cool inner accretion disk, which would bring the source to the steep track by providing additional soft photons for Comptonization in the corona. The inner disk, resulting from partial re-condensation of the coronal material, would be present in the hard state at . Despite the difficulty of detecting such disk with the current X-ray instruments, this scenario appears to reproduce well the path on the diagram followed by H1743–322 (Meyer-Hofmeister & Meyer, 2014). However, MAXI J1348–630 leaves the standard track at 10, and the existence of such disk is unlikely at these low accretion rates.
While there is yet no consensus on what produces the observed tracks, it will be crucial for future monitorings of hybrid correlation sources to obtain a deep and dense coverage of the outburst, especially close to the transition luminosities and in the low-flux regime. Constraining the radio/X-ray correlation at low luminosities will allow us to discriminate between the existing models and to improve our understanding of the disk/jet connection among X-ray binaries.
Acknowledgements
We thank the anonymous referee for the careful reading of the manuscript and for providing valuable comments. We thank the staff at the South African Radio Astronomy Observatory (SARAO) for scheduling these observations. The MeerKAT telescope is operated by the South African Radio Astronomy Observatory, which is a facility of the National Research Foundation, an agency of the Department of Science and Innovation. This work was carried out in part using facilities and data processing pipelines developed at the Inter-University Institute for Data Intensive Astronomy (IDIA). IDIA is a partnership of the Universities of Cape Town, of the Western Cape and of Pretoria. FC, SC and TDR thank Jamie Stevens and staff from the Australia Telescope National Facility (ATNF) for scheduling the ATCA radio observations. ATCA is part of the ATNF which is funded by the Australian Government for operation as a National Facility managed by CSIRO. We acknowledge the Gomeroi people as the traditional owners of the ATCA observatory site. We thank Swift for scheduling the X-ray observations. We acknowledge the use of data obtained from the High Energy Astrophysics Science Archive Research Center (HEASARC), provided by NASA’s Goddard Space Flight Center. This research has made use of MAXI data provided by RIKEN, JAXA and the MAXI team. FC acknowledges support from the project Initiative d’Excellence (IdEx) of Université de Paris (ANR-18-IDEX-0001). TDR acknowledges financial contribution from the agreement ASI-INAF n.2017-14-H.0. We thank P. Saikia and W. Yu for their useful comments. We acknowledge the use of the Nançay Data Center, hosted by the Nançay Radio Observatory (Observatoire de Paris-PSL, CNRS, Université d’Orléans), and supported by Region Centre-Val de Loire.
Data availability
The un-calibrated MeerKAT and ATCA visibility data are publicly available at the SARAO and ATNF archives, respectively at https://archive.sarao.ac.za and https://atoa.atnf.csiro.au. The Swift/XRT data are instead available from the Swift archive: https://www.swift.ac.uk/swift_portal, while the MAXI data can be downloaded from http://maxi.riken.jp/mxondem.
References
- Al Yazeedi et al. (2019) Al Yazeedi A., Russell D. M., Lewis F., Baglio M. C., Bramich D. M., Saikia P., 2019, The Astronomer’s Telegram, 13188, 1
- Bahramian et al. (2018) Bahramian A., et al., 2018, doi:10.5281/zenodo.1252036
- Belloni & Motta (2016) Belloni T. M., Motta S. E., 2016, Transient Black Hole Binaries. Springer-Verlag, p. 61, doi:10.1007/978-3-662-52859-4_2
- Bright et al. (2020) Bright J., et al., 2020, Nature Astronomy, 4, 1
- Brocksopp et al. (2005) Brocksopp C., Corbel S., Fender R. P., Rupen M., Sault R., Tingay S. J., Hannikainen D., O’Brien K., 2005, MNRAS, 356, 125
- Burrows et al. (2005) Burrows D. N., et al., 2005, Space Sci. Rev., 120, 165
- Camilo et al. (2018) Camilo F., et al., 2018, ApJ, 856, 180
- Carotenuto et al. (2020) Carotenuto F., et al., 2020, The Astronomer’s Telegram, 14029
- Carotenuto et al. (2021) Carotenuto F., et al., 2021, MNRAS, 504, 444
- Chauhan et al. (2021) Chauhan J., et al., 2021, MNRAS, 501, L60
- Corbel et al. (2000) Corbel S., et al., 2000, A&A, 359, 251
- Corbel et al. (2003) Corbel S., Nowak M. A., Fender R. P., Tzioumis A. K., Markoff S., 2003, A&A, 400, 1007
- Corbel et al. (2004) Corbel S., Fender R. P., Tomsick J. A., Tzioumis A. K., Tingay S., 2004, ApJ, 617, 1272
- Corbel et al. (2013) Corbel S., et al., 2013, MNRAS, 428, 2500
- Coriat et al. (2011) Coriat M., et al., 2011, MNRAS, 414, 677
- Corral-Santana et al. (2016) Corral-Santana J. M., Casares J., Muñoz-Darias T., Bauer F. E., Martínez-Pais I. G., Russell D. M., 2016, A&A, 587, A61
- Dinçer et al. (2014) Dinçer T., et al., 2014, ApJ, 795, 74
- Espinasse & Fender (2018) Espinasse M., Fender R., 2018, MNRAS, 473, 4122
- Falcke et al. (2004) Falcke H., Körding E., Markoff S., 2004, A&A, 414, 895
- Fender et al. (2017) Fender R., et al., 2017, arXiv e-prints, p. arXiv:1711.04132
- Gallo et al. (2003) Gallo E., Fender R. P., Pooley G. G., 2003, MNRAS, 344, 60
- Gallo et al. (2014) Gallo E., et al., 2014, MNRAS, 445, 290
- Gallo et al. (2018) Gallo E., Degenaar N., van den Eijnden J., 2018, MNRAS, 478, L132
- Gallo et al. (2019) Gallo E., et al., 2019, MNRAS, 488, 191
- Gehrels et al. (2004) Gehrels N., et al., 2004, ApJ, 611, 1005
- Hannikainen et al. (1998) Hannikainen D. C., et al., 1998, A&A, 337, 460
- Huang et al. (2014) Huang C.-Y., Wu Q., Wang D.-X., 2014, MNRAS, 440, 965
- Jonas & MeerKAT Team (2016) Jonas J., MeerKAT Team 2016, in MeerKAT Science: On the Pathway to the SKA. p. 1
- Jonker et al. (2010) Jonker P. G., et al., 2010, MNRAS, 401, 1255
- Jonker et al. (2012) Jonker P. G., et al., 2012, MNRAS, 423, 3308
- Koljonen & Russell (2019) Koljonen K. I. I., Russell D. M., 2019, ApJ, 871, 26
- Lamer et al. (2021) Lamer G., Schwope A. D., Predehl P., Traulsen I., Wilms J., Freyberg M., 2021, Astronomy & Astrophysics, 647, A7
- Matsuoka et al. (2009) Matsuoka M., et al., 2009, PASJ, 61, 999
- Merloni et al. (2003) Merloni A., Heinz S., di Matteo T., 2003, MNRAS, 345, 1057
- Meyer-Hofmeister & Meyer (2014) Meyer-Hofmeister E., Meyer F., 2014, A&A, 562, A142
- Migliari & Fender (2006) Migliari S., Fender R. P., 2006, MNRAS, 366, 79
- Miller-Jones et al. (2019) Miller-Jones J. C. A., et al., 2019, Nature, 569, 374
- Monageng et al. (2021) Monageng I. M., Motta S. E., Fender R., Yu W., Woudt P. A., Tremou E., Miller-Jones J. C. A., van der Horst A. J., 2021, MNRAS, 501, 5776
- Motta et al. (2018) Motta S. E., Casella P., Fender R. P., 2018, MNRAS, 478, 5159
- Narayan & Yi (1994) Narayan R., Yi I., 1994, ApJ, 428, L13
- Narayan & Yi (1995) Narayan R., Yi I., 1995, ApJ, 452, 710
- Negoro et al. (2020) Negoro H., et al., 2020, The Astronomer’s Telegram, 13994, 1
- Parikh et al. (2019) Parikh A. S., et al., 2019, ApJ, 878, L28
- Pe’er & Casella (2009) Pe’er A., Casella P., 2009, ApJ, 699, 1919
- Pirbhoy et al. (2020) Pirbhoy S. F., Baglio M. C., Russell D. M., Bramich D. M., Saikia P., Yazeedi A. A., Lewis F., 2020, The Astronomer’s Telegram, 13451, 1
- Plotkin et al. (2012) Plotkin R. M., Markoff S., Kelly B. C., Körding E., Anderson S. F., 2012, MNRAS, 419, 267
- Plotkin et al. (2017) Plotkin R. M., et al., 2017, ApJ, 848, 92
- Ratti et al. (2012) Ratti E. M., et al., 2012, MNRAS, 423, 2656
- Remillard & McClintock (2006) Remillard R. A., McClintock J. E., 2006, ARA&A, 44, 49
- Russell et al. (2019a) Russell T. D., et al., 2019a, ApJ, 883, 198
- Russell et al. (2019b) Russell D. M., Al Yazeedi A., Bramich D. M., Baglio M. C., Lewis F., 2019b, The Astronomer’s Telegram, 12829, 1
- Shaposhnikov et al. (2007) Shaposhnikov N., Swank J., Shrader C. R., Rupen M., Beckmann V., Markwardt C. B., Smith D. A., 2007, ApJ, 655, 434
- Shaw et al. (2021) Shaw A. W., et al., 2021, ApJ, 907, 34
- Tetarenko et al. (2016) Tetarenko B. E., Sivakoff G. R., Heinke C. O., Gladstone J. C., 2016, ApJS, 222, 15
- Tetarenko et al. (2018) Tetarenko B., et al., 2018, Nature, 554, 69—72
- Tominaga et al. (2020) Tominaga M., et al., 2020, ApJ, 899, L20
- Tremou et al. (2020) Tremou E., et al., 2020, MNRAS, 493, L132
- Tudor et al. (2017) Tudor V., et al., 2017, MNRAS, 470, 324
- Williams et al. (2020) Williams D. R. A., et al., 2020, MNRAS, 491, L29
- Xie & Yuan (2012) Xie F.-G., Yuan F., 2012, MNRAS, 427, 1580
- Xie & Yuan (2016) Xie F.-G., Yuan F., 2016, MNRAS, 456, 4377
- Xie et al. (2020) Xie F.-G., Yan Z., Wu Z., 2020, ApJ, 891, 31
- Yatabe et al. (2019) Yatabe F., et al., 2019, The Astronomer’s Telegram, 12425, 1
- Yuan & Zdziarski (2004) Yuan F., Zdziarski A. A., 2004, MNRAS, 354, 953
- Zhang et al. (2020) Zhang L., et al., 2020, MNRAS, 499, 851