Frequency-dependent capacitors using paper
Abstract
Measurements of capacitors made with paper sheets reveal a significant decrease of capacitance with increasing frequency from 10 to 100,000 Hz, offering a simple demonstration of complex dielectric phenomena using common equipment.
Paper for printing and copying is a convenient material for exploring dielectrics and capacitors.1 In particular, its shape and uniform thickness is well suited for building parallel-plate capacitors whose capacitance varies with the number of sheets between their plates. Paper is a complex anisotropic dielectric, though, with a variability and environmental sensitivity that can be troublesome for quantitative measurements.2 However, as Fig. 1 shows, paper often has an appreciable dependence on frequency that presents an opportunity to witness complex dielectric phenomena.
The capacitance of an ideal parallel-plate capacitor made from two identical plates is
| (1) |
where is the vacuum permittivity, is the plate area, and is the thickness of a dielectric between the plates. For polarizable dielectrics, the capacitance is enhanced by the real part of the permittivity (or dielectric constant), which is within roughly 1.3–4.0 for paper.2, 3, 4, 5 The closely related imaginary part of produces loss. If a sinusoidal voltage with frequency is applied, then a frequency dependence in the permittivity will create a frequency dependence in the capacitance.
Many polarizable sources inside paper contribute including ions that move and dipoles that rotate, for example, in cellulose and absorbed water.3, 4, 5 Their responses are not instantaneous, however, and as the frequency increases, slow sources contribute less and less. For paper, the slowest sources are ionic (space charge) polarizations and their relaxations dominate at low frequency.3 Overlapping of multiple sources blurs distinct features,4 leading to gradually decrease with frequency as shown in Fig. 1(a) (c.f., Fig. 3 of Ref. 4). This relaxation also produces loss as shown in Fig. 1(b) (c.f., Fig. 4 of Ref. 4). Sharper features occur in other dielectrics or at higher frequencies.
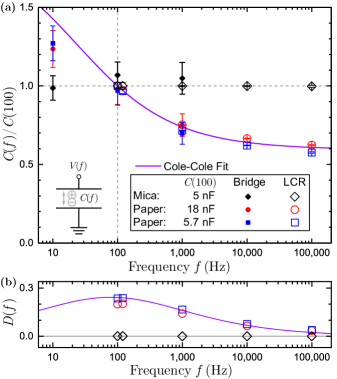
To compare the frequency dependence of different capacitors, the data for each capacitor in Fig. 1(a) are normalized using the value at 100 Hz. The data for two paper capacitors show a similar variation with frequency, while a control capacitor shows no variation to within measurement uncertainty. The loss values in Fig. 1(b) are measurements of a dissipation factor (or loss tangent) for paper over this frequency range.3, 4, 6 The data for the paper capacitors again show a similar variation, while the data for the control shows negligible loss.
To highlight the capacitance variation, the data for both paper capacitors were fit with the function using the Cole-Cole empirical model7, 8, 9
| (2) | ||||
| (3) |
with . The second line follows from substituting for . This model captures the broadened relaxation of many solid and liquid dielectrics. For , it is equivalent to the Debye model7, 8, 9, 6 for ideal dipolar relaxation. While there seems to be no standard model for paper, the fitted curve summarizes the data well. However, there was not enough low-frequency data to fully constrain the model. Least-squares fitting including uncertainty gave , , and Hz. The fit predicts a dissipation factor that matches the data well, as shown in Fig. 1(b).
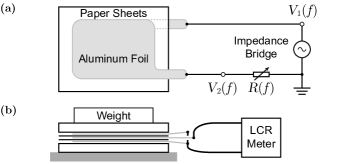
The measurements in Fig. 1 used two paper capacitors made from compressing three aluminum-foil plates inside a standard 500-sheet ream of 30% recycled copy paper, as sketched in Fig. 2. For one capacitor, the neighboring plates were separated by 1 sheet (5.7 nF data), and for the other, by 4 sheets (18 nF data). The capacitance is sensitive to plate alignment, fringe fields, ream compression, and air gaps,2 which is why the ratio of values in Fig. 1(a) slightly differs from the ratio of sheets.
Measurements used an impedance bridge as shown in Fig. 2(a) for low frequencies (10–1,000 Hz) and an LCR meter (DER EE DE-500010) as shown in Fig. 2(b) for high frequencies (100–100,000 Hz). Either approach alone captured frequency dependence. Note that multimeters can often measure capacitance but they tend not to have a well-defined frequency. Dissipation factors are typically reported by LCR meters, but an improved, phase-sensitive bridge11 would be needed to measure loss separately from capacitance.
The series circuit of the impedance bridge formed by the capacitor and a 1 M variable resistor functioned as a voltage divider. Using complex values for the voltages and the impedance for an ideal capacitor,11 the capacitance can be calculated from the voltage-dividing ratio and the resistance as
| (4) |
In practice, for each value of a function generator applied a sinusoidal voltage , the resistor was adjusted so that , and then an oscilloscope measured the amplitudes and and a multimeter measured the adjusted resistance . Note that a “true-RMS” multimeter could replace the oscilloscope. The uncertainty for each value of follows from a standard propagation of the uncertainties12 for each parameter, giving
| (5) |
assuming negligible frequency uncertainty.
The dielectric properties of materials are fascinating.8, 6 Other types of paper or different sheet materials could be explored with this approach. I observed similar results with most everyday paper products, from cardboard to a textbook and even a silicone placemat.13 Commercial paper film capacitors could be used, though their frequency variation is typically only a few %.14 Alternatively, a phase-sensitive bridge11 could be used to separate loss from capacitance and reach lower frequencies.4 Frequency-dependent capacitors like those in Fig. 1 can be modeled as resistor-capacitor networks. One prediction of such models is dielectric absorption,9 an effect leading some capacitors to recharge over time, which is why capacitors must be left shorted after discharging to guarantee safe handling.
I’m grateful to Mickey McDonald for helpful feedback and encouraging this work, and to two anonymous referees for valuable suggestions that improved this work.
References
- [1] E. A. Karlow, “Let’s measure the dielectric constant of a piece of paper!” Phys. Teach. 29, 23–25 (1991).
- [2] T. T. Grove, M. F. Masters, and R. E. Miers, “Determining dielectric constants using a parallel plate capacitor,” Am. J. Phys. 73, 52–56 (2005).
- [3] J. Borch, M. B. Lyne, R. E. Mark, and C. C. Habeger Jr, editors, Handbook of Physical Testing of Paper, 2nd Ed., (Marcel Dekker, New York, Basel, 2002). For permittivity, see Vol. 2 Ch. 8.
- [4] S. Simula, S. Ikäläinen, K. Niskanen, T. Varpula, H. Seppä, and A. Paukku, “Measurement of the Dielectric Properties of Paper,” Journal of Imaging Science and Technology 43, 472–477 (1999).
- [5] D. Tobjörk and R. Österbacka, “Paper Electronics,” Advanced Materials 23, 1935–1961 (2011).
- [6] Keysight Technologies, “Basics of Measuring the Dielectric Properties of Materials,” Application Note 5989-2589. Available online: https://www.keysight.com/us/en/assets/7018-01284/application-notes/5989-2589.pdf (accessed October, 2020).
- [7] K. S. Cole and R. H. Cole, “Dispersion and absorption in dielectrics: I. alternating current characteristics,” J. Chem. Phys 9, 341–351 (1941).
- [8] U. Kaatze, “Measuring the dielectric properties of materials. Ninety-year development from low-frequency techniques to broadband spectroscopy and high-frequency imaging,” Meas. Sci. Technol. 24, 012005 (2013).
- [9] Kenneth S. Kundert, “Modeling Dielectric Absorption in Capacitors,” Designers Guide Consulting, Inc., 2008. Available online: https://designers-guide.org/modeling/da.pdf (accessed October, 2020).
- [10] Information about this LCR meter is available online: https://www.deree.com.tw/de-5000-lcr-meter.html (accessed October, 2020).
- [11] R. Bartiromo and M. De Vincenzi, “Implementing a simple vectorial bridge with a digital oscilloscope,” Am. J. Phys. 82, 1067–1076 (2014).
- [12] P. R. Bevington and D. Keith Robinson, Data Reduction and Error Analysis for the Physical Sciences, 3rd ed., (McGraw-Hill, New York, 2003).
- [13] L. Yu, F. B. Madsen, S. Hvilsted, and A. L. Skov, “Dielectric elastomers, with very high dielectric permittivity, based on silicone and ionic interpenetrating networks,” RSC Adv. 5, 49739–49747 (2015). Ions (space charges) may have contributed in the placemat (c.f., Fig. 1).
- [14] European Passive Components Institute, “ABC of CLR: Paper Capacitors,” 2020: Fig. C2-29. Available online: https://epci.eu/capacitors-paper-capacitors/ (accessed October, 2020).