The bifurcations of the critical points and the role of the depth in a symmetric Caldera potential energy surface
Abstract
In this work, we continue the study of the bifurcations of the critical points in a symmetric Caldera potential energy surface. In particular, we study the influence of the depth of the potential on the trajectory behavior before and after the bifurcations of the critical points. We observe two different types of trajectory behavior: dynamical matching and the non-existence of dynamical matching. Dynamical matching is a phenomenon that limits the way in which a trajectory can exit the Caldera based solely on how it enters the Caldera. Furthermore, we discuss two different types of symmetric Caldera potential energy surface and the transition from the one type to the other through the bifurcations of the critical points.
keywords:
Caldera potential energy surface, depth of the potential energy surface, bifurcations of critical points, dynamical matching1 Introduction
In this paper we study the influence of the depth of the potential on the trajectory behavior before and after a bifurcation of critical points in a symmetric Caldera potential energy surface (PES). Doering [1] gave this name to this potential energy surface because its morphology is similar to this of a collapsed region in an erupted volcano. The Caldera PES occurs in many organic chemical reactions, such as the vinylcyclopropane-cyclopentene rearrangement [2, 3], the stereomutation of cyclopropane [4], the degenerate rearrangement of bicyclo[3.1.0]hex-2-ene [5, 6] or that of 5-methylenebicyclo[2.1.0]pentane [7].
We have two types of symmetric Caldera potential energy surfaces. The transition between the two types of potential energy surfaces occurs as a result of a pitchfork bifurcation of the critical points. The first type is characterized by a shallow minimum that is surrounded by potential walls and four index-1 saddles that exist around these potential walls (see [8, 9] and panel B of Fig. 1). In this case, the chemical reaction takes place when the trajectories that have initial conditions in the region of the upper index-1 saddles cross the Caldera and approach one of the two lower index-1 saddles. Then the trajectories leave the Caldera through the region of one of the lower index-1 saddles.
The second type is characterized by three index-1 saddles, two upper index-1 saddle and one lower index-1 saddle that is on the -axis (see [10] and panels A and C of Fig. 1). In this case the chemical reaction takes place when trajectories that have initial conditions in the region of the upper index-1 saddles cross the Caldera and they approach the lower index-1 saddle. Then the trajectories leave the Caldera through one of the regions that exist on both sides of the lower index-1 saddle. We will refer to these regions as the lower right exit region and the lower left exit region.
We have two categories of trajectory behavior in the symmetric Caldera potential energy surface:
-
1.
Dynamical matching: This phenomenon was first reported in [11, 12]. In this case the trajectories (reactants) that begin from the region of the upper index-1 saddle cross the Caldera. Then they exit through the region of the opposite lower saddle (in the case of the first type of symmetric Caldera potential) or through the region of the opposite lower exit region (for the case of the second type of symmetric Caldera potential). This means that of the trajectories are exiting from one of the two lower exits and not , as would be predicted by statistical theories.
-
2.
Non-existence of dynamical matching: This category includes the trajectories that begin from the region of the upper index-1 saddles and they do not obey dynamical matching. This means that the trajectories are trapped in the intermediate region of the Caldera before they exit. In addition, the trajectories can exit through either region of lower saddles (in the case of the first type of symmetric Caldera potential) or any lower exit region (in the case of the second type of symmetric Caldera potential).
The mechanism that controls the existence of the dynamical matching is the existence of heteroclinic intersections between the unstable manifolds of the unstable periodic orbits associated with the upper saddles and the stable manifolds of invariant sets in the central region. If we do not have the existence of these heteroclinic intersections, we encounter the phenomenon of dynamical matching (see [9]) otherwise we don’t have this phenomenon (see [13, 14, 15]).
In this paper, we want to study the influence of the depth of the potential (a geometrical feature of the potential - see the definition in Section 3) on the trajectory behavior in the symmetric Caldera potential energy surface. In the previous papers ([8, 9, 10]) we saw that dynamical matching occurs in the first type of the symmetric Caldera potential energy surface and the non-existence of dynamical matching in the second type of the symmetric Caldera potential energy surface. This change of the trajectory behavior is abrupt and it happens just after the transition from one type of the symmetric Caldera potential energy surface to the other (this transition is a result of a pitchfork bifurcation of critical points -see [10]). This transition that is studied in [10] happens at a small value of the depth of the potential (see section 3). In this paper we want to investigate the trajectory behavior when this transition occurs at large values of the depth of the potential. In this way, we want to determine if the existence or the non-existence of dynamical matching is a general characteristic of the first and second type of symmetric Caldera potential energy surface respectively. Furthermore, we want to study if the change of the trajectory behavior is abrupt or not in the cases that the transition between the two kinds of the symmetric Caldera potential energy surface occurs for large values of the depth of the potential.
In this paper is outlined as follows. In Section 2 we present the Hamiltonian model and the potential of our system (section 2). In Section 3 we describe the trajectory behavior before and after the first and the second bifurcation and we compare the topography of the PES before and after the bifurcations. Finally in Section 4 we summarize our findings.
2 Model
In this section we introduce the model of the symmetric, with respect to the y-axis, Caldera potential energy surface (PES). The expression of the PES that has been introduced in [8] for 2 degree of freedom (DoF) Hamiltonian systems is given by:
| (1) | ||||
where , describe the position in Cartesian and polar coordinates, respectively, and are parameters.
The 2 DoF Hamiltonian is given by:
| (2) |
where denotes the momentum at and denotes the momentum at and is a considered to be . Thus the equations of motion are:
| (3) | ||||
3 Results
In this section, we will present our results. We will study the trajectory behavior before and after two pitchfork bifurcations of critical points. As we described in the Section 1, these bifurcations represent a transition from one kind of the symmetric Caldera potential energy surface to the other. The first bifurcation occurs at a small value of the depth of the potential (we define this in subsection 3.1) and the second bifurcation at a large value.
In order to find the first bifurcation (a bifurcation of critical points that occurs at a small value of the depth of the potential) we fixed the potential parameters and (that are used in previous papers see for example [8, 9] ) and we vary the parameter between and . As a consequence, we have a bifurcation of critical points at (see more details at the subsection 3.2) that happens at a small value of the depth of the potential (6.228 - see Fig. 4). In order to find the second bifurcation (a bifurcation of critical points that occurs at a large value of the depth of the potential) we fixed the potential parameters and (that are used in previous papers see for example [8, 9] ) and we vary the parameter between and . This results a bifurcation of critical points at (see more details at the subsection 3.2) that happens at a large value of the depth of the potential (89.77 - see Fig. 4). This means that fixing the parameters and and varying , we find bifurcations of critical points that occur at small values of the depth of the potential. On the contrary, if we fix the parameters and and vary , we find bifurcations of critical points that occur at large values of the depth of the potential.
In this section, we firstly give the definition of the depth of the potential (see the Subsection 3.1). Secondly, we describe the first and second bifurcation of critical points that occur at a small and a large value of the depth of the potential respectively (see the Subsection 3.2). Finally, we describe the trajectory behavior before and after the first and the second bifurcation of critical points in the Subsections 3.3 and 3.4 respectively.
3.1 Depth of the potential
In this section, we give the definition of the depth of the potential for the first kind and the second kind of the symmetric Caldera potential energy surface. As we described above (Section 1) the first kind corresponds to a symmetric Caldera potential energy surface with one center and four index-1 saddles around it (two for high values of energy and two for low values of energy). The second kind corresponds to a symmetric Caldera potential energy surface with three index-1 saddles (two for high values of energy and one for low values of energy).
We define the depth of the potential as the difference between the potential energy that corresponds to the high energy saddles and the potential energy of the center at the bottom of the well (for the case of the first kind of the symmetric Caldera potential energy surface):
| (4) |
where and are the and coordinates in the configuration space of the high energy saddle (one of them) and of the center respectively. In the case that we have a lower index-1 saddle instead the center at the bottom (for the case of the second kind of the symmetric Caldera potential energy surface), the depth of the potential is defined as the difference between the potential energy that corresponds to the high energy saddles and the potential energy of the lower energy saddle:
| (5) |
where and are the and coordinates in the configuration space of the high energy saddle (one of them) and of the lower energy saddle respectively. In Fig. 4 we can see how the depth of the potential is changing while we modify the parameter and .
3.2 Bifurcations of critical points
In this section we discuss two bifurcations of critical points that occur on the Caldera PES. The first bifurcation occurs at a small value of the depth of the potential (6.228 - see Fig. 4) and the second bifurcation occurs at a large value of the depth of the potential (89.77 - see Fig. 4).
In [10] the potential parameters and are fixed while the parameter is varied between and . In this situation we show that there is a pitchfork bifurcation of the critical points of the Caldera PES. In particular, for , the Caldera PES has three critical points in total, two symmetric, with respect to y-axis, index-1 saddles in the upper plane (upper LH and upper RH saddles) and one index-1 saddle on the negative -axis (lower saddle), see the panel A of Fig. 1. After the critical value , the lower saddle bifurcates into two symmetric index-1 saddles in the lower plane and one center on the -axis. Therefore the Caldera PES after the critical value has five critical points, see panel B of Fig. 1. The bifurcation diagrams are shown in Fig. 2
A) B)
B)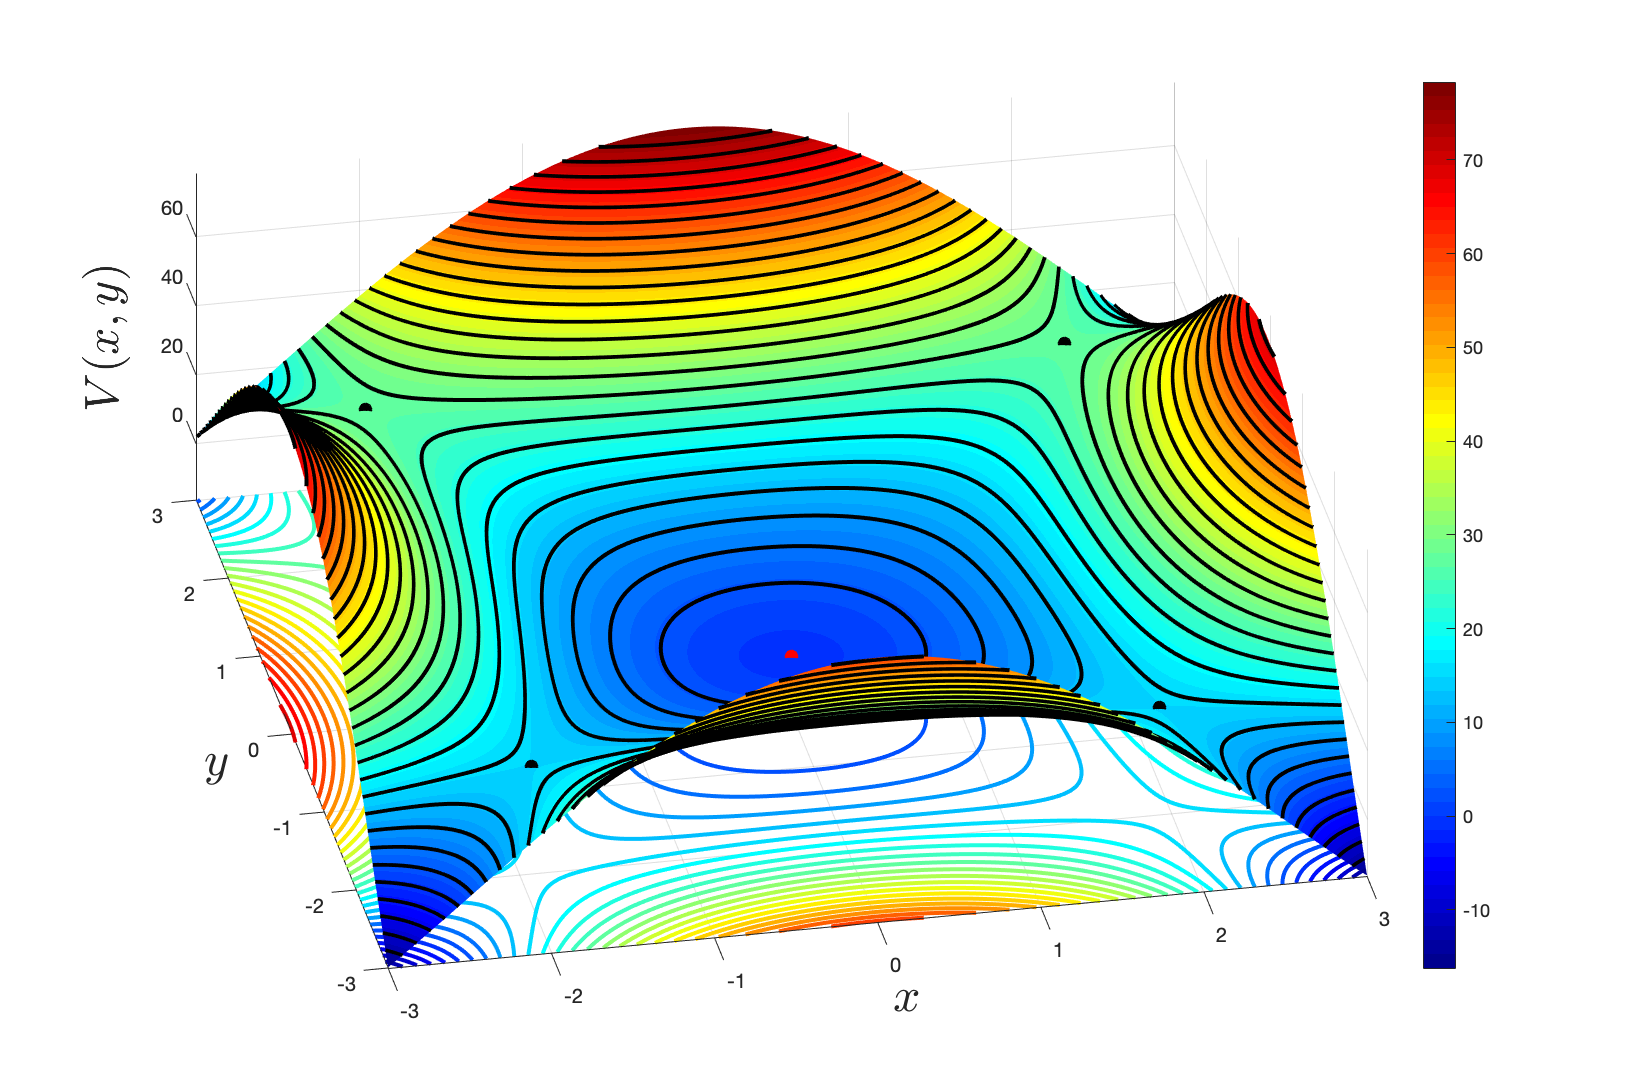
C)
A) B)
B)
The second bifurcation occurs when we fix and vary the parameter. This also gives us a pitchfork bifurcation. When the system has five critical points i.e. a centre (which is a minimum) and four index-1 saddles around it. A typical example is the case when , the four index-1 saddles control the exit from and the entrance to the Caldera, see panel B of Fig. 1. After the critical value of the number of critical points changes from five to three, see panel C of Fig. 1, where the two lower saddles and the centre coincide at a lower index-1 saddle. In this case, while the upper critical points still control the entrance to and exit from the region of their directions, the single lower critical point controls the entire lower region, both lower left and lower right. We will refer to these region as the lower left exit region and the lower right exit region. The bifurcation diagrams are given in Fig. 3
A) B)
B)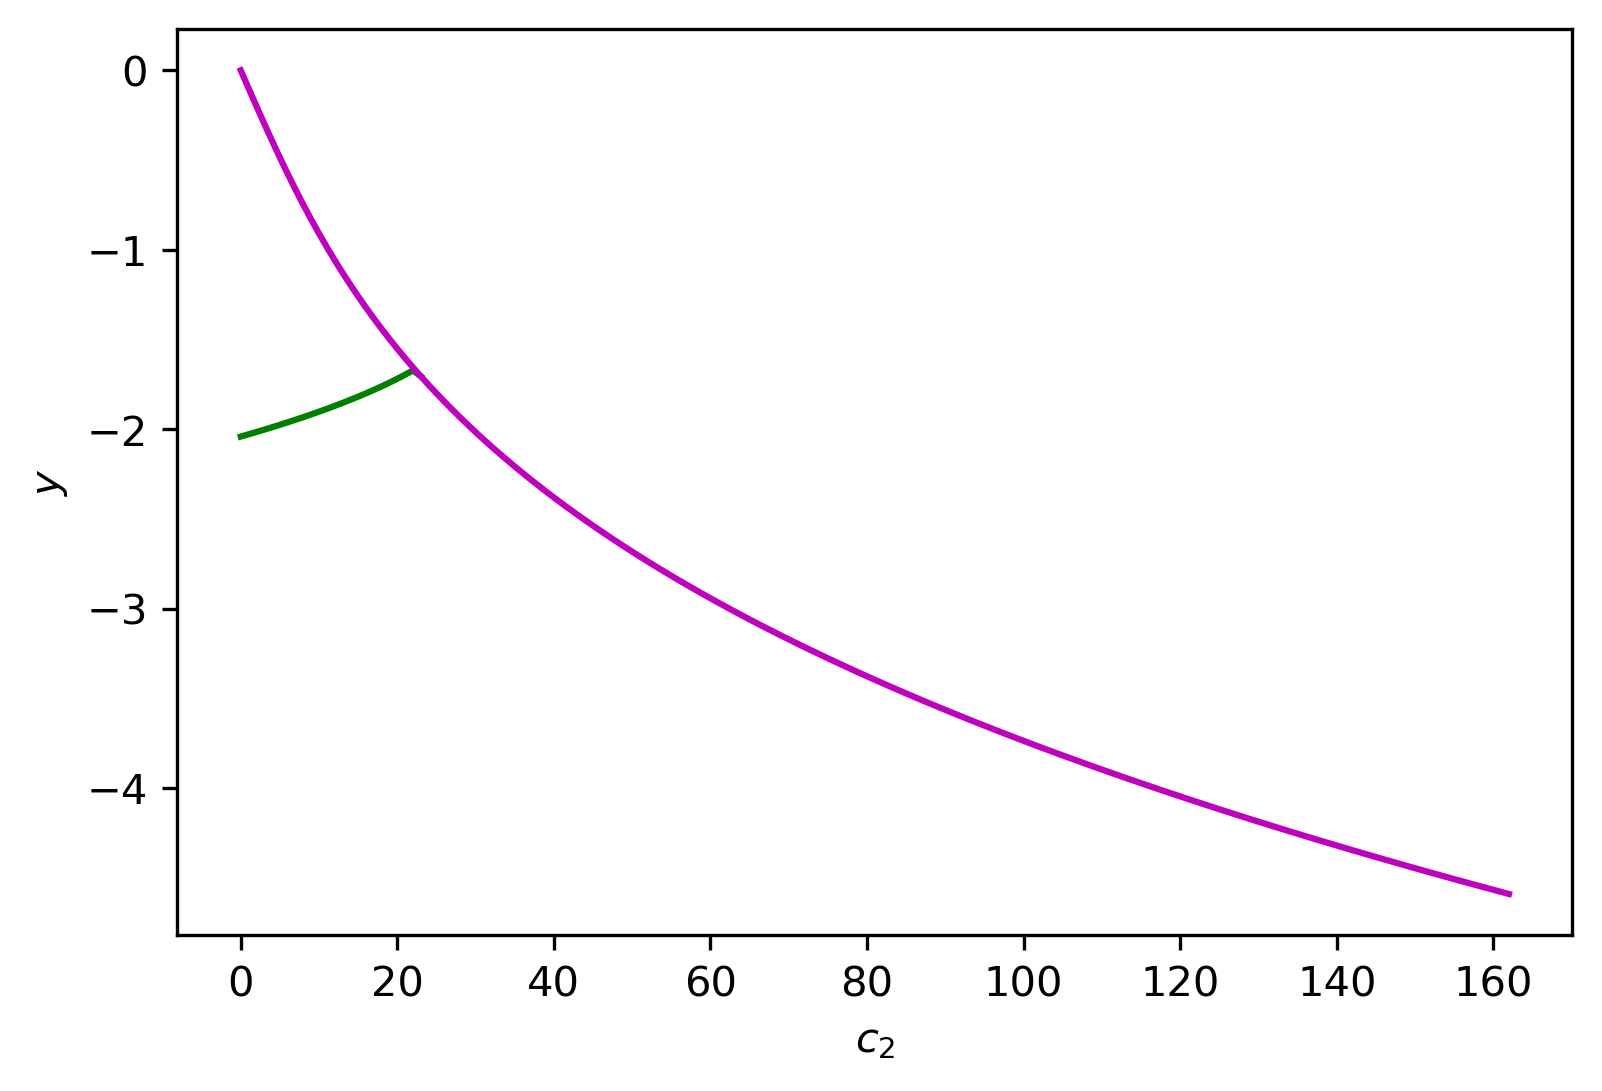
The position of all critical points for the parameter values that we chose in every panel in Fig. 1, and their energies are given in Table 1 and Table 2.
| Critical point | x | y | E |
|---|---|---|---|
| Lower saddle | 0.000 | -1.194 | -2.402 |
| Upper LH saddle | -1.204 | 0.840 | 2.321 |
| Upper RH saddle | 1.204 | 0.840 | 2.321 |
| Critical point | x | y | E |
|---|---|---|---|
| Central minimum | 0.000 | -0.297 | -0.448 |
| Upper LH saddle | -2.149 | 2.0778 | 27.0123 |
| Upper RH saddle | 2.149 | 2.0778 | 27.0123 |
| Lower LH saddle | -1.923 | -2.003 | 14.767 |
| Lower RH saddle | 1.923 | -2.003 | 14.767 |
| Critical point | x | y | E |
|---|---|---|---|
| Lower saddle | 0.000 | -4.484 | -464.242 |
| Upper LH saddle | -4.448 | 3.061 | 424.194 |
| Upper RH saddle | 4.448 | 3.061 | 424.194 |
A)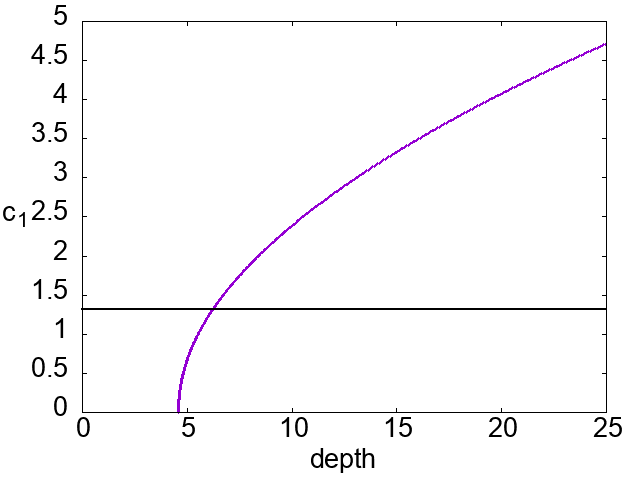 B)
B)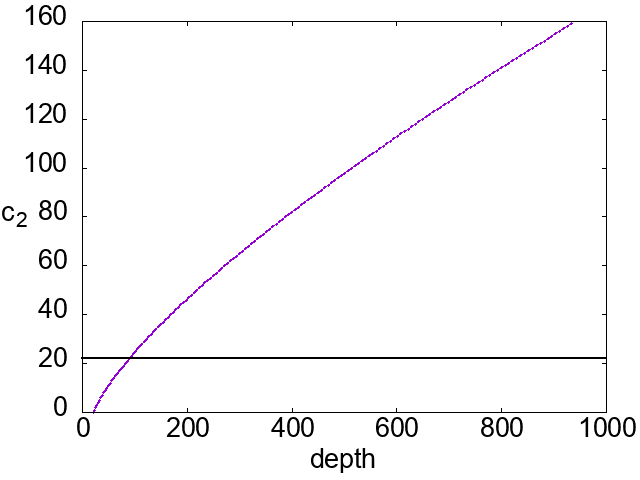
3.3 Trajectory behavior before and after the first Bifurcation
In this section we discuss the behaviour of trajectories initialised in the upper region for with and , and determine whether they exit the Caldera through the region of either saddle or are trapped in the Caldera.
First, we will describe how the initial conditions of trajectories were chosen. Since the Caldera PES is symmetric, without loss of generality we only constructed trajectories initialised in the upper right region. While the initial conditions consist of the position and the momentum, we chose initial positions on the line which passes through the upper right index-1 saddle, perpendicular to the line joining the upper right and lower left index-1 saddle for or the line joining the upper right index-1 saddle and the lower saddle on the -axis for . The momentum at that position is in the direction of the line which connects two index-1 saddles, and the energy is constant throughout the evolution of the trajectory. The initial positions were uniformly distributed along the line segment.
We integrated all the initial conditions for a fixed time (we used the same value as in [10]) and determined the region where they were located after this time interval. In particular, we counted the number of trajectories that passed through each exit region or that became trapped in the intermediate region of the Caldera. Then we divided these numbers by 1000, the total number of trajectories, in order to find the ratio of the trajectories for every exit region and the ratio of the trajectories that were trapped.
From these results we observed that for the trajectories enter the lower left exit region, the lower right exit region or are trapped in the Caldera. In panel A of Fig. 5 the red, green and blue lines represent these three types of trajectory behaviour, respectively.
For , all the trajectories exit through the region of the lower left saddle of the Caldera PES. This is the phenomenon of dynamical matching [10]. In panel B of Fig. 5 the red line represent this behavior.
A)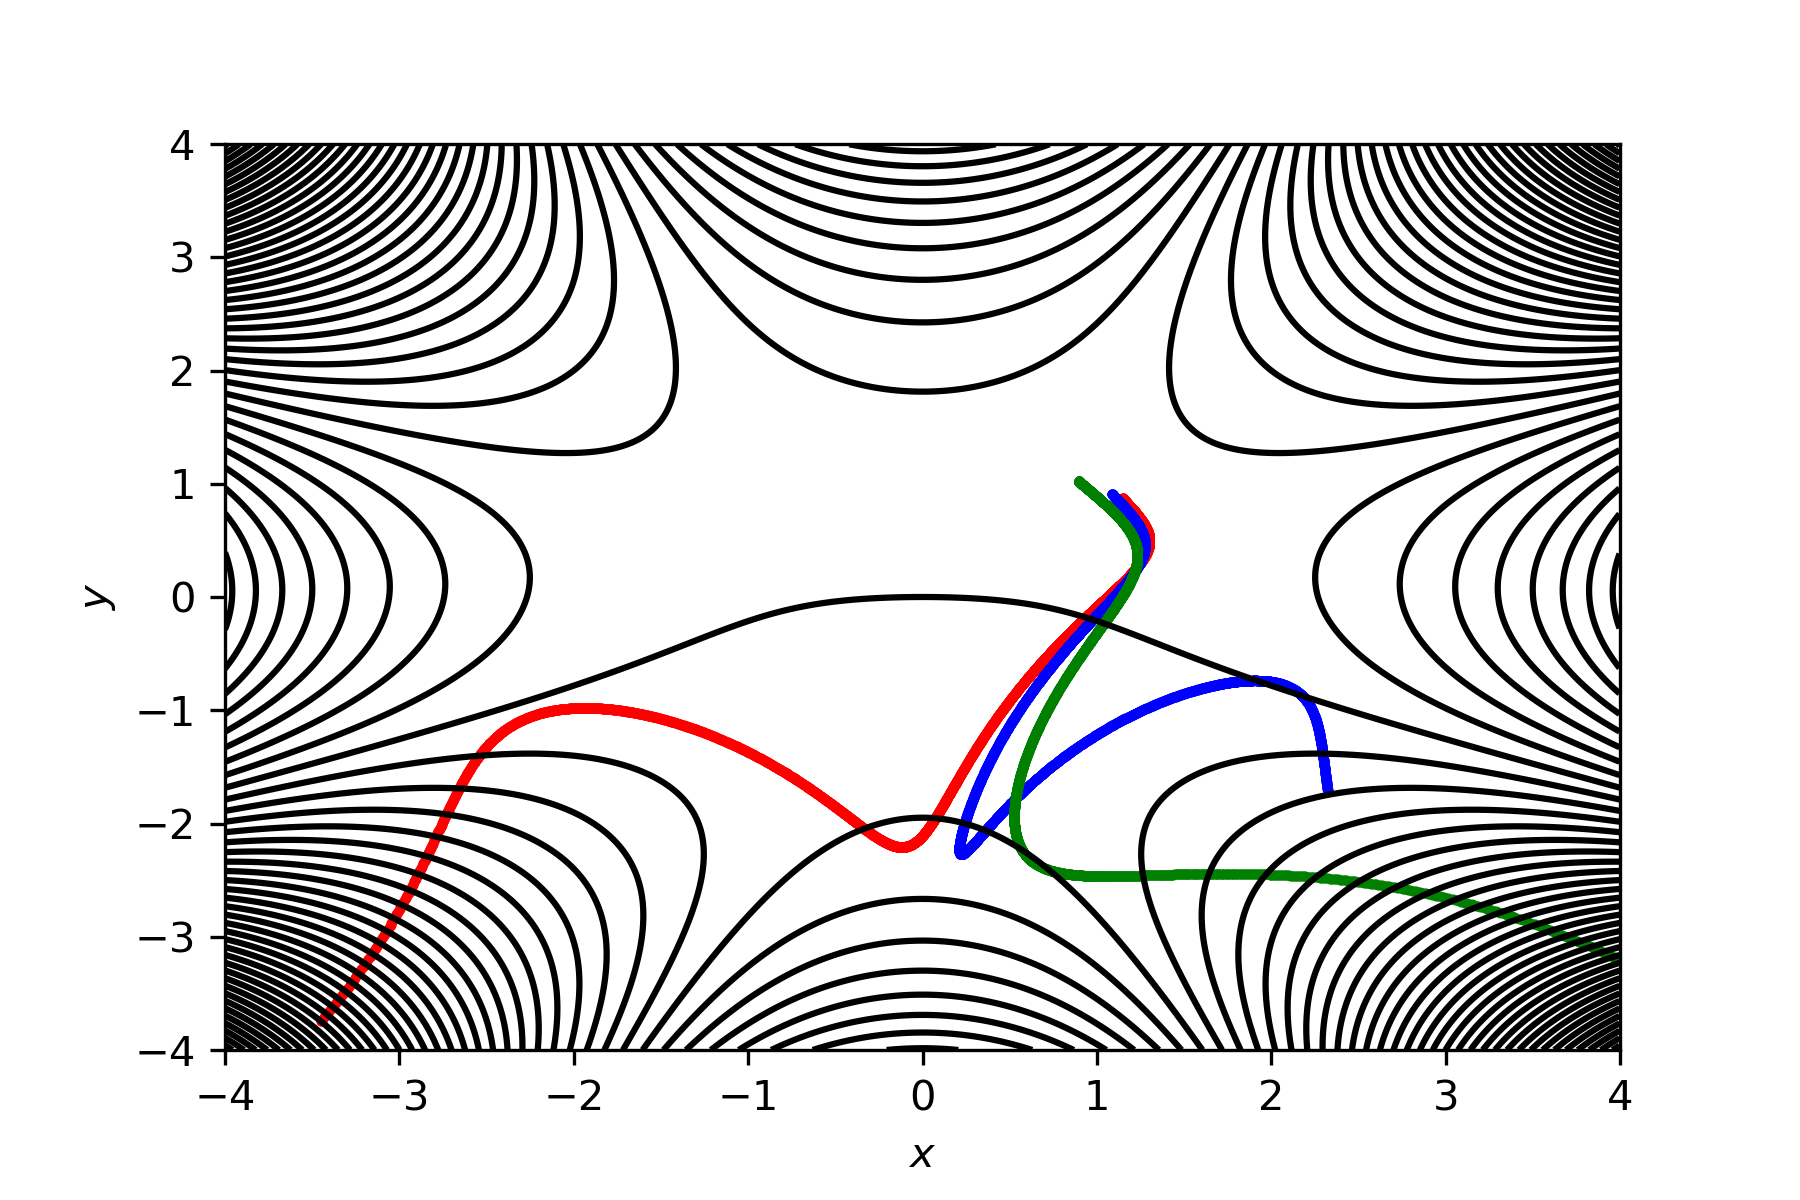 B)
B) C)
C)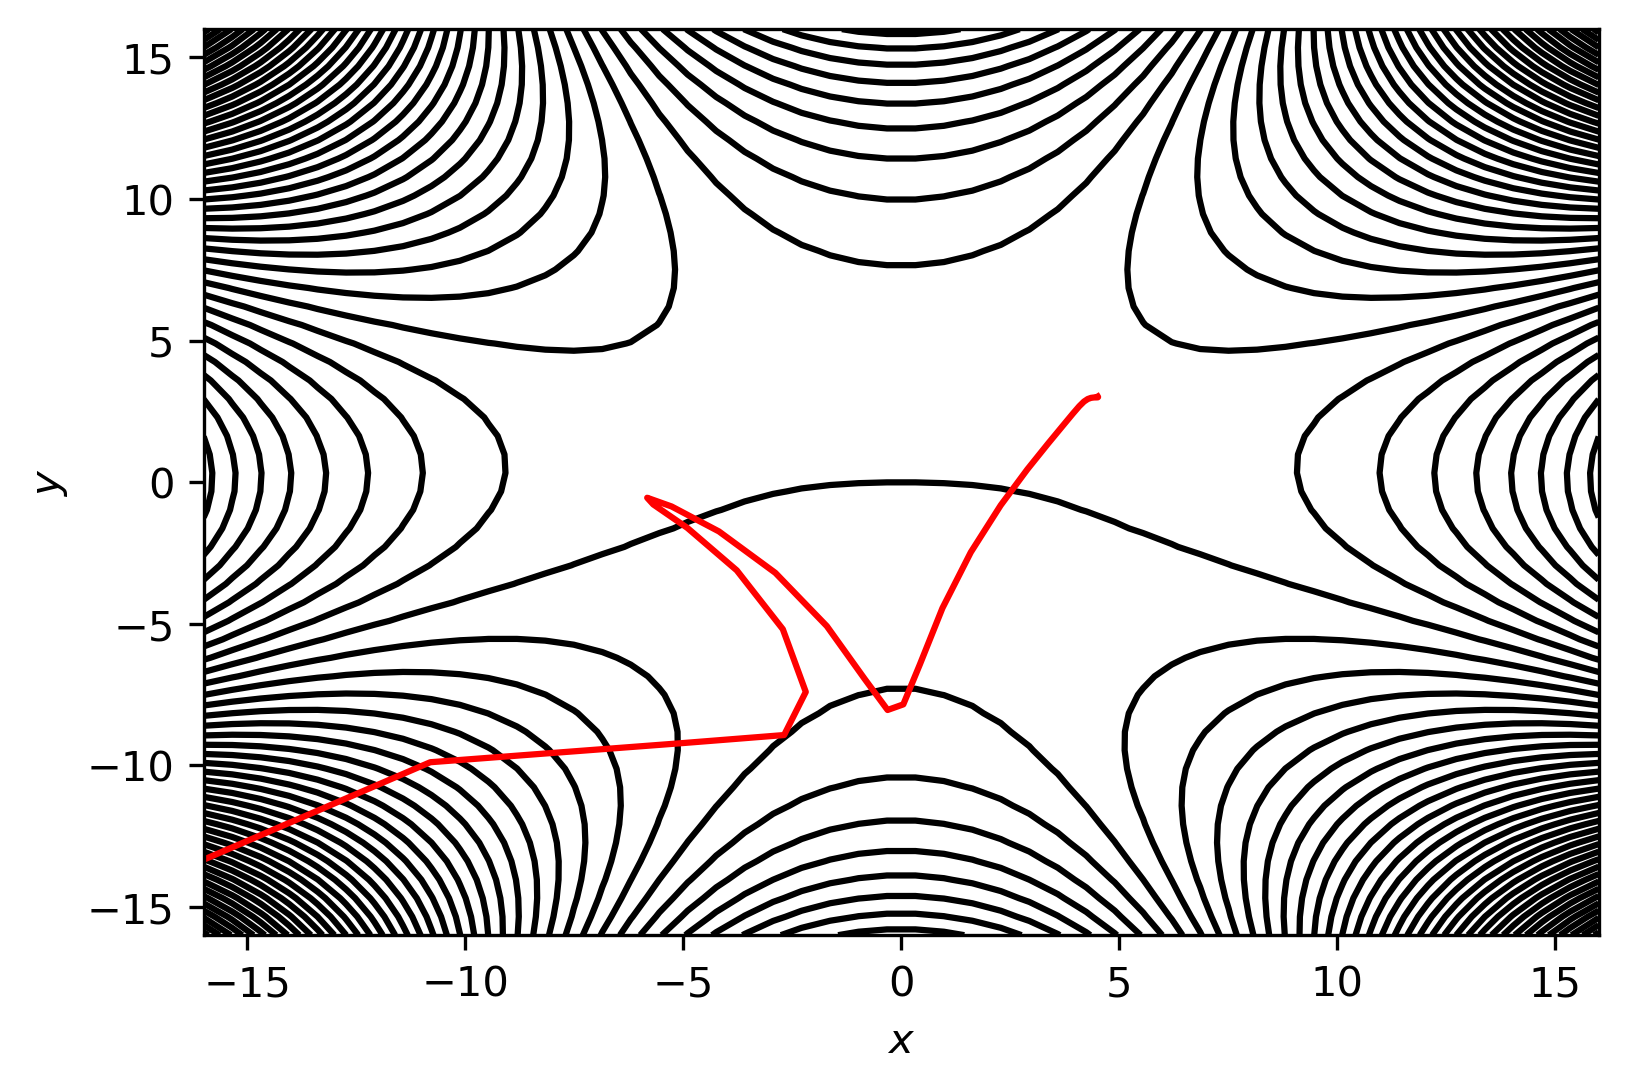
We computed the ratio of trajectories that exited through the lower left exit region (or the region of the lower left saddle) and the ratio of the trajectories that were trapped or that exited through the lower right exit region (or the region of the lower right saddle) versus . In Fig. 6, the red line represents the ratio of the trajectories that exited through the lower left exit region (or the region of the lower left saddle) and the black line represents the ratio of the trajectories that were trapped or that exited through the lower right exit region (or the region of the lower right saddle). We see that initially the black line started at approximately and is higher than the red line at , and afterwards the red line increases to almost while the black line decreases to almost , after which a plateau occurs for both the red and black lines, and after the critical value of the bifurcation the final increase and decrease happens for the red and black lines, respectively. Finally, the ratio of the trajectories that exit through the lower left exit region (or the region of the lower left saddle) becomes and the ratio of the trajectories that are trapped or they exit through the lower right exit region (or the region of the lower right saddle) becomes . Due to the symmetry of the Caldera PES, the conclusion is that all the trajectories coming from one of the upper regions pass through the Caldera and exit through the opposite lower region. This is the phenomenon of dynamical matching in the symmetric Caldera ([10]).

3.4 Trajectory behavior before and after the second Bifurcation
In this section we discuss the behaviour of trajectories for with fixed, whose initial conditions are fixed in the region of the upper right index-1 saddle. We have shown (in [10] and the previous subsection) that dynamical matching is related to a bifurcation effect. However, when we are varying the parameter the bifurcation is not related to a change of the trajectory behavior.
The construction of the initial conditions is the same as has been explained in the previous Subsection 3.3. The result from the simulation shows that the phenomenon of dynamical matching exists before the critical value where the pitchfork bifurcation occurs. Note that for values of smaller than the critical value of the PES has five critical points. Moreover dynamical matching persists for values larger than the critical value and up to the value , where all the trajectories with initial conditions below the above construction pass through the Caldera and evolve to the lower left region. We would expect that after the bifurcation, the dynamical matching would not exist. The figures of two examples of this trajectory behavior (dynamical matching) are given in Fig. 5 where the parameter takes the values B) and C) . These values are chosen to represent dynamical matching before and after the bifurcation, respectively.
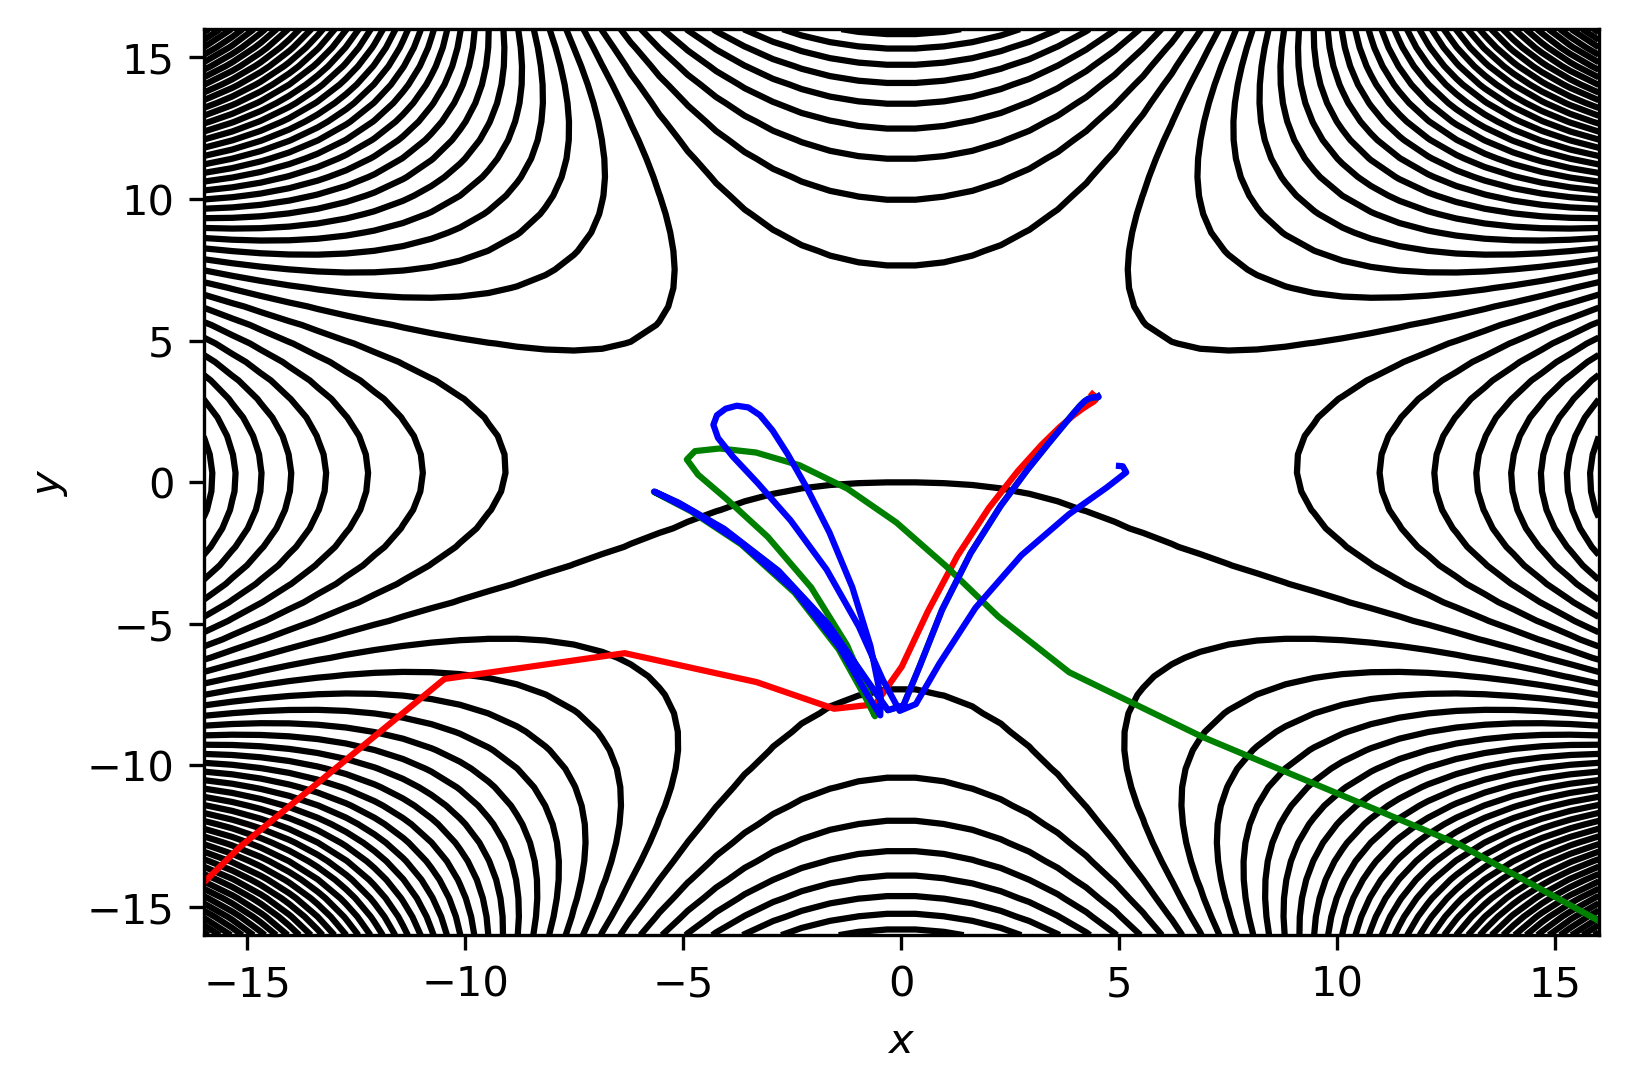
When is larger than , dynamical matching is broken and there are three types of trajectory behavior. There are trajectories that exit through the lower left exit region, exit through the lower right exit region, and trajectories that are trapped in the intermediate region of the Caldera. These three types of trajectory behavior are presented in Fig. 7, where .
We computed the ratio of the trajectories that exit through the lower left exit region (or the region of the lower left saddle), compared with those trapped in the Caldera or that exit through the lower right exit region (or the region of the lower right saddle), with respect to the parameter . We see in Fig. 8 that initially the ratio of the trajectories that exit through the lower left exit region (or the region of the lower left saddle) is and the ratio of the trajectories trapped in the Caldera or that exit through the lower right exit region (or the region of the lower right saddle) is . This is the phenomenon of dynamical matching in the symmetric Caldera, which is discussed in all previous studies ([8, 9, 15, 13, 14]). We observed that the bifurcation at does not result in any change of the ratio, which means that the phenomenon of dynamical matching exists before and after the bifurcation. When , the ratio of the trajectories that exit through the lower left exit region begins to drop and ends at approximately when . Conversely, the ratio of the trajectories trapped in the Caldera or that exit through the lower right exit region increases to after reaches . The second bifurcation, that happens at a large value of the depth of the potential, delays this affect on the trajectory behavior of breaking the dynamical matching after the bifurcation point. On the contrary, the first bifurcation (see the Subsection 3.3), which happens at a small value of the depth of the potential, affects directly (the change of the trajectory behavior is abrupt) the trajectory behavior after the bifurcation point. This means that the depth of the potential plays a very crucial in the change of the trajectory behavior and whether or not dynamical matching is broken after a bifurcation of critical points of the symmetric Caldera potential energy surface.

4 Conclusions
In [10] two types of the symmetric Caldera potential energy surface have been considered. The first type has five critical points, one center and four index-1 saddles around it (two upper and two lower saddles). The second type has three critical points, three index-1 saddles (two upper saddles and one lower saddle). In this paper we studied the influence of the depth of the potential on the trajectory behavior (of trajectories with initial conditions in the region of the upper saddles) before and after two bifurcations of critical points. These bifurcations represent a transition from one type of symmetric Caldera potential to another. The first bifurcation occurs at a small value of the depth of the potential and the second at a large value of the depth of the potential. The main conclusions of our study are the following:
-
1.
Dynamical matching is a general feature of the trajectory behavior of the first type of the symmetric Caldera potential energy surface.
-
2.
We encountered dynamical matching and also the non-existence of dynamical matching as types of trajectory behavior of the second type the symmetric Caldera potential energy surface.
-
3.
The depth of the potential is crucial and controls the appearance or not of dynamical matching after a bifurcation of critical points. In the case in which the bifurcation occurs at a small value of the depth of the potential, the change of the trajectory behavior is abrupt (from dynamical matching to the non-existence of dynamical matching and vice-versa). On the contrary, we observe a delay of this change of the trajectory behavior if the bifurcation occurs at a large value of the depth of the potential.
Acknowledgments
The authors would like to acknowledge the financial support provided by the EPSRC Grant No. EP/P021123/1.
References
- [1] W. v. E. Doering, C. Gilbert, P. Leermakers, Symmetrical distribution of energy in initially unsymmetrically excited products : Reaction of dideuteriodiazomethane with allene, methylenecyclopropane and vinylcyclopropane, Tetrahedron 24 (1968) 6863–6872.
- [2] J. Baldwin, Thermal rearrangements of vinylcyclopropanes to cyclopentenes, Chemical Reviews 103 (4) (2003) 1197–1212.
- [3] Z. Goldschmidt, B. Crammer, Vinylcyclopropane rearrangements, Chem. Soc. Rev 17 (1988) 229–267.
- [4] C. Doubleday, K. Bolton, W. Hase, Direct dynamics study of the stereomutation of cyclopropane, Journal of the American Chemical Society 119 (22) (1997) 5251–5252.
- [5] C. Doubleday, M. Nendel, K. Houk, D. Thweatt, M. Page, Direct dynamics quasiclassical trajectory study of the stereochemistry of the vinylcyclopropane - cyclopentene rearrangement, Journal of the American Chemical Society 121 (19) (1999) 4720–4721.
- [6] C. Doubleday, C. Suhrada, K. Houk, Dynamics of the degenerate rearrangement of bicyclo[3.1.0]hex-2-ene, Journal of the American Chemical Society 128 (1) (2006) 90–94.
- [7] M. Reyes, E. Lobkovsky, B. Carpenter, Interplay of orbital symmetry and nonstatistical dynamics in the thermal rearrangements of bicyclo[n.1.0]polyenes, Journal of the American Chemical Society 124 (2002) 641–651.
- [8] P. Collins, Z. Kramer, B. Carpenter, G. Ezra, S. Wiggins, Nonstatistical dynamics on the caldera, Journal of Chemical Physics 141 (034111) (2014).
- [9] M. Katsanikas, S. Wiggins, Phase space structure and transport in a caldera potential energy surface, International Journal of Bifurcation and Chaos 28 (13) (2018) 1830042.
- [10] Y. Geng, M. Katsanikas, M. Agaoglou, S. Wiggins, The influence of a pitchfork bifurcation of the critical points of a symmetric caldera potential energy surface on dynamical matching, Chem. Phys. Letters 768 (2021) 138397.
- [11] B. K. Carpenter, Trajectories through an intermediate at a fourfold branch point. implications for the stereochemistry of biradical reactions, Journal of the American Chemical Society 107 (20) (1985) 5730–5732. doi:10.1021/ja00306a021.
- [12] B. K. Carpenter, Dynamic matching: The cause of inversion of configuration in the [1,3] sigmatropic migration?, Journal of the American Chemical Society 117 (23) (1995) 6336–6344. doi:10.1021/ja00128a024.
- [13] M. Katsanikas, V. J. García-Garrido, S. Wiggins, The dynamical matching mechanism in phase space for caldera-type potential energy surfaces, Chemical Physics Letters 743 (2020) 137199. doi:https://doi.org/10.1016/j.cplett.2020.137199.
- [14] M. Katsanikas, V. J. García-Garrido, S. Wiggins, Detection of dynamical matching in a caldera hamiltonian system using lagrangian descriptors, Int. J. Bifurcation Chaos 30 (2020) 2030026.
- [15] M. Katsanikas, S. Wiggins, Phase space analysis of the nonexistence of dynamical matching in a stretched caldera potential energy surface, International Journal of Bifurcation and Chaos 29 (04) (2019) 1950057.