3D-M3: High-spatial resolution spectroscopy with extreme AO and 3D printed micro-lenslets
Abstract
By combining integral field spectroscopy with extreme adaptive optics we are now able to resolve objects close to the diffraction-limit of large telescopes, exploring new science cases. We introduce an integral field unit designed to couple light with a minimal platescale from the SCExAO facility at NIR wavelengths to a single-mode spectrograph. The integral field unit has a 3D-printed micro-lens array on top of a custom single-mode multi-core fiber, to optimize the coupling of light into the fiber cores. We demonstrate the potential of the instrument via initial results from the first on-sky runs at the 8.2 m Subaru Telescope with a spectrograph using off-the-shelf optics, allowing for rapid development with low cost.
1 Introduction
A plethora of intrinsic and extrinsic information can be collected through astronomical spectroscopy, such as distance, motion properties, chemical characteristics as well as the existence of nearby celestial bodies [1]. New techniques are rapidly advancing to extract more information from the spectral data, which translates to discoveries about celestial phenomena.
Almost half a century ago, the first fiber-fed instruments began supplementing existing astronomical spectrographs (e.g., Ref. [2, 3, 4]). With the help of optical fibers, it became possible to guide starlight from the telescope to remotely located instruments. This relaxed the mechanical constraints due to varying gravity vectors affecting the spectrograph, and the measurement precision increased as the instrument could be stabilized and controlled far better in a stable environment as opposed to that in the telescope dome. The fibers in these instruments are typically large in diameter multi-mode fibers, in order to couple as much light as possible from a seeing-limited image [5, 6].
A contemporary development of fiber spectrographs was the integral field unit (IFU). A fibered IFU makes use of several fibers to provide separate spatial samples, to investigate small regions of the image plane (e.g. adjacent or extended objects) [7]. The spectra from different locations of the image plane are positioned on the same detector, but physically displaced to avoid cross contamination. The use of fibers for integral field spectroscopy (IFS) provides spatial information of the target object, as well as improved flexibility to reformat the obtained spectra to fit the limited detector space.
Using multiple MMFs with relatively large core diameters of greater than 50 m to form an IFU that couples seeing-limited starlight, is today a relatively standard practice (e.g., Ref. [8, 9, 10, 11]), which has enabled many discoveries. However, these instruments are large, due to conservation of étendue, which means they are costly and difficult to stabilize. The ability to reduce the size would open up new avenues and reduce cost. One solution which has been proposed for several types of instruments (e.g., Ref. [12, 13, 14, 15, 16, 17, 18]), is to use fibers with smaller core diameter, or single-mode fibers. The main roadblock is that coupling starlight into SMFs from telescopes with a 4 m or larger primary diameter with a seeing-limited output, scale that is larger than the Fried parameter , is extremely inefficient.
Various efforts have been undertaken to increase the coupling efficiency to SMFs, with great success in recent years (e.g., Ref. [19, 20, 21, 22, 23, 17, 24, 25, 26, 27]). This is in large part due to adaptive optics (AO) systems, which reduce the point spread function (PSF) size and wavefront deformation to acceptable levels. In particular, extreme adaptive optics (ExAO) systems have demonstrated over Strehl ratio correction (restoring the PSF close to the diffraction-limit) in the H-band (1.5-1.8 m) (e.g., Ref. [28, 29, 30, 31, 32, 33]), allowing close to optimum coupling. ExAO systems are also able to maintain a constant PSF position, in better than median seeing on-sky conditions, which is essential for efficient coupling [34].
Using SMFs also enables astronomers to take advantage of the diffraction-limited imaging provided by AO. Together these can open up science cases not available to conventional instruments. Examples include spatially resolving the surface of barely resolved stellar photospheres as well as their chemical composition of their close molecular layer known as MOLsphere. The Subaru Coronagraphic Extreme Adaptive Optics (SCExAO) system at the Subaru Telescope is an ideal platform for combining such approaches [31]. The list of stars that could be imaged includes (in an angular diameter size order), Betelgeuse ( Orionis) 50 milli-arcseconds (mas), Mira ( Ceti) 50 mas, W Hya 42 mas, Antares ( Scorpii) 40 mas, Her 36 mas, R Leo 31 mas, Arcturus ( Bootis) 21 mas, Cep 21 mas, Her 21 mas and Aldebaran ( Tau) 19 mas. These are mostly giants with complex mass loss through a cool (2000 K) molecular wind (10 km ) and/or a hot corona (10,000 K) [35]. A spectrograph with a resolving power of several tens of thousand is enough to distinguish the differential spectral velocities of the surface that are of order a few km and to probe the atmospheric structure by measuring the wavelength-dependence of the stellar diameter [36]. A single observation will provide useful information regarding the photosphere of the star in high resolution, while a sequence of observations can inform on the differential rotation of the surface features, probing the magnetic field properties and the mass loss of the target (e.g., Ref. [37, 38, 39, 40, 41, 42]). Further science applications involve the study of Mira variables where the mass loss kinematics are of special importance as well as their dust and wind properties (e.g., Ref. [43]), and investigation of the orbital parameters of sub-arcsecond companions such as the unevenly bright yet well resolved Mira AB system, which is the closest wind accretion binary (e.g., Ref. [44, 45, 46]). Additionally, with a high resolution spectrograph the stellar chromospheres can be studied by observing chromospherically sensitive lines, such as the Paschen lines in the infrared (IR) regime and the He I IR triplet lines at 1083 nm, which are valuable indicators of chromospheric activity [47]. Lastly, stabilizing the environment of the instrument will enable precise radial velocity (RV) measurements.
Whilst single-mode (SM) IFUs enable high-spatial resolution spectroscopy and open these new science cases, they suffer from an issue with fill fraction. Due to the need for a cladding region around the central core, fiber IFUs can only sample a certain percentage of the light at the focal plane. Originally the percentage of sampled light was of the order of 60-65% for MMF-IFUs, though recent developments have increased this to 73% [9]. To increase the coupling efficiency, microlenses can be attached to the IFU, increasing the fill fraction (e.g., Ref. [48]). However, aligning these arrays and fiber bundles is difficult as the alignment tolerances are of the order of a few microns.
To reduce these problems, an alternative and more versatile type of fiber that can act as an IFU, i.e. the multi-core fiber (MCF) could be utilized. This is a combination of at least two fiber cores forming an individual fiber using a common cladding. The cores of a MCF can sample light across the image plane making it ideal for constructing an IFU. By 3D printing lens structures on top of its cores using lithography techniques, we save time and avoid alignment issues, dramatically improving the free-space coupling of light into the fiber and relaxing the requirement for precise alignment of the input (e.g., Ref. [49, 50, 51, 52, 53]).
Currently, the replicable high-resolution exoplanet and asteroseismology spectrograph (RHEA) at Subaru [18, 54] is one of the few IFU configured instruments using SMFs [17, 55, 56]. It uses the visual arm for wavelengths below 900 nm, of the SCExAO system, but suffers from low coupling efficiency and the presence of modal noise. The low coupling efficiency is likely due to mis-alignments in the commercial off-the-shelf micro-lens array (MLA) and anamorphic prisms to couple the light into the cores of the bundle of the fibers (stacked and glued together), which are sensitive to alignment, illustrating the difficulties of applying conventional approaches to SM technology. Following a similar approach as detailed below, the IFU of RHEA was upgraded recently with 3D-printed MLAs on a MCF in the visual band [57].
In this paper, we show the first demonstration of a custom MCF with in-situ 3D printed MLA on top of its 19 cores using two-photon polymerization lithography, in combination with a high resolving power compact SM spectrograph optimized for the 900 - 1100 nm wavelength range, further on referred to as 3D-printed mono-mode multi-core fiber spectrograph (3D-M3). This spectrograph takes design cues from RHEA@Subaru [18] for a wavelength range in the near-infrared (NIR) and the multicore fiber Photonic TIGER Échelle spectrograph [13, 15]. The instrument is designed for operation in the NIR arm of the SCExAO facility, making 3D-M3 the first instrument to take advantage of the phase-induced amplitude apodization (PIAA) optics in that path. PIAA are custom optics [58] that induce a softer apodization on the collimated beam, forming a near-Gaussian profile PSF output in the image plane [25]. This makes the coupling of starlight more efficient as the PIAA beam intensity profile is close to the mode-field profile of an SMF. The setup was tested on-sky using SCExAO at the 8.2 m Subaru Telescope; it covers an instantaneous 54 mas field of view (FOV). The custom MCF achieves high throughput coupling by using the 3D printed MLA on top of each of its cores, which provide a very high fill factor of the fiber surface and are extremely efficient for off-axis field injection while acting as an IFU. Combined with the SM spectrometer and SCExAO, the instrument shows potential towards a precise high-resolution IFS with astrophysical sources due to its inherent SMF stability and absence of modal noise as the MCF is designed to exhibit SM behavior in the wavelength regime of operation.
2 Methods
To efficiently inject light from an 8-m class telescope into the cores of a MCF and a diffraction-limited spectrograph, the following elements are required: a high performance AO system, an IFU with micro-lenses to dissect the focal plane image and direct light to the individual cores efficiently, the MCF itself, and the spectrograph, which must be able to handle a multi-core input In this section these elements will be discussed in detail.
2.1 Instrument architecture
To simulate the instrument, we compile component specifications from the resulting beam output of the telescope down to the detector. Starting with the 8-m Subaru Telescope, starlight continues through the complex set of the AO systems at Subaru, namely AO188 and SCExAO, where the intensity distribution of the resulting output beam is close to a Gaussian profile.
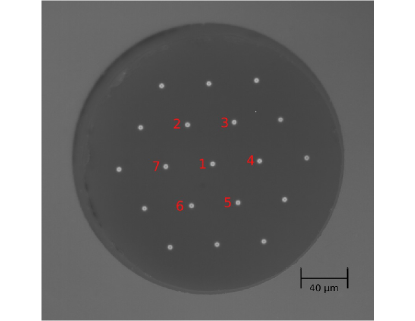
To efficiently couple light into the SM cores of the MCF, a custom fiber injection unit is required. This system has to be carefully optimized to match the parameters of the MCF, which has a 5.3 m mode-field diameter (MFD) at 980 nm () with a SM cut-off at 800 nm with an upper working wavelength limit of 1400 nm (a microscope image of the cross-section of the fiber is presented in Fig. 1). The core-to-core spacing (pitch) of the MCF is 40 m. This is important to make sure that the cross-coupling of light between the cores is negligible, as they are physically sufficiently separated with a ratio of pitch/MFD of 7.5:1, resulting in a theoretical cross-coupling less than few percent. To maximize the amount of light coupled to the fiber cores, micro-optics are 3D printed on top of the cores using a custom lithography system described below. To demonstrate the potential of such an injection unit system, a compact spectrograph was built with off-the-shelf optics detailed in the following sections.
To spatially resolve a stellar surface without compromising the throughput, the selected plate scale was /mm. That means that each fiber core subtends 18 mas on the sky. As a reference, the Subaru Telescope with the SCExAO facility is able to spatially resolve the surface of stars with an angular diameter of 50 mas, which is the apparent size of a handful of giant stars, such as, for example, Betelgeuse ( Ori), or Mira ( Ceti). The required focal ratio to achieve the /mm plate scale is . The diffraction limit of the Subaru Telescope at 980 nm is 25 mas. The plate scale of /mm was selected for a sub-diffraction limit sampling in order to seek for the sweet spot between spatially resolve the stellar surface and perform decently in terms of throughput.
2.2 The SCExAO infrastructure
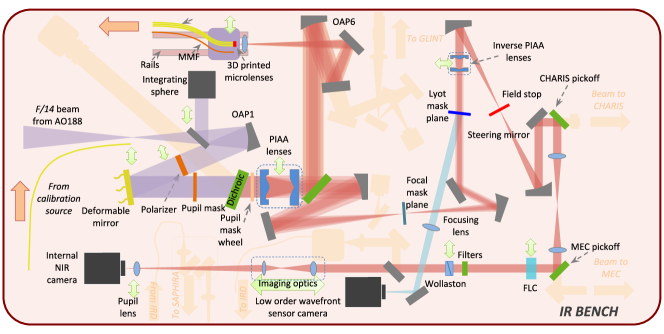
SCExAO is installed at the NIR Nasmyth focus of the 8.2 m Subaru Telescope. Detailed information and schematic layouts are provided in [31]. Initially the starlight from the 8.2 m Subaru Telescope enters the AO188 facility, which offers 30-40% Strehl PSF correction in the H-band under moderate atmospheric seeing conditions [59, 60, 61]. After a series of components in the optical train for manipulation of the beam, the light undergoes further wavefront corrections of higher-order spatial and temporal modes caused by the atmosphere. Next, it is filtered using a dichroic filter and split in two paths, the visible channel (900 nm) and the NIR (900 nm) channel. However, the wavelength response of the dichroic filter does not have a sharp cut-off profile, and there is a slight overlap of wavelengths between both channels. After that, the starlight is focused using a gold-coated off-axis parabola (OAP) with = 519 mm onto the 3D-printed MLA surface. The 3D-printed end of the MCF was installed on the NIR bench of SCExAO (see Fig. 2).
2.3 Simulations
To simulate the output beam, the profile of the Subaru Telescope and the key parameters of SCExAO from the literature (e.g. Ref. [31, 25]) were used.
The physical-optics propagation (POP) module of the commercial Zemax [62] ray tracing software was used to simulate the output beam profile of the Subaru Telescope, including the effect of the PIAA optics [58] installed in the NIR optical train of SCExAO, where the fiber is positioned. This output was used as an input for optimizing the performance of the MLA structure that forms the IFU.
To optimize the coupling efficiency of the SCExAO beam output at its focal plane, the physical-optics propagation module was used again to model the surface shape of the MLA structure. Even polynomials with coefficients up to eighth order were used to model the aspheric lens surfaces of the MLA, forming a hexagonal aperture at the top end of the lenslets where they are merged together leaving no space in between. Since the 3D printing method is able to achieve surface roughness with an root-mean-square (RMS) of 37 nm [52], the roughness of the structure is expected to be better than at the wavelength of operation. This resulted to a total coupling efficiency of 48.8% (coupling efficiency 56.4%, transmission through the MLA 86.4%, total coupling 48.8%).
2.4 Micro-optic manufacturing process
The structure of the MLA as detailed in Section 2.2.3 was directly printed in a single block using two-photon lithography into the commercially available negative-tone photoresist IP-Dip [63]. The MLA was printed on the cleaved facet of the MCF, which had been manually glued into an FC-PC connector and then polished to achieve a flat surface to enable straight-forward printing on the front face of the fiber. A lithography machine built in house [50, 51, 52, 64] was used to generate the lenses. The system is equipped with a 780 nm femtosecond laser [65] and a 40 Zeiss oil immersed objective lens with numerical aperture (NA) = 1.4. For high-precision alignment and writing with high shape fidelity, machine control software developed in house was used.
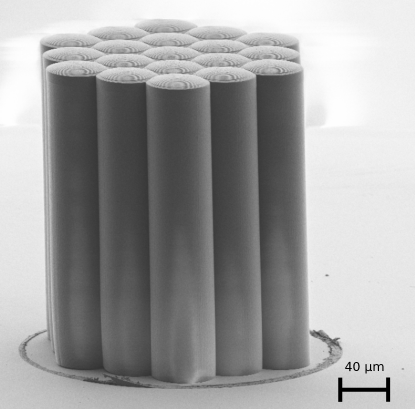
The fiber was back-illuminated with a red LED, which was used together with machine vision to detect the 19 cores of the MCF and align the individual lenses to each core. To compensate for any slight location and pitch variation of the individual cores of the MCF, the full 3D-model is generated only after core detection. Prior to printing, the individual models of the lenses are merged by a Boolean operation to avoid unnecessary double illumination. Automated detection of the fiber end-face tilt is employed and the structures are corrected accordingly. The writing distances between subsequent lines and layers, i.e., both hatching and slicing distance, were set to 100 nm. The fabricated structure is developed in propylene-glycol-methyl-ether-acetate (PGMEA), flushed with isopropanol, and subsequently blow dried. In the next stage, scanning electron microscopy (SEM) and vertically-scanned white-light interferometry (VSI) images of the structure were acquired to check the quality of the manufacturing process (see Fig. 3).
2.5 Fiber injection unit
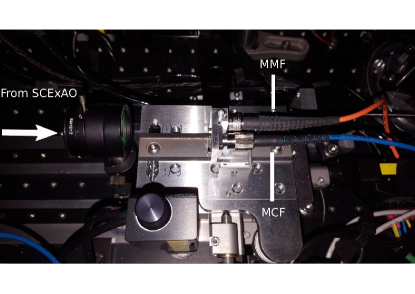
In order to achieve precise repeatable positioning of the injection fiber across the PSF of the target, a 5-axis remotely controlled stage was used. The 5-axis stage (Newport, M-562-XYZ & 562F-TILT) was equipped with computer controlled stepper motors (Zaber, T-NA08A25), which allowed a minimum step translation of 50 nm and 1 m of unidirectional repeatability (see Fig. 4). To align the fiber for tip-tilt, adjustments were performed manually at the L-bracket on which the fibers were mounted. The alignment of the fiber to the optical axis was achieved by adjusting the Gaussian illumination at the pupil to be centered while the fiber was back-illuminated with a HeNe laser. Immediately in front of the L-bracket, a 48 mm focal length plano-concave lens (Edmunds #67-995) was installed to re-adjust the injected to match that of the fiber. This was accomplished by using rails to translate the plano-concave lens and the 5-axis mount together and independently of each other. Using this arrangement a range of from 28 to 60 could be achieved.
The L-bracket was designed to support 2 fibers, the MCF and another fiber with SMA connector. On the SMA slot, a MMF was installed (365 m core, NA = 0.22, Thorlabs - FG365LEC) to calibrate the throughput measurements as the 5-axis stage moves laterally (sideways).
In order to achieve of 57.5 (see Section 2.2.1), the spacing between the focusing OAP (f = 519 mm), the concave lens and the fiber was adjusted. Zemax simulations served as a reference starting point, and then further optimized using a detector imaging the near field output of the MCF to confirm the required .
2.6 Throughput measurement setup
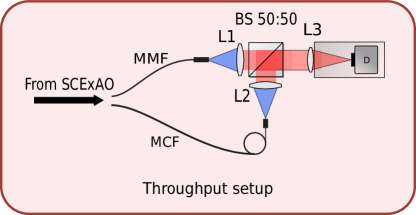
To measure the total throughput performance of the custom IFU, a throughput test experiment was constructed. A schematic illustration of this setup is presented in Fig. 5. The light from each of the fibers was collimated using a set of microscope lenses; L1 - Thorlabs RMS20X-PF for the MMF and L2 - Thorlabs RMS4X-PF for the MCF. Both beams were directed towards a 50:50 non-polarizing beamsplitter (BS) (Thorlabs CM1-BS014). After the BS, a 50 mm achromatic lens (L3 - Thorlabs AC254-050-B-ML) was used to re-focus the light on the detector (D - ASI-120MM-S mono). To measure the total throughput (including the coupling losses) of the MCF, the throughput of the MMF was used to calibrate the absolute flux. This was achieved by translating the 5-axis stage at the telescope focus to couple it to each core of the MCF input, and then normalizing each collected signal by the flux measured in the MMF.
2.7 Spectroscopic setup
To show the potential of using a 3D printed MLA in conjunction with an MCF, a spectrograph similar to the RHEA at Subaru design [66, 18] and the MCF Photonic TIGER Échelle spectrograph [13, 15] was built. The benchtop instrument is a compact diffraction-limited échelle spectrograph using only off-the-shelf components.
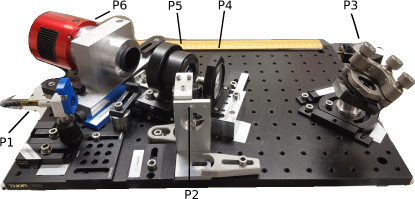
As illustrated in Fig. 6, the spectrograph is composed of the MCF with the 3D printed MLA (P1), a combination of optical lenses (P2) to collimate the beam (EO#49-656-12mm, EO#47-655-INK-36mm, Thorlabs TTL200-A) an échelle R2 grating (P3) (Thorlabs GE2550-0363) for dispersion, then cross-dispersion using a transmission grating (P4) ( 200 l/mm Baader Planetarium) and finally a lens (P5) (Thorlabs TTL200-B) to focus the beam onto the detector (P6) (ASI-183MM-pro mono).
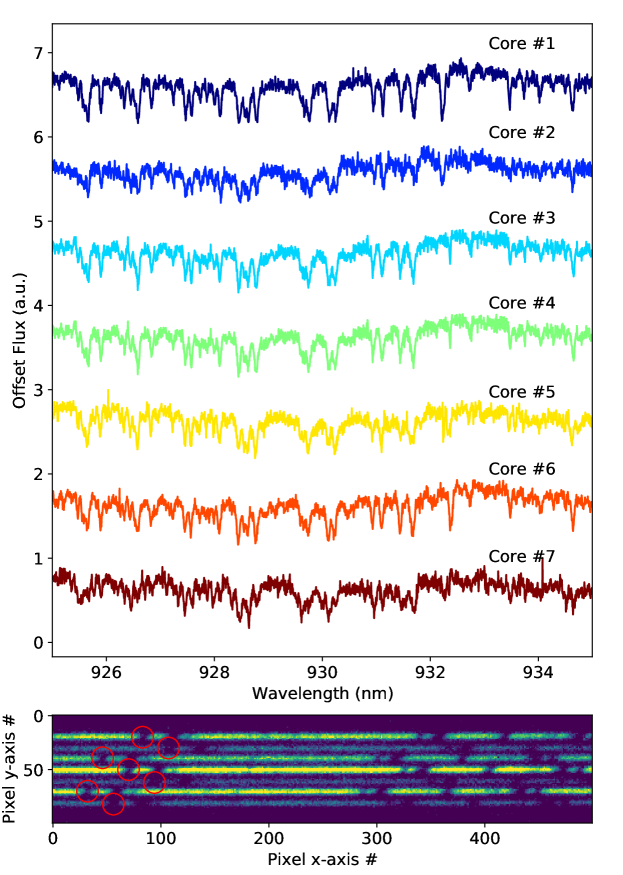
3D-M3 makes use of only the 7 inner cores of the MCF out of 19 in total in order to avoid overlapping of cores on the detector. A custom aperture to mask off the outer ring of 12 cores was positioned in between the MCF exit and the FC/PC connector mounted on the spectrograph side. The MCF was rotated around its central core until all the spectra from the individual cores were well separated and equidistant (see Fig. 13 bottom panel and Ref. [13, 15]). The resolving power of the spectrograph was measured as 30,000 at 1 m, while the footprint of the spectrograph is mm. It was installed on the Nasmyth NIR platform of the Subaru Telescope.
3 Results
3.1 Laboratory throughput results
To characterize the performance of the injection system prior to on-sky operation, we performed throughput measurements in lab conditions as described in Section 2.2.6. The results are presented here.
SCExAO is equipped with an internal calibration system using a Fianium supercontinuum source to inject light using an endlessly- single-mode fiber (SMF) delivering a broadband (from visible to K-band) diffraction-limited PSF into the facility following the same optical path as the light entering from the Subaru Telescope and the AO188 facility. This source was used to inject light into SCExAO (see Fig. 4) reaching the 3D printed MLA facet. Frames with exposure times of a fraction of a second were acquired with both fibers, the MCF and the large MMF used as a reference, using the experiment apparatus described in Section 2.2.6. Dark frames were also recorded, which were averaged and subtracted from the data frames before further processing.
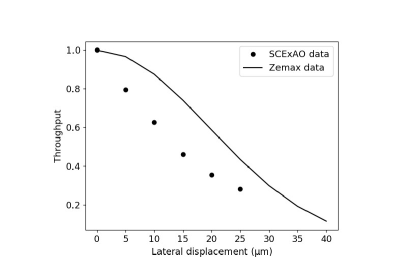
Two different experiments were performed to calculate the throughput performance of the IFU; in the first the maximum coupling of light into each core was calculated by measuring the optimal throughput after centering the incoming light on the fiber core, and in the second the sensitivity of the coupling efficiency to mis-alignment of the injected beam was calculated by measuring the throughput of the central core of the MCF as the injected beam was laterally displaced by steps of 5 m (9% of the each lenslet diameter) in order to evaluate the performance of the fiber in a more realistic scenario, where the target affected by atmospheric perturbations will be moving.
Through simulation we determined that the MMF coupled all of the injected light. Therefore, we could use the power coupled into the MMF to normalize the flux from the MCF. To this end, we scanned the 5-axis stage to optimize the coupling into each core.
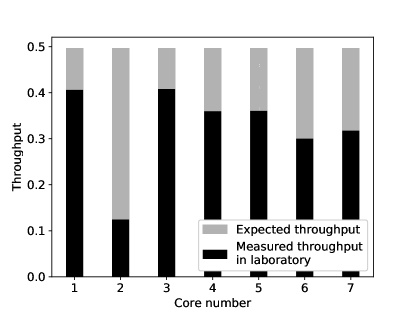
The results were derived using the PIAA optics of SCExAO. The outcome of the first experiment are shown in Fig. 7. The average throughput was 35.8 1.6% with a maximum equal to 40.7 2%. From the calculation of the average the low throughput of the fiber core #2 (12.3 2%) was excluded as it was not representative of the rest of the lenslet structure due to manufacturing errors. The maximum achieved throughput corresponds to 83 per cent of the theoretically expected value (48.8%) according to Zemax calculations (see Section 2.2.3). The throughput across all the 7 lenslets when illuminated by a single, unresolved star was measured to be 70 3% while the simulated is 83% (84.8% of the theoretical value The residual throughput loss of 8% can be attributed to Fresnel reflections (4%), impurities of the imperfectly polished fiber facets (less than few percent estimated based on past lab experience), and mode-field mismatch at the focus (3-5%).
The results of the second experiment are shown in Fig. 8, which shows that the mis-alignment tolerances of the injected beam are relaxed using the micro-lenses, maintaining the throughput to within 35% of the peak even for a lateral 20 m off-axis injection.
3.2 Turbulence impact on the throughput
Figures 7 and 8 represent the throughput efficiency of ideal atmospheric conditions with a nearly perfect wavefront. However, under realistic atmospheric conditions the performance is reduced as a function of the injected wavefront errors post AO correction. In order to assess the coupling efficiency of the starlight into the IFU system the throughput across all of the 7 cores of the MCF was measured, representative of an unresolved target. The measurements were performed using the turbulence simulator of SCExAO in laboratory conditions. A detailed description of the turbulence simulator can be found in Ref. [25, 31].
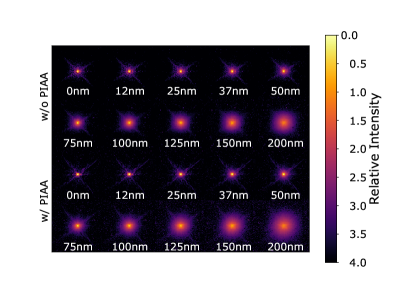
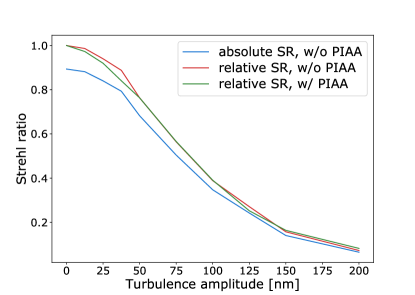
The turbulence simulator was configured to produce a range of atmospheric turbulence amplitudes to replicate a variety of on-sky conditions ranging from 0-200 nm RMS wavefront errors with variable steps of 12.5 and 25 nm. This was done to address the coupling performance of the IFU under different strehl ratios. Three types of data frames were captured: 1) PSF with the PIAA, 2) PSF without the PIAA and 3) dark data images for the background subtraction of the previous two data frames. Following the data reduction, the SR as a function of the turbulence amplitude was calculated. Using the data frames without the PIAA optics, the reduced data frames were compared with a simulated y-band (960-1080 nm) PSF in order to work out the absolute SR as a sanity check. The maximum measured SR was found to be 90% as a result of the image sampling that is close to the Nyquist criterion in addition to uncorrected low-order errors left on the optical train. After that, the measured PSF was used as our reference for the SR derivation with the PIAA. The ten variations of injected PSFs as well as the calculated SRs as a function of the turbulence amplitude are presented in Fig. 9 as captured by the internal camera of the SCExAO. On the top sub-figure of Fig. 9 from its top to middle, the ten injected PSFs are shown without the PIAA optics while in the middle to bottom frame the corresponding to those acquired with the usage of PIAA optics on train.
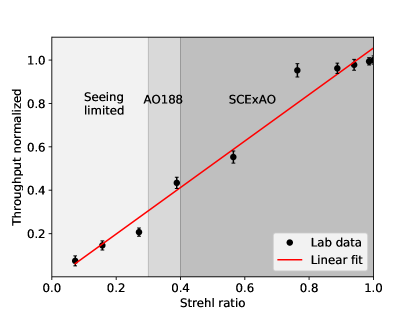
The output flux of the IFU was measured using the above mentioned setup in Section 2.2.6. The results from this experiment are presented in Fig. 10. This figure shows the relation of the normalized throughput efficiency as a function of the measured SR. A linear fit was performed to highlight the linear response of the throughput as a function of the SR. The mathematical equation of the linear fit at 980 nm is given by , where is the coupling efficiency. This means theoretically that the coupling efficiency using the SCExAO can be as high as 24-33% provided that a SR of 60-80% is achieved for the fine platescale of 18mas. As the fiber was found to be damaged near the non 3D-printed end, the following measurements are normalized. This then neglects the damage to the fiber, whilst showing the performance of the MLAs.
3.3 On-sky photometric results
The on-sky performance of the IFU system was tested on the night of 7th of October 2020 during a SCExAO engineering run. Consequently, the true performance of the system was measured under real observing conditions. However, as mentioned above the IFU cable was damaged and thus the maximum expected throughput performance was not achieved.
The starlight follows the optical path as described in Section 2.2.2. Similarly to the laboratory experiments, the PIAA optics were used to apodize the injected beam.
In order to evaluate the on-sky conditions, right after the end of the observation, data of the injected PSF was gathered for 4 min. These data are from a non-common focal plane with the IFU (see bottom left of Fig. 2).
The photometric image data were acquired using the setup described in Section 2.2.6, (see Fig. 5). The image data were taken with exposure times of a fraction of a second. Three types of on-sky data frames were gathered: 1) output data images of the focal plane of the IFU, 2) dark data images for the background subtraction of the output data images and 3) bias frames for pixel-to-pixel variation correction. Following that, the averaged bias and dark data images were subtracted from the output images as well as abnormal pixel values (hot, dead).
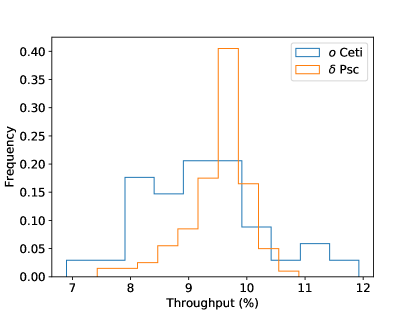
Two different targets were selected to be observed in order to characterize the efficiency of the IFU system, a target resolved by the Subaru Telescope and an unresolved one. The selected targets were Mira ( Ceti), as a representative of resolved target with an angular dimension of 50 mas and Psc, an unresolved target with an angular diameter of about 4 mas. The atmospheric conditions during the night of observation were within acceptable values (mean Seeing 0.42′′, mean humidity 30%, http://mkwc.ifa.hawaii.edu/current/seeing/images/20201007.meteogram.jpg) resulting in a mean SR of 0.4 in the y-band as calculated.
Numerous image data sets were captured on the photometer on both targets and the best overall throughput summed from all the 7 cores was 11.9 2.5% for the Ceti and 10.9 3% for Psc. As mentioned in Section 3.3.1 the laboratory measured throughput across all the 7 lenslets for the case of a single un-resolved star is 70%. The coupling results in the experiment were limited by the above mentioned damaged fiber. The photometric results are presented in Fig. 11. From the figure it can be seen that the dispersion around the maximum throughput highlights the MLA performance in keeping the coupling uniform even with the fine platescale of 18 mas. That produces uniform spectral traces of the individual MCF cores on the spectrograph detector for a resolved target, while a great portion of the light of an unresolved target is sampled mostly by the central core of the fiber.
3.4 On-sky spectroscopic results
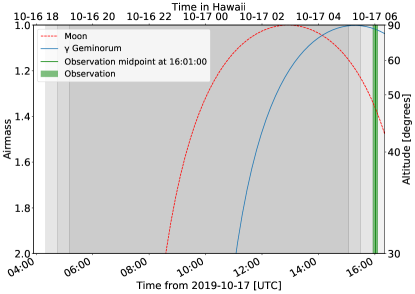
To evaluate the on-sky performance of the 3D-M3 instrument, it was tested on the night of 16th of October 2019 during a SCExAO engineering run. Thus, the true performance of the 3D-M3 was measured under real observing conditions. However, due to restrictions in available on-sky time, only one exposure of 8 min duration was captured at 6:00 (UTC-11) (see Fig. 12).
As explained in Section 2.2, starlight from the Subaru Telescope enters through the AO188 [61] into the SCExAO instrument. With the intent of maximizing the starlight coupling into the IFU, the wavefront sensor (WFS) loop was closed and the PIAA optics deployed. Specifically, additional software modules were used to improve the sensitivity by predictive control applied on the WFS to remove resonances [67] and enhance the wavefront correction. In addition, PIAA optics apodize the injected beam as was the case for the laboratory experiments.
After the end of the observation, PSF data of the injected beam was collected for 4 min in order to assess the on-sky conditions. However, the acquired data were from a non-common focal plane with the IFU, so there were non-common path errors as expected (see bottom left of Fig. 2).
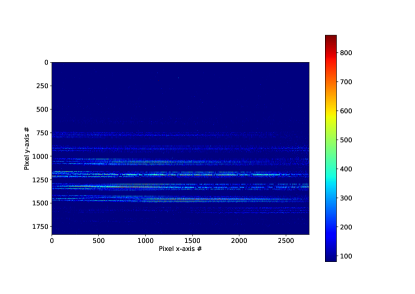
The spectroscopic image data were acquired with the ASI-183MM-pro mono CMOS detector with 8 min of exposure time. For the spectroscopic analysis four types of on-sky data images were collected: 1) output data images were taken at the focal plane of the spectrograph, 2) dark frames that were used for the background subtraction of the the output data images, 3) bias frames for correction of the pixel-to-pixel variations and 4) flat frames for the output normalization. Following the acquisition of data images, the averaged dark and bias frames were subtracted from the output images, abnormal (hot, dead) pixels were removed, and the averaged flat frames were used to normalize the final spectrum image data. The reduced frame is presented in Fig. 15.
The target was Geminorum, which is an A1.5IV+ sub-giant star expected to be almost free of absorption features, except for broad hydrogen lines. The resulting low signal to noise ratio (SNR) spectrum (SNR9) from this observation is shown in Fig. 13. In this figure, only the spectrum over the range of 925-935 nm is presented (908-968 nm is the full range), focusing on a narrow region where the spectral absorption features that are caused by the Earth’s atmosphere are most intense. The figure shows the spectra for all of the 7 cores individually. In the bottom panel of the figure, the 2D image of a part of the full spectrum is included for visual clarity of the geometry. The hexagonal pattern of the MCF at optimal rotation appears as 7 lines for each order.
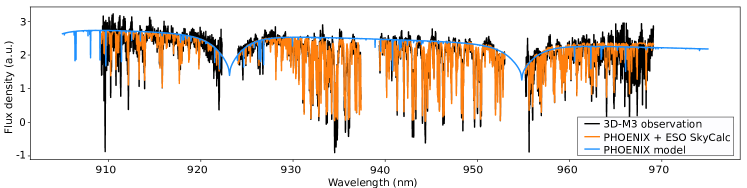
In the next step the spectra from each of the 7 cores were summed together in order to further increase the SNR, representative of the case of a single unresolved star spectrum observation. The resultant combined spectrum is presented in Fig. 14. The observed spectrum is represented with black color, with blue color the model spectrum for an Geminorum-like star from the PHOENIX spectral library [68] without the effect of telluric absorption, and with orange color the PHOENIX model spectrum with telluric absorption as calculated using ESO’s SkyCalc [69, 70].
3.5 Adaptive optics performance
To quantify and evaluate the performance of the AO correction, the on-sky PSF profile data were captured as explained in Section 3.3.4. The PSF was recorded in Flexible Image Transport System (FITS) format, with data cubes composed of 1000 instantaneous frames each, where the total exposure time of each data cube was 0.83 sec in total. For calibration purposes, additional PSF data cubes were captured off-sky as well using the internal calibration source of SCExAO, which follows the same optical path as the starlight (see center left of Fig. 2) and represents the case of an ideally shaped and stabilized target. Lastly, dark frames were collected for background subtraction.
Initially, each of the 1000 frames in the data cubes, for off and on-sky data, were dark current subtracted and averaged. After this, the ratio of the maximum intensity () to 90% of corresponding flux () was calculated and stored for all of the data. To approximate the Strehl ratio during the observation time, the stored maximum to flux ratios for each data-set (off and on-sky) were divided; this results in
| (1) |
The result of the calculation was = 0.2, representing an estimation of the Strehl ratio on-sky. From this analysis we confirm the visually observed low Strehl for the spectroscopic observation and highlight the reduced Strehl with respect to the night when the photometry was collected.
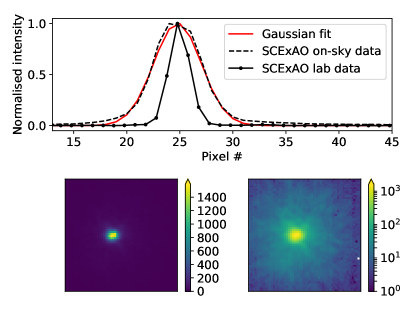
In the next step, the averaged intensity of a data cube was plotted along with a Gaussian fit. This was done for the laboratory PSF data as well. The resultant profile and fit are presented in Fig. 16. In the top panel of the figure the normalized intensity profile of the averaged on-sky data along one axis, its Gaussian fit and the profile from the laboratory ideal beam measurements are plotted together. In the bottom panels the 2D image of the on-sky PSF is plotted in linear and logarithmic scale for better clarity.
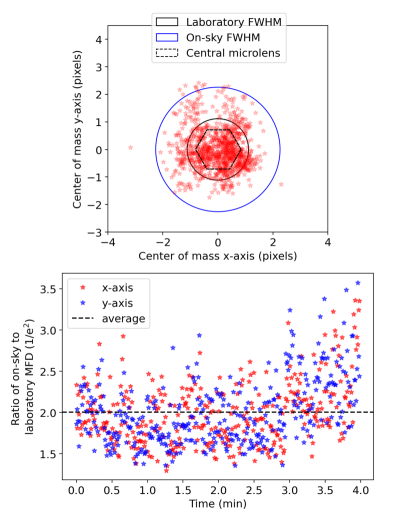
Following that, the 1000 data images from each data cube of the on-sky data, were averaged per data cube. Afterwards, the center of mass for each of them was calculated. In addition, the ratio of the on-sky to the laboratory beam full width at half maximum (FWHM) was calculated as a function of time through the exposure to visualize the beam diameter changes as experienced on-sky. Results are presented in Fig. 17; they suggest that the center of mass shift of the on-sky beam was rather big. Furthermore the size of the on-sky beam was twice as large compared to the laboratory one as illustrated in the bottom panel of the figure. Consequently, the position stability of the PSF was not representative of the typical SCExAO system performance but it was a consequence of the atmospheric conditions mentioned in Section 3.3.4 and the time of the observation.
4 Discussion
4.1 Laboratory throughput limitations
One of the crucial benefits of the 3D-printed MLAs is to significantly reduce the off-axis mis-alignments of the injected beam to a SMF, and as a consequence the light loss during the free-space coupling is reduced.
The results of the intended lateral beam displacements as shown in Fig. 8 suggest that there is a difference between the expected and the laboratory measured performance. The difference ranges between 0 and 27% depending on the position of the injected beam. This is caused by several factors sorting them by their importance are, the high sensitivity on the the PIAA lenses alignment that apodize the beam, the surface roughness of the MLA structure that is limited by the manufacturing process at the moment and any mismatch of the injected .
The actions to reduce the influence of these factors involve, the more accurate alignment of the PIAA lenses regularly to confirm the position as well as the shape of the apodized beam. An additional step is the validation of the injected of the beam by imaging it before its entrance in the IFU. Moreover, a better physical protection layer of the fiber will be implemented to avoid any future damaged to the fiber when it is exposed in the telescope environment.
4.2 On-sky observation limitations
As explained in Sections 3.3.4 and 3.3.5, the atmospheric conditions influenced the observation (mean Seeing 0.62′′, high humidity over 70%, http://mkwc.ifa.hawaii.edu/current/seeing/?night=20191017&lastURLnight=20191017). Additionally, at the time of the observation (sunrise) the sky brightness was not negligible and thus it was driving the WFS close to its saturation levels, leading to an under-performing AO system. Furthermore, the wind was rather high in strength and variable in direction (16 km/h), inducing vibrations to the structure of the telescope. Consequently, the stabilization and the shape of the beam coupled into the MLA facet was far from ideal as shown in Fig. 17 [71]. All the factors mentioned above are represented in the data. In more detail, the target under observation, which is unresolved by the Subaru Telescope, and the majority of its light should have been sampled by the central core of the MCF as inferred from Section 2.2.3. However, as appears in Fig. 15, the illumination of the fiber cores is almost uniform, resulting in a loss of spatial information of the input. A likely explanation of this is the very poor AO performance in correcting the shape and the stabilization of the injected beam. On the other hand, this demonstrates that our IFU can couple light from a point source rather efficiently into an SM spectrograph, even under poor conditions.
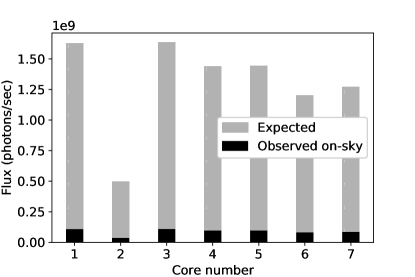
The expected performance of the IFU system encountered on-sky can be reproduced by Zemax simulations. In more detail, the POP module was used to simulate the performance of one lenslet out of the 7, as the lenslets are considered homogeneous. Two simulations were performed to calculate the expected flux output at the end facet of the MCF; in the first one, representative of the ideal on-sky conditions, we used a Gaussian beam with a 72 m MFD, which is a good approximation of the output beam profile of the Subaru Telescope, in combination with the SCExAO and PIAA optics, as described in Section 2.2.1. In the second one, we used a 2 bigger beam (144 m) in MFD size, as the input to our simulations (as observed in Section 3.3.5), which had also a lateral displacement term, relative to the central on-axis fiber core equal to 11 m (as observed in Fig. 17).
The apparent magnitude of Geminorum is taken from the literature and is approximately equal to 1.88 in NIR wavelengths. The transmission properties of the sky at Maunakea as well as the performance of all of the optical components of the telescope down to the injection fiber (without the spectrograph), for the corresponding optical band, were adapted from the literature and combined. The throughput of the IFU system was taken from Section 3.3.1. The resulting maximum flux derived from the simulations for the first experiment was found to be photons/sec in the Y photometric band (970-1007 nm) where a bandwidth of 104 nm of the spectroscopic band were used. The resulting throughput for the second experiment was found to be equal to 2.4% corresponding to an average flux of photons/sec. This is shown in Fig. 18, where the flux performance of the system up to the IFU level corresponds to 6% of the value measured in laboratory.
The analysis above provides a solid explanation of the observed on-sky performance. Moreover, the on-sky results are useful for predicting the expected performance of the system for future reference. To extrapolate the acquired results, given a photometric sky and median seeing conditions when Strehl ratios are over 60%, the required exposure time for achieving similar levels of SNR as experienced on-sky, would be 48 secs instead of 8 min.
5 Conclusions
In this study we accomplished the first technology demonstration of a high resolution diffraction-limited integral field spectrograph, 3D-M3. It utilizes a custom MCF with 3D printed micro-optics on top of its cores in order to increase the coupling efficiency of starlight from SCExAO at the 8.2 m Subaru Telescope while the the spatial information of the input is retained.
The injection IFU system is optimized for an on-sky angular dimension of 54 mas, using the output beam profile of SCExAO that makes use of PIAA optics shaping the output PSF to a near Gaussian profile.
The MLA was directly 3D printed onto the MCF using two-photon lithography, considerably improving the coupling of light to each of the fiber cores from a few per cent levels up to a theoretical maximum of 48.8% with the MLA. In addition to this, the mis-alignment tolerances of the injected beam were relaxed with this method, performing decently even for a lateral 20 m off-axis injection.
The throughput results on SCExAO confirm the theoretical expectation. A maximum of 40.7 2% of throughput per core was achieved (corresponding to 83% of the theoretical value) reaching an average of 35.8 1.6% per core. The throughput performance of the IFU system across all the 7 lenslets, representing the case of a single unresolved target was measured to be 70 3% (corresponding to 84.8% of the theoretical value). The difference between the theoretical and measured values can be attributed to the Fresnel losses at the interfaces of the MLA with the MCF and to their surface roughness. These results were obtained with SCExAO and an artificial light source, which closely represents the performance of the facility under good observing conditions. A short on-sky observation suffered from windshake and bad seeing, resulting in considerably lower throughout of less than 2% compared to the laboratory measurements during the spectrum acquisition.
The on-sky throughput results on SCExAO did not reach the expected performance as measured in the laboratory due to technical problems. However, demonstrate the principle and will serve as a baseline for future reference. A maximum throughput of 10.9 3% was achieved for the unresolved target while 11.9 2.5% was measured for the case of the resolved target.
Our system met the expectations and performed reasonably well given the conditions; the results highlight the importance of good on-sky conditions allowing optimal performance. If normal photometric conditions are met, the required exposure time for an observation with an SNR of 20 is reduced by a factor of ten. Compared to conventional high resolution IFS [72], the achieved SNR is still low due to the performance limitations of the optical components, mostly the detector efficiency in this wavelength regime.
Aims for future work include further optimization of the optical design by performing more simulations using Zemax, replacing the spectrometer optics with custom built ones using appropriate coatings for the wavelength range used, and investing in the stabilization of the instrument with enclosures and controls.
Observation aims for the future involve a list with a variety of targets (resolvable star, non-resolvable, double star system, massive confirmed exoplanets, spectroscopic standard stars) for evaluating its scientific potential.
6 Backmatter
Acknowledgments T.A. is a fellow of the International Max Planck Research School for Astronomy and Cosmic Physics at the University of Heidelberg (IMPRS-HD) and is supported by the Cotutelle International Macquarie University Research Excellence Scholarship. M.T., M.B., Y.X. and C.K. are supported by Bundesministerium für Bildung und Forschung (BMBF), joint project PRIMA (13N14630), the Helmholtz International Research School for Teratronics (HIRST), Deutsche Forschungsgemeinschaft (DFG, German Research Foundation) under Germany’s Excellence Strategy via the Excellence Cluster 3D Matter Made to Order (EXC2082/1-390761711). R.J.H., P.H. and A.Q. are supported by the Deutsche Forschungsgemeinschaft (DFG) through project 326946494, ’Novel Astronomical Instrumentation through photonic Reformatting’. T.B. & S.Y. are supported from the European Union’s Horizon 2020 grant 730890, and from the UK Science and Technology Facilities Council grant ST/N000544/1. S.Y.H. is supported by the NASA Hubble Fellowship grant #HST-HF2-51436.001-A awarded by the Space Telescope Science Institute, which is operated by the Association of Universities for Research in Astronomy, Incorporated, under NASA contract NAS5-26555. The development of SCExAO was supported by the JSPS (Grant-in-Aid for Research #23340051, #26220704 #23103002), the Astrobiology Center (ABC) of the National Institutes of Natural Sciences, Japan, the Mt Cuba Foundation and the directors contingency fund at Subaru Telescope, and the OptoFab node of the Australian National Fabrication Facility. The authors wish to recognize and acknowledge the very significant cultural role and reverence that the summit of Mauna Kea has always had within the indigenous Hawaiian community. We are most fortunate to have the opportunity to conduct observations from this mountain. This research made use of Astropy, a community-developed core Python package for Astronomy [73, 74], Numpy [75] and Matplotlib [76].
Disclosures The authors declare no conflicts of interest.
Data Availability Statement Data underlying the results presented in this paper are not publicly available at this time but may be obtained from the authors upon reasonable request.
References
- [1] P. Massey and M. M. Hanson, “Astronomical Spectroscopy,” \JournalTitlePlanets, Stars and Stellar Systems. Volume 2: Astronomical Techniques, Software and Data p. 35 (2013).
- [2] P. M. Gray, M. M. Phillips, A. J. Turtle, and R. Ellis, “Fibre optic development at the AAO.” \JournalTitleProceedings of the Astronomical Society of Australia 4, 477–479 (1982).
- [3] E. N. Hubbard, J. R. P. Angel, and M. S. Gresham, “Operation of a long fused silica fiber as a link between telescope and spectrograph.” \JournalTitleApJ 229, 1074–1078 (1979).
- [4] J. R. Powell, “Application of optical fibres to astronomical instrumentation.” \JournalTitleProc. SPIE 445, 77–84 (1984).
- [5] J. M. Hill, J. R. P. Angel, J. S. Scott, D. Lindley, and P. Hintzen, “Multiple object spectroscopy: the medusa spectrograph.” \JournalTitleApJ 242, L69–L72 (1980).
- [6] J. M. Hill, “The History of Multiobject Fiber Spectroscopy,” \JournalTitleFiber Optics in Astronomy (San Francisco: ASP) 3, 77 (1988).
- [7] J. Allington-Smith, “Basic principles of integral field spectroscopy,” \JournalTitleNew A Rev. 50, 244–251 (2006).
- [8] J. Ge, J. R. P. Angel, and J. C. Shelton, “Optical spectroscopy with a near-single-mode fiber-feed and adaptive optics,” \JournalTitleProc. SPIE 3355, 253 – 263 (1998).
- [9] S. M. Croom, J. S. Lawrence, J. Bland-Hawthorn, J. J. Bryant, L. Fogarty, S. Richards, M. Goodwin, T. Farrell, S. Miziarski, R. Heald, D. H. Jones, S. Lee, M. Colless, S. Brough, A. M. Hopkins, A. E. Bauer, M. N. Birchall, S. Ellis, A. Horton, S. Leon-Saval, G. Lewis, Á. R. López-Sánchez, S.-S. Min, C. Trinh, and H. Trowland, “The Sydney-AAO Multi-object Integral field spectrograph,” \JournalTitleMNRAS 421, 872–893 (2012).
- [10] J. J. Bryant, J. Bland-Hawthorn, J. Lawrence, S. Croom, D. Brown, S. Venkatesan, P. R. Gillingham, R. Zhelem, R. Content, W. Saunders, N. F. Staszak, J. van de Sande, W. Couch, S. Leon-Saval, J. Tims, R. McDermid, and A. Schaefer, “Hector: a new massively multiplexed IFU instrument for the Anglo-Australian Telescope,” \JournalTitleProc. SPIE 9908, 99081F (2016).
- [11] A. Tozzi, E. Oliva, M. Xompero, G. Agapito, M. Bonaglia, G. Di Rico, C. Giordano, S. Esposito, and N. Sanna, “ELT-HIRES the High Resolution Spectrograph for the ELT: the IFU-SCAO module,” \JournalTitleProc. SPIE 10702, 107028Q (2018).
- [12] J. Bland-Hawthorn, J. Lawrence, G. Robertson, S. Campbell, B. Pope, C. Betters, S. Leon-Saval, T. Birks, R. Haynes, N. Cvetojevic, and N. Jovanovic, “PIMMS: photonic integrated multimode microspectrograph,” in Ground-based and Airborne Instrumentation for Astronomy III, vol. 7735 of Society of Photo-Optical Instrumentation Engineers (SPIE) Conference Series I. S. McLean, S. K. Ramsay, and H. Takami, eds. (2010), p. 77350N.
- [13] S. G. Leon-Saval, C. H. Betters, and J. Bland -Hawthorn, “The Photonic TIGER: a multicore fiber-fed spectrograph,” \JournalTitleProc. SPIE 8450, 84501K (2012).
- [14] C. H. Betters, S. G. Leon-Saval, J. G. Robertson, and J. Bland-Hawthorn, “Beating the classical limit: A diffraction-limited spectrograph for an arbitrary input beam,” \JournalTitleOpt. Express 21, 26103–26112 (2013).
- [15] C. H. Betters, S. G. Leon-Saval, J. Bland-Hawthorn, S. N. Richards, T. A. Birks, and I. Gris-Sánchez, “PIMMS échelle: the next generation of compact diffraction limited spectrographs for arbitrary input beams,” in Ground-based and Airborne Instrumentation for Astronomy V, vol. 9147 S. K. Ramsay, I. S. McLean, and H. Takami, eds., International Society for Optics and Photonics (SPIE, 2014), pp. 571 – 579.
- [16] M. Tamura, H. Suto, J. Nishikawa, T. Kotani, B. Sato, W. Aoki, T. Usuda, T. Kurokawa, K. Kashiwagi, S. Nishiyama, Y. Ikeda, D. Hall, K. Hodapp, J. Hashimoto, J. Morino, S. Inoue, Y. Mizuno, Y. Washizaki, Y. Tanaka, S. Suzuki, J. Kwon, T. Suenaga, D. Oh, N. Narita, E. Kokubo, Y. Hayano, H. Izumiura, E. Kambe, T. Kudo, N. Kusakabe, M. Ikoma, Y. Hori, M. Omiya, H. Genda, A. Fukui, Y. Fujii, O. Guyon, H. Harakawa, M. Hayashi, M. Hidai, T. Hirano, M. Kuzuhara, M. Machida, T. Matsuo, T. Nagata, H. Ohnuki, M. Ogihara, S. Oshino, R. Suzuki, H. Takami, N. Takato, Y. Takahashi, C. Tachinami, and H. Terada, “Infrared Doppler instrument for the Subaru Telescope (IRD),” \JournalTitleProc. SPIE 8446, 84461T (2012).
- [17] J. R. Crepp, J. Crass, D. King, A. Bechter, E. Bechter, R. Ketterer, R. Reynolds, P. Hinz, D. Kopon, D. Cavalieri, and et al., “ilocater: a diffraction-limited doppler spectrometer for the large binocular telescope,” \JournalTitleProc. SPIE 9908, 990819 (2016).
- [18] A. D. Rains, M. J. Ireland, N. Jovanovic, T. Feger, J. Bento, C. Schwab, D. W. Coutts, O. Guyon, A. Arriola, and S. Gross, “Precision single mode fibre integral field spectroscopy with the RHEA spectrograph,” \JournalTitleProc. SPIE 9908, 990876 (2016).
- [19] V. Coudé du Foresto and S. T. Ridgway, “Fluor - a Stellar Interferometer Using Single-Mode Fibers,” \JournalTitleEuropean Southern Observatory Conference and Workshop Proceedings 39, 731 (1992).
- [20] V. Coudé du Foresto, M. Faucherre, N. Hubin, and P. Gitton, “Using single-mode fibers to monitor fast Strehl ratio fluctuations. Application to a 3.6 m telescope corrected by adaptive optics,” \JournalTitleA&AS 145, 305–310 (2000).
- [21] A. Ghasempour, J. Kelly, M. W. Muterspaugh, and M. H. Williamson, “A single-mode Echelle spectrograph: eliminating modal variation, enabling higher precision Doppler study,” \JournalTitleProc. SPIE 8450, 845045 (2012).
- [22] R. J. Harris, D. G. MacLachlan, D. Choudhury, T. J. Morris, E. Gendron, A. G. Basden, G. Brown, J. R. Allington-Smith, and R. R. Thomson, “Photonic spatial reformatting of stellar light for diffraction-limited spectroscopy,” \JournalTitleMNRAS 450, 428–434 (2015).
- [23] A. Bechter, J. Crass, R. Ketterer, J. R. Crepp, R. O. Reynolds, E. Bechter, P. Hinz, F. Pedichini, M. Foley, E. Runburg, E. E. Onuma, S. Gaudi, G. Micela, I. Pagano, and C. E. Woodward, “On-sky single-mode fiber coupling measurements at the Large Binocular Telescope,” \JournalTitleProc. SPIE 9909, 99092X (2016).
- [24] N. Cvetojevic, N. Jovanovic, S. Gross, B. Norris, I. Spaleniak, C. Schwab, M. J. Withford, M. Ireland , P. Tuthill, O. Guyon, F. Martinache, and J. S. Lawrence, “Modal noise in an integrated photonic lantern fed diffraction-limited spectrograph,” \JournalTitleOptics Express 25, 25546 (2017).
- [25] N. Jovanovic, C. Schwab, O. Guyon, J. Lozi, N. Cvetojevic, F. Martinache, S. Leon-Saval, B. Norris, S. Gross, D. Doughty, T. Currie, and N. Takato, “Efficient injection from large telescopes into single-mode fibres: Enabling the era of ultra-precision astronomy,” \JournalTitleA&A 604, A122 (2017).
- [26] T. Anagnos, R. J. Harris, M. K. Corrigan, A. P. Reeves, M. J. Townson, D. G. MacLachlan, R. R. Thomson, T. J. Morris, C. Schwab, and A. Quirrenbach, “Simulation and optimisation of an astrophotonic reformatter,” \JournalTitleMNRAS 478, 4881–4889 (2018).
- [27] A. J. Bechter, J. Crass, J. Tesch, J. R. Crepp, and E. B. Bechter, “Characterization of Single-mode Fiber Coupling at the Large Binocular Telescope,” \JournalTitlePASP 132, 015001 (2020).
- [28] R. Dekany, J. Roberts, R. Burruss, A. Bouchez, T. Truong, C. Baranec, S. Guiwits, D. Hale, J. Angione, T. Trinh, J. Zolkower, J. C. Shelton, D. Palmer, J. Henning, E. Croner, M. Troy, D. McKenna, J. Tesch, S. Hildebrandt, and J. Milburn, “PALM-3000: Exoplanet Adaptive Optics for the 5 m Hale Telescope,” \JournalTitleApJ 776, 130 (2013).
- [29] G. Agapito, C. Arcidiacono, F. Quirós-Pacheco, and S. Esposito, “Adaptive optics at short wavelengths. Expected performance and sky coverage of the FLAO system going toward visible wavelengths,” \JournalTitleExperimental Astronomy 37, 503–523 (2014).
- [30] B. Macintosh, J. R. Graham, P. Ingraham, Q. Konopacky, C. Marois, M. Perrin, L. Poyneer, B. Bauman, T. Barman, A. S. Burrows, A. Cardwell, J. Chilcote, R. J. De Rosa, D. Dillon, R. Doyon, J. Dunn, D. Erikson, M. P. Fitzgerald, D. Gavel, S. Goodsell, M. Hartung, P. Hibon, P. Kalas, J. Larkin, J. Maire, F. Marchis, M. S. Marley, J. McBride, M. Millar-Blanchaer, K. Morzinski, A. Norton, B. R. Oppenheimer, D. Palmer, J. Patience, L. Pueyo, F. Rantakyro, N. Sadakuni, L. Saddlemyer, D. Savransky, A. Serio, R. Soummer, A. Sivaramakrishnan, I. Song, S. Thomas, J. K. Wallace, S. Wiktorowicz, and S. Wolff, “First light of the Gemini Planet Imager,” \JournalTitleProceedings of the National Academy of Science 111, 12661–12666 (2014).
- [31] N. Jovanovic, F. Martinache, O. Guyon, C. Clergeon, G. Singh, T. Kudo, V. Garrel, K. Newman, D. Doughty, J. Lozi, J. Males, Y. Minowa, Y. Hayano, N. Takato, J. Morino, J. Kuhn, E. Serabyn, B. Norris, P. Tuthill, G. Schworer, P. Stewart, L. Close, E. Huby, G. Perrin, S. Lacour, L. Gauchet, S. Vievard, N. Murakami, F. Oshiyama, N. Baba, T. Matsuo, J. Nishikawa, M. Tamura, O. Lai, F. Marchis, G. Duchene, T. Kotani, and J. Woillez, “The Subaru Coronagraphic Extreme Adaptive Optics System: Enabling High-Contrast Imaging on Solar-System Scales,” \JournalTitlePASP 127, 890 (2015).
- [32] A. Vigan, M. Bonnefoy, C. Ginski, H. Beust, R. Galicher, M. Janson, J. L. Baudino, E. Buenzli, J. Hagelberg, V. D’Orazi, S. Desidera, A. L. Maire, R. Gratton, J. F. Sauvage, G. Chauvin, C. Thalmann, L. Malo, G. Salter, A. Zurlo, J. Antichi, A. Baruffolo, P. Baudoz, P. Blanchard, A. Boccaletti, J. L. Beuzit, M. Carle, R. Claudi, A. Costille, A. Delboulbé, K. Dohlen, C. Dominik, M. Feldt, T. Fusco, L. Gluck, J. Girard, E. Giro, C. Gry, T. Henning, N. Hubin, E. Hugot, M. Jaquet, M. Kasper, A. M. Lagrange, M. Langlois, D. Le Mignant, M. Llored, F. Madec, P. Martinez, D. Mawet, D. Mesa, J. Milli, D. Mouillet, T. Moulin, C. Moutou, A. Origné, A. Pavlov, D. Perret, C. Petit, J. Pragt, P. Puget, P. Rabou, S. Rochat, R. Roelfsema, B. Salasnich, H. M. Schmid, A. Sevin, R. Siebenmorgen, A. Smette, E. Stadler, M. Suarez, M. Turatto, S. Udry, F. Vakili, Z. Wahhaj, L. Weber, and F. Wildi, “First light of the VLT planet finder SPHERE. I. Detection and characterization of the substellar companion GJ 758 B,” \JournalTitleA&A 587, A55 (2016).
- [33] O. Guyon, R. Belikov, E. Bendek, S. Bos, T. Currie, T. Groff, R. Laugier, J. Lozi, J. Males, F. Martinache, B. Mazin, K. Miller, B. Norris, A. Sahoo, and S. Vievard, “Wavefront Sensing and Control R&D on the SCExAO Testbed,” \JournalTitleAmerican Astronomical Society 51, 280.06 (2020).
- [34] C. Ruilier, “A study of degraded light coupling into single-mode fibers,” \JournalTitleProc. SPIE 3350, 319–329 (1998).
- [35] T. Tsuji, “Cool luminous stars: the hybrid nature of their infrared spectra,” \JournalTitleA&A 489, 1271–1289 (2008).
- [36] A. Quirrenbach, D. Mozurkewich, J. T. Armstrong, D. F. Buscher, and C. A. Hummel, “Angular Diameter Measurements of Cool Giant Stars in Strong TiO Bands and in the Continuum,” \JournalTitleApJ 406, 215 (1993).
- [37] A. Lobel, A. K. Dupree, and R. L. Gilliland, “Spatially resolved tomographic STIS spectroscopy of Betelgeuse,” \JournalTitleAmerican Astronomical Society Meeting Abstracts 195, 45.03 (1999).
- [38] A. Lobel, J. Aufdenberg, A. K. Dupree, R. L. Kurucz, R. P. Stefanik, and G. Torres, “Spatially Resolved STIS Spectroscopy of Betelgeuse’s Outer Atmosphere,” \JournalTitleIAU Symposium 219, 641 (2004).
- [39] K. Ohnaka, “Spatially resolving the inhomogeneous structure of the dynamical atmosphere of Betelgeuse with VLTI/AMBER.” \JournalTitleMem. Soc. Astron. Italiana 80, 715 (2009).
- [40] T. Khouri, “Spatially-Resolved Observations of Giant Stars with SPHERE,” \JournalTitleProceedings of the ESO Garching conference 17 (2018).
- [41] K. Ohnaka and C. A. L. Morales Marín, “Spatially resolving the thermally inhomogeneous outer atmosphere of the red giant Arcturus in the 2.3 m CO lines,” \JournalTitleA&A 620, A23 (2018).
- [42] B. E. Wood, G. M. Harper, and H.-R. Mueller, “Spatially Resolving the Winds of Red Giant Stars,” HST Proposal (2019).
- [43] B. R. M. Norris, P. G. Tuthill, M. J. Ireland , S. Lacour, A. A. Zijlstra, F. Lykou, T. M. Evans, P. Stewart, and T. R. Bedding, “A close halo of large transparent grains around extreme red giant stars,” \JournalTitleNature 484, 220–222 (2012).
- [44] M. Karovska, M. de Val-Borro, W. Hack, J. Raymond, D. Sasselov, and N. P. Lee, “Focused Wind Mass Accretion in Mira AB,” \JournalTitleAAS 218, 228.03 (2011).
- [45] S. Ramstedt, S. Mohamed, W. H. T. Vlemmings, M. Maercker, R. Montez, A. Baudry, E. De Beck, M. Lindqvist, H. Olofsson, E. M. L. Humphreys, A. Jorissen, F. Kerschbaum, A. Mayer, M. Wittkowski, N. L. J. Cox, E. Lagadec, M. L. Leal-Ferreira, C. Paladini, A. Pérez-Sánchez, and S. Sacuto, “The wonderful complexity of the Mira AB system,” \JournalTitleA&A 570, L14 (2014).
- [46] W. H. T. Vlemmings, S. Ramstedt, E. O’Gorman, E. M. L. Humphreys, M. Wittkowski, A. Baudry, and M. Karovska, “Resolving the stellar activity of the Mira AB binary with ALMA,” \JournalTitleA&A 577, L4 (2015).
- [47] Fuhrmeister, B., Czesla, S., Hildebrandt, L., Nagel, E., Schmitt, J. H. M. M., Hintz, D., Johnson, E. N., Sanz-Forcada, J., Schöfer, P., Jeffers, S. V., Caballero, J. A., Zechmeister, M., Reiners, A., Ribas, I., Amado, P. J., Quirrenbach, A., Bauer, F. F., Béjar, V. J. S., Cortés-Contreras, M., Díez-Alonso, E., Dreizler, S., Galadí-Enríquez, D., Guenther, E. W., Kaminski, A., Kürster, M., Lafarga, M., and Montes, D., “The carmenes search for exoplanets around m dwarfs - the heriplet at 10830 ross the m dwarf sequence,” \JournalTitleA&A 632, A24 (2019).
- [48] G. Courtes, “An Integral Field Spectrograph (IFS) for Large Telescopes,” \JournalTitleIAU 92, 123 (1982).
- [49] T. Gissibl, S. Thiele, A. Herkommer, and H. Giessen, “Two-photon direct laser writing of ultracompact multi-lens objectives,” \JournalTitleNature Photonics 10, 554–560 (2016).
- [50] P.-I. Dietrich, I. Reuter, M. Blaicher, S. Schneider, M. Billah, T. Hoose, A. Hofmann, C. Caer, R. Dangel, B. Offrein, M. Möhrle, U. Troppenz, M. Zander, W. Freude, and C. Koos, “Lenses for low-loss chip-to-fiber and fiber-to-fiber coupling fabricated by 3d direct-write lithography,” \JournalTitleConference on Lasers and Electro-Optics p. SM1G.4 (2016).
- [51] P.-I. Dietrich, R. J. Harris, M. Blaicher, M. K. Corrigan, T. J. Morris, W. Freude, A. Quirrenbach, and C. Koos, “Printed freeform lens arrays on multi-core fibers for highly efficient coupling in astrophotonic systems,” \JournalTitleOpt. Express 25, 18288–18295 (2017).
- [52] P.-I. Dietrich, M. Blaicher, I. Reuter, M. Billah, T. Hoose, A. Hofmann, C. Caer, R. Dangel, B. Offrein, U. Troppenz, M. Moehrle, W. Freude, and C. Koos, “In situ 3d nanoprinting of free-form coupling elements for hybrid photonic integration,” \JournalTitleNature Photonics 12, 241–247 (2018).
- [53] P. Hottinger, R. J. Harris, P.-I. Dietrich, M. Blaicher, M. Glück, A. Bechter, J. Crass, J.-U. Pott, C. Koos, O. Sawodny, and A. Quirrenbach, “Micro-lens arrays as tip-tilt sensor for single mode fiber coupling,” \JournalTitleProc. SPIE 10706, 1070629 (2018).
- [54] A. D. Rains, M. J. Ireland, N. Jovanovic, J. Bento, T. Feger, J. Lozi, C. Schwab, D. W. Coutts, O. Guyon, A. Arriola, S. Gross, and J. E. Harris, “Development of the single-mode fiber integral field unit for the RHEA Spectrograph,” \JournalTitleProc. SPIE 10702, 107025J (2018).
- [55] D. Mawet, P. Wizinowich, R. Dekany, M. Chun, D. Hall, S. Cetre, O. Guyon, J. K. Wallace, B. Bowler, M. Liu, G. Ruane, E. Serabyn, R. Bartos, J. Wang, G. Vasisht, M. Fitzgerald, A. Skemer, M. Ireland, J. Fucik, J. Fortney, I. Crossfield, R. Hu, and B. Benneke, “Keck Planet Imager and Characterizer: concept and phased implementation,” \JournalTitleProc. SPIE 9909, 99090D (2016).
- [56] S. Y. Haffert, R. J. Harris, A. Zanutta, F. A. Pike, A. Bianco, E. Redaelli, A. Benoît, D. G. MacLachlan, C. A. Ross, I. Gris-Sánchez, M. D. Trappen, Y. Xu, M. Blaicher, P. Maier, G. Riva, B. Sinquin, C. Kulcsár, N. A. Bharmal, E. Gendron, L. Staykov, T. J. Morris, S. Barboza, N. Muench, L. Bardour, L. Prengère, H.-F. Raynaud, P. Hottinger, T. Anagnos, J. Osborn, C. Koos, R. R. Thompson, T. A. Birks, I. A. G. Snellen, C. U. Keller, L. Close, and J. R. Males, “Multi-core fibre-fed integral-field unit (MCIFU): overview and first-light,” \JournalTitleProc. SPIE 11448, 114484M (2020).
- [57] T. Anagnos, P. Maier, P. Hottinger, C. H. Betters, T. Feger, S. G. Leon-Saval, I. Gris-Sánchez, S. Yerolatsitis, J. Lozi, T. A. Birks, S. Vievard, N. Jovanovic, A. D. Rains, M. J. Ireland, R. J. Harris, B. C. K. Tiong, O. Guyon, B. Norris, S. Y. Haffert, M. Blaicher, Y. Xu, M. Straub, J.-U. Pott, O. Sawodny, P. L. Neureuther, D. W. Coutts, C. Schwab, C. Koos, and A. Quirrenbach, “An innovative integral field unit upgrade with 3D-printed micro-lenses for the RHEA at Subaru,” \JournalTitleProc. SPIE 11451, 1252 – 1261 (2020).
- [58] J. Lozi, F. Martinache, and O. Guyon, “Phase-Induced Amplitude Apodization on Centrally Obscured Pupils: Design and First Laboratory Demonstration for the Subaru Telescope Pupil,” \JournalTitlePASP 121, 1232 (2009).
- [59] Y. Hayano, H. Takami, O. Guyon, S. Oya, M. Hattori, Y. Saito, M. Watanabe, N. Murakami, Y. Minowa, M. Ito, S. Colley, M. Eldred, T. Golota, M. Dinkins, N. Kashikawa, and M. Iye, “Current status of the laser guide star adaptive optics system for Subaru Telescope,” \JournalTitleProc. SPIE 7015, 701510 (2008).
- [60] Y. Hayano, H. Takami, S. Oya, M. Hattori, Y. Saito, M. Watanabe, O. Guyon, Y. Minowa, S. E. Egner, M. Ito, V. Garrel, S. Colley, T. Golota, and M. Iye, “Commissioning status of Subaru laser guide star adaptive optics system,” \JournalTitleProc. SPIE 7736, 77360N (2010).
- [61] Y. Minowa, Y. Hayano, S. Oya, M. Watanabe, M. Hattori, O. Guyon, S. Egner, Y. Saito, M. Ito, H. Takami, V. Garrel, S. Colley, T. Golota, and M. Iye, “Performance of Subaru adaptive optics system AO188,” \JournalTitleProc. SPIE 7736, 77363N (2010).
- [62] Zemax, “Opticstudio - zemax,” (2016).
- [63] Nanoscribe GmbH, “Ip photoresists,” (2018).
- [64] M. Blaicher, M. R. Billah, J. Kemal, T. Hoose, P. Marin-Palomo, A. Hofmann, Y. Kutuvantavida, C. Kieninger, P.-I. Dietrich, M. Lauermann, S. Wolf, U. Troppenz, M. Moehrle, F. Merget, S. Skacel, J. Witzens, S. Randel, W. Freude, and C. Koos, “Hybrid multi-chip assembly of optical communication engines by in situ 3d nano-lithography,” \JournalTitleLight: Science & Applications 9, 71 (2020).
- [65] Menlo Systems GmbH, “C-fiber 780 femtosecond erbium laser,” (2020).
- [66] T. Feger, C. Bacigalupo, T. R. Bedding, J. Bento, D. W. Coutts, M. J. Ireland, Q. A. Parker, A. Rizzuto, and I. Spaleniak, “RHEA: the ultra-compact replicable high-resolution exoplanet and Asteroseismology spectrograph,” \JournalTitleProc. SPIE 9147, 91477I (2014).
- [67] L. A. Poyneer, R. J. D. Rosa, B. Macintosh, D. W. Palmer, M. D. Perrin, N. Sadakuni, D. Savransky, B. Bauman, A. Cardwell, J. K. Chilcote, D. Dillon, D. Gavel, S. J. Goodsell, M. Hartung, P. Hibon, F. T. Rantakyrö, S. Thomas, and J.-P. Veran, “On-sky performance during verification and commissioning of the Gemini Planet Imager’s adaptive optics system,” \JournalTitleProc. SPIE 9148, 166 – 180 (2014).
- [68] T. O. Husser, S. Wende-von Berg, S. Dreizler, D. Homeier, A. Reiners, T. Barman, and P. H. Hauschildt, “A new extensive library of PHOENIX stellar atmospheres and synthetic spectra,” \JournalTitleA&A 553, A6 (2013).
- [69] S. Noll, W. Kausch, M. Barden, A. M. Jones, C. Szyszka, S. Kimeswenger, and J. Vinther, “An atmospheric radiation model for Cerro Paranal. I. The optical spectral range,” \JournalTitleA&A 543, A92 (2012).
- [70] A. Jones, S. Noll, W. Kausch, C. Szyszka, and S. Kimeswenger, “An advanced scattered moonlight model for Cerro Paranal,” \JournalTitleA&A 560, A91 (2013).
- [71] J. Lozi, O. Guyon, N. Jovanovic, N. Takato, G. Singh, B. Norris, H. Okita, T. Bando, and F. Martinache, “Characterizing vibrations at the Subaru Telescope for the Subaru coronagraphic extreme adaptive optics instrument,” \JournalTitleJournal of Astronomical Telescopes, Instruments, and Systems 4, 049001 (2018).
- [72] F. Eisenhauer, R. Abuter, K. Bickert, F. Biancat-Marchet, H. Bonnet, J. Brynnel, R. D. Conzelmann, B. Delabre, R. Donaldson, J. Farinato, E. Fedrigo, R. Genzel, N. N. Hubin, C. Iserlohe, M. E. Kasper, M. Kissler-Patig, G. J. Monnet, C. Roehrle, J. Schreiber, S. Stroebele, M. Tecza, N. A. Thatte, and H. Weisz, “SINFONI - Integral field spectroscopy at 50 milli-arcsecond resolution with the ESO VLT,” \JournalTitleProc. SPIE 4841, 1548–1561 (2003).
- [73] Astropy Collaboration, T. P. Robitaille, E. J. Tollerud, P. Greenfield, M. Droettboom, E. Bray, T. Aldcroft, M. Davis, A. Ginsburg, A. M. Price-Whelan, W. E. Kerzendorf, A. Conley, N. Crighton, K. Barbary, D. Muna, H. Ferguson, F. Grollier, M. M. Parikh, P. H. Nair, H. M. Unther, C. Deil, J. Woillez, S. Conseil, R. Kramer, J. E. H. Turner, L. Singer, R. Fox, B. A. Weaver, V. Zabalza, Z. I. Edwards, K. Azalee Bostroem, D. J. Burke, A. R. Casey, S. M. Crawford, N. Dencheva, J. Ely, T. Jenness, K. Labrie, P. L. Lim, F. Pierfederici, A. Pontzen, A. Ptak, B. Refsdal, M. Servillat, and O. Streicher, “Astropy: A community Python package for astronomy,” \JournalTitleA&A 558, A33 (2013).
- [74] A. M. Price-Whelan, B. M. Sipőcz, H. M. Günther, P. L. Lim, S. M. Crawford, S. Conseil, D. L. Shupe, M. W. Craig, N. Dencheva, A. Ginsburg, J. T. VanderPlas, L. D. Bradley, D. Pérez-Suárez, M. de Val-Borro, P. Paper Contributors, T. L. Aldcroft, K. L. Cruz, T. P. Robitaille, E. J. Tollerud, A. Coordination Committee, C. Ardelean, T. Babej, Y. P. Bach, M. Bachetti, A. V. Bakanov, S. P. Bamford, G. Barentsen, P. Barmby, A. Baumbach, K. L. Berry, F. Biscani, M. Boquien, K. A. Bostroem, L. G. Bouma, G. B. Brammer, E. M. Bray, H. Breytenbach, H. Buddelmeijer, D. J. Burke, G. Calderone, J. L. Cano Rodríguez, M. Cara, J. V. M. Cardoso, S. Cheedella, Y. Copin, L. Corrales, D. Crichton, D. D’Avella, C. Deil, É. Depagne, J. P. Dietrich, A. Donath, M. Droettboom, N. Earl, T. Erben, S. Fabbro, L. A. Ferreira, T. Finethy, R. T. Fox, L. H. Garrison, S. L. J. Gibbons, D. A. Goldstein, R. Gommers, J. P. Greco, P. Greenfield, A. M. Groener, F. Grollier, A. Hagen, P. Hirst, D. Homeier, A. J. Horton, G. Hosseinzadeh, L. Hu, J. S. Hunkeler, Ž. Ivezić, A. Jain, T. Jenness, G. Kanarek, S. Kendrew, N. S. Kern, W. E. Kerzendorf, A. Khvalko, J. King, D. Kirkby, A. M. Kulkarni, A. Kumar, A. Lee, D. Lenz, S. P. Littlefair, Z. Ma, D. M. Macleod, M. Mastropietro, C. McCully, S. Montagnac, B. M. Morris, M. Mueller, S. J. Mumford, D. Muna, N. A. Murphy, S. Nelson, G. H. Nguyen, J. P. Ninan, M. Nöthe, S. Ogaz, S. Oh, J. K. Parejko, N. Parley, S. Pascual, R. Patil, A. A. Patil, A. L. Plunkett, J. X. Prochaska, T. Rastogi, V. Reddy Janga, J. Sabater, P. Sakurikar, M. Seifert, L. E. Sherbert, H. Sherwood-Taylor, A. Y. Shih, J. Sick, M. T. Silbiger, S. Singanamalla, L. P. Singer, P. H. Sladen, K. A. Sooley, S. Sornarajah, O. Streicher, P. Teuben, S. W. Thomas, G. R. Tremblay, J. E. H. Turner, V. Terrón, M. H. van Kerkwijk, A. de la Vega, L. L. Watkins, B. A. Weaver, J. B. Whitmore, J. Woillez, V. Zabalza, and A. Contributors, “The Astropy Project: Building an Open-science Project and Status of the v2.0 Core Package,” \JournalTitleAJ 156, 123 (2018).
- [75] C. R. Harris, K. J. Millman, S. J. van der Walt, R. Gommers, P. Virtanen, D. Cournapeau, E. Wieser, J. Taylor, S. Berg, N. J. Smith, R. Kern, M. Picus, S. Hoyer, M. H. van Kerkwijk, M. Brett, A. Haldane, J. Fernández del Río, M. Wiebe, P. Peterson, P. Gérard-Marchant, K. Sheppard, T. Reddy, W. Weckesser, H. Abbasi, C. Gohlke, and T. E. Oliphant, “Array programming with NumPy,” \JournalTitleNature 585, 357–362 (2020).
- [76] J. D. Hunter, “Matplotlib: A 2D Graphics Environment,” \JournalTitleComputing in Science and Engineering 9, 90–95 (2007).