ALMA Host galaxy observation of the off-axis Gamma-Ray Burst XRF 020903
Abstract
We investigated the radio properties of the host galaxy of X-ray flash, XRF 020903, which is the best example for investigating of the off-axis origin of gamma-ray bursts (GRBs). Dust continuum at 233 GHz and CO are observed using the Atacama Large millimeter/submillimeter array. The molecular gas mass derived by applying the metallicity-dependent CO-to-H2 conversion factor matches the global trend along the redshift and stellar mass of the GRB host galaxies. The estimated gas depletion timescale (pertaining to the potential critical characteristics of GRB host galaxies) is equivalent to those of GRBs and super-luminous supernova hosts in the same redshift range. These properties of the XRF 020903 host galaxy observed in radio resemble those of GRB host galaxies, thereby supporting the identical origin of XRF 020903 and GRBs.
1 Introduction
X-ray flashes (XRFs) were discovered by the BeppoSAX satellite during the dawn of the gamma-ray bursts (GRBs; Heise et al., 2001; Kippen et al., 2002). The observed X-ray properties in the prompt phase were identical to those of GRBs, except for the considerably lower energy values of the spectral peak energy, in the spectrum. Systematic prompt phase observations made by HETE-2 indicated that the XRFs are associated with the same phenomenon as classical hard GRBs and are representative of the extension of the GRB population to low-peak-energy events (Sakamoto et al., 2005). Three models have been proposed to explain the observed prompt properties: high-redshift origin (Heise, 2003), intrinsic property (e.g., a subenergetic or inefficient fireball; Huang et al., 2002), and off-axis jet models (Yamazaki et al., 2002; Zhang et al., 2004; Lamb et al., 2005). For the latter two models, on-axis and off-axis orphan GRB afterglows can appear because of their lower Lorentz factor caused by inefficient fireball and off-axis viewing, respectively. Urata et al. (2015) confirmed the off-axis origin of the XRF 020903 case by identifying achromatic rebrightening in the afterglow. Additionally, XRF 020903 was characterized well through observations, e.g., redshift measurement (Soderberg et al., 2004), a lower intrinsic (Sakamoto et al., 2004), and supernova association(Soderberg et al., 2005). Among all the XRF samples, XRF 020903 was the only sample suitable for investigating its origin. Although the XRF observations have been terminated owing to the lack of wide-field soft-X-ray monitoring instruments such as WXM on board HETE-2 (Shirasaki et al., 2003), planned GRB missions, i.e., SVOM (Godet et al., 2012), HiZ-GUNDAM(Yonetoku et al., 2020), and THESEUS(Amati et al., 2018) would provide large samples.
The off-axis viewing of GRB jets for both long and short GRBs is essential for understanding the unification of GRBs, including related energetic stellar explosions, as well as to perform multimessenger astronomy. In particular, short GRBs and the jet viewing angle are essential for understanding the characteristics of short GRBs associated with the gravitational wave transients caused by neutron star mergers (e.g., Alexander et al., 2017; Haggard et al., 2017; Lazzati et al., 2017; Murguia-Berthier et al., 2017; Ioka, & Nakamura, 2018; Jin et al., 2018; Kathirgamaraju et al., 2018; Troja et al., 2018, 2019; Lamb & Kobayashi, 2018; Lyman et al., 2018; Lamb et al., 2019). Long GRBs are believed to occur when a very massive star dies in a highly energetic supernova (SNe), forming a black hole and producing a relativistic jet. The averaged jet opening angles were measured to be , i.e., of the same order as that of AGNs, based on achromatic temporal breaks in afterglow light curves (e.g., Racusin et al., 2009). Cocoon structures surrounding the GRB jets were identified to be similar to those of AGNs (Izzo et al., 2019; Chen et al., 2020). Similar to the unification model of AGNs, observing GRB jets at the various viewing angles can provide GRBs, XRFs, off-axis orphan GRB afterglows, and energetic stellar explosions (e.g., Pastorello et al., 2010; Huang et al., 2019; Izzo et al., 2020). In this regard, all of these phenomena share the same environment (i.e., common host galaxy properties).
Off-axis orphan GRB afterglow searches were performed at various wavelengths (Grindlay, 1999; Greiner et al., 2000; Rau et al., 2006; Levinson et al., 2002; Gal-Yam et al., 2006; Huang et al., 2020). Although these numerous surveys do not involve the detection of off-axis orphan GRB afterglows, the detection rate implies that the consideration of jet structures is essential for future orphan GRB afterglow surveys (e.g., Huang et al., 2020). The VLA Sky Survey (VLASS) identified a luminous radio transient and reported it as a candidate for off-axis orphan GRB afterglows (Law et al., 2018; Marcote et al., 2019). Although the possibility of the nebula of a newly born magnetar is not precluded, the similar star formation property of the host galaxy to that of long GRB hosts supports the off-axis orphan GRB afterglow phenomenon.
Millimeter and submillimeter observations for both GRBs and their host galaxies using the Atacama Large Millimeter/submillimeter Array (ALMA) have provided new insights. The first measurement of the radio linear polarization suggested depolarization caused by nonenergetic electrons, which afforded acceleration efficiency at the shock (Urata et al., 2019). Meanwhile, carbon monoxide (CO) lines (Hatsukade et al., 2014; Arabsalmani et al., 2020) were identified from spatially resolved imaging observation. Hatsukade et al. (2014) indicated that the bursts occurred in regions rich in dust, but not particularly rich in molecular gas. Arabsalmani et al. (2020) revealed that the presence of starburst modes of star formation on local scales in the galaxy, even though the galaxy as a whole cannot be categorized as a starburst based on its global properties. By expanding the previous studies using nearby GRB samples (0.12; Michałowski et al., 2018), statistical studies regarding CO observations indicated possible common properties of GRB host galaxies in terms of their molecular gas mass fraction and gas depletion timescale, particularly at (Michałowski et al., 2018; Hatsukade et al., 2020a). Additionally, the detection of [] also provided a new physical property for the characterization of GRB host galaxies at (Hashimoto et al., 2019).
Herein, we present the results of ALMA continuum and CO line observations on the host galaxy of an off-axis GRB event (i.e., XRF 020903). The remainder of this paper proceeds as follows. In Section 2, we summarize the previous XRF 020903 observations. In Section 3, we describe the ALMA observations for XRF 020903 host galaxies and other GRB samples. In Sections 4 and 5, we present the results of the continuum and CO line observations and discuss their properties, respectively, based on using the following cosmological parameters: =70 , , and .
2 Off-Axis GRB, X-Ray Flash 020903
XRF 020903 is the most favorable sample for the unification of GRBs, whereas the jet viewing angle is the most favorable parameter. The event was characterized by (a) measurements of lower spectral peak energy of the prompt emission, (b) redshift measurements (, (c) evidence of the off-axis viewing of the GRB jet, (d) association of a supernova component in the optical afterglow, and (e) a low-metallicity environment via an optical identification of the host galaxy. Based on observation by the HETE-2 satellite, the lowest intrinsic spectral peak energy of 3.3 keV was identified among all the XRF samples (Sakamoto et al., 2004). The redshift of (Soderberg et al., 2004) was measured via optical spectroscopic observation observations. Achromatic rebrightening caused by the off-axis viewing of classical GRB jets (Urata et al., 2015) were detected via early multicolor optical observations. SN1998bw-like supernova association was confirmed via optical spectroscopy at 25 day after the burst(Soderberg et al., 2005).
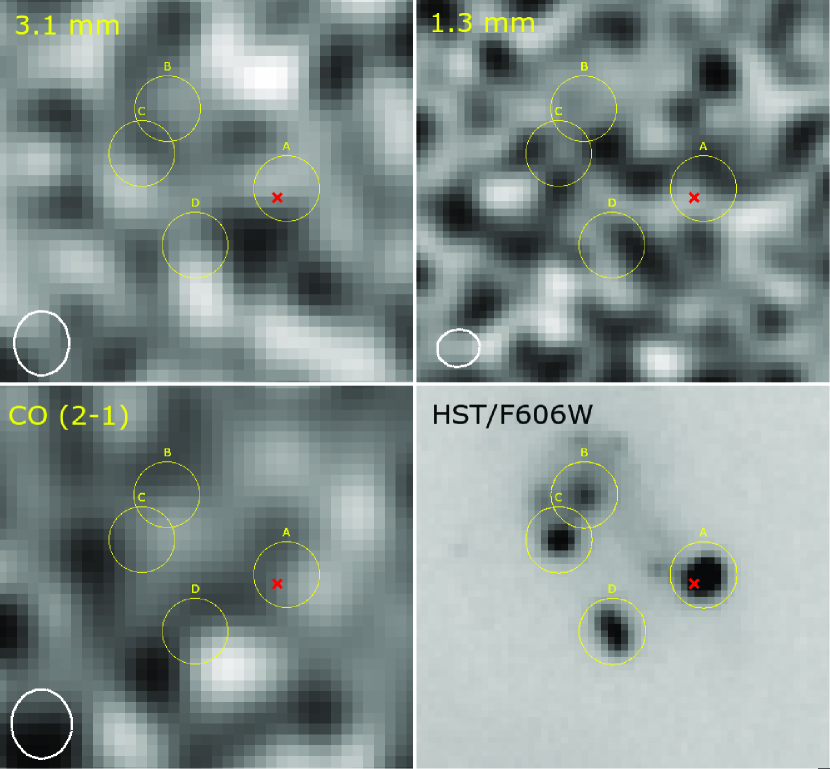
The high-resolution host galaxy image obtained by the Hubble Space Telescope (HST; Soderberg et al., 2004) shows the existence of at least four components as shown in Figure 1. The optical spectroscopy for the burst site measured the metallicities as log(O/H)+ 12 8.0. Combined with GRB host galaxy measurements, the observed metallicities indicated the lowest values (Levesque et al., 2010). Meanwhile, burst site studies involving optical spectra also indicated features of a significant WolfRayet star population (Hammer et al., 2006; Han et al., 2010). The spatially resolved optical spectroscopic observations indicated that the bust site is likely the most recent and active site of star formation in the XRF 020903 host galaxy, which is consistent with other spatially resolved GRB host galaxy studies (Thorp & Levesque, 2018). Using line diagnostics (Thorp & Levesque, 2018), the low metallicities for all of four regions were measured to be for the burst site and 8.2 for the remaining regions.
3 Observations and Data
3.1 XRF 020903
The location of the XRF 020903 field at Band 3 and Band 6, for the Cycle 3 program (Project code: 2015.1.01254.S) was observed using ALMA. The observations in Band 3 were executed on 2016 September 19 and 21. The total on-source time was 4318 s. A correlator was used in the frequency domain mode with a bandwidth of 1875 MHz (488.28 kHz 3840 channels). Four basebands were used, resulting in a total bandwidth of 7.5GHz. The main aspect of the observation was the search for the CO () line associated with the XRF 020903 host galaxy. The bandpass and flux were calibrated using observations from J2258-2758 and J0006-0623, and those from J2236-1433 were used for the phase calibration. The photometric observation in Band 6 with the total on-source time of 962 s was performed on 2016 July 28. The bandpass and flux were calibrated using observations from J2258-2758 and Pallas, whereas observations from J2303-1841 were used for phase calibration.
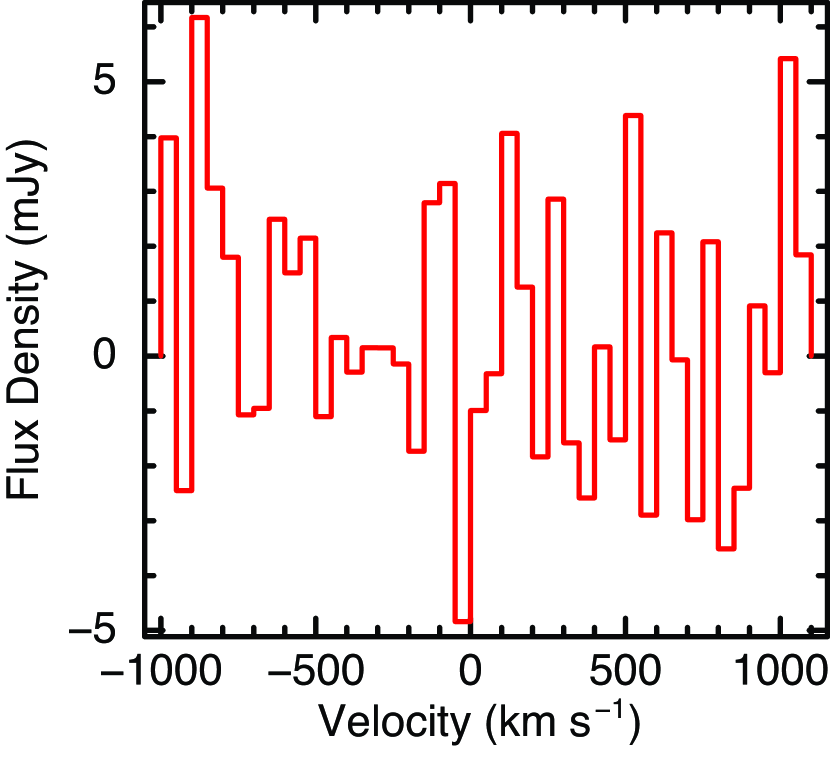
The data were reduced using the Common Astronomy Software Applications package (McMullin et al., 2007) in a standard manner. Data calibration was performed using the ALMA Science Pipeline Software of CASA version 4.7.0-1. Maps were processed using the TCLEAN algorithm with the Briggs weighting (with a robust parameter of 0.5). Furthermore, a CO () velocity-integrated map with a velocity width of 180 km -1 was created using the TCLEAN algorithm. The final synthesized beam size (FWHM) was for Band 3, for Band 6, and for the velocity-integrated maps. These maps, with their optical images obtained using the HST, are shown in Figure 1. By resolving the four optical host galaxy components, the 3 upper limits of 0.032 mJy at 113 GHz and 0.061 mJy at 224 GHz were estimated. The 3 limit of the CO velocity-integrated map with 180 km/s was 0.57 mJy. The spectra around the CO() line for the host region was centered at R.A. = , decl. = with a radius of (i.e., including all four optical components) indicates a null detection (Figure 2).
3.2 GRB Host Galaxy Samples
Table 1 summarizes the properties of 36 GRBs and two super-luminous supernova (SLSN) host galaxies observed using the ALMA in comparison with the XRF 020903 measurements. These samples included various GRBs, including one short GRB (GRB 050709; Hjorth et al., 2005; Villasenor et al., 2005; Fox et al., 2005) and one ultra-long GRB (GRB 130925A; Bellm et al., 2014; Piro et al., 2014; Evans et al., 2014). GRB 050709 is a classical short/hard GRB, but the optical properties of its host galaxy indicate star formation activity (Covino et al., 2006). GRB 130925A is also classified as an optically dark GRB because of its high visual extinction (Greiner et al., 2014). The revised redshift (Perley et al., 2017) is used for one of the optically dark GRBs, GRB 020819B for evaluating the observation targeted on the CO line. Two samples (GRB 090423 and GRB 130606A) may have occurred at the reionization epoch (e.g., Tanvir et al., 2009; Totani et al., 2014, 2016). The neutral fraction of the IGM measured using GRB 130606A implied the incompletion of reionization at (Totani et al., 2014, 2016). This higher redshift event also obeys the energy correlations established using low-redshift GRBs (Yasuda et al., 2017). Furthermore, we added two SLSNs (i.e., SN2017egm and PTF10tpz), as potential samples of identical stellar explosions by observing the GRB jet at an off-axis viewing angle (e.g., Nicholl et al., 2017; Wheeler et al., 2017; Coppejans et al., 2018).
These physical properties of the reference samples were obtained by reducing the ALMA archive data and from the literature. We used the products obtained from the ALMA archive for continuum observations, except for GRB 050709. These archive data were calibrated and imaged by the ALMA Regional Centers using standard procedures. Two execution blocks for GRB 050709 observations (Project code: 2016.1.01333.S) at the identical band (Band 6) were reduced separately. We reproduced the calibrated data, merged them, and then imaged them using TCLEAN. The total flux measurements and the RMS noise estimations for the nondetection cases were performed using function ”imfit” and ”imstat”, respectively. We confirmed that our continuum measurements were consistent with previous results (Wang et al., 2012; Huang et al., 2017; Berger et al., 2014; Hatsukade et al., 2020a). For Table 1, we referred to the detailed measurements made by Endo et al. (2007), Hatsukade et al. (2011), Wang et al. (2012), Berger et al. (2014), Hatsukade et al. (2014), Stanway et al. (2015), Huang et al. (2017), Michałowski et al. (2018), Arabsalmani et al. (2019), Hashimoto et al. (2019), Hatsukade et al. (2019), de Ugarte Postigo et al. (2020), Hatsukade et al. (2020a), and Hatsukade et al. (2020b).
4 IR Luminosity and Star Formation Rate (SFR) with GRB Host Galaxies
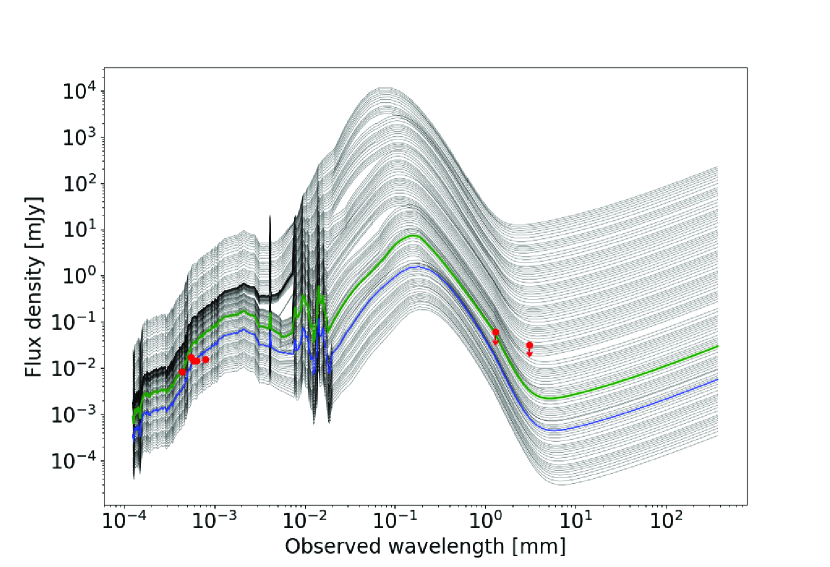
The ALMA continuum observations provided unique upper limits for estimating the rest-frame IR luminosity and SFR of GRB and XRF host galaxies. Based on Wang et al. (2012), a redshift to a template IR SED was applied to these results. We referred to the SED library provided by Chary & Elbaz (2001), which is luminosity-dependent ( to ) based on a locally calibrated luminosity-dust temperature relation and does not enable SED scaling. As shown in Figure 3, we constrained the 3 upper limits of IR luminosity for the XRF 020903 host galaxy with the Band 6 observation as . Moreover, the templates with are also consistent with optical flux measurements (the blue line in the Figure 3). In terms of the SED for describing optical measurements, we primarily used the HST measurement (Soderberg et al., 2004), because the ground-based multicolor measurements were affected by the nearby galaxies, as reported by Bersier et al. (2006). Using the SFR conversion of star-forming galaxies, SFR( yr (Kennicutt, 1998), we obtained the 3 upper limit of the SFR as ( yr-1). This estimation is consistent with the measurement (2.65 yr-1) using or rather small (Savaglio et al., 2009).
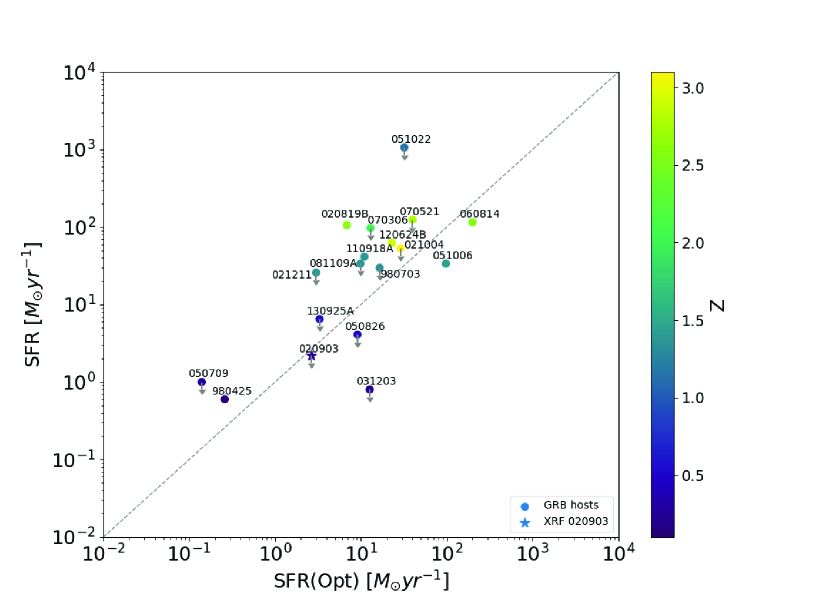
Similarly, we derived the and SFR for reference GRB samples (Table 1). Figure 4 shows a comparison between the estimated SFRs and those measured based on , [] or UV fluxes (Savaglio et al., 2009). The SFR estimation for the XRF 020903 host obtained using the method was one of the notable events that exhibited smaller values than the optical measurements, similar to GRB 031203 (), GRB 050826 (), GRB 051006 (), and GRB 060814 (). This result indicates that the low dust content of the GRB host galaxies. Because the lower optical depth of the dust tends to increase the SFR conversion coefficient (e.g., Buat & Xu, 1996; Kennicutt, 1998), an empirical calibration of SFR/ is required based on other physical parameters, such as stellar mass and metallicity.
5 Limit of Luminosity of CO and Molecular Gas
5.1 Molecular Gas Mass
The luminosity of CO was estimated based on the equation () described by Solomon and Vanden Bout (2005), where is in K km s-1 pc is the velocity-integrated intensity in Jy km s-1, is the observed line frequency in GHz, and is the luminosity distance in Mpc. Because the CO(1-0) line was not detected from the ALMA observation of the XRF 020903 host galaxy, we derived the upper limit of the CO luminosity by assuming a velocity width of 180 km s-1 (Table 1). The assumption of this velocity width is identical to that of nondetection samples reported by Hatsukade et al. (2020a).
The upper limit of the molecular gas mass of the XRF 020903 host galaxy was derived from , where is the CO-to-H2 conversion factor, including the contribution of the helium mass. We estimated the conversion factor by considering the dependency on the gas-phase metallicity and increasing as metallicity is decreased (e.g., Wilson 1995; Arimoto et al. 1996; Kennicutt & Evans 2012; Bolatto et al. 2013). The optical measurements indicate that all four regions of the XRF 020903 host galaxy are subsolar-metallicity (12+log(O/H)=8.1-8.3; Thorp & Levesque, 2018). In the low-metallicity range, the conversion factor estimation becomes difficult, because the estimation methods have not yet been established. For example, the empirical relations between metallicity and of Genzel et al. (2012) and Bolatto et al. (2013) differed. Therefore, we adopted the harmonic mean of the recipes of Genzel et al. (2012) and Bolatto et al. (2013), similar to Hatsukade et al. (2020a). The converted upper limits of the gas mass were with (K km s-1 pc2) for region A and with (K km s-1 pc2) for regions B, C, and D.
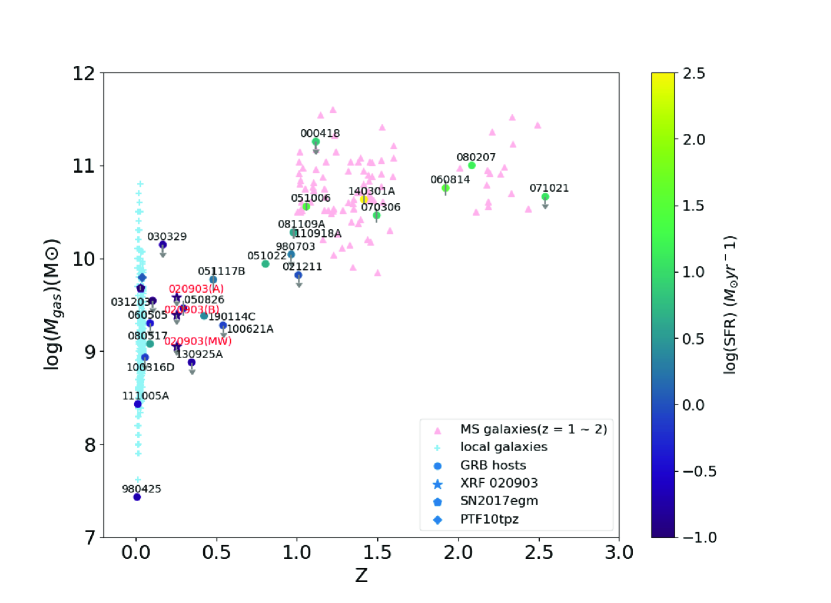
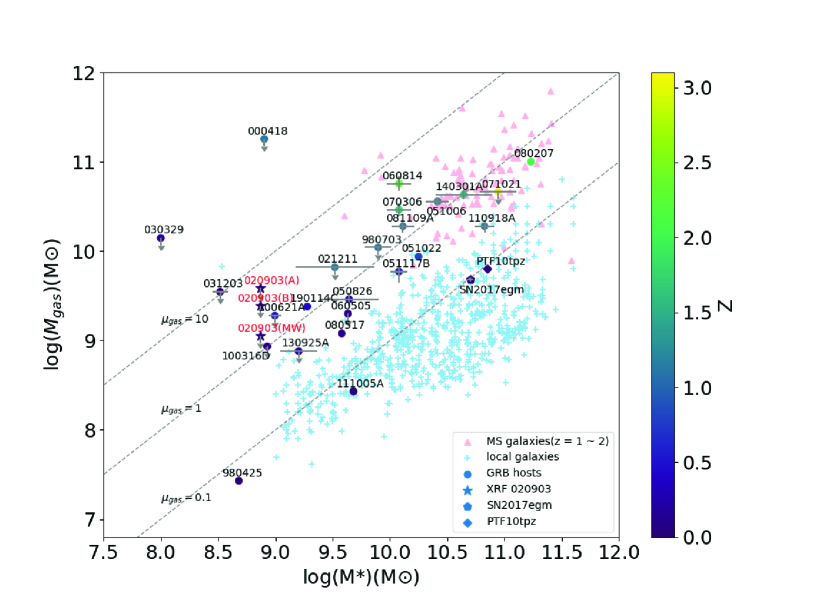
The smaller upper limit of was estimated by applying the galactic conversion factor of =4.4 (K km s-1 pc2; Bolatto et al., 2013). We compared the molecular gas mass of the XRF 020903 with other GRB and SLSN samples reported by Hatsukade et al. (2020a) as a function of redshift (Figure 5, top) and stellar mass (Figure 5, bottom). No violation was observed in the global trends of both the redshift and stellar mass. Additionally, we compared the local star-forming galaxies (Bothwell et al., 2014; Saintonge et al., 2017) and main-sequence galaxies at (Daddi et al., 2010; Magdis et al., 2012; Magnelli et al., 2012; Tacconi et al., 2013; Seko et al., 2016). The upper limit of was consistent with those of local galaxies, in addition to the redshift. A comparable sample in the same stellar mass range did not exist. The limits for the hosts of XRF 020903 is lower than the gas mass fractions for the most gas-rich galaxies and some GRB hosts.
5.2 Molecular Gas Mass-SFR, Gas Fraction, and Depletion Timescale
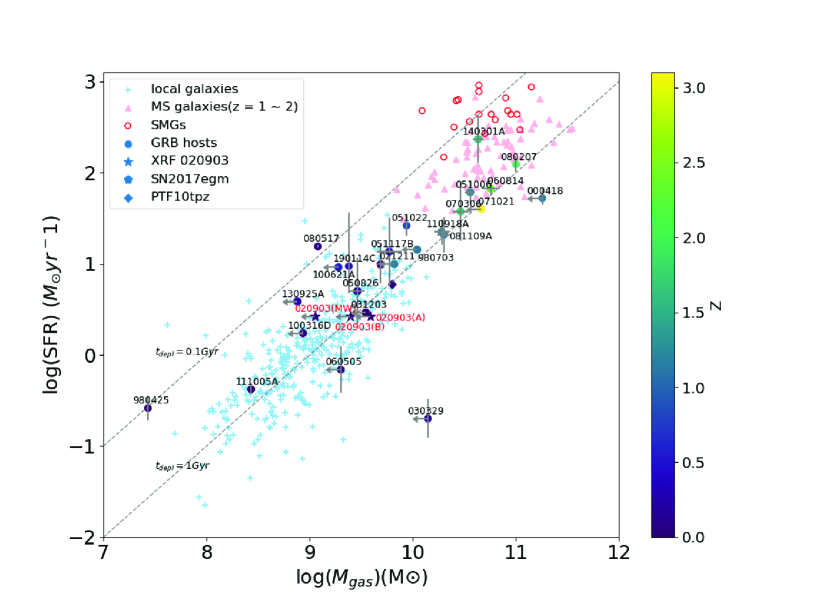
The gas surface density was correlated to the SFR surface density, which is known as the Kennicutt-Schmidt relation (Schmidt, 1959). The integration over the source region indicated a correlation between and the SFR. Figure 6 shows the relationship between the GRB host galaxies and the target. The SFR of XRF 020903 estimated using the line as 2.65 yr-1 (Savaglio et al., 2009), was used. Three upper limits of for XRF 020903 (burst site as A, remaining regions representative as B, and the value estimated with the galactic conversion factor as MW) were plotted, because the conversion factor of CO-to-H2 depends on the metallicity, as described in . The GRB samples were those of Hatsukade et al. (2020a), who employed the SED fitting method to estimate the SFRs. The upper limit of the molecular gas mass of XRF 020903 indicates that the current event reflects the trend of GRB host galaxies. Additionally, we compared the local star-forming galaxies (Bothwell et al., 2014; Saintonge et al., 2017) and main-sequence galaxies at (Tacconi et al., 2013; Seko et al., 2016). The upper limit of XRF 020903 was consistent with that of the local star-forming galaxies. When we adopted the galactic conversion factor of =4.4 (K km s-1 pc2), the limit indicated that the XRF 020903 host galaxy was at the smallest end in the same SFR range.
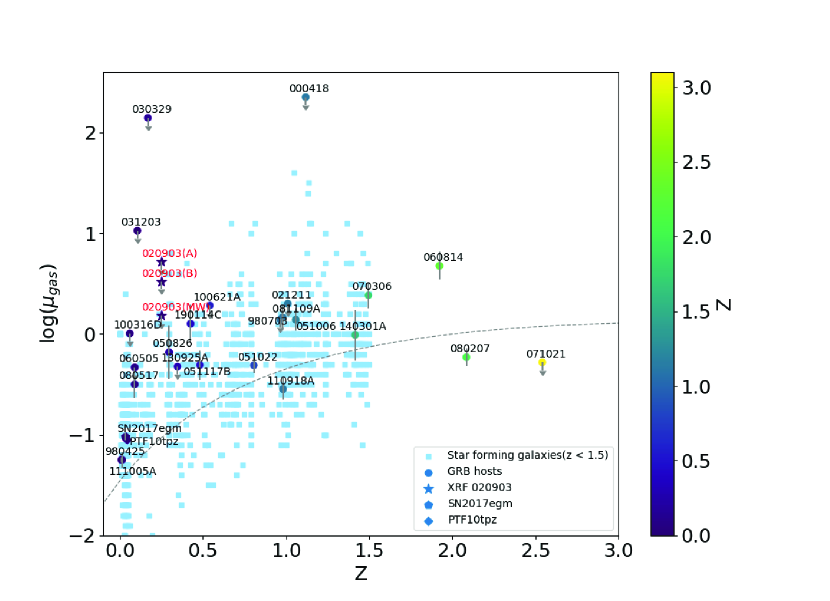
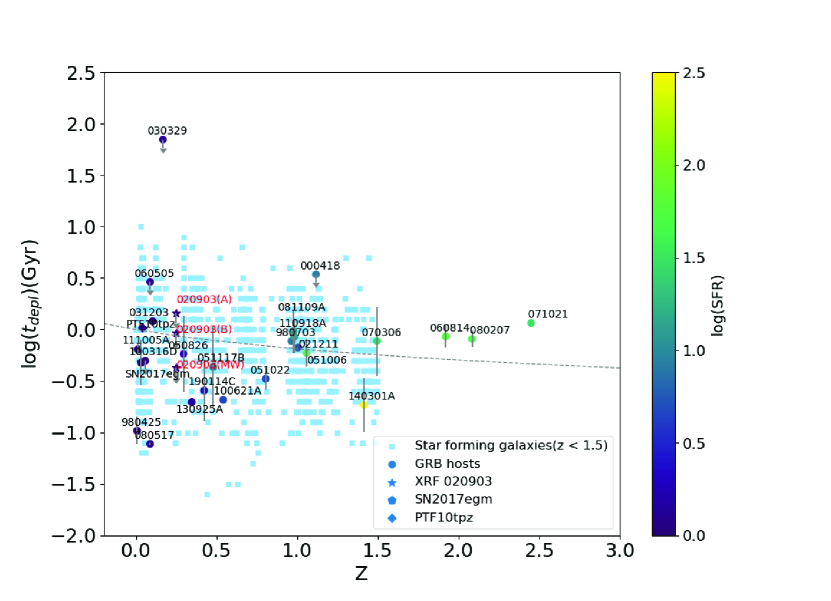
The majority of the GRB host galaxies were located on the molecular gas depletion timescale (=/SFR) of 1 Gyr, whereas some hosts with lower redshift had a shorter gas depletion timescale (Figure 6). Hatsukade et al. (2020a) reported that GRB host galaxies tend to possess a higher molecular gas mass fraction () and a shorter gas depletion timescale () than other star-forming galaxies at similar redshifts, particularly at . Figure 7 shows and as a function of redshift. The lines in Figure 7 indicate the best-fit function of star-forming galaxies derived by Tacconi et al. (2018). For comparison, the distribution of the star-forming galaxies (Saintonge et al., 2017; Tacconi et al., 2018) is shown. Although the upper limit of could not constrain the trend effectively, the limit of was consistent with the results of most of GRB samples (e.g., GRB 980703, GRB 021211, GRB 031203, GRB 050826, GRB 060814, GRB 070306, GRB 071021, GRB 081109A, GRB 110918A), and one of SLSN, PTF10tpz. As the upper limits were close to the best-fitted function of the star-forming galaxies, the depletion time, was consistent with or rather lower than the average of star-forming galaxies.
6 Summary
Results of the ALMA dust continuum and CO observations of the XRF 020903 host galaxy were reported herein. The continuum observation provided the upper limit of the IR luminosity based on the template scaling method. The corresponding SFR yr-1 was consistent with the measurement using the emission line or rather small. Based on the CO observation, for the burst site by applying the metallicity-dependent CO-to-H2 conversion factor. The gas mass matched with the global trend of the GRB host galaxies, in addition to the redshift and stellar mass. As one of the potential common properties of GRB host galaxies, we confirmed that the gas depletion timescale is equivalent to those of the GRBs and SLSNs at the same redshift range (i.e., GRB 031203, GRB 050826, and PTF10tpz). These results indicate the similar properties of the XRF 020903 host galaxy to those of GRB host galaxies and supports the identical origins of XRF 020903 and GRBs.
| Event | Redshift | Frequency | Flux | LIR | SFR | CO Luminosity | Gas Mass | Reference |
|---|---|---|---|---|---|---|---|---|
| (GHz) | (mJy) | () | ( yr-1) | (K km s) | () | |||
| GRB 980425 | 0.0085 | 106.8 | 0.770.26 | 0.60 | Michałowski et al. (2018) | |||
| GRB 980703 | 0.966 | 234.5 | 0.081 | 29.7 | Hatsukade et al. (2020a) | |||
| GRB 000418 | 1.1183 | Hatsukade et al. (2011) | ||||||
| GRB 020819B | 1.9621 | 245.1 | 0.140.03 | 105.9 | Hatsukade et al. (2014) | |||
| XRF 020903 | 0.251 | 97.2 | 0.032 | 21.7 | This work | |||
| 233.0 | 0.061 | 2.21 | This work | |||||
| GRB 021004 | 2.330 | 345.0 | 0.354 | 53.1 | Wang et al. (2012) | |||
| GRB 021211 | 1.010 | 229.8 | 0.063 | 25.8 | Hatsukade et al. (2020a) | |||
| GRB 030329 | 0.1685 | Endo et al. (2007) | ||||||
| GRB 031203 | 0.105 | 312.8 | 2.410 | 0.8 | Hatsukade et al. (2020a) | |||
| GRB 050401 | 2.900 | 343.5 | 0.67 | 124.2 | This work | |||
| GRB 050709 | 0.1606 | 233.0 | 0.05 | 1.0 | This work | |||
| GRB 050826 | 0.296 | 266.8 | 0.084 | 4.1 | Hatsukade et al. (2020a) | |||
| GRB 050915A | 2.527 | 343.5 | 0.370.13 | 69.5 | This work | |||
| GRB 051006 | 1.059 | 223.9 | 0.0780.024 | 33.8 | Hatsukade et al. (2020a) | |||
| GRB 051022 | 0.806 | 256.1 | 1.6 | 1062 | Hatsukade et al. (2014) | |||
| GRB 051117B | 0.481 | 225.3 | 0.0690.020 | 13.7 | Hatsukade et al. (2020a) | |||
| GRB 060505 | 0.089 | Michałowski et al. (2018) | ||||||
| GRB 060814 | 1.923 | 343.5 | 0.063 | 115.1 | Hatsukade et al. (2020a) | |||
| GRB 070306 | 1.496 | 343.5 | 0.036 | 96.8 | Hatsukade et al. (2020a) | |||
| GRB 070521 | 2.087 | 680.0 | 3.12 | 124.2 | Hashimoto et al. (2019) | |||
| GRB 070802 | 2.450 | 343.5 | 0.300.11 | 49.0 | This work | |||
| GRB 071021 | 2.542 | 133.6 | 0.042 | 115.1 | Hatsukade et al. (2020a) | |||
| GRB 080207 | 2.086 | 142.5 | 0.110.03 | 417.5 | Hatsukade et al. (2019) | |||
| GRB 080517 | 0.0889 | Stanway et al. (2015) | ||||||
| GRB 081109A | 0.979 | 233.0 | 0.087 | 33.8 | Hatsukade et al. (2020a) | |||
| GRB 081221 | 2.260 | 343.5 | 0.880.09 | 192.5 | This work | |||
| GRB 090423 | 8.230 | 222.0 | 0.036 | 7.6 | Berger et al. (2014) | |||
| GRB 100316D | 0.059 | Michałowski et al. (2018) | ||||||
| GRB 100621A | 0.542 | 224.3 | 0.066 | 9.8 | Hatsukade et al. (2020a) | |||
| GRB 110918A | 0.982 | 232.3 | 0.0970.020 | 41.4 | Hatsukade et al. (2020a) | |||
| GRB 111005A | 0.013 | Michałowski et al. (2018) | ||||||
| GRB 111123A | 3.152 | 343.5 | 0.960.10 | 192.5 | This work | |||
| GRB 120624B | 2.197 | 343.5 | 0.350.12 | 62.5 | This work | |||
| GRB 130606A | 5.913 | 265.0 | 0.354 | 96.8 | This work | |||
| GRB 130925A | 0.347 | 256.5 | 0.096 | 6.5 | Hatsukade et al. (2020a) | |||
| GRB 131030 | 1.293 | 345.0 | 0.12 | 11.1 | Huang et al. (2017) | |||
| GRB 140301A | 1.416 | 143.2 | 0.039 | 96.8 | Hatsukade et al. (2020a) | |||
| GRB 190114C | 0.425 | de Ugarte Postigo et al. (2020) | ||||||
| SN2017egm | 0.031 | Hatsukade et al. (2020b) | ||||||
| PTF10tpz | 0.040 | Arabsalmani et al. (2019) |
(v4.7.0-1; McMullin et al., 2007)
References
- Alexander et al. (2017) Alexander, K. D., Berger, E., Fong, W., et al. 2017, ApJ, 848, L21
- Amati et al. (2018) Amati, L., O’Brien, P., Götz, D., et al. 2018, Advances in Space Research, 62, 191. doi:10.1016/j.asr.2018.03.010
- Arabsalmani et al. (2019) Arabsalmani, M., Roychowdhury, S., Renaud, F., et al. 2019, ApJ, 882, 31. doi:10.3847/1538-4357/ab2897
- Arabsalmani et al. (2020) Arabsalmani, M., Renaud, F., Roychowdhury, S., et al. 2020, ApJ, 899, 165. doi:10.3847/1538-4357/aba3c0
- Arimoto et al. (1996) Arimoto, N., Sofue, Y., & Tsujimoto, T. 1996, PASJ, 48, 275. doi:10.1093/pasj/48.2.275
- Bellm et al. (2014) Bellm, E. C., Barrière, N. M., Bhalerao, V., et al. 2014, ApJ, 784, L19. doi:10.1088/2041-8205/784/2/L19
- Berger et al. (2014) Berger, E., Zauderer, B. A., Chary, R.-R., et al. 2014, ApJ, 796, 96. doi:10.1088/0004-637X/796/2/96
- Bersier et al. (2006) Bersier, D., Fruchter, A. S., Strolger, L.-G., et al. 2006, ApJ, 643, 284. doi:10.1086/502640
- Bolatto et al. (2013) Bolatto, A. D., Warren, S. R., Leroy, A. K., et al. 2013, Nature, 499, 450. doi:10.1038/nature12351
- Bolatto et al. (2013) Bolatto, A. D., Wolfire, M., & Leroy, A. K. 2013, ARA&A, 51, 207. doi:10.1146/annurev-astro-082812-140944
- Bothwell et al. (2013) Bothwell, M. S., Smail, I., Chapman, S. C., et al. 2013, MNRAS, 429, 3047. doi:10.1093/mnras/sts562
- Bothwell et al. (2014) Bothwell, M. S., Wagg, J., Cicone, C., et al. 2014, MNRAS, 445, 2599. doi:10.1093/mnras/stu1936
- Buat & Xu (1996) Buat, V. & Xu, C. 1996, A&A, 306, 61
- Chary & Elbaz (2001) Chary, R., & Elbaz, D. 2001, ApJ, 556, 562
- Chen et al. (2020) Chen, W. J., Urata, Y., Huang, K., et al. 2020, ApJ, 891, L15. doi:10.3847/2041-8213/ab76d4
- Coppejans et al. (2018) Coppejans, D. L., Margutti, R., Guidorzi, C., et al. 2018, ApJ, 856, 56. doi:10.3847/1538-4357/aab36e
- Covino et al. (2006) Covino, S., Malesani, D., Israel, G. L., et al. 2006, A&A, 447, L5. doi:10.1051/0004-6361:200500228
- Daddi et al. (2010) Daddi, E., Bournaud, F., Walter, F., et al. 2010, ApJ, 713, 686. doi:10.1088/0004-637X/713/1/686
- de Ugarte Postigo et al. (2020) de Ugarte Postigo, A., Thöne, C. C., Martín, S., et al. 2020, A&A, 633, A68. doi:10.1051/0004-6361/201936668
- Endo et al. (2007) Endo, A., Kohno, K., Hatsukade, B., et al. 2007, ApJ, 659, 1431. doi:10.1086/512764
- Evans et al. (2014) Evans, P. A., Willingale, R., Osborne, J. P., et al. 2014, MNRAS, 444, 250. doi:10.1093/mnras/stu1459
- Fox et al. (2005) Fox, D. B., Frail, D. A., Price, P. A., et al. 2005, Nature, 437, 845. doi:10.1038/nature04189
- Gal-Yam et al. (2006) Gal-Yam, A., Ofek, E. O., Poznanski, D., et al. 2006, ApJ, 639,
- Genzel et al. (2012) Genzel, R., Tacconi, L. J., Combes, F., et al. 2012, ApJ, 746, 69. doi:10.1088/0004-637X/746/1/69
- Godet et al. (2012) Godet, O., Paul, J., Wei, J. Y., et al. 2012, Proc. SPIE, 8443, 84431O. doi:10.1117/12.925171
- Greiner et al. (2000) Greiner, J., Hartmann, D. H., Voges, W., et al. 2000, A&A, 353, 998
- Greiner et al. (2014) Greiner, J., Yu, H.-F., Krühler, T., et al. 2014, A&A, 568, A75. doi:10.1051/0004-6361/201424250
- Grindlay (1999) Grindlay, J. E. 1999, ApJ, 510, 710
- Haggard et al. (2017) Haggard, D., Nynka, M., Ruan, J. J., et al. 2017, ApJ, 848, L25
- Hammer et al. (2006) Hammer, F., Flores, H., Schaerer, D., et al. 2006, A&A, 454, 103. doi:10.1051/0004-6361:20064823
- Han et al. (2010) Han, X. H., Hammer, F., Liang, Y. C., et al. 2010, A&A, 514, A24. doi:10.1051/0004-6361/200912475
- Hashimoto et al. (2019) Hashimoto, T., Hatsukade, B., Goto, T., et al. 2019, MNRAS, 488, 5029. doi:10.1093/mnras/stz2034
- Hatsukade et al. (2011) Hatsukade, B., Kohno, K., Endo, A., et al. 2011, ApJ, 738, 33. doi:10.1088/0004-637X/738/1/33
- Hatsukade et al. (2014) Hatsukade, B., Ohta, K., Endo, A., et al. 2014, Nature, 510, 247. doi:10.1038/nature13325
- Hatsukade et al. (2019) Hatsukade, B., Hashimoto, T., Kohno, K., et al. 2019, ApJ, 876, 91. doi:10.3847/1538-4357/ab1649
- Hatsukade et al. (2020a) Hatsukade, B., Ohta, K., Hashimoto, T., et al. 2020, ApJ, 892, 42. doi:10.3847/1538-4357/ab7992
- Hatsukade et al. (2020b) Hatsukade, B., Morokuma-Matsui, K., Hayashi, M., et al. 2020, PASJ, 72, L6. doi:10.1093/pasj/psaa052
- Heise et al. (2001) Heise, J., Zand, J. I., Kippen, R. M., et al. 2001, Gamma-ray Bursts in the Afterglow Era, 16. doi:10.1007/10853853_4
- Heise (2003) Heise, J. 2003, Gamma-Ray Burst and Afterglow Astronomy 2001: A Workshop Celebrating the First Year of the HETE Mission, 662, 229
- Hjorth et al. (2005) Hjorth, J., Watson, D., Fynbo, J. P. U., et al. 2005, Nature, 437, 859. doi:10.1038/nature04174
- Huang et al. (2002) Huang, Y. F., Dai, Z. G., & Lu, T. 2002, MNRAS, 332, 735
- Huang et al. (2017) Huang, K., Urata, Y., Takahashi, S., et al. 2017, PASJ, 69, 20
- Huang et al. (2019) Huang, K., Shimoda, J., Urata, Y., et al. 2019, ApJ, 878, L25. doi:10.3847/2041-8213/ab23fd
- Huang et al. (2020) Huang, Y.-J., Urata, Y., Huang, K., et al. 2020, ApJ, 897, 69. doi:10.3847/1538-4357/ab8f9a
- Ioka, & Nakamura (2018) Ioka, K., & Nakamura, T. 2018, Progress of Theoretical and Experimental Physics, 2018, 043E02
- Izzo et al. (2019) Izzo, L., de Ugarte Postigo, A., Maeda, K., et al. 2019, Nature, 565, 324. doi:10.1038/s41586-018-0826-3
- Izzo et al. (2020) Izzo, L., Auchettl, K., Hjorth, J., et al. 2020, A&A, 639, L11. doi:10.1051/0004-6361/202038152
- Jin et al. (2018) Jin, Z.-P., Li, X., Wang, H., et al. 2018, ApJ, 857, 128
- Kathirgamaraju et al. (2018) Kathirgamaraju, A., Barniol Duran, R., & Giannios, D. 2018, MNRAS, 473, L121
- Kennicutt & Evans (2012) Kennicutt, R. C. & Evans, N. J. 2012, ARA&A, 50, 531. doi:10.1146/annurev-astro-081811-125610
- Kennicutt (1998) Kennicutt, R. C., Jr. 1998, ARA&A, 36, 189
- Kippen et al. (2002) Kippen, R. M., Woods, P. M., Heise, J., et al. 2002, APS April Meeting Abstracts
- Lamb & Kobayashi (2018) Lamb, G. P., & Kobayashi, S. 2018, MNRAS, 478, 733
- Lamb et al. (2005) Lamb, D. Q., Donaghy, T. Q., & Graziani, C. 2005, ApJ, 620, 355. doi:10.1086/426099
- Lamb et al. (2019) Lamb, G. P., Lyman, J. D., Levan, A. J., et al. 2019, ApJ, 870, L15
- Law et al. (2018) Law, C. J., Gaensler, B. M., Metzger, B. D., et al. 2018, ApJ, 866, L22
- Lazzati et al. (2017) Lazzati, D., López-Cámara, D., Cantiello, M., et al. 2017, ApJ, 848, L6
- Levesque et al. (2010) Levesque, E. M., Berger, E., Kewley, L. J., et al. 2010, AJ, 139, 694. doi:10.1088/0004-6256/139/2/694
- Levinson et al. (2002) Levinson, A., Ofek, E. O., Waxman, E., et al. 2002, ApJ, 576, 923
- Lyman et al. (2018) Lyman, J. D., Lamb, G. P., Levan, A. J., et al. 2018, NatAs, 2, 751
- Magdis et al. (2012) Magdis, G. E., Daddi, E., Béthermin, M., et al. 2012, ApJ, 760, 6. doi:10.1088/0004-637X/760/1/6
- Magnelli et al. (2012) Magnelli, B., Saintonge, A., Lutz, D., et al. 2012, A&A, 548, A22. doi:10.1051/0004-6361/201220074
- Marcote et al. (2019) Marcote, B., Nimmo, K., Salafia, O. S., et al. 2019, ApJ, 876, L14
- McMullin et al. (2007) McMullin, J. P., Waters, B., Schiebel, D., Young, W., & Golap, K. 2007, adass, 376, 127
- Michałowski et al. (2018) Michałowski, M. J., Karska, A., Rizzo, J. R., et al. 2018, A&A, 617, A143. doi:10.1051/0004-6361/201833250
- Murguia-Berthier et al. (2017) Murguia-Berthier, A., Ramirez-Ruiz, E., Kilpatrick, C. D., et al. 2017, ApJ, 848, L34
- Nicholl et al. (2017) Nicholl, M., Berger, E., Margutti, R., et al. 2017, ApJ, 845, L8. doi:10.3847/2041-8213/aa82b1
- Pastorello et al. (2010) Pastorello, A., Smartt, S. J., Botticella, M. T., et al. 2010, ApJ, 724, L16. doi:10.1088/2041-8205/724/1/L16
- Perley et al. (2017) Perley, D. A., Krühler, T., Schady, P., et al. 2017, MNRAS, 465, L89. doi:10.1093/mnrasl/slw221
- Piro et al. (2014) Piro, L., Troja, E., Gendre, B., et al. 2014, ApJ, 790, L15. doi:10.1088/2041-8205/790/2/L15
- Racusin et al. (2009) Racusin, J. L., Liang, E. W., Burrows, D. N., et al. 2009, ApJ, 698, 43
- Rau et al. (2006) Rau, A., Greiner, J., & Schwarz, R. 2006, A&A, 449, 79
- Saintonge et al. (2017) Saintonge, A., Catinella, B., Tacconi, L. J., et al. 2017, ApJS, 233, 22. doi:10.3847/1538-4365/aa97e0
- Sakamoto et al. (2004) Sakamoto, T., Lamb, D. Q., Graziani, C., et al. 2004, ApJ, 602, 875
- Sakamoto et al. (2005) Sakamoto, T., Lamb, D. Q., Kawai, N., et al. 2005, ApJ, 629, 311. doi:10.1086/431235
- Savaglio et al. (2009) Savaglio, S., Glazebrook, K., & Le Borgne, D. 2009, ApJ, 691, 182. doi:10.1088/0004-637X/691/1/182
- Schmidt (1959) Schmidt, M. 1959, ApJ, 129, 243. doi:10.1086/146614
- Seko et al. (2016) Seko, A., Ohta, K., Yabe, K., et al. 2016, ApJ, 819, 82. doi:10.3847/0004-637X/819/1/82
- Shirasaki et al. (2003) Shirasaki, Y., Kawai, N., Yoshida, A., et al. 2003, PASJ, 55, 1033. doi:10.1093/pasj/55.5.1033
- Soderberg et al. (2004) Soderberg, A. M., Kulkarni, S. R., Berger, E., et al. 2004, ApJ, 606, 994
- Soderberg et al. (2005) Soderberg, A. M., Kulkarni, S. R., Fox, D. B., et al. 2005, ApJ, 627, 877. doi:10.1086/430405
- Solomon and Vanden Bout (2005) Solomon, P. M. & Vanden Bout, P. A. 2005, ARA&A, 43, 677. doi:10.1146/annurev.astro.43.051804.102221
- Stanway et al. (2015) Stanway, E. R., Levan, A. J., Tanvir, N. R., et al. 2015, ApJ, 798, L7. doi:10.1088/2041-8205/798/1/L7
- Tacconi et al. (2013) Tacconi, L. J., Neri, R., Genzel, R., et al. 2013, ApJ, 768, 74. doi:10.1088/0004-637X/768/1/74
- Tacconi et al. (2018) Tacconi, L. J., Genzel, R., Saintonge, A., et al. 2018, ApJ, 853, 179. doi:10.3847/1538-4357/aaa4b4
- Tanvir et al. (2009) Tanvir, N. R., Fox, D. B., Levan, A. J., et al. 2009, Nature, 461, 1254. doi:10.1038/nature08459
- Thorp & Levesque (2018) Thorp, M. D. & Levesque, E. M. 2018, ApJ, 856, 36. doi:10.3847/1538-4357/aab093
- Totani et al. (2014) Totani, T., Aoki, K., Hattori, T., et al. 2014, PASJ, 66, 63. doi:10.1093/pasj/psu032
- Totani et al. (2016) Totani, T., Aoki, K., Hattori, T., et al. 2016, PASJ, 68, 15. doi:10.1093/pasj/psv123
- Troja et al. (2018) Troja, E., Piro, L., Ryan, G., et al. 2018, MNRAS, 478, L18
- Troja et al. (2019) Troja, E., van Eerten, H., Ryan, G., et al. 2019, MNRAS, 489, 1919
- Urata et al. (2015) Urata, Y., Huang, K., Yamazaki, R., & Sakamoto, T. 2015, ApJ, 806, 222
- Urata et al. (2019) Urata, Y., Toma, K., Huang, K., et al. 2019, ApJ, 884, L58
- Villasenor et al. (2005) Villasenor, J. S., Lamb, D. Q., Ricker, G. R., et al. 2005, Nature, 437, 855. doi:10.1038/nature04213
- Wang et al. (2012) Wang, W.-H., Chen, H.-W., & Huang, K.-Y. 2012, ApJ, 761, L32. doi:10.1088/2041-8205/761/2/L32
- Wheeler et al. (2017) Wheeler, J. C., Chatzopoulos, E., Vinkó, J., et al. 2017, ApJ, 851, L14. doi:10.3847/2041-8213/aa9d84
- Wilson (1995) Wilson, C. D. 1995, ApJ, 448, L97. doi:10.1086/309615
- Yamazaki et al. (2002) Yamazaki, R., Ioka, K., & Nakamura, T. 2002, ApJ, 571, L31
- Yasuda et al. (2017) Yasuda, T., Urata, Y., Enomoto, J., et al. 2017, MNRAS, 466, 4558. doi:10.1093/mnras/stw3130
- Yonetoku et al. (2020) Yonetoku, D., Mihara, T., Doi, A., et al. 2020, Proc. SPIE, 11444, 114442Z. doi:10.1117/12.2560603
- Zhang et al. (2004) Zhang, B., Dai, X., Lloyd-Ronning, N. M., & Mészáros, P. 2004, ApJ, 601, L119