On the Validity of Arrest as a Proxy for Offense:
Race and the Likelihood of Arrest for Violent Crimes
Abstract.
The risk of re-offense is considered in decision-making at many stages of the criminal justice system, from pre-trial, to sentencing, to parole. To aid decision makers in their assessments, institutions increasingly rely on algorithmic risk assessment instruments (RAIs). These tools assess the likelihood that an individual will be arrested for a new criminal offense within some time window following their release. However, since not all crimes result in arrest, RAIs do not directly assess the risk of re-offense. Furthermore, disparities in the likelihood of arrest can potentially lead to biases in the resulting risk scores. Several recent validations of RAIs have therefore focused on arrests for violent offenses, which are viewed as being more accurate reflections of offending behavior. In this paper, we investigate biases in violent arrest data by analysing racial disparities in the likelihood of arrest for White and Black violent offenders. We focus our study on 2007–2016 incident-level data of violent offenses from 16 US states as recorded in the National Incident Based Reporting System (NIBRS). Our analysis shows that the magnitude and direction of the racial disparities depend on various characteristics of the crimes. In addition, our investigation reveals large variations in arrest rates across geographical locations and offense types. We discuss the implications of the observed disconnect between re-arrest and re-offense in the context of RAIs and the challenges around the use of data from NIBRS to correct for the sampling bias.
1. Introduction
††Accepted at AAAI/ACM Conference on Artificial Intelligence, Ethics, and Society (AIES), 2021.Recidivism risk assessment instruments (RAIs) are increasingly used to inform decisions throughout the criminal justice system (Metz and Satariano, 2020). To justify their adoption, practitioners, vendors, and scholars often claim that the use of RAIs can lead to more objective, transparent, and fair decisions (Kleinberg et al., 2018; Goel et al., 2018; Mullainathan, 2019). However, the ability of RAIs to help achieve these ambitious goals has been contested (Barabas et al., 2018; Green, 2020). A major concern is that the RAIs themselves may exhibit problematic predictive biases. In May 2016, an investigation by ProPublica examined COMPAS, an RAI used in Broward County, Florida, finding that the tool’s predictions exhibited a higher false positive rate for Black (vs. White) defendants and thus concluding that COMPAS was biased against Black defendants (Angwin et al., 2016). Critics rebutted these claims, arguing that error rate imbalance did not necessarily indicate racial bias and that RAIs should be assessed for predictive parity and calibration, two properties that COMPAS satisfied (Flores et al., 2016; Dieterich et al., 2016). Later work on the topic showed that predictive parity and error rate balance cannot be simultaneously satisfied when the recidivism rates differ across demographic groups (Chouldechova, 2017; Kleinberg et al., 2016; Corbett-Davies et al., 2017), sparking a flurry of technical research on algorithmic fairness within the machine learning community. These papers, many of which draw on the ProPublica-COMPAS dataset, tend to focus on metrics for capturing bias, techniques for mitigating bias as measured by these metrics, and characterizing fundamental tradeoffs (Hardt et al., 2016; Berk et al., 2017; Donini et al., 2018; Agarwal et al., 2018; Johndrow et al., 2019; Celis et al., 2019).
Problematically, much of this work rests on the assumption that the observed outcomes (a.k.a. dependent variables) represent ground truth. Potential sources of bias in the training data are often overlooked. For example, many bias mitigation strategies amount to equalizing the RAI’s performance across racial groups with respect to some metric based on re-arrest outcomes. However, it is widely acknowledged that arrest data are affected by sampling bias111Sampling bias arises when not all elements of the population of interest are equally likely to be sampled. In the presence of sampling bias, the characteristics of the collected sample of observations, which is said to be affected by “sample bias”, are not representative of the characteristics of the population from which the sample is drawn. (Brame et al., 2004) and re-arrest may represent an imperfect proxy for the target of interest, re-offense. Importantly, there is ample evidence that racial minorities tend to face higher risk of arrest, especially for crimes targeted through proactive policing, such as drug and traffic offenses (Lum and Isaac, 2016; Goel et al., 2016; Pierson et al., 2020). Thus, individuals with the same probability of re-offense may nevertheless have different probabilities of re-arrest. RAIs trained on such data may appear to be fair predictors of re-arrest but nevertheless be unfair, even by the same metrics, were they to be assessed on re-offense (Fogliato et al., 2020).
In recognition of this potential discrepancy, recent work on model validation has primarily examined the predictive bias of RAIs as predictors of re-arrest for violent crimes. Such arrests are viewed as representing “the most unbiased criterion [of offense] available” (Skeem and Lowenkamp, 2016). Beck and Blumstein (2018), for instance, concluded that statistics based on arrests for violent offenses could be an (almost) racially-unbiased proxy of criminal involvement. These arguments are generally premised upon three central pieces of evidence (Walsh, 2004). First, the racial composition of violent offenders recorded in victimization reports roughly matches that reported in arrest data (Hindelang, 1978; Tonry, 1995; Beck and Blumstein, 2018). Second, several analyses of violent offenses known to law enforcement have found that Black offenders are arrested at lower rates than White offenders (D’Alessio and Stolzenberg, 2003; Pope and Snyder, 2003). Third, unlike in the case of lower level crimes, in the case of violent crimes police are granted much more limited discretion on whether to make an arrest.
This body of evidence suggests that, overall, White violent offenders are at least as likely as Black violent offenders to be arrested, and hence that the overrepresentation of Blacks among arrestees is attributable to differential involvement in offending. The cited evidence does not, however, indicate that all offenses are equally likely to result in arrests, i.e., that, conditional on situational and contextual factors, the likelihood of arrest is equal across racial groups. In absence of such evidence, it remains unclear whether re-arrest outcomes could be considered a reliable proxy for re-offense.
In this paper, we show that the likelihood of arrest for violent crimes varies with the characteristics of the offense, including the offender’s race. Our analysis is based on incident-level data of violent offenses involving lone victims and offenders as reported by police agencies to the FBI in 16 US states between 2007 and 2016 through the National Incident Based Reporting System (NIBRS), a national crime data collection program. We focus on incidents involving only Black or White victims and offenders.
We find that arrest rates vary substantially across offense types and geographical locations. Controlling for the state, White and Black offenders are arrested at similar rates for crimes of forcible rape and murder. For assaults and robbery, however, arrest rates are generally higher for White offenders. This counterintuitive pattern is largely explained by the lower arrest rates in jurisdictions with larger shares of Black offenders. We offer two potential explanations for these findings. First, consistent with the hypothesis of benign neglect and based on a perspective of victim devaluing, fewer policing resources are allocated to solving the least serious forms of violent crimes that involve Black victims. Second, due to higher levels of legal cynicism, which can be traced back to a history of over-policing and systemic discrimination, Black communities may be less likely to cooperate with law enforcement. Through a regression analysis, we assess whether the observed racial disparities in the likelihood of arrest can be explained by crimes characteristics. Due to the (perhaps unavoidable) misspecification of our modeling approach, the strength and direction of the association between the offender’s race and the likelihood of arrest depend on the sample of crimes that is considered. These findings indicate that simple models targeting the “effect” of race, which have been used in a plethora of studies like ours, may not fully capture the complexities of the role of race in arrests.
The large variations in the likelihood of arrest across crimes characteristics, namely geographical areas and offense types, together with the presence of racial disparities, call into question the reliability of arrests as a proxy for violent offending. We discuss how the sampling biases observed in the data can affect the training and assessment of RAIs, leading to the severe underestimation of the probability of re-offense for certain subgroups of offenders (e.g., sex offenders). Finally, we discuss why the observed sampling bias cannot be corrected using data from NIBRS alone.
2. Background
Prior research studying racial disparities in the likelihood of arrest for violent offenses has generally fallen into two broad categories: (i) macro-level analyses studying the relationship between arrest rates and geographical or socioeconomic factors; and (ii) micro-level analyses examining associations between between the likelihood of arrest and the characteristics of the incident and parties involved.
Macro-level studies of the likelihood of arrest tend to fall into one of two (not mutually exclusive) theoretical frameworks: minority threat and benign neglect. The minority threat hypothesis (Blalock, 1967; Kirk and Matsuda, 2011) asserts that the majority group (Whites) attempts to control the minority group (e.g., Blacks) by imposing stronger formal mechanisms of social control, such as policing. According to this theory, we might expect to observe a positive association between the share of Black residents in an area and the size of the police force and arrest rates. The correlation between these factors may be weaker when interactions between the majority and the minority are limited, such as in regions where racial segregation is strongest (Stults and Baumer, 2007). The benign neglect hypothesis (Liska and Chamlin, 1984) posits that, as the size of the Black population grows, rates of intraracial crime are likely to increase as well. Whites may then weaken the mechanisms of social control on the Black population in racially segregated neighborhoods through a reduction in policing resources. As a result, Black victims would face difficulties in legitimating their complaints and convincing police officers to take action (Wilson, 1978). Under this hypothesis, we might expect arrest rates to be lower in predominantly Black neighborhoods. The two frameworks emphasize different socioeconomic drivers of differential arrest: While the minority threat hypothesis focuses on the role of race as a threat (be it economical or political), the benign neglect hypothesis emphasizes the devaluation of Black victims. Both hypotheses have received mixed empirical support (Ousey and Lee, 2008). The size of the police force has been shown to be positively associated with the share of Black population in the area (Kent and Jacobs, 2005; Stults and Baumer, 2007). Kent and Jacobs (2005) found that the most highly racially segregated cities with larger Black populations tend to have smaller police forces, whereas Stults and Baumer (2007) reported a positive association between the level of racial segregation and the size of police forces. Other studies have reported that arrest rates for Black offenders are negatively associated with the share of Black residents in the city (Parker et al., 2005), negatively associated with the level of racial segregation (Liska et al., 1985; Stolzenberg et al., 2004), and positively associated with the share of interracial crime (Eitle et al., 2002). Arrest rates for homicide have been shown to be lower in predominantly Black neighborhoods (Puckett and Lundman, 2003; Fagan and Geller, 2018), and higher in large cities with substantial socioeconomic disparities between the two groups (Borg and Parker, 2001). In our analysis, we also found that arrest rates are lower in police agencies with larger proportions of Black offenders.
The second area of work focuses on racial disparities at the micro level. Here, researchers typically attempt to isolate the effects of police discrimination from other sources of disparity by controlling for legal non-discretionary factors through regression analysis. The variability in the likelihood of arrest that is explained by features such as victim and offender’s race is then interpreted as (potentially) resulting from discriminatory practices. These analyses are inherently limited by the extent to which available data capture all alternative explanatory factors, and the challenge of interpreting race as a causal or mediating factor in regression (VanderWeele and Robinson, 2014). Research in this area has primarily relied on three sources of data: (i) field observations of encounters between police officers and citizens; (ii) self-reports of offending behavior; (iii) and official crime incidents records reported by police agencies. We focus here on (iii), as it is most closely related to our work. Prior studies of single victim, single offender incidents in the NIBRS data found that robberies, simple assault, aggravated assaults were more likely to be cleared by arrest when the offender is White than when the offender is Black, even after adjusting for many contextual and situational factors of the incident (D’Alessio and Stolzenberg, 2003; Pope and Snyder, 2003; Roberts and Lyons, 2009). These three types of offenses constitute the majority of violent crimes reported to police. This association did not persist for the most serious violent crimes of forcible rape and murder/non-negligent manslaughter. In their analysis of rape offenses, D’Alessio and Stolzenberg (2003) found that the overall clearance rate for Black offenders was marginally higher than for Whites, but that there was no statistically significant difference after controlling for situational factors. Through survival analysis modeling, Roberts and Lyons (2009) found that murder/non-negligent manslaughter incidents with non-White offenders were more likely to result in an arrest. Lastly, in a recent analysis of violent offenses of 2003–2012 NIBRS data including crimes committed by multiple offenders, Lantz and Wenger (2019) found that incidents were less likely to result in arrests when the offender was Black. However, when they restricted to incidents where Black and White individuals offended together, they found that Black offenders were slightly more likely to be arrested. Based on this evidence, the authors argued that omitted variable bias might affect regression analyses conducted on NIBRS data. Our study of violent offenses on NIBRS is closely related to that of D’Alessio and Stolzenberg (2003), but our analysis is much larger scale, includes incidents of murder/non-negligent manslaughter, and, unlike theirs, does not rely on the (unrealistic) assumption that the regression model is well-specified. Unlike Lantz and Wenger (2019), we focus specifically on geographical variations in the likelihood of arrest and on the issue of model misspecification. We find that the sign of the offender race coefficient varies with the subset of crimes used in the analysis, which suggests that the conclusions of prior work are dependent on model specification.
3. Data
Our analysis is mainly based on incident-level data of offenses from the National Incidents Based Reporting System (NIBRS) and data of police agencies from the Law Enforcement Employees Report. We describe each of the two datasets in turn.
NIBRS data
NIBRS is part of the FBI’s Uniform Crime Reporting (UCR) program. Through NIBRS, law enforcement agencies submit detailed data on the characteristics of incidents that are known to them, such as the demographics of victims and offenders (of Justice. Federal Bureau of Investigation (FBI), 2019). In our analysis, we use incident-level data of offenses and arrests recorded in NIBRS between 2007 and 2016 by aggregating annual data files obtained from the Inter-University Consortium for Political and Social Research (ICPSR) (Federal Bureau of Investigation, 2009a, 2010a, 2011a, 2012a, 2013a, 2014a, 2015a, 2016a, 2017a, 2018a). We only consider incidents that include at least one offense of murder/non-negligent manslaughter, forcible rape, robbery, aggravated assault, or simple assault.
In order to conduct our statistical analysis, we process the data as follows. First, we keep only data from the 16 states that submitted all their crime data through NIBRS in 2014: Arkansas (AR), Colorado (CO), Delaware (DE), Idaho (ID), Iowa (IA), Kentucky (KY), Michigan (MI), Montana (MT), New Hampshire (NH), North Dakota (ND), South Carolina (SC), South Dakota (SD), Tennessee (TN), Vermont (VT), Virginia (VA), and West Virginia (WV). Our results may not generalize beyond these 16 states. Second, following the approach of D’Alessio and Stolzenberg (2003), we keep only incidents that involve only one offender and one victim. The exclusion of incidents with multiple victims or offenders is mainly motivated by the additional assumptions that would be required if these types of incidents were considered for the analysis. Since data from NIBRS do not contain offender-level characteristics on the incident (e.g., which offender used the weapon), an analysis of multi-offender crimes would need to rely on assumptions around the circumstances of the incidents and require more complex regression models, e.g., the dependence of observations corresponding to the same incident should be modeled. By excluding these incidents, the analysis of the interactions between victims’ and offenders’ relevant features is simplified. Importantly, we consider only incidents where both the victim’s and offender’s races are recorded as either Black or White. We cannot exclude Hispanics from the analysis because the ethnicity field was introduced in the data only in 2012 and is often left empty. We note that almost every victim of Hispanic ethnicity is recorded as being White. Lastly, we drop all incidents that are cleared by exceptional means. We discuss this type of clearance in Appendix A. The final dataset includes 9,181 incidents of murder/non-negligent manslaughter, 103,309 forcible rapes, 101,133 robberies, 596,324 aggravated assaults, and 2,669,399 simple assaults.
For the regression analysis, we transform the features (a.k.a. covariates, regressors, independent variables) as follows. We first code dummies corresponding to the age, sex, and race of victim and offender. We create victim-level dummy variables to indicate whether the victim suffered a serious or a minor injury, knew the offender (i.e., the offender was not unknown to victim or was a stranger), and whether the incident occurred in the residence of the victim. We also create binary variables for incident’s characteristics to indicate whether the incident occurred during the day (i.e., between 7am and 8pm), a firearm was involved, a weapon other than a firearm was involved, the offense was only attempted but not completed (only available for forcible rape and robbery), the offender was suspected of having used drugs or alcohol, and whether ancillary offenses were committed. Finally, we create a variable that corresponds to the share of Black violent offenders (out of all violent offenders) for each police agency and a series of dummy variables for states and years to capture state and year fixed effects.
Law enforcement data
We match data from NIBRS with information regarding the police agency from the Law Enforcement Employees Report. This data are obtained from ICSPR for the years 2007–2016 (Federal Bureau of Investigation, 2009b, 2010b, 2011b, 2012b, 2013b, 2014b, 2015b, 2016b, 2017b, 2018b). For each police agency we extract information on the total population served and the number of police officers employed.
4. Methodology
Throughout the analysis, we assume the observations (i.e., the incidents) to be independent. Although each observation corresponds to a single crime incident and we exclude incidents that are cleared by exceptional means, independence may be violated if multiple incidents involved the same offender. Since offenders’ identifiers are not available in the data, we are unable to model this potential dependence.
In order to test for macro-level variations in racial disparities across geography, we split our data by jurisdiction (i.e., police agency) and examine the arrest rates for different types of crimes and demographics. In our analysis, the arrest rate corresponds to the share of offenses that result in arrests. For example, the arrest rate for White offenders is given by the ratio between the number of arrests and the number of offenses involving White offenders. Such summary statistics likely represent upper bounds for the arrest rates in the entire population of crimes, i.e., also the crimes that are not accounted for by our analysis such as those that are not reported to law enforcement. We assess the correlation between variables via Pearson’s correlation coefficient (). Statistical significance is assessed at the level for all hypothesis tests.
Since not all of the data features are fully observed, for our regression analysis we need to carry out data imputation. The datasets (one for each offense type) contain small shares of missing values consisting of up to approximately 5% of all observations, with the exception of around 20% in case of the offender’s age in offenses of robbery. As in past work (D’Alessio and Stolzenberg, 2003), we assume the data to be missing at random (MAR) (Rubin, 1976). We impute ten datasets via multiple imputation by chained equations (Azur et al., 2011). On each imputed dataset, we use logistic regression to model the dependence of the likelihood of arrest on race and other factors. We calculate sandwich standard errors for the coefficients estimates. We then obtain a single set of coefficients estimates and the corresponding standard errors using the formulas provided by Rubin (2004, pp. 76-77). This analysis is conducted separately for each offense type.
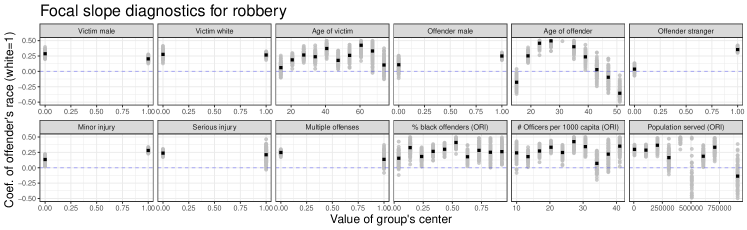
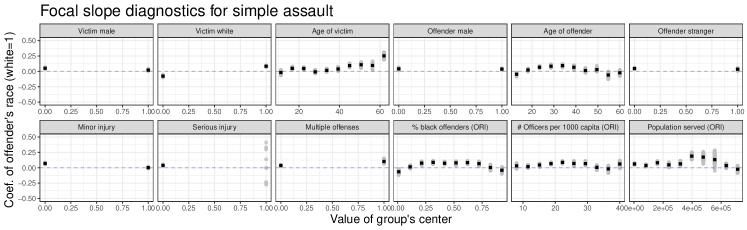
In the second stage of our analysis, we investigate whether the logistic regression model appears to be well-specified. Here, we apply the approach proposed by Buja et al. (2019), which is based on the principle that coefficients estimates of a correctly specified model do not change significantly as the distribution of the regressors varies. Changes in the coefficients estimates under observation reweighting are therefore indicative of model misspecification. In our analysis, we employ the focal slope visual model diagnostic introduced by Buja et al. (2019) to assess how the offender’s race coefficient estimate varies with the reweighting of the distribution of certain regressors. This tool provides insights into the interactions between the race variable and other regressors without modeling the interactions directly in the regression model. Our aim is to investigate whether the estimate of the coefficient relative to the offender’s race always has a consistent sign and magnitude under different reweightings.
To implement the reweighting procedure, we proceed as follows. We first construct a grid of ten evenly spaced values for the numeric features, and use the grid values of for the binary features. For each feature, we split the observations into groups based on the grid’s cell center that is closest to each observation’s feature value in absolute distance. For each feature-grid cell pair, we then obtain 100 estimates of the logistic regression coefficients by bootstrap resampling observations from the given group. Due to the high computational cost driven by the large number of observations of simple assault incidents, we apply the focal slope diagnostics to only one of the ten imputed datasets for this offense type. The coefficients estimates on the ten imputed datasets are nearly identical, so we do not expect the focal slope analyses to vary with the imputed data sample. Our data analysis is fully reproducible. The full R (Team et al., 2013) code is available at the following address: https://github.com/ricfog/on-the-validity-of-arrest.
5. Limitations
Despite the wealth of information contained therein, analyses of NIBRS data suffer from several key limitations. First, not every police agency reports all of its crime data through NIBRS (Bibel, 2015). These omissions may reflect partial reporting (e.g., for some period of time each year) or complete non-reporting by agencies in the states considered. If such data omissions occurred at random (with respect to crimes characteristics and outcomes), then our inference at the level of the police agency would not be affected, but the representativeness of our sample with respect to the population of interest (i.e., all the crime incidents known to police agencies in the 16 states considered) could be impacted. Data omissions that do not occur at random would be even more problematic. For example, the existence of different reporting protocols across states or jurisdictions, such as the non-reporting of incidents that do not result in arrest by certain agencies, could explain the large variations in arrest rates that we observe. Importantly, there is evidence that cases that are considered as “unfounded” are not tracked by NIBRS (Greenblatt et al., 2018) and consequently will not be included in the data. Another issue pertains to the quality of the data that are reported, which may not offer an unbiased picture of the circumstances of the incident. Victims may report mistaken or even false details regarding the incident. Likewise, data from police departments may also be the artefact of a selection, manipulation, and review process, as the study of Richardson et al. (2019) has shown. While in many instances the arrestee is the offender, there may be incidents in the data that are cleared by wrongful arrests. Due to the absence of data on which incidents might correspond to wrongful arrests, we are unable to account for this possibility in our analysis. This may be problematic given the evidence that, even for the most serious types of offenses, wrongful arrests may represent a considerable share of all arrests (Loeffler et al., 2019). Our analysis considers only violent crime incidents that are not cleared by exceptional means and where there is a lone offender and victim whose race is reported as either Black or White. Some of the conclusions may therefore fail to generalise to other types of incidents. It is important to keep in mind that the characteristics of the sample of offenses in NIBRS is not representative of all crimes at the national level (McCormack et al., 2017; Pattavina et al., 2017). Lastly, we could not exclude Hispanics from our sample, nor could we code this group separately for our analysis. There is evidence that the degree of involvement in violent offending of Hispanics falls within the levels of the White and of the Black populations (Steffensmeier et al., 2011). As previously mentioned, in NIBRS data Hispanics are for the most part included within the White population. Any existing differences in offending behavior or arrest rates between Hispanic and non-Hispanic White offenders will not be captured by our analysis.
6. Results
Since, to the best of our knowledge, this study presents the first analysis of racial disparities in violent offenses using the most recent years of NIBRS data, we begin by providing some summary statistics on arrest rates across victim and offender’s demographics and crime types (see also Table 1). Overall, 41% of all offenders and 34% of all victims are Black. As a reminder, only Black and White individuals are represented in the dataset. The overrepresentation of Black individuals among offenders is lowest in case of incidents of forcible rape (31%) and highest in case of robbery (76%). We then examine the likelihood of arrest across offenders’ racial groups. Arrests are more frequent in case of incidents involving White offenders across all types of crimes (overall, 56% for White vs. 42% for Black offenders). However, there exist differences in the gap in arrest rates across types of offenses. The gap is largest in case of robbery (36% vs 19%) and aggravated assault (62% vs 44%), followed by simple assault (57% vs 43%), which constitute the majority of the offenses present in the data. In contrast, the gap is small for murder/non-negligent manslaughter (73% vs 67%) and rape (27% vs 25%). Lastly, we assess the racial composition of victims. Intraracial crimes constitute four-fifths or more of the offenses across all types of crimes, with the exception of rape (63%) and robbery (57%) offenses committed by Black offenders. Interestingly, arrest rates for interracial crimes are similar across racial groups (within 2%) for all types of crimes other than robbery. In summary, we observe that arrest rates are highest for intraracial offenses among Whites, followed by interracial offenses, and last by intraracial offenses among Black individuals.
6.1. Macro-level variations in arrest rates
It is possible that the observed gap in arrest rates across offenders’ racial groups could be explained by variations in the likelihood of arrest and in the racial composition of offenders across geographical areas, e.g., as in case of a Simpson’s paradox. To analyse such variation, we first consider the data regarding simple assaults. The large size of this dataset allows us to consider arrest rates at the level of the cities and police agencies. For this analysis, we focus on police agencies that reported at least 100 crimes of simple assault in the ten-year period spanned by our data.
We start by decomposing the gap in arrest rates between White and Black offenders (13%=57%-43%) into state-level differences, which are represented by the green stars in Figure 1. Two notable patterns are worth mentioning. First, there are quite large variations in arrest rates across states. While in Arkansas less than 35% of all offenses resulted in the arrest of the offender, in Delaware and Vermont 79% and 82% did respectively. Second, we observe that the gap in arrest rates between Black and White offenders varies substantially across states. Although White offenders were arrested at higher rates than Black offenders in almost all of the states considered, the pooled mean of the gap in arrest rates is 6% (std.dev.=6%) and thus it is smaller than the overall gap. It is possible, as we shall show, that variations in arrest rates across police agencies within may drive the observed disparities. We first focus our analysis on three states with large disparities, including Tennessee (state-level gap=20%), Michigan (14%), and South Carolina (10%), and then turn to the other states.

Let’s first consider the case of Tennessee. Our dataset contains approximately 500,000 offenses of simple assault that occurred in the state during the period considered. Tennessee contains two large cities, Memphis and Nashville. In Memphis, 26% of the offenses resulted in an arrest and 89% of the offenders were identified as Black. In contrast, in Nashville and its metropolitan area the arrest rate is 54% and only 57% of the offenders were Black. Although Black and White offenders were arrested at similar rates within each of the two areas, the aggregate gap in arrest rates between racial groups is 15%. Furthermore, data on offenses in Memphis alone accounts for 51% of all incidents involving Black offenders in the state. By contrast, only 5% of all crimes with White offenders occurred in Memphis. Even if arrest rates largely vary across the 14 core cities, the gap across racial groups, within each city, is always small (mean=4%, std.dev.=3%). Thus, the low arrest rate in Memphis, together with the fact that most of the offenses committed by Black offenders occur in this city, drives the the observed state-level disparity in arrest rates.
Similar findings hold in the case of Michigan. Data from the city of Detroit contain 17% of the almost 600,000 simple assault offenses in the state but also account for 36% of all incidents involving Black offenders in the state, compared to only 2% of those with White offenders. White and Black offenders were arrested at similar rates within the city. Since arrest rates in this area are considerably lower than in the rest of the state (20% vs 43%), the overall disparity in arrest rates at the state level is large. The case of South Carolina is slightly more complex. For this state we do not observe large differences in arrest rates between core cities and surrounding regions and there is no variation in the size of racial disparities in arrest rates, which are large in both areas. However, we observe that police agencies in areas where larger shares of offenders are Black also tend to have lower rates of arrest ().
We then study whether the disparities in arrest rates persist at the level of the police agency for the other states considered. Figure 1 shows the boxplots of the differences in arrest rates between White and Black offenders for the police agencies in each state. We observe that the median gap in arrest rates for the police agencies is generally smaller than the difference at the state level. This pattern is consistent with the aforementioned heterogeneity in arrest rates and distributions of the Black and White populations of offenders across jurisdictions. Interestingly, however, even after conditioning on the police agency, there still remains some degree of variation in the gap in arrest rates across racial groups, with arrest rates generally being higher for White offenders.
By focusing on the characteristics of the law enforcement agency, we find that in most states agencies with larger shares of Black offenders tend to have, as in the case of South Carolina, lower arrest rates (), higher crime rates in their jurisdictions (), more officers per capita (), and larger populations served (). However, the number of officers per incident is not linearly associated with the share of offenders that is Black in the jurisdiction (, p-value).
We briefly turn our attention to the other four types of offenses. Simple assault is the least serious crime among the ones that we considered, so ex ante it is unclear whether the findings would generalize to the other crimes. Based on our analysis, we can categorize the offenses in two groups. The first includes aggravated assault and robbery. For these two types of crimes, the results are similar to those that we have described above and, more specifically, arrest rates are higher for White offenders in almost all of the states considered (Figure 2). The pooled means of the state-level gaps in arrest rates between White and Black offenders for aggravated assault and robbery are 6% and 11% respectively. Still, we need to keep in mind that the magnitude of arrest rates for these two types of offenses is very different: While almost two in three offenders were arrested for aggravated assault (pooled mean=63%), only one in three reported offenses of robbery resulted in arrest (35%). Large differences in arrest rates across offense types persist even if incidents with multiple victims and offenders are accounted for. For crimes of rape and murder, both the aggregate and state-level differences in arrest rates across racial groups are small (average state-level diff.=2% for both types of offenses). Overall arrest rates are low across all states for rape (pooled mean=29%) and high for murder (mean=73%).
Although these results cannot explain why the observed differences in arrest rates across offenders’ racial groups arise and why the appear only for assaults and robberies, they show that the magnitude of disparities can be explained by the existing large variations in the likelihood of arrest across jurisdictions and by the fact that agencies with larger shares of Black offenders have lower arrest rates overall. We discuss two potential explanations for these findings in §7.
6.2. Regression analysis
In this section, we investigate whether the observed differences in arrest rates across racial groups can be explained by the incident’s characteristics. For this purpose, we model the likelihood of arrest as a function of contextual and situational factors, fitting separate logistic regression models for each of the five types of violent offenses as described in §4. As a reminder, among the regressors, we include victim and offender’s demographics, the victim-offender relationship prior to the incident, circumstances (e.g., location and time of the day) and other characteristics (e.g., presence of weapon) of the incident, information regarding the police agency where the incident was recorded (police officers per capita, population served, and share of Black offenders), and the state in which the crime occurred. The full set of regressors and coefficients estimates is presented in Table 2.
Consistent with the high-level findings of our macro-level analysis, our estimate of the coefficient of White offender race (vs. Black) is positive and statistically significant in case of aggravated assault, simple assault, and robbery (, , respectively), and not statistically significant for forcible rape and murder ( and respectively). However, note that the coefficients estimates in case of assault, despite being statistically significant, are close to zero. The coefficient of White victim race is statistically significant and negative for forcible rape (), and positive for aggravated and simple assault ( and respectively). It is not statistically significant for murder/non-negligent manslaughter and robbery ( and respectively).222We conducted two additional checks. First, we fitted logistic mixed model with random effects for law enforcement agencies (Fitzmaurice et al., 2008). The estimates of the race coefficients were very close to those of the regression model that we present in the main analysis. Second, we clustered the sandwich standard errors (Freedman, 2006) by law enforcement agency and year. The resulting coefficients estimates relative to the offender’s race was statistically significant in case of simple assaults, but not for aggravated assaults.
If the model were correctly specified, we could interpret the coefficient as the log of the odds ratio of the likelihood of arrest for a White offender compared to a Black offender, conditional on all other regressors. Our model would then indicate that, ceteris paribus, an arrest is more likely for a White offender compared to a Black offender for assaults and robbery, but not for murder and rape. Furthermore, incidents involving White victims would be, ceteris paribus, less likely to result in an arrest for offenses of rape, but more likely in case of aggravated and simple assault. The conditional likelihood of arrest does not considerably differ across racial groups for murder. Note again that, even in the case of several of the statistically significant coefficients, the coefficient estimates themselves are generally small.
More realistically, our logistic regression model is misspecified and thus such interpretations of the coefficients estimates are not correct. In Figure 3, we present the results of the “focal slope” model diagnostics for the offender’s race coefficient across all crimes other than murder/non-negligent manslaughter, which we omitted due to the small sample size. We observe that the estimates of this coefficient vary with the distribution of the regressors, thereby indicating that none of the regression models is well specified. Interestingly, we observe that the association of the offender’s race (White=1) with the outcome is typically positive for incidents with White victims, but is weaker or even negative in case of Black victims. This result would seem to suggest the presence of an interaction between victim’s and offender’s race. In case of rape and simple assaults with Black victims, the offender being White appears to be associated with a decrease in the likelihood of arrest. Jurisdiction-level factors also appear to impact the estimates of the offender race coefficient. For example, in case of assaults, we observe a weak or even negative association between the race variable and the outcome in police agencies where offenders mainly belong to one racial group, but a positive association in agencies where the racial composition of offenders is more diverse. We observe that the association between the offender’s race and arrest is positive and strong only for middle-aged offenders, and is weak for both young and old offenders. Overall, the results indicate that no causal conclusions can be drawn regarding the “effect” of race from such a model. Furthermore, problematically, the findings around the size of the effect are contingent upon the areas and types of crimes that are considered.
Finally, although our emphasis was primarily on the coefficient of race, one should note that most of the coefficient estimates for the other features are statistically significant and many are much larger than those corresponding to race. This indicates that incidents of the same offense type might result in different outcomes.
7. Discussion
Our investigation of NIBRS data, which centered on race as a predictor of the likelihood of arrest for violent crimes, was motivated by the implications concerning the potential disconnect between re-offense and re-arrest in RAIs. We presented two key findings. First, in our analysis White offenders were more likely to be arrested than Black offenders for crimes of robbery and assaults, but not for forcible rape and murder/non-negligent manslaughter. The finding that arrest rates in the NIBRS are higher for White offenders than for Black offenders was also noted by D’Alessio and Stolzenberg (2003). The observed disparities in our study are largely explained by variations in arrest rates across jurisdictions. Yet, even after conditioning on the individual law enforcement agency, some of these disparities persisted. Second, while our initial regression results indicated that the magnitude of the offender race coefficients estimates were fairly small compared to those of other predictors, the model diagnostics revealed that their sign and magnitude varied with the sample of offenses that was considered. Despite the misspecification of our regression model, it seems unlikely that crime characteristics that we took into account could fully explain the observed variations or even the racial disparities in arrest rates. Our results call into question the reliability of arrest as a proxy for offense.
Arrest rates and racial disparities vary considerably across jurisdictions
In our study we also found that the observed racial disparity in arrest rates can be attributed to lower arrest rates in police agencies with larger shares of Black offenders. This finding is aligned with several hypotheses from the criminology literature, two of which we discuss below.
The first explanation builds off of the hypothesis of benign neglect, which posits that the effort invested by police into the investigation of the crimes might be proportional to the perception of the victim’s deservedness. A perspective of victim devaluing, which is more likely to prevail in disadvantaged neighborhoods or cities, might, in combination with resource constraints, lead to systematically lower investigation effort devoted to incidents occurring in those areas (Stark, 1987). In particular, police departments might allocate their limited resources only to certain communities and to solving the most serious incidents (Klinger, 1997), such as rape and murder, for which police officers are granted less discretion. Police might also be more likely to tolerate criminal acts in areas where crimes rates are higher (Stark, 1987; Klinger, 1997) or that are racially segregated (Kent and Jacobs, 2005). It would then be hard for victims and residents in these areas to be heard by the police and to legitimate their complaints. Consistent with Black’s stratification hypothesis (Black, 1976), which posits a positive relationship between the likelihood of arrest and the gap in social status of victim and offender, this explanation is partially supported by our finding that the association between the probability of arrest and the offender White race is weaker or negative for incidents involving Black victims. By contrast, the investigation of crimes of murder and rape would be less affected by the differential allocation of policing resources. It is possible that the results for murder incidents may reflect a shift in racial discrimination from a victim- to an offender-centered perspective: Murders are the most serious form of crime and as such they attract considerable attention from the media, community, and police agencies. In addition, the evaluation of performance based exclusively on the clearance rate represents an incentive for homicide detectives to solve all cases to which they are assigned (Puckett and Lundman, 2003).
A second hypothesis is that the observed racial disparities are an artefact of variations in the community’s willingness to rely and cooperate with the police. In the case of violent crimes, the cooperation of victims and onlookers with law enforcement is often necessary for identifying the suspect and clearing the crime. Certain communities have lower levels of trust in law enforcement—a phenomenon known as legal cynicism—and consequently are less likely to assist police officers in their investigations. For example, social norms can amplify negative attitudes towards the police by incentivizing the resolution of conflicts without seeking help from members outside the community (Anderson, 2000) or by fostering a “stop snitching” culture (Clampet-Lundquist et al., 2015). Community members may also fear retaliation if they decide cooperate with the police (Kubrin and Weitzer, 2003). There is considerable evidence that cooperation varies with these types of (sub)cultural factors (Sunshine and Tyler, 2003; Kirk and Matsuda, 2011; Carr et al., 2007; Tyler and Fagan, 2008; Tyler et al., 2014). Phenomena that erode trust, such as police misconduct (Terrill and Reisig, 2003; Kane, 2002) and over-policing (Kane, 2005) (e.g., street stops) are more frequent in predominantly-Black areas. Consistently, many studies have found Black individuals to hold more negative views of law enforcement (Weitzer and Tuch, 1999, 2004; Weitzer and Brunson, 2015). Differential cooperation has been a central theme in prior work on racial disparities in arrests for homicides (Puckett and Lundman, 2003; Fagan and Geller, 2018). Unfortunately, one clear limitation of NIBRS data is that they do not include incident-level details on cooperation, as also Roberts and Roberts (2016) noted in their recent study. The only piece of information that is available, and that has been analysed by recent work on violent offenses, is whether the incident is exceptionally cleared because of the lack of victim’s cooperation (Felson and Lantz, 2016). In our dataset, however, the share of incidents that were cleared for this reason did not differ across racial groups of offenders and victims (see Appendix A).
The two hypotheses should not be seen as a dichotomy: Each of them may explain, at least in part, the observed disparities in the probability of arrest. At the same time, it also seems certainly possible that these disparities could be explained by differences in the ways in which crimes are recorded across law enforcement agencies or by different legal standards used to evaluate whether an arrest needs to be made. For example, in the case of intimate partner violence (a.k.a. IPV), once the incident is reported to the police, prevailing mandatory arrest laws in certain jurisdictions leave officers with little discretion as to whether to arrest the reported offender (Hirschel et al., 2007; Dugan, 2003; Kochel et al., 2011). This phenomenon might partially explain the variation observed in arrest rates for simple assaults, which include some IPV offenses, across states.
Reporting a single estimate of the coefficient of the offender’s race may be misleading
Our focal slope model diagnostics of the logistic regression revealed that the association between the offender’s race and the likelihood of arrest largely depended on the sample of offenses that was considered. This result is important for two reasons. First, it demonstrates that the regression model employed in our analysis is not well-specified. In past studies, researchers typically postulated a model, fitted it on the data, and then reported the estimates of the coefficients of interests, such as those of the offender’s or victim’s races. The models used in these works were often similar to ours. For example, D’Alessio and Stolzenberg (2003) employed a logistic regression that accounted for a subset of the predictors that were included in our model. The focal slope diagnostics in our analysis, which are based on the recent work of Buja et al. (2019), have shown that reporting one single coefficients estimate may not be very informative when the modeling assumptions do not hold. Researchers should, instead, analyse how the misspecification of the regression model that they chose may call into question their interpretations of the results, e.g., by using the types of diagnostics proposed by Buja et al. (2019). Second, the diagnostics have revealed that, after controlling for crimes characteristics, the association between the likelihood of arrest and the offender’s race depended on the race of the victim. We also observed a weaker association between the offender’s race and the likelihood of arrest in police agencies with larger shares of White offenders. While a careful analysis of the role of race as a predictor of the likelihood of arrest across each subpopulation (e.g., different jurisdictions) is challenging and outside of the scope of our work, the main takeaway from our results is that the likelihood of arrest can differ across races, both at the aggregate level and conditionally on other factors.
Arrest is a biased proxy of offense
In §1, we discussed how prior studies have found that the racial composition of arrestees in the Uniform Crime Reporting (UCR) roughly match that of offenders in the National Crime Victimization Survey (NCVS) data, a criminal victimization survey based on a nationally representative sample of households, for the four types of violent crime measured by both programs. This pattern suggests that the likelihood of arrest for White and Black offenders is, on average, similar, but it does not indicate that the likelihood of arrest is equal for all offenders in the two racial groups. We have found that arrest rates and racial disparities vary across states and jurisdictions. The regression analysis has further revealed that, even after conditioning on relevant features, the disparities across racial groups still persist and run in different directions depending on these features. Thus, the extent to which arrest reflects offending behavior depends on the geographical area where the crime occurs, the offenders’ and victims’ demographics, and other crimes characteristics. Treating arrests as an unbiased, or even racially-unbiased, measure of violent offending fails to acknowledge the existing heterogeneity in the likelihood of arrest.
8. Implications for RAIs
Risk of re-arrest and re-offense may diverge, even in case of violent offenses.
Our analysis has shown that arrests are not a random sample of all violent offenses known to police agencies as reflected in NIBRS data. The large variations that we observe in arrest rates across crime types and jurisdictions are deeply problematic for RAIs.333We acknowledge that availability of information regarding the offender and victim might influence the likelihood of arrest differently across crime types. However, the observed variation persisted even once we considered all incidents in the data, i.e., we only applied the data restrictions relative the states. The arrest rates for murder, forcible rape, robbery, aggravated assault, and simple assault were 58%, 24%, 24%, 50%, and 50% respectively. As an example, let’s revisit our analysis of Tennessee’s offense and arrest data. In Nashville, half of all simple assault offenses resulted in arrests, as compared to only one fourth in Memphis. We should expect these differences to be reflected in the prevalence of re-arrests in the data used to train and assess RAIs. The variation in the characteristics of the offender populations would then shape the predictors used to construct the RAI. Consequently, we should expect RAIs trained on re-arrest data to underestimate the risk of re-offense for certain subpopulations of defendants—specifically, those that are more prevalent in the city with lower arrest rates, and to be poorly calibrated with respect to re-offense data. Moreover, if the risk factors employed by the RAI cannot explain the disparities observed between the two cities, the instrument will also exhibit differences in its calibration properties on re-arrest data across the two cities. Absent knowledge of the functional dependency between re-arrest and re-offense, practitioners might try to mitigate the predictive biases of the RAI using only re-arrest data, only inadvertently (potentially) exacerbating the bias as measured with respect to re-offense. To overcome this issue, individual jurisdictions could construct their own RAIs. However, in most cases this is certainly not possible due to data unavailability and other limitations.
As a second example, consider the variation in arrest rates across types of offenses. If the propensity to commit different types of violent crime were to differ across offenders, then the risk of re-arrest would be lower for certain individuals, even if their risk of re-offense were identical. For instance, since arrests for rape are rare (as is generally true for sex offenses), RAIs might erroneously underestimate the risk of these sex offenders recidivating (compared to, say, aggravated assault offenders), and could nudge nudge decision-makers toward more lenient treatment that is unwarranted on the basis of underlying re-offense risk. In order to identify defendants at high risk of recidivism, practitioners should design RAIs that either account for this bias or that target only the particular type of crime of interest. We note that there already exist tools that predict specifically the likelihood of future IPV (Messing and Thaller, 2013).
The consequences of the sampling bias in arrest data are not limited to mismeasurement of re-arrest outcomes on which RAIs are trained. This bias affects offenders’ criminal histories as well, making them inaccurate reflections of past offending behavior. The number of prior arrests represents an underestimation of the total number of prior offenses, especially for frequent offenders, who are generally less likely to be arrested (Blumstein et al., 2010). Similarly, our analysis has shown that certain types of crimes are more likely to result in arrest, and thus the characteristics of the crimes recorded in a defendant’s prior criminal history do not offer an unbiased picture of the characteristics of the prior offenses that they actually have committed. Lastly, the sample of arrestees does not reflect the sample of offenders in the population. In particular, more frequent offenders may be less likely to be caught for each individual crime that they commit, yet more likely to be represented among arrestees, e.g., see the phenomenon of “stochastic selectivity” described by Canela-Cacho et al. (1997).
Bias cannot be estimated from NIBRS data alone
NIBRS is the main program of crime data collection in the US, providing the best available unified view of crime trends. Large-scale analyses of racial disparities could leverage the NIBRS because of its comprehensiveness. However, for the purpose of mitigating bias in criminal RAIs, NIBRS data alone are not sufficient for at least two key reasons, which we discuss below.
First, the effect of many types of sampling biases cannot be identified from the observed data. In the discussion, we have hypothesized that variations in the likelihood of arrest might stem from multiple sources, namely the allocation of policing resources, community’s cooperation, and ways in which the crimes are recorded. However, it is also clear that some of the differences in arrest rates across crimes are inherently tied to the difficulty of identifying and arresting the offender. For example, crime incidents in which the offender is a stranger to the victim are cleared at lower rates across all crime types (Table 2). Many of these factors are not represented in NIBRS data, which offers only a limited window into the reason why a reported offense did not result in arrest (e.g., for exceptional clearances). In addition, NIBRS data only include crime incidents that are known to law enforcement, which represent only a small share of the offenses that are committed. According to estimates from the National Crime Victimization Survey (NCVS), in 2019 only about two in five violent victimizations were reported to the police (Morgan and Truman, 2019). Evidence suggests that rates of crime reporting substantially vary across crime types (Baumer and Lauritsen, 2010) and are generally higher in case of incidents involving Black victims, even if cooperation rates may be lower (Xie and Lauritsen, 2012). Thus, the information present in NIBRS data would not be sufficient to implement tailored “debiasing” approaches that target specific types of bias in the dat (e.g., a certain discriminatory proactive policing strategy) and that may be necessary from a legal perspective (Ho and Xiang, 2020). One could, however, attempt to leverage NIBRS together with richer datasets of police records, of self-reported offending behavior, data from NCVS, and of citizen-police interactions such as those studied in Terrill and Reisig (2003). Kochel et al. (2011) and Lytle (2014) offer interesting examples of meta-analyses on the role of race in arrests for different types of crime types and data. An additional potential limitation is the issue of model misspecification that we encountered in our analysis. Clearly, regression models more complex than the ones that we employed that could potentially address this issue, but they may be harder to interpret and sanity-check as corrective mechanisms. It is important to keep such trade-offs in mind when considering model-based bias mitigation strategies.
Second, static estimates of the sampling bias may not be valid for longitudinal outcomes. Due to the longitudinal nature of the measurement of re-arrest outcomes on which RAIs are trained and assessed, knowledge of the offending frequency and of the characteristics of the crimes committed would be needed for the correction. Data from NIBRS do not contain offenders’ identifiers and thus cannot provide such estimates. However, offending behavior has been studied by criminologists by surveying inmates and through longitudinal studies for decades. M ost studies agree that the offending frequency varies across populations and, while most of the offenders commit only a few crimes a year (Piquero and Blumstein, 2007), there is a small group of offenders with very high offending rates (more than 100 crimes a year) for whom the probability of arrest is low (Blumstein et al., 2010). Attempts to correct for bias could then draw on these findings.
We remark that the utility of data from NIBRS for the estimation of sampling bias in RAIs seems fairly limited. Alternative sources of data, as discussed above, may provide more promising avenues to bias mitigation. However, what is gained in specificity with alternative data sources often comes at the cost of generalizability. For example, data on self-reported offending behavior has mainly been collected for populations of youths living in certain geographical regions, such as the Pathways to Desistance longitudinal study conducted on young adolescents in Philadelphia (Pennsylvania) and Maricopa county (Arizona) (Brame et al., 2004). Extrapolation of findings on these samples to other populations, such as offenders that are older or in other geographical areas, would need to be carefully considered.
9. Conclusions
Characterizing the biases present in arrest data is critical to assessing the challenges and opportunities posed by recidivism risk assessment instruments. While past work has suggested evaluating RAIs on data of violent offenses as a way to alleviate concerns of racial bias, by analyzing incident-level crime data from NIBRS, we have shown that violent offense data suffer from significant sampling biases. There are disparities in the probability of arrest across geographical areas, characteristics of the crimes, and racial groups of victims and offenders, that were not adequately captured in prior work. Our analysis indicates that arrest data on violent crimes are not a random sample of the offenses actually committed. Absent corrective mechanisms, the predictions produced by RAIs trained on such data can be expected to reflect these sampling biases. At the same time, correcting for the sampling bias in recorded arrest data without accounting for the complex relationship between race, offending, and arrest may exacerbate the disparities exhibited by the RAI. In the present work we have sought to highlight several of the key complexities and challenges of identifying the magnitude of sampling bias in arrest data. We also discussed the limitations and challenges of using various sources of offending and arrest data in bias mitigation efforts. Despite these challenges, we believe it is important for future work on developing and de-biasing recidivism risk assessment instruments to explicitly consider the discrepancy between criminal offending and arrest.
10. Acknowledgments
We are grateful to the Partnership on AI (PAI) and the Carnegie Mellon University Digital Transformation and Innovation Center sponsored by PwC for funding this research. We also thank Arun Kumar Kuchibhotla and anonymous reviewers for providing valuable feedback.
References
- (1)
- Agarwal et al. (2018) Alekh Agarwal, Alina Beygelzimer, Miroslav Dudík, John Langford, and Hanna Wallach. 2018. A reductions approach to fair classification. In International Conference on Machine Learning. PMLR, 60–69.
- Anderson (2000) Elijah Anderson. 2000. Code of the street: Decency, violence, and the moral life of the inner city. WW Norton & Company.
- Angwin et al. (2016) Julia Angwin, Jeff Larson, Surya Mattu, and Lauren Kirchner. 2016. Machine Bias: There’s Software Used Across the Country to Predict Future Criminals. And it’s Biased Against Blacks. (2016). https://www.propublica.org/article/machine-bias-risk-assessments-in-criminal-sentencing.
- Azur et al. (2011) Melissa J Azur, Elizabeth A Stuart, Constantine Frangakis, and Philip J Leaf. 2011. Multiple imputation by chained equations: what is it and how does it work? International journal of methods in psychiatric research 20, 1 (2011), 40–49.
- Barabas et al. (2018) Chelsea Barabas, Madars Virza, Karthik Dinakar, Joichi Ito, and Jonathan Zittrain. 2018. Interventions over predictions: Reframing the ethical debate for actuarial risk assessment. In Conference on Fairness, Accountability and Transparency. PMLR, 62–76.
- Bates et al. (2015) Douglas Bates, Martin Mächler, Ben Bolker, and Steve Walker. 2015. Fitting Linear Mixed-Effects Models Using lme4. Journal of Statistical Software 67, 1 (2015), 1–48. https://doi.org/10.18637/jss.v067.i01
- Baumer and Lauritsen (2010) Eric P Baumer and Janet L Lauritsen. 2010. Reporting crime to the police, 1973–2005: A multivariate analysis of long-term trends in the National Crime Survey (NCS) and National Crime Victimization Survey (NCVS). Criminology 48, 1 (2010), 131–185.
- Beck and Blumstein (2018) Allen J Beck and Alfred Blumstein. 2018. Racial disproportionality in US state prisons: Accounting for the effects of racial and ethnic differences in criminal involvement, arrests, sentencing, and time served. Journal of Quantitative Criminology 34, 3 (2018), 853–883.
- Berk et al. (2017) Richard Berk, Hoda Heidari, Shahin Jabbari, Matthew Joseph, Michael Kearns, Jamie Morgenstern, Seth Neel, and Aaron Roth. 2017. A convex framework for fair regression. arXiv preprint arXiv:1706.02409 (2017).
- Bibel (2015) Daniel Bibel. 2015. Considerations and cautions regarding NIBRS data: A view from the field. Justice Research and Policy 16, 2 (2015), 185–194.
- Black (1976) Donald Black. 1976. The behavior of law. New York: Academic Press.
- Blalock (1967) Hubert M Blalock. 1967. Toward a theory of minority-group relations. Vol. 325. New York: Wiley.
- Blumstein et al. (2010) Alfred Blumstein, Jacqueline Cohen, Alex R Piquero, and Christy A Visher. 2010. Linking the crime and arrest processes to measure variations in individual arrest risk per crime (Q). Journal of Quantitative Criminology 26, 4 (2010), 533–548.
- Borg and Parker (2001) Marian J Borg and Karen F Parker. 2001. Mobilizing law in urban areas: The social structure of homicide clearance rates. Law and Society Review (2001), 435–466.
- Brame et al. (2004) Robert Brame, Jeffrey Fagan, Alex R Piquero, Carol A Schubert, and Laurence Steinberg. 2004. Criminal careers of serious delinquents in two cities. Youth Violence and Juvenile Justice 2, 3 (2004), 256–272.
- Buja et al. (2019) Andreas Buja, Lawrence Brown, Arun Kumar Kuchibhotla, Richard Berk, Edward George, Linda Zhao, et al. 2019. Models as Approximations II: A Model-Free Theory of Parametric Regression. Statist. Sci. 34, 4 (2019), 545–565.
- Canela-Cacho et al. (1997) Jose A Canela-Cacho, Alfred Blumstein, and Jacqueline Cohen. 1997. Relationship between the offending frequency () of imprisoned and free offenders. Criminology 35, 1 (1997), 133–176.
- Carr et al. (2007) Patrick J Carr, Laura Napolitano, and Jessica Keating. 2007. We never call the cops and here is why: A qualitative examination of legal cynicism in three Philadelphia neighborhoods. Criminology 45, 2 (2007), 445–480.
- Celis et al. (2019) L Elisa Celis, Lingxiao Huang, Vijay Keswani, and Nisheeth K Vishnoi. 2019. Classification with fairness constraints: A meta-algorithm with provable guarantees. In Proceedings of the conference on fairness, accountability, and transparency. 319–328.
- Chouldechova (2017) Alexandra Chouldechova. 2017. Fair prediction with disparate impact: A study of bias in recidivism prediction instruments. Big data 5, 2 (2017), 153–163.
- Clampet-Lundquist et al. (2015) Susan Clampet-Lundquist, Patrick J Carr, and Maria J Kefalas. 2015. The sliding scale of snitching: A qualitative examination of snitching in three Philadelphia communities. In Sociological Forum, Vol. 30. Wiley Online Library, 265–285.
- Corbett-Davies et al. (2017) Sam Corbett-Davies, Emma Pierson, Avi Feller, Sharad Goel, and Aziz Huq. 2017. Algorithmic decision making and the cost of fairness. In Proceedings of the 23rd acm sigkdd international conference on knowledge discovery and data mining. 797–806.
- Csárdi (2021) Gábor Csárdi. 2021. cli: Helpers for Developing Command Line Interfaces. https://CRAN.R-project.org/package=cli R package version 2.3.0.
- Dahl et al. (2019) David B. Dahl, David Scott, Charles Roosen, Arni Magnusson, and Jonathan Swinton. 2019. xtable: Export Tables to LaTeX or HTML. https://CRAN.R-project.org/package=xtable R package version 1.8-4.
- D’Alessio and Stolzenberg (2003) Stewart J D’Alessio and Lisa Stolzenberg. 2003. Race and the probability of arrest. Social forces 81, 4 (2003), 1381–1397.
- Dieterich et al. (2016) William Dieterich, Christina Mendoza, and Tim Brennan. 2016. COMPAS Risk Scales: Demonstrating Accuracy Equity and Predictive Parity. (2016).
- Donini et al. (2018) Michele Donini, Luca Oneto, Shai Ben-David, John Shawe-Taylor, and Massimiliano Pontil. 2018. Empirical risk minimization under fairness constraints. arXiv preprint arXiv:1802.08626 (2018).
- Dugan (2003) Laura Dugan. 2003. Domestic violence legislation: Exploring its impact on the likelihood of domestic violence, police involvement, and arrest. Criminology & Public Policy 2, 2 (2003), 283–312.
- Eitle et al. (2002) David Eitle, Stewart J D’Alessio, and Lisa Stolzenberg. 2002. Racial threat and social control: A test of the political, economic, and threat of black crime hypotheses. Social Forces 81, 2 (2002), 557–576.
- Fagan and Geller (2018) Jeffrey Fagan and Amanda Geller. 2018. Police, race, and the production of capital homicides. Berkeley J. Crim. L. 23 (2018), 261.
- Federal Bureau of Investigation (2004) United States Department of Justice Federal Bureau of Investigation. 2004. Uniform crime reporting handbook.
- Federal Bureau of Investigation (2009a) United States Department of Justice Federal Bureau of Investigation. 2009a. National Incident-Based Reporting System, 2007. (2009). https://doi.org/10.3886/ICPSR25113.v1
- Federal Bureau of Investigation (2009b) United States Department of Justice Federal Bureau of Investigation. 2009b. Uniform Crime Reporting Program Data United States: Police Employee (LEOKA) Data, 2007. (2009). https://doi.org/10.3886/ICPSR25104.v1
- Federal Bureau of Investigation (2010a) United States Department of Justice Federal Bureau of Investigation. 2010a. National Incident-Based Reporting System, 2008. (2010). https://doi.org/10.3886/ICPSR27647.v1
- Federal Bureau of Investigation (2010b) United States Department of Justice Federal Bureau of Investigation. 2010b. Uniform Crime Reporting Program Data United States: Police Employee (LEOKA) Data, 2008. (2010). https://doi.org/10.3886/ICPSR27646.v1
- Federal Bureau of Investigation (2011a) United States Department of Justice Federal Bureau of Investigation. 2011a. Uniform Crime Reporting: National Incident-Based Reporting System, 2009. (2011). https://doi.org/10.3886/ICPSR30770.v1
- Federal Bureau of Investigation (2011b) United States Department of Justice Federal Bureau of Investigation. 2011b. Uniform Crime Reporting Program Data United States: Police Employee (LEOKA) Data, 2009. (2011). https://doi.org/10.3886/ICPSR30765.v1
- Federal Bureau of Investigation (2012a) United States Department of Justice Federal Bureau of Investigation. 2012a. Uniform Crime Reporting: National Incident-Based Reporting System, 2010. (2012). https://doi.org/10.3886/ICPSR33530.v1
- Federal Bureau of Investigation (2012b) United States Department of Justice Federal Bureau of Investigation. 2012b. Uniform Crime Reporting Program Data: Police Employee (LEOKA) Data, 2010. (2012). https://doi.org/10.3886/ICPSR33525.v1
- Federal Bureau of Investigation (2013a) United States Department of Justice Federal Bureau of Investigation. 2013a. Uniform Crime Reporting Program Data: National Incident-Based Reporting System, 2011. (2013). https://doi.org/10.3886/ICPSR34585.v1
- Federal Bureau of Investigation (2013b) United States Department of Justice Federal Bureau of Investigation. 2013b. Uniform Crime Reporting Program Data: Police Employee (LEOKA) Data, 2011. (2013). https://doi.org/10.3886/ICPSR34584.v1
- Federal Bureau of Investigation (2014a) United States Department of Justice Federal Bureau of Investigation. 2014a. Uniform Crime Reporting Program Data: National Incident-Based Reporting System, 2012. (2014). https://doi.org/10.3886/ICPSR35035.v1
- Federal Bureau of Investigation (2014b) United States Department of Justice Federal Bureau of Investigation. 2014b. Uniform Crime Reporting Program Data: Police Employee (LEOKA) Data, 2012. (2014). https://doi.org/10.3886/ICPSR35020.v1
- Federal Bureau of Investigation (2015a) United States Department of Justice Federal Bureau of Investigation. 2015a. Uniform Crime Reporting Program Data: National Incident-Based Reporting System, 2013. (2015). https://doi.org/10.3886/ICPSR36120.v2
- Federal Bureau of Investigation (2015b) United States Department of Justice Federal Bureau of Investigation. 2015b. Uniform Crime Reporting Program Data: Police Employee (LEOKA) Data, 2013. (2015). https://doi.org/10.3886/ICPSR36119.v1
- Federal Bureau of Investigation (2016a) United States Department of Justice Federal Bureau of Investigation. 2016a. Uniform Crime Reporting Program Data: National Incident-Based Reporting System, 2014. (2016). https://doi.org/10.3886/ICPSR36398.v1
- Federal Bureau of Investigation (2016b) United States Department of Justice Federal Bureau of Investigation. 2016b. Uniform Crime Reporting Program Data: Police Employee (LEOKA) Data, 2014. (2016). https://doi.org/10.3886/ICPSR36395.v1
- Federal Bureau of Investigation (2017a) United States Department of Justice Federal Bureau of Investigation. 2017a. Uniform Crime Reporting Program Data: National Incident-Based Reporting System, 2015. (2017). https://doi.org/10.3886/ICPSR36795.v1
- Federal Bureau of Investigation (2017b) United States Department of Justice Federal Bureau of Investigation. 2017b. Uniform Crime Reporting Program Data: Police Employee (LEOKA) Data, 2015. (2017). https://doi.org/10.3886/ICPSR36791.v1
- Federal Bureau of Investigation (2018a) United States Department of Justice Federal Bureau of Investigation. 2018a. Uniform Crime Reporting Program Data: National Incident-Based Reporting System, United States, 2016. (2018). https://doi.org/10.3886/ICPSR37065.v2
- Federal Bureau of Investigation (2018b) United States Department of Justice Federal Bureau of Investigation. 2018b. Uniform Crime Reporting Program Data: Police Employee (LEOKA) Data, United States, 2016. (2018). https://doi.org/10.3886/ICPSR37062.v1
- Felson and Lantz (2016) Richard B Felson and Brendan Lantz. 2016. When are victims unlikely to cooperate with the police? Aggressive behavior 42, 1 (2016), 97–108.
- Fitzmaurice et al. (2008) Garrett Fitzmaurice, Marie Davidian, Geert Verbeke, and Geert Molenberghs. 2008. Longitudinal data analysis. CRC press.
- Flores et al. (2016) Anthony W Flores, Kristin Bechtel, and Christopher T Lowenkamp. 2016. False Positives, False Negatives, and False Analyses: A Rejoinder to “Machine Bias: There’s Software Used Across the Country to Predict Future Criminals. And it’s Biased Against Blacks.”. Unpublished manuscript (2016).
- Fogliato et al. (2020) Riccardo Fogliato, Max G’Sell, and Alexandra Chouldechova. 2020. Fairness Evaluation in Presence of Biased Noisy Labels. arXiv preprint arXiv:2003.13808 (2020).
- Freedman (2006) David A Freedman. 2006. On the so-called “Huber sandwich estimator” and “robust standard errors”. The American Statistician 60, 4 (2006), 299–302.
- Goel et al. (2016) Sharad Goel, Justin M Rao, Ravi Shroff, et al. 2016. Precinct or prejudice? Understanding racial disparities in New York City’s stop-and-frisk policy. The Annals of Applied Statistics 10, 1 (2016), 365–394.
- Goel et al. (2018) Sharad Goel, Ravi Shroff, Jennifer L Skeem, and Christopher Slobogin. 2018. The accuracy, equity, and jurisprudence of criminal risk assessment. Equity, and Jurisprudence of Criminal Risk Assessment (December 26, 2018) (2018).
- Green (2020) Ben Green. 2020. The false promise of risk assessments: epistemic reform and the limits of fairness. In Proceedings of the 2020 Conference on Fairness, Accountability, and Transparency. 594–606.
- Greenblatt et al. (2018) Mark Greenblatt, Mark Fahey, Bernice Yeung, and Emily Harris. 2018. FBI Moves to Fix Critical Flaw in Its Crime Reporting System. (2018). https://www.propublica.org/article/fbi-moves-to-fix-critical-flaw-in-its-crime-reporting-system.
- Hardt et al. (2016) Moritz Hardt, Eric Price, and Nathan Srebro. 2016. Equality of opportunity in supervised learning. arXiv preprint arXiv:1610.02413 (2016).
- Hester and Wickham (2020) Jim Hester and Hadley Wickham. 2020. vroom: Read and Write Rectangular Text Data Quickly. https://CRAN.R-project.org/package=vroom R package version 1.3.2.
- Hindelang (1978) Michael J Hindelang. 1978. Race and involvement in common law personal crimes. American sociological review (1978), 93–109.
- Hirschel et al. (2007) David Hirschel, Eve Buzawa, April Pattavina, and Don Faggiani. 2007. Domestic violence and mandatory arrest laws: To what extent do they influence police arrest decisions. J. Crim. L. & Criminology 98 (2007), 255.
- Ho and Xiang (2020) Daniel E Ho and Alice Xiang. 2020. Affirmative Algorithms: The Legal Grounds for Fairness as Awareness. arXiv preprint arXiv:2012.14285 (2020).
- Huling (2019) Jared Huling. 2019. fastglm: Fast and Stable Fitting of Generalized Linear Models using ’RcppEigen’. https://CRAN.R-project.org/package=fastglm R package version 0.0.1.
- Johndrow et al. (2019) James E Johndrow, Kristian Lum, et al. 2019. An algorithm for removing sensitive information: application to race-independent recidivism prediction. The Annals of Applied Statistics 13, 1 (2019), 189–220.
- Kane (2002) Robert J Kane. 2002. The social ecology of police misconduct. Criminology 40, 4 (2002), 867–896.
- Kane (2005) Robert J Kane. 2005. Compromised police legitimacy as a predictor of violent crime in structurally disadvantaged communities. Criminology 43, 2 (2005), 469–498.
- Kaplan (2020) Jacob Kaplan. 2020. asciiSetupReader: Reads Fixed-Width ASCII Data Files (.txt or .dat) that Have Accompanying Setup Files (.sps or .sas). https://CRAN.R-project.org/package=asciiSetupReader R package version 2.3.2.
- Kent and Jacobs (2005) Stephanie L Kent and David Jacobs. 2005. Minority threat and police strength from 1980 to 2000: A fixed-effects analysis of nonlinear and interactive effects in large US cities. Criminology 43, 3 (2005), 731–760.
- Kirk and Matsuda (2011) David S Kirk and Mauri Matsuda. 2011. Legal cynicism, collective efficacy, and the ecology of arrest. Criminology 49, 2 (2011), 443–472.
- Kleinberg et al. (2018) Jon Kleinberg, Himabindu Lakkaraju, Jure Leskovec, Jens Ludwig, and Sendhil Mullainathan. 2018. Human decisions and machine predictions. The quarterly journal of economics 133, 1 (2018), 237–293.
- Kleinberg et al. (2016) Jon Kleinberg, Sendhil Mullainathan, and Manish Raghavan. 2016. Inherent trade-offs in the fair determination of risk scores. arXiv preprint arXiv:1609.05807 (2016).
- Klinger (1997) David A Klinger. 1997. Negotiating order in patrol work: An ecological theory of police response to deviance. Criminology 35, 2 (1997), 277–306.
- Kochel et al. (2011) Tammy Rinehart Kochel, David B Wilson, and Stephen D Mastrofski. 2011. Effect of suspect race on officers’ arrest decisions. Criminology 49, 2 (2011), 473–512.
- Kubrin and Weitzer (2003) Charis E Kubrin and Ronald Weitzer. 2003. Retaliatory homicide: Concentrated disadvantage and neighborhood culture. Social problems 50, 2 (2003), 157–180.
- Lantz and Wenger (2019) Brendan Lantz and Marin R Wenger. 2019. The co-offender as counterfactual: A quasi-experimental within-partnership approach to the examination of the relationship between race and arrest. Journal of experimental criminology (2019), 1–24.
- Liska and Chamlin (1984) Allen E Liska and Mitchell B Chamlin. 1984. Social structure and crime control among macrosocial units. American journal of sociology 90, 2 (1984), 383–395.
- Liska et al. (1985) Allen E Liska, Mitchell B Chamlin, and Mark D Reed. 1985. Testing the economic production and conflict models of crime control. Social Forces 64, 1 (1985), 119–138.
- Loeffler et al. (2019) Charles E Loeffler, Jordan Hyatt, and Greg Ridgeway. 2019. Measuring self-reported wrongful convictions among prisoners. Journal of Quantitative Criminology 35, 2 (2019), 259–286.
- Lum and Isaac (2016) Kristian Lum and William Isaac. 2016. To predict and serve? Significance 13, 5 (2016), 14–19.
- Lytle (2014) Daniel J Lytle. 2014. The effects of suspect characteristics on arrest: A meta-analysis. Journal of Criminal Justice 42, 6 (2014), 589–597.
- McCormack et al. (2017) Philip D McCormack, April Pattavina, and Paul E Tracy. 2017. Assessing the coverage and representativeness of the National Incident-Based Reporting System. Crime & Delinquency 63, 4 (2017), 493–516.
- Messing and Thaller (2013) Jill Theresa Messing and Jonel Thaller. 2013. The average predictive validity of intimate partner violence risk assessment instruments. Journal of interpersonal violence 28, 7 (2013), 1537–1558.
- Metz and Satariano (2020) Cade Metz and Adam Satariano. 2020. An algorithm that grants freedom, or takes it away. The New York Times (2020).
- Morgan and Truman (2019) Rachel E Morgan and Jennifer L Truman. 2019. Criminal victimization, 2019. Bureau of Justice Statistics 845 (2019).
- Mullainathan (2019) Sendhil Mullainathan. 2019. Biased algorithms are easier to fix than biased people. The New York Times (2019).
- Müller (2020) Kirill Müller. 2020. here: A Simpler Way to Find Your Files. https://CRAN.R-project.org/package=here R package version 1.0.1.
- of Justice. Federal Bureau of Investigation (FBI) (2019) United States Department of Justice. Federal Bureau of Investigation (FBI). 2019. 2019 National Incident-Based Reporting System User Manual. https://ucr.fbi.gov/nibrs/nibrs-user-manual
- Ousey and Lee (2008) Graham C Ousey and Matthew R Lee. 2008. Racial disparity in formal social control: An investigation of alternative explanations of arrest rate inequality. Journal of Research in Crime and Delinquency 45, 3 (2008), 322–355.
- Parker et al. (2005) Karen F Parker, Brian J Stults, and Stephen K Rice. 2005. Racial threat, concentrated disadvantage and social control: Considering the macro-level sources of variation in arrests. Criminology 43, 4 (2005), 1111–1134.
- Pattavina et al. (2017) April Pattavina, Danielle Marie Carkin, and Paul E Tracy. 2017. Assessing the representativeness of NIBRS arrest data. Crime & Delinquency 63, 12 (2017), 1626–1652.
- Pierson et al. (2020) Emma Pierson, Camelia Simoiu, Jan Overgoor, Sam Corbett-Davies, Daniel Jenson, Amy Shoemaker, Vignesh Ramachandran, Phoebe Barghouty, Cheryl Phillips, Ravi Shroff, et al. 2020. A large-scale analysis of racial disparities in police stops across the United States. Nature human behaviour (2020), 1–10.
- Piquero and Blumstein (2007) Alex R Piquero and Alfred Blumstein. 2007. Does incapacitation reduce crime? Journal of Quantitative Criminology 23, 4 (2007), 267–285.
- Pope and Snyder (2003) Carl E Pope and Howard N Snyder. 2003. Race as a factor in juvenile arrests. US Department of Justice, Office of Justice Programs, Office of Juvenile ….
- Puckett and Lundman (2003) Janice L Puckett and Richard J Lundman. 2003. Factors affecting homicide clearances: Multivariate analysis of a more complete conceptual framework. Journal of Research in Crime and Delinquency 40, 2 (2003), 171–193.
- Richardson et al. (2019) Rashida Richardson, Jason Schultz, and Kate Crawford. 2019. Dirty data, bad predictions: How civil rights violations impact police data, predictive policing systems, and justice. New York University Law Review Online, Forthcoming (2019).
- Roberts and Lyons (2009) Aki Roberts and Christopher J Lyons. 2009. Victim-offender racial dyads and clearance of lethal and nonlethal assault. Journal of research in crime and delinquency 46, 3 (2009), 301–326.
- Roberts and Roberts (2016) Aki Roberts and John M Roberts. 2016. Crime clearance and temporal variation in police investigative workload: Evidence from National Incident-Based Reporting System (NIBRS) data. Journal of Quantitative Criminology 32, 4 (2016), 651–674.
- Rubin (1976) Donald B Rubin. 1976. Inference and missing data. Biometrika 63, 3 (1976), 581–592.
- Rubin (2004) Donald B Rubin. 2004. Multiple imputation for nonresponse in surveys. Vol. 81. John Wiley & Sons.
- Skeem and Lowenkamp (2016) Jennifer L Skeem and Christopher T Lowenkamp. 2016. Risk, race, and recidivism: Predictive bias and disparate impact. Criminology 54, 4 (2016), 680–712.
- Solt and Gracey (2020) Frederick Solt and Kellen Gracey. 2020. icpsrdata: Reproducible Data Retrieval from the ICPSR Archive. https://CRAN.R-project.org/package=icpsrdata R package version 0.5.0.
- Stark (1987) Rodney Stark. 1987. Deviant places: A theory of the ecology of crime. Criminology 25, 4 (1987), 893–910.
- Steffensmeier et al. (2011) Darrell Steffensmeier, Ben Feldmeyer, Casey T Harris, and Jeffery T Ulmer. 2011. Reassessing trends in black violent crime, 1980–2008: Sorting out the “Hispanic effect” in Uniform Crime Reports arrests, National Crime Victimization Survey offender estimates, and US prisoner counts. Criminology 49, 1 (2011), 197–251.
- Stolzenberg et al. (2004) Lisa Stolzenberg, Stewart J D’Alessio, and David Eitle. 2004. A multilevel test of racial threat theory. Criminology 42, 3 (2004), 673–698.
- Stults and Baumer (2007) Brian J Stults and Eric P Baumer. 2007. Racial context and police force size: Evaluating the empirical validity of the minority threat perspective. Amer. J. Sociology 113, 2 (2007), 507–546.
- Sunshine and Tyler (2003) Jason Sunshine and Tom R Tyler. 2003. The role of procedural justice and legitimacy in shaping public support for policing. Law & society review 37, 3 (2003), 513–548.
- Team et al. (2013) R Core Team et al. 2013. R: A language and environment for statistical computing. (2013).
- Terrill and Reisig (2003) William Terrill and Michael D Reisig. 2003. Neighborhood context and police use of force. Journal of research in crime and delinquency 40, 3 (2003), 291–321.
- Tonry (1995) Michael Tonry. 1995. Malign neglect: Race, crime, and punishment in America. Oxford University Press.
- Tyler and Fagan (2008) Tom R Tyler and Jeffrey Fagan. 2008. Legitimacy and cooperation: Why do people help the police fight crime in their communities. Ohio St. J. Crim. L. 6 (2008), 231.
- Tyler et al. (2014) Tom R Tyler, Jeffrey Fagan, and Amanda Geller. 2014. Street stops and police legitimacy: Teachable moments in young urban men’s legal socialization. Journal of empirical legal studies 11, 4 (2014), 751–785.
- Ushey (2021) Kevin Ushey. 2021. renv: Project Environments. https://CRAN.R-project.org/package=renv R package version 0.12.5.
- van Buuren and Groothuis-Oudshoorn (2011) Stef van Buuren and Karin Groothuis-Oudshoorn. 2011. mice: Multivariate Imputation by Chained Equations in R. Journal of Statistical Software 45, 3 (2011), 1–67. https://www.jstatsoft.org/v45/i03/
- VanderWeele and Robinson (2014) Tyler J VanderWeele and Whitney R Robinson. 2014. On causal interpretation of race in regressions adjusting for confounding and mediating variables. Epidemiology (Cambridge, Mass.) 25, 4 (2014), 473.
- Vaughan and Dancho (2021) Davis Vaughan and Matt Dancho. 2021. furrr: Apply Mapping Functions in Parallel using Futures. https://CRAN.R-project.org/package=furrr R package version 0.2.2.
- Walsh (2004) Anthony Walsh. 2004. Race and crime: A biosocial analysis. Nova Publishers.
- Weitzer and Brunson (2015) Ronald Weitzer and Rod K Brunson. 2015. Policing different racial groups in the United States. Cahiers Politiestudies 6, 35 (2015), 129.
- Weitzer and Tuch (1999) Ronald Weitzer and Steven A Tuch. 1999. Race, class, and perceptions of discrimination by the police. Crime & Delinquency 45, 4 (1999), 494–507.
- Weitzer and Tuch (2004) Ronald Weitzer and Steven A Tuch. 2004. Race and perceptions of police misconduct. Social problems 51, 3 (2004), 305–325.
- Wickham et al. (2019) Hadley Wickham, Mara Averick, Jennifer Bryan, Winston Chang, Lucy D’Agostino McGowan, Romain Francois, Garrett Grolemund, Alex Hayes, Lionel Henry, Jim Hester, Max Kuhn, Thomas Lin Pedersen, Evan Miller, Stephan Milton Bache, Kirill Müller, Jeroen Ooms, David Robinson, Dana Paige Seidel, Vitalie Spinu, Kohske Takahashi, Davis Vaughan, Claus Wilke, Kara Woo, and Hiroaki Yutani. 2019. Welcome to the tidyverse. Journal of Open Source Software 4, 43 (2019), 1686. https://doi.org/10.21105/joss.01686
- Wickham and Miller (2020) Hadley Wickham and Evan Miller. 2020. haven: Import and Export ’SPSS’, ’Stata’ and ’SAS’ Files. https://CRAN.R-project.org/package=haven R package version 2.3.1.
- Wilson (1978) James Q Wilson. 1978. Varieties of police behavior: The Management of law and Order in eight communities, with a new preface by the author. Harvard University Press.
- Xie and Lauritsen (2012) Min Xie and Janet L Lauritsen. 2012. Racial context and crime reporting: A test of Black’s stratification hypothesis. Journal of quantitative criminology 28, 2 (2012), 265–293.
- Xie (2015) Yihui Xie. 2015. Dynamic Documents with R and knitr (2nd ed.). Chapman and Hall/CRC, Boca Raton, Florida. https://yihui.org/knitr/ ISBN 978-1498716963.
- Zeileis et al. (2020) Achim Zeileis, Susanne Köll, and Nathaniel Graham. 2020. Various versatile variances: An object-oriented implementation of clustered covariances in R. Journal of Statistical Software 95, 1 (2020), 1–36.
- Zhu (2020) Hao Zhu. 2020. kableExtra: Construct Complex Table with ’kable’ and Pipe Syntax. https://CRAN.R-project.org/package=kableExtra R package version 1.3.1.
Appendix A Additional details on data analysis
Clearance by arrest and by exceptional means
Incidents can be cleared either by an arrest or by exceptional means. An offense is cleared by arrest when at least one person is arrested, charged with the commission of the offense, and turned over to the court for prosecution (Federal Bureau of Investigation, 2004). In case of individuals below the age of 18, physical arrest is not necessary. The arrest of multiple offenders may correspond to the clearance of one offense, and many offenses may be cleared by only one arrest. An offense is cleared by exceptional means if the following conditions are satisfied: (i) the investigation has established the identity of the offender; (ii) there is enough information to support an arrest, charge, and turn over the offender to the court for prosecution; (iii) the exact location of the offender is known and the offender could be taken into custody; (iv) there is some reason outside of law enforcement control that precludes arresting, charging, and prosecuting the offender. Clearance by exceptional means occurs in case of death of the offender, denied prosecution, custody of other jurisdiction, refusal of the victim to cooperate, when the offender is a juvenile and thus they are not taken into custody.
We investigate whether there exist differences in the likelihood of clearance by exceptiona means and reasons behind the clearance across racial groups of offenders and victims. The type of offense with the largest share of incidents that are cleared by exceptional means is forcible rape (about 20%). Slightly more than 10% of these incidents are cleared because of prosecutorial declination to prosecute and another 8% due to lack of victim’s cooperation. In case of murder/non-negligent manslaughter, 5% and 14% of all incidents are cleared by exceptional means for Black and White offenders. The majority of these offenses results into the death of the offender. Clearance by exceptional means in offenses of robbery (8%), aggravated assaults (9%), and simple assaults (14%) is mainly due to prosecutorial declination to prosecute and victims’ lack of cooperation, the latter likely being due to cases of domestic violence. Incidents are cleared at the same rates across the two racial groups for all crime types other than murder/non-negligent manslaughter. An analogous analysis of the likelihood of exceptional clearance conditioning on the racial groups of the victims reveals similar results.
Additional results for §6.
Figure 2 shows the arrest rates by state and offender’s race. The coefficients estimates of the logistic regression model are presented in Table 2. Lastly, Figure 3 displays the focal slope model diagnostics. More details regarding these figures are contained in the captions and in the main body of the paper.
Software
In our analysis, we used the following R packages. For data processing and visualization, we used the tidyverse set of packages (Wickham et al., 2019). Specifically for the statistical modeling, we used fastglm (Huling, 2019), lme4 (Bates et al., 2015), mice (van Buuren and Groothuis-Oudshoorn, 2011), sandwich (Zeileis et al., 2020). In addition, we used icpsrdata (Solt and Gracey, 2020), asciiSetupReader (Kaplan, 2020), vroom (Hester and Wickham, 2020), haven (Wickham and Miller, 2020), renv (Ushey, 2021), knitr (Xie, 2015), kableExtra (Zhu, 2020), xtable (Dahl et al., 2019), cli (Csárdi, 2021), here (Müller, 2020), furrr (Vaughan and Dancho, 2021).
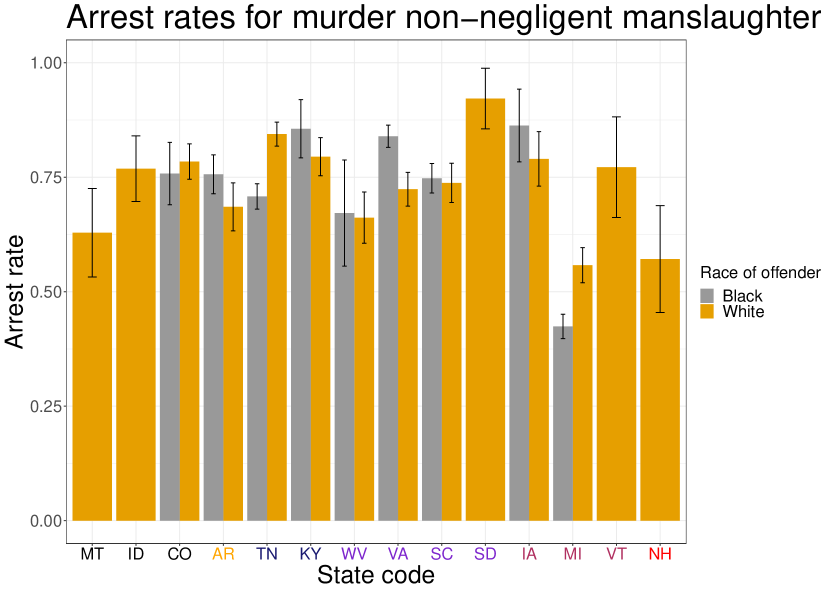
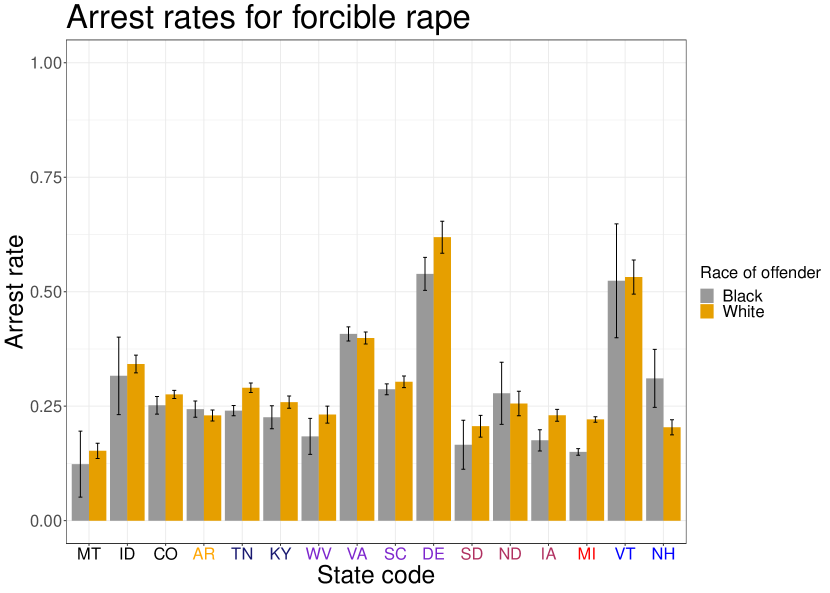
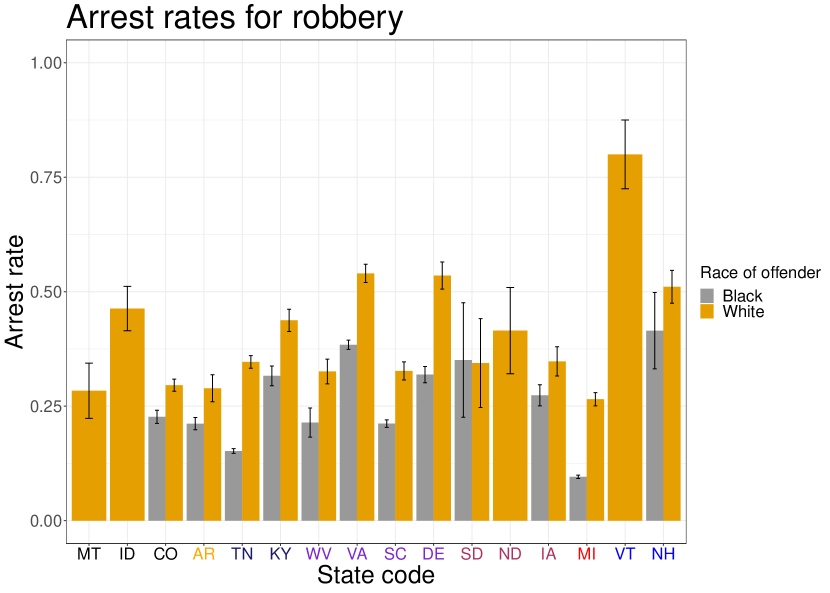

| Variable | Murder/n.n.m. | Forcible rape | Robbery | Aggravated assault | Simple assault | |||||
|---|---|---|---|---|---|---|---|---|---|---|
| Race of offender | Black | White | Black | White | Black | White | Black | White | Black | White |
| # observations | 4787 | 4394 | 32532 | 70777 | 76566 | 24567 | 275697 | 320627 | 1045225 | 1624174 |
| % observations | 52% | 48% | 31% | 69% | 76% | 24% | 46% | 54% | 39% | 61% |
| % intraracial crime | 86% | 94% | 63% | 97% | 57% | 91% | 81% | 94% | 78% | 96% |
| % arrests | 67% | 73% | 25% | 27% | 19% | 36% | 44% | 62% | 43% | 57% |
| % arrests (intraracial) | 66% | 73% | 27% | 27% | 17% | 37% | 43% | 62% | 42% | 58% |
| % arrests (interracial) | 71% | 71% | 22% | 23% | 21% | 30% | 51% | 51% | 49% | 47% |
Notes: “# observations” and “% observations” indicate the number of observation and the ratio between the number of offender of a certain race and the total number of offenders for that crime respectively in each bucket (e.g., Black simple assault offenders). “% intraracial crime” corresponds to the share of victims whose race is the same as the offender’s race, i.e., intraracial crime. “% arrests”, “% arrests (intraracial)”, “% arrests (interracial)” indicate the arrest rates for all offenses, only intraracial offenses, and only interracial offenses (conditioning on the offender’s race) respectively.
| Variable | Murder/n.n.m. | Forcible rape | Robbery | Aggravated assault | Simple assault |
|---|---|---|---|---|---|
| Age of offender | -0.01 (0.00)*** | 0.01 (0.00)*** | 0.01 (0.00)*** | 0.00 (0.00)*** | -0.01 (0.00)*** |
| Offender male | -0.18 (0.09)* | 2.74 (1.02)** | -0.11 (0.03)** | -0.11 (0.01)*** | 0.01 (0.00)*** |
| Offender white | -0.20 (0.09)* | 0.04 (0.02). | 0.24 (0.02)*** | 0.03 (0.01)*** | 0.04 (0.00)*** |
| Age of victim | 0.00 (0.00) | -0.02 (0.00)*** | 0.00 (0.00) | 0.01 (0.00)*** | 0.01 (0.00)*** |
| Victim male | 0.20 (0.06)*** | 2.64 (1.02)** | -0.10 (0.02)*** | -0.12 (0.01)*** | -0.14 (0.00)*** |
| Victim white | -0.02 (0.08) | -0.11 (0.03)*** | 0.03 (0.02) | 0.07 (0.01)*** | 0.09 (0.00)*** |
| Minor injury | -0.31 (0.02)*** | 0.01 (0.02) | -0.24 (0.01)*** | -0.50 (0.00)*** | |
| Serious injury | 0.32 (0.03)*** | 0.16 (0.03)*** | 0.25 (0.01)*** | 0.83 (0.38)* | |
| During day | -0.01 (0.05) | -0.10 (0.02)*** | 0.31 (0.02)*** | -0.02 (0.01)*** | -0.11 (0.00)*** |
| Offender stranger | -0.48 (0.06)*** | -0.66 (0.02)*** | -0.81 (0.02)*** | -0.53 (0.01)*** | -0.32 (0.00)*** |
| Residence | 0.18 (0.05)*** | 0.20 (0.02)*** | -0.08 (0.02)*** | 0.32 (0.01)*** | 0.30 (0.00)*** |
| Offender alcohol use | 0.63 (0.11)*** | 0.01 (0.02) | 0.69 (0.04)*** | 0.56 (0.01)*** | 0.56 (0.00)*** |
| Offender substance use | 0.02 (0.14) | -0.36 (0.04)*** | 0.22 (0.06)*** | -0.02 (0.02) | 0.09 (0.01)*** |
| Firearm present | -0.58 (0.08)*** | -0.16 (0.07)* | -0.27 (0.02)*** | -0.24 (0.01)*** | |
| Other weapon present | 0.14 (0.09) | 0.15 (0.05)** | -0.02 (0.03) | 0.09 (0.01)*** | |
| Offense not completed | 0.16 (0.03)*** | 0.11 (0.02)*** | |||
| # Officers per 1000 capita (ORI) | 0.00 (0.00) | 0.01 (0.00)*** | 0.00 (0.00) | 0.00 (0.00)*** | 0.00 (0.00) |
| % black offenders (ORI) | -0.20 (0.16) | -0.43 (0.05)*** | -0.66 (0.05)*** | -0.99 (0.02)*** | -0.97 (0.01)*** |
| Population served (ORI) | 0.00 (0.00)*** | 0.00 (0.00)* | 0.00 (0.00)*** | 0.00 (0.00)*** | 0.00 (0.00)*** |
| Core city | 0.26 (0.07)*** | -0.21 (0.02)*** | -0.12 (0.02)*** | -0.02 (0.01)* | 0.04 (0.00)*** |
Significance codes: pvalue¡0.001 ‘***’,
‘**’, ‘*’, ‘.’
Notes: As a reminder, we only consider incidents involving lone victims and
offenders of race Black or White (Hispanics are included), that occurred in the 16 states considered in the
analysis between 2007 and 2016, and were not
cleared by exceptional means. Coefficients estimates of dummies for states and years are omitted from the table.
For a discussion of the estimates, see
§6.2.